expanding production and reducing...
TRANSCRIPT
Expanding Production and Reducing Costs

2
Disclaimer
SAFE HARBOR: Some statements contained in this presentation are forward-looking statements or forward-looking information (collectively, “forward-looking statements”) within themeaning of the United States Private Securities Litigation Reform Act of 1995 and applicable Canadian securities laws. Investors are cautioned that forward-looking statements areinherently uncertain and involve risks and uncertainties that could cause actual results to differ materially. Such statements include comments regarding: the expansion of production andreduction of costs at Golden Star’s projects; the exploration upside of the Company’s projects and ability of the Company to increase mine lives and Mineral Resources and MineralReserves; the ability of the Company to transform into a high grade, low cost gold producer; the impact of Wassa Underground and Prestea Underground on the Company’s productionprofile, cost profile, cash operating cost per ounce and AISC per ounce; the timing for commercial production at Wassa Underground and Prestea Underground; the timing for mining firstlongitudinal stopes and first transverse stopes at B Shoot of Wassa Underground; the achievement of full production rate at Wassa Underground and life of mine average production; theachievement of 2017 production; production, cash operating cost and capital expenditure guidance for 2017; ore grade, production and capital expenditures at Mampon; the timing forcommencing mining and production at Mampon; the timing for mobilizing the underground mining contractor, pre-development of Mineral Resources, blasting of the first stope andcommencing commercial production at Prestea Underground; the ability to expand Mineral Reserves and extend the life of mine at Prestea Underground and Wassa Underground throughexploration; the timing for releasing the Company’s exploration strategy; the ability to convert Mineral Resources into Mineral Reserves; the timing for incurring 2017 capital expenditures;and the potential for growth of Golden Star’s share price. Factors that could cause actual results to differ materially include timing of and unexpected events at the Bogoso/Prestea and/orthe Wassa processing plants; variations in ore grade, tonnes mined, crushed or milled; delay or failure to receive board or government approvals and permits; construction delays; theavailability and cost of electrical power; timing and availability of external financing on acceptable terms or at all; technical, permitting, mining or processing issues, including difficulties inestablishing the infrastructure for Wassa Underground or Prestea Underground, inconsistent power supplies, plant and/or equipment failures and an inability to obtain supplies andmaterials on reasonable terms (including pricing) or at all; changes in U.S. and Canadian securities markets; heavy rainfall and flooding of underground mines; and fluctuations in goldprice and input costs and general economic conditions. There can be no assurance that future developments affecting the Company will be those anticipated by management. Please referto the discussion of these and other factors in our Annual Information Form for the year ended December 31, 2015 filed on SEDAR at www.sedar.com. The forecasts contained in thispresentation constitute management's current estimates, as of the date of this presentation, with respect to the matters covered thereby. We expect that these estimates will change asnew information is received and that actual results will vary from these estimates, possibly by material amounts. While we may elect to update these estimates at any time, we do notundertake to update any estimate at any particular time or in response to any particular event. Investors and others should not assume that any forecasts in this presentation representmanagement's estimate as of any date other than the date of this presentation.
NON-GAAP FINANCIAL MEASURES: In this presentation, we use the terms “cash operating cost per ounce”, “all-in sustaining cost per ounce”, “AISC per ounce”, “Adjusted Net Loss”,“Adjusted Net Loss/Share”, “Cash operating margin per ounce” and “Cash Flow from/(used in) operations”. These terms should be considered as Non-GAAP Financial Measures as definedin applicable Canadian and United States securities laws and should not be considered in isolation or as a substitute for measures of performance prepared in accordance with InternationalFinancial Reporting Standards (“IFRS”). “Cash operating cost per ounce” for a period is equal to the cost of sales excluding depreciation and amortization for the period less royalties, thecash component of metals inventory net realizable value adjustments and severance charges divided by the number of ounces of gold sold during the period. “All-in sustaining costs perounce” commences with cash operating costs and then adds sustaining capital expenditures, corporate general and administrative costs, mine site exploratory drilling and greenfieldevaluation costs and environmental rehabilitation costs, divided by the number of ounces of gold sold during the period. This measure seeks to represent the total costs of producing goldfrom operations. These measures are not representative of all cash expenditures as they do not include income tax payments or interest costs. In order to indicate to stakeholders theCompany's earnings excluding the non-cash (gain)/loss on the fair value of debentures, non-cash impairment charges and severance charges, the Company calculates “Adjusted NetEarnings/(Loss)” and “Adjusted Net Earnings/Loss) per share” to supplement the condensed interim consolidated financial statements. “Cash operating margin per ounce” is calaculated asgold price minus cash operating cost per ounce. “Cash flow from/(used in) operations” is calculated by subtracting the "Changes in working capital" from "Net cash provided by operatingactivities" as found in the statements of cash flows. These measures are not necessarily indicative of operating profit or cash flow from operations as would be determined under IFRS.Changes in numerous factors including, but not limited to, mining rates, milling rates, gold grade, gold recovery, and the costs of labor, consumables and mine site general andadministrative activities can cause these measures to increase or decrease. We believe that these measures are the same or similar to the measures of other gold mining companies, butmay not be comparable to similarly titled measures in every instance. Please see our “Management’s Discussion and Analysis of Financial Condition and Results of Operations for the yearended December 31, 2016” for a reconciliation of these Non-GAAP measures to the nearest IFRS measure.
INFORMATION: The information contained in this presentation has been obtained by Golden Star from its own records and from other sources deemed reliable, however norepresentation or warranty is made as to its accuracy or completeness. The technical information relating to Golden Star's material properties disclosed herein is based upon technicalreports prepared and filed pursuant to National Instrument 43-101 - Standards of Disclosure for Mineral Projects ("NI 43-101") and other publicly available information regarding theCompany, including the following: (i) “NI 43-101 Technical Report on a Feasibility Study of the Wassa Open Pit Mine and Underground Project in Ghana” effective December 31, 2014; (ii)“NI 43-101 Technical Report on Resources and Reserves, Golden Star Resources Ltd., Bogoso Prestea Gold Mine, Ghana” effective December 31, 2013, and (iii) “NI 43-101 TechnicalReport on a Feasibility Study of the Prestea Underground gold project in Ghana” effective November 5, 2015. Additional information is included in Golden Star's Annual Information Formfor the year ended December 31, 2015 which is filed on SEDAR. Mineral Reserves were prepared under the supervision of Dr. Martin Raffield, Senior Vice President Technical Services forthe Company. Dr. Raffield is a "Qualified Person" as defined by NI 43-101. The Qualified Person reviewing and validating the estimation of the Mineral Resources is S. Mitchel Wasel,Golden Star Resources Vice President of Exploration.
CURRENCY: All monetary amounts refer to United States dollars unless otherwise indicated.
NYSE: GSSTSX: GSC
3
Management Participants
Sam CoetzerPresident and Chief Executive Officer
André van NiekerkExecutive Vice President and Chief Financial Officer
Katharine SuttonDirector, Investor Relations & Corporate Affairs
NYSE: GSSTSX: GSC

4
Why Invest In Golden Star?
• West African-focused, mid-tier
gold producer with two
producing mines in Ghana
• High grade development asset,
Prestea Underground (Mineral
Reserves averaging 14.02g/t) -
production is expected to expand
and costs to continue to reduce
• Strong exploration upside
potential - focused on increasing
the mine lives of current
operations
• Experienced management team
with a track record of discovery
and project delivery
• Undervalued compared to peer
group and with robust liquidity
through NYSE MKT listing
Transforming into a high grade, non-refractory, low
cost gold producer
GHANA
NYSE: GSSTSX: GSC

5
2016 Guidance Achieved on All Metrics
NYSE: GSSTSX: GSC
0
10,000
20,000
30,000
40,000
50,000
Q1 16 Q2 16 Q3 16 Q4 16
Pro
duction o
z
Quarters
2016 Quarterly Gold Production
Wassa Main Pit Prestea Open Pits Wassa Underground
• Gold production of 194,054oz in 2016
• 2016 gold production by asset:• Wassa Main Pit: 93,319oz• Wassa Underground: 11,062oz• Prestea Open Pits: 89,673oz
• Gold production of 53,403oz in Q4 2016– strongest quarterly performance of2016
• Wassa Underground’s mining ratesaccelerated strongly during Q4 – 257%increase in production compared to Q3
• Second consecutive record quarter ofproduction for Prestea Open Pits
• Cash of $21.8m as at December 31,20161
2016 Production in the Top Half of the Guidance Range
1. Does not include $10m advance payment from RGLD received under the streaming agreement on January 3, 2017

6
Cash Operating Costs Expected to Continue to Reduce
Significant change in Golden Star’s cost structure following cessation of refractory production
NYSE: GSSTSX: GSC
1. See note on slide 2 regarding Non-GAAP Financial Measures
$976
$872
2015 2016
Cash Operating Cost Per Ounce1
• Cash operating cost1 guidance achievedin the middle of guidance range
• 11% decrease in cash operating cost perounce1 to $872 compared to 2015reflecting GSR’s transition into a lowcost, non-refractory producer
• AISC per ounce1 of $1,093 in 2016, 5%decrease compared to 2015
• Q4 2016 cash operating cost per ounce1
of $880 due to fewer ounces producedfrom Wassa Main Pit and decrease inhead grade
• Cash operating cost1 and AISC1 perounce expected to continue to reduce asproduction from high grade undergroundmines ramps up

7
Investing In Our Future
• Capital expenditures of $84.4m during 2016, a 48% increase compared to 2015,reflecting the continued work at development projects
• Two underground mines will transform GSR’s production and cost profiles
• Commercial production achieved at Wassa Underground on January 1, 2017, asexpected
NYSE: GSSTSX: GSC
0
5
10
15
20
25
Q4 2015 Q4 2016
Millio
n (
$)
Capex: Q4’15 vs Q4’16
Prestea Open Pit - DevelopmentPrestea Open Pit - SustainingPrestea Underground - DevelopmentWassa - Other DevelopmentWassa Tailings ExpansionWassa Underground - DevelopmentWassa Open Pit & Processing Plant - Sustaining
0
20
40
60
80
FY 2015 FY 2016
Millio
n (
$)
Capex: 2015 vs 2016
Prestea Open Pit - Development
Prestea Open Pit - SustainingPrestea Underground - DevelopmentWassa - Other DevelopmentWassa Tailings ExpansionWassa Underground - DevelopmentWassa Open Pit & Processing Plant - Sustaining

8
2016 OPERATIONAL REVIEW
Wassa Gold Mine
Prestea Gold Mine

9
Q4 and FY 2016: Wassa Operational Results
NYSE: GSSTSX: GSC
• 4% decrease inproduction in 2016compared to 2015 dueto lower grade ore fromWassa Main Pit
• 12% increase in cashoperating costs1 in 2016due to higher miningcosts per tonne
• 11,062oz produced fromWassa Underground in2016
• Costs expected todecrease further asWassa Undergroundcontinues to ramp up
1. Relates to Wassa Main Pit2. Relates to Wassa Underground3. See note on slide 2 regarding Non-GAAP Financial Measures
Wassa 2017 Guidance:
85,000-95,000oz from Wassa Main Pit and 60,000-65,000oz from Wassa Underground
Cash operating cost1 of $830-915/oz
WassaFY
2016FY
2015Q4
2016Q4
2015
Ore Mined kt 2,497 2,849 632 806
Waste Mined kt 9,975 10,632 2,197 2,924
Ore Processed
kt 2,623 2,495 709 620
Grade Processed
g/t1.271
2.0621.461
1.221
2.2721.771
Recovery % 93.6 93.4 92.9 93.9
Gold Production
oz 104,381 108,266 29,276 31,395
Gold Sales oz 104,346 107,751 28,943 30,880
Cash Op. Cost3 $/oz 941 838 1,090 625

10
Wassa Underground: Commercial Production Achieved
NYSE: GSSTSX: GSC
Production expected to increase in Q3 2017 when transverse stoping of B Shoot begins
• Commercial production achieved on January 1,2017
• Construction of Wassa Underground, including theinstallation of all ancillary infrastructure,completed at the end of Q4 2016
• First longitudinal stopes of B Shoot expected to bemined during Q1 2017
• First transverse stopes of B Shoot expected to bemined during Q3 2017 – production is anticipatedto increase as the mining operations target thewider, higher grade areas of the deposit
• Full production rate of Wassa Underground of2,200 tpd expected to be achieved in 2018
• Life of mine average production from 2017onwards is expected to be 175,000oz per annum

11
Wassa Underground Development
F Shoot
B Shoot
Strong potential to increase Mineral Resources & Reserves through exploration
NYSE: GSSTSX: GSC
F Shoot – mining here currently
B ShootMineral Reserve –higher grade areas
to be mined via transverse stoping
in Q3 2017
~750m Vertical depth below
surface
Wassa Underground drilled down plunge to ~1,500m (1,100m to
limit of current reserve)
B Shoot Inferred Mineral Resource to be drilled from underground in early 2018 – majority of Wassa Underground’s 1.9Moz Inferred Mineral
Resources are from this area

12
Q4 and FY 2016: Prestea Operational Results
Prestea FY 2016 FY 2015 Q4 2016 Q4 2015
Ore Mined kt 1,500 1,711 341 301
Waste Mined kt 4,040 3,603 615 894
Ore Processed
kt 1,5041,5211
1,4092378 318
Grade Processed
g/t 2.212.151
1.3222.51 2.36
Recovery % 83.967.51
64.3283.0 83.1
Gold Production
oz 89,673 114,150 24,128 20,746
Gold Sales oz 89,517 113,902 23,893 20,498
Cash Operating Cost3
$/oz 800 1,108 694 849
NYSE: GSSTSX: GSC
• Production from PresteaOpen Pits in 2016 was28% higher than the topend of the Company’soriginal guidance
• Record production forsecond consecutivequarter delivered in Q42016
• 2016 was the first yearof wholly non-refractoryproduction from Prestea
• 28% decrease in cashoperating costs3 as aresult of cessation ofrefractory operations
1. Relates to refractory ore processed in 20152. Relates to non-refractory ore processed in 20153. See note on slide 2 regarding Non-GAAP Financial Measures
Prestea 2017 Guidance:
65,000-70,000oz from Prestea Open Pits and 45,000-50,000oz from Prestea Underground
Cash operating cost1 of $715-780/oz

13
Mampon: Strong Near-Term Cash Flow
NYSE: GSSTSX: GSC
• Mampon is an oxide deposit 65km to the northof the CIL processing plant at the Bogoso site
• Mineral Reserves of 45,000oz of gold (304Kt at4.60g/t)
• All permits received – mining lease,environmental permit and forestry permit
• High grade ore from Mampon will be blendedwith ore from Prestea Open Pits to enhanceGSR’s cash flow in 2017
• Mining expected to commence in Q2 2017
• Limited capital expenditures required to bringMampon into production due to existing goodquality road between deposit and processingplant
All permits received and mining expected to commence in Q2 2017
GHANAMampon

14
Prestea Underground: Project Update
1. See note on slide 2 regarding Non-GAAP Financial MeasuresNYSE: GSSTSX: GSC
Rehabilitation works commenced
Long lead time equipment ordered
Underground mining contractor appointed (Manroc Developments, Inc.)
Installation of new electrical and water supply services completed
Track improved on 24 Level for high-speed haulage
Mobilization of underground training contractor to site and first Alimaks arrived
Rock winder upgrade completed and commissioned
Pre-development of the Mineral Resource and West Reef intersected by mining team
First stope blasted - expected in Q2 2017
Achieving commercial production – expected in mid-2017
March 2016 Update to Feasibility Study
Gold production per annum
90,000oz
Cash operating cost per ounce1
$468
Mineral Reserve head grade
14.0g/t
AISC per ounce1
$615

15
Prestea Underground: Development of 24 Level
NYSE: GSSTSX: GSC
Electrical Substation
Workshop
Drill Chamber
Footwall Drive
Vent Raise
Pump Chamber
Ore Drive
Ore Pass to
21L
Alimak Nest
• 24 Level is approximately900 metres below surface
• Total development advanceof 350 metres completed byDecember 31, 2016
• Focused on crosscutadvancement towards WestReef ore body
• Development team alsoconstructed a workshop andelectrical bays and slashedexisting drives to a sizesuitable for mechanizedload-haul-dump equipment
• First Alimak movedunderground and nest isbeing prepared

16
Prestea Underground: Exploration Upside Potential
NYSE: GSSTSX: GSC
West Reef• Current Mineral Reserve
located here on 17 to 30 Levels
• Potential to North down plunge as well as up plunge to 12 Level
PresteaOpen Pits
Main Reef• Limited drilling on
17 to 30 Levels• Good untested
Resource potential • Drilling will be
possible from West Reef mining access
South Gap • 2,000m of strike untested
at depth• Shallow drilling at surface
has delineated structure• Good UG potential • Future surface drilling
target
Tuapim Decline Target• ~400 vertical extent• Mineralization defined by surface
drilling and historical UG mining
N
Bondaye shaft Tuapim
shaft
17 L
24 L
Central shaft
West Reef High grade core open
down plunge to North
S

17
Opportunity to Substantially Increase Mineral Reserves
NYSE: GSSTSX: GSC
• Objective is to convert further Measuredand Indicated (M&I) Mineral Resources toMineral Reserves
• At Wassa, 42% of M&I Resources areMineral Reserves
• At Prestea, 57% of M&I Resourcesare Mineral Reserves
• Strong, low risk, low cost opportunity toexpand Mineral Reserve base materially
• Significant additional potential outside ofexisting Mineral Resource area – GoldenStar has concession areas totaling1,156km2
• Update on exploration strategy will bereleased later in Q1 2017
Potential to expand Mineral Reserves and extend lives of both operations significantly through further drilling

18
2016FINANCIAL REVIEW
19
Q4 and FY 2016: Financial Highlights
2016 2015
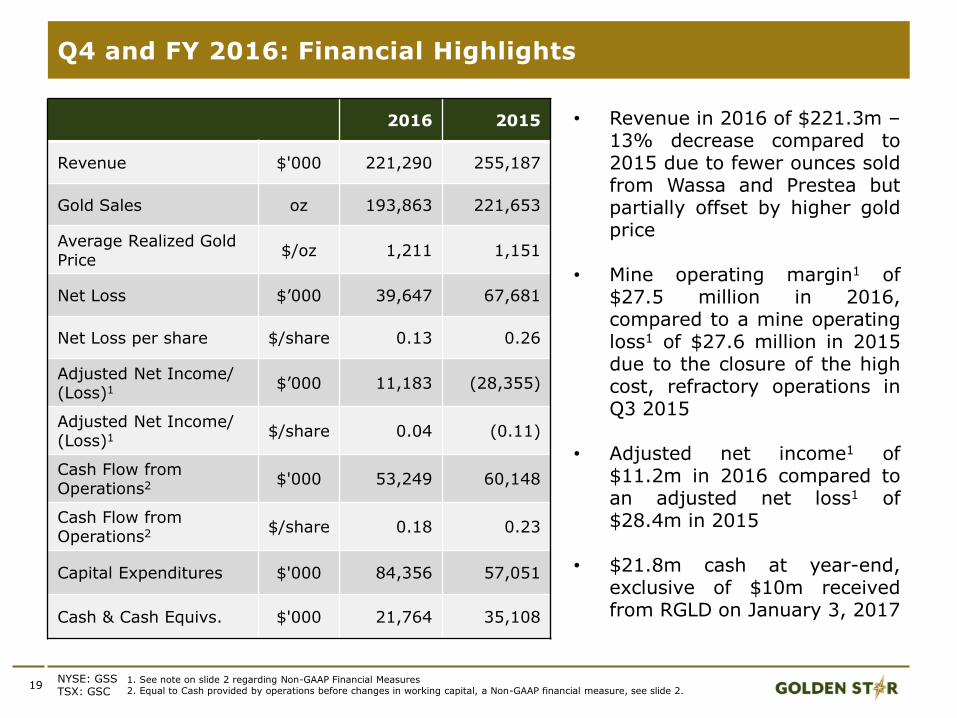
Revenue $'000 221,290 255,187
Gold Sales oz 193,863 221,653
Average Realized Gold Price
$/oz 1,211 1,151
Net Loss $’000 39,647 67,681
Net Loss per share $/share 0.13 0.26
Adjusted Net Income/ (Loss)1 $’000 11,183 (28,355)
Adjusted Net Income/ (Loss)1 $/share 0.04 (0.11)
Cash Flow from Operations2 $'000 53,249 60,148
Cash Flow from Operations2 $/share 0.18 0.23
Capital Expenditures $'000 84,356 57,051
Cash & Cash Equivs. $'000 21,764 35,108
NYSE: GSSTSX: GSC
1. See note on slide 2 regarding Non-GAAP Financial Measures2. Equal to Cash provided by operations before changes in working capital, a Non-GAAP financial measure, see slide 2.
• Revenue in 2016 of $221.3m –13% decrease compared to2015 due to fewer ounces soldfrom Wassa and Prestea butpartially offset by higher goldprice
• Mine operating margin1 of$27.5 million in 2016,compared to a mine operatingloss1 of $27.6 million in 2015due to the closure of the highcost, refractory operations inQ3 2015
• Adjusted net income1 of$11.2m in 2016 compared toan adjusted net loss1 of$28.4m in 2015
• $21.8m cash at year-end,exclusive of $10m receivedfrom RGLD on January 3, 2017
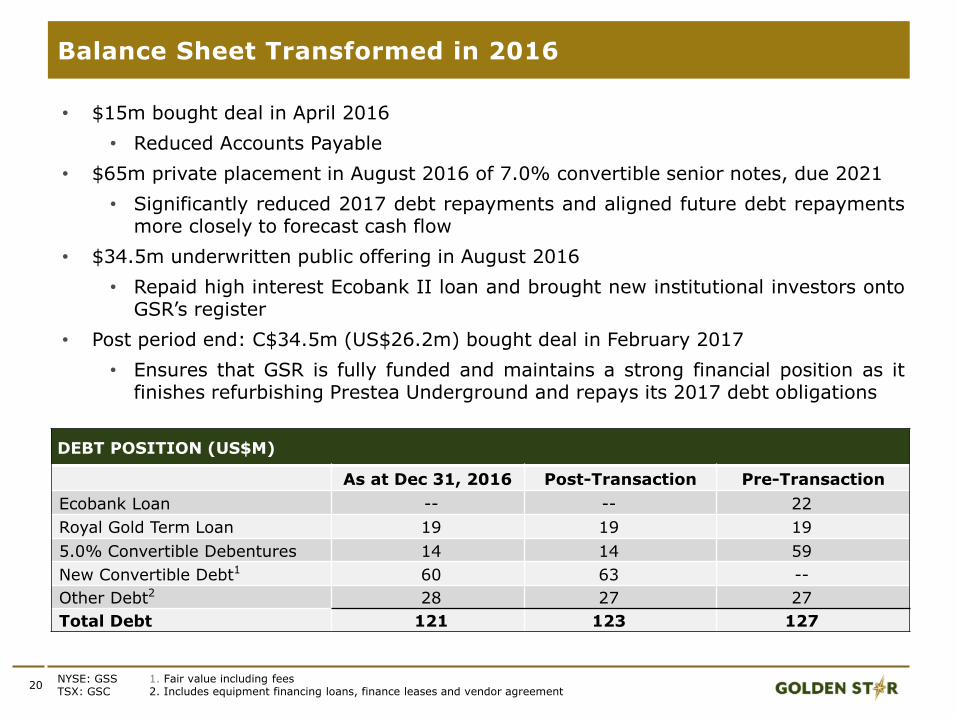
• $15m bought deal in April 2016
• Reduced Accounts Payable
• $65m private placement in August 2016 of 7.0% convertible senior notes, due 2021
• Significantly reduced 2017 debt repayments and aligned future debt repaymentsmore closely to forecast cash flow
• $34.5m underwritten public offering in August 2016
• Repaid high interest Ecobank II loan and brought new institutional investors ontoGSR’s register
• Post period end: C$34.5m (US$26.2m) bought deal in February 2017
• Ensures that GSR is fully funded and maintains a strong financial position as itfinishes refurbishing Prestea Underground and repays its 2017 debt obligations
20
Balance Sheet Transformed in 2016
NYSE: GSSTSX: GSC
DEBT POSITION (US$M)
As at Dec 31, 2016 Post-Transaction Pre-Transaction
Ecobank Loan -- -- 22
Royal Gold Term Loan 19 19 19
5.0% Convertible Debentures 14 14 59
New Convertible Debt1 60 63 --
Other Debt2 28 27 27
Total Debt 121 123 127
1. Fair value including fees2. Includes equipment financing loans, finance leases and vendor agreement
21
LOOKING AHEAD

22
2017 Guidance: Production and Cash Operating Costs1
NYSE: GSSTSX: GSC
Gold Production and Cash Operating Cost1 Guidance By Asset
AssetGold Production
(oz)Cash Operating
Cost1 ($/oz)All-In Sustaining
Cost1 ($/oz)
Wassa Main Pit 85,000-95,000 - -
Wassa Underground 60,000-65,000 - -
Wassa Consolidated 145,000-160,000 830-915 -
Prestea Open Pits2,3 65,000-70,000 - -
Prestea Underground 45,000-50,000 - -
Prestea Consolidated 110,000-120,000 715-780 -
CONSOLIDATED 255,000-280,000 780-860 970-1,070
1. See note on slide 2 regarding Non-GAAP Financial Measures2. Prestea Open Pits production guidance includes the forecast production from the Mampon deposit3. Production guidance for Prestea Underground includes 7,000-7,500oz of pre-commercial production. Costs incurred at
Prestea Underground will be capitalized until commercial production is achieved.
• 2017 gold production expected to be weighted towards H2 2017 due to:• Wassa Underground transverse stopes expected to be accessed in Q3 2017• Commercial production at Prestea Underground expected in mid-2017• Production from Mampon deposit expected in Q2 2017
• Gold production in Q1 and Q2 2017 expected to be in line with Q4 2016
• Cash operating cost1 per ounce expected to be higher in H1 2017 but decreasing inH2 as higher grade ore becomes available
2017 production guidance 31-44% higher than 2016 production results

23
2017 Guidance: Capital Expenditures
NYSE: GSSTSX: GSC
Capital expenditures weighted towards H1 2017
Capital Expenditures Guidance By Asset
AssetSustaining Capital
($m)
Development Capital ($m)
Total Capital Expenditures
($m)
Wassa Main Pit and Surface Infrastructure 5.9 1.1 7.0
Wassa Underground 9.0 3.4 12.4
Prestea Open Pits 5.0 - 5.0
Prestea Underground1 and Processing Plant 0.4 31.2 31.6
Exploration - 2.4 2.4
TOTAL 20.3 38.1 58.4
• 2017 guidance for total capital expenditures of $58m
• 54% of capital expenditures to be incurred at Prestea Underground
• Capital expenditures are expected to be higher in H1 2017 due to funds required forcontinued construction of Prestea Underground and accessing of Mampon deposit
• Capital expenditures expected to decrease in H2 2017 once Prestea Undergroundachieves commercial production
1. Capital expenditures for Prestea Underground exclude capitalized revenues and capitalized interest.
0
200
400
600
800
1,000
1,200
0
50
100
150
200
250
300
350
Costs
$/
oz
Pro
du
cti
on
'00
0 o
z
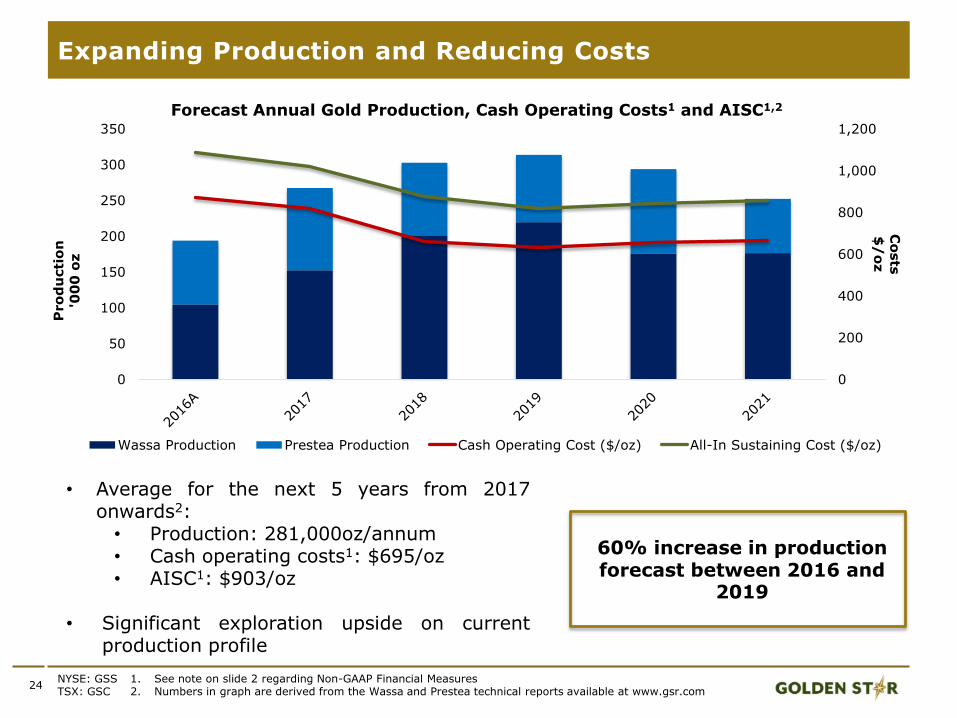
Forecast Annual Gold Production, Cash Operating Costs1 and AISC1,2
Wassa Production Prestea Production Cash Operating Cost ($/oz) All-In Sustaining Cost ($/oz)
24
Expanding Production and Reducing Costs
NYSE: GSSTSX: GSC
60% increase in production forecast between 2016 and
2019
1. See note on slide 2 regarding Non-GAAP Financial Measures2. Numbers in graph are derived from the Wassa and Prestea technical reports available at www.gsr.com
• Average for the next 5 years from 2017onwards2:• Production: 281,000oz/annum• Cash operating costs1: $695/oz• AISC1: $903/oz
• Significant exploration upside on currentproduction profile

Achieve commercial production at Wassa Underground – January 1,2017
Mineral Reserve and Mineral Resource update and exploration strategyupdate – Q1 2017
Commence mining of higher grade B Shoot zone of Wassa Underground– Q1 2017
Commence mining of Mampon deposit – Q2 2017
Blasting of first stope at Prestea Underground – Q2 2017
UPCOMING MILESTONES IN H1 2017

• 2016 guidance achieved on all announcedmetrics – 2017 production guidance is 31-44% higher than 2016 production result
• Development of two high grade undergroundmines fully funded – production expected toexpand and costs expected to continue toreduce
• Significant exploration upside potential –increase Mineral Reserves and extend minelives
• Experienced management team with a trackrecord of discovery and project delivery
• Undervalued compared to peer group on anumber of metrics
26
Investment Summary
NYSE: GSSTSX: GSC
Transforming into a high grade, non-refractory, low cost gold producer


28
Appendices: Market Information
One year SP graph
Market Information1
MarketsNYSE MKT / TSX / GSE
TickersNYSE: GSSTSX: GSCGSE: GSR
Shares in Issue 374,499,286
Options 15,572,606
Share Price2 $1.00
Market Capitalization $375m
Cash3,4 $21.8m
Debt $121m
Daily Volumes Traded (3 Month Average)2 2.9m shares
One Year Return2 225%
One Year Share Price Graph (GSS)1,2
Xxx% share price increase in 1 year
Analyst Coverage Key Institutional Shareholders
• BMO Capital Markets• CIBC Capital Markets• Clarus Securities• Credit Suisse• National Bank Financial• Scotia Bank
• Sentry Investments• Franklin Templeton• Oppenheimer Funds• Earth Resources• Gold 2000• AGF Management• RBC Investment Mgmt
1. As at Feb 17, 20172. Refers to NYSE MKT listing3. As at Dec 31, 2016
NYSE: GSSTSX: GSC
4. This does not include $10m from Royal Gold streaming agreement received on January 3, 2017

29
A Responsible Corporate Citizen
NYSE: GSSTSX: GSC
99% of our workforce and contractors are Ghanaian59% of our workforce and contractors are from local communities
GSR supports a range of community projects focused on thekey areas of healthcare, education and sustainableagribusiness.
For more information on our commitment to corporate socialresponsibility, please visit www.gsr.com/responsibility
1
1. Refers to the 10% of royalties given to stools/traditional authorities. The total amount paid by GSR in 2015 to Government came to $36.9m and the total over the Company’s life to $287m..

30
• GSR has a financing arrangement with Royal Gold for total aggregate proceeds of $145m. Use offunds:• Facilitate development of Wassa and Prestea underground mines• Retire outstanding Ecobank I loan debt
• Gold stream of $145m over Bogoso, Prestea and Wassa:
• From January 1, 2016, to deliver 9.25% of all production at a cash purchase price of 20% of spot gold• From January 1, 2018 or commercial production of the underground mines, whichever is sooner, to
deliver 10.50% of production at a cash purchase price of 20% of spot gold until 240,000 ounces havebeen delivered
• Thereafter, 5.50% of production at a cash purchase price of 30% of spot gold will be delivered (‘tailstream’)
• Option to repurchase 50% of the tail stream• In the event that Golden Star expands its operations to outside its current mine license areas in the
future, it will have the option to deliver ounces from these operations to satisfy the first and seconddelivery thresholds
• GSR would retain the upside to these new operations as the tail stream would not be applied• All payments received for a total of $145m• A total of 30,365 ounces have been delivered as at December 31, 2016
• Four year $20m secured term loan:• Interest rate linked to gold price1
• At a gold price of $1,200/oz the interest rate would be 7.5% and at $1,300/oz, it would be8.13%
• Rate is not to exceed 11.5%• No early prepayment penalty• Subject to an agreed quarterly 25-50% excess cash flow sweep from the third quarter of 2017
onwards• Matures in July 2019• Royal Gold has security against mining assets
1. Calculated as the product of the average spot gold price over the quarter and 62.50% divided by 10,000.NYSE: GSSTSX: GSC
Royal Gold Financing Agreement

31
Mineral Reserves and Resources
NYSE: GSSTSX: GSC
Mineral Reserves1,2,3 Tonnes ('000) Grade (Au g/t) Content (Koz)
Proven Reserves
Wassa 1,046 1.09 37
Prestea 25 2.69 2
Total 1,071 1.12 39
Probable Reserves
Wassa 19,319 2.33 1,450
Prestea 3,237 6.29 654
Total 22,556 2.90 2,104
Total Proven & Probable 23,626 2.82 2,143
Mineral Resources1,2,3 Tonnes ('000) Grade (Au g/t) Content (Koz)
Measured & Indicated Mineral Resources
Wassa 54,647 2.02 3,556
Prestea 6,712 5.30 1,144
Total 61,360 2.38 4,700
Inferred Mineral Resources
Wassa 16,462 4.15 2,200
Prestea 3,813 7.70 944
Total 20,305 4.82 3,144
1. For Wassa’s Mineral Reserves and Resources please refer to ‘NI 43-101 Technical Report on a Feasibility Study of the Wassa Open Pit and UndergroundProject in Ghana’, dated December 31, 2014, which is filed on SEDAR and at www.gsr.com
2. For Prestea’s Mineral Reserves and Resources please refer to ‘NI 43-101 Technical Report on a Feasibility Study of the Prestea Underground GoldProject in Ghana’, dated November 3, 2015, which is filed on SEDAR and at www.gsr.com
3. All numbers exclude refractory ore.