exosc8 - · pdf filescoliosis, ing. hernia no data p1 - v:10 2m/9m† severe muscle...
TRANSCRIPT
1
Supplementary Information
Supplementary Figure 1
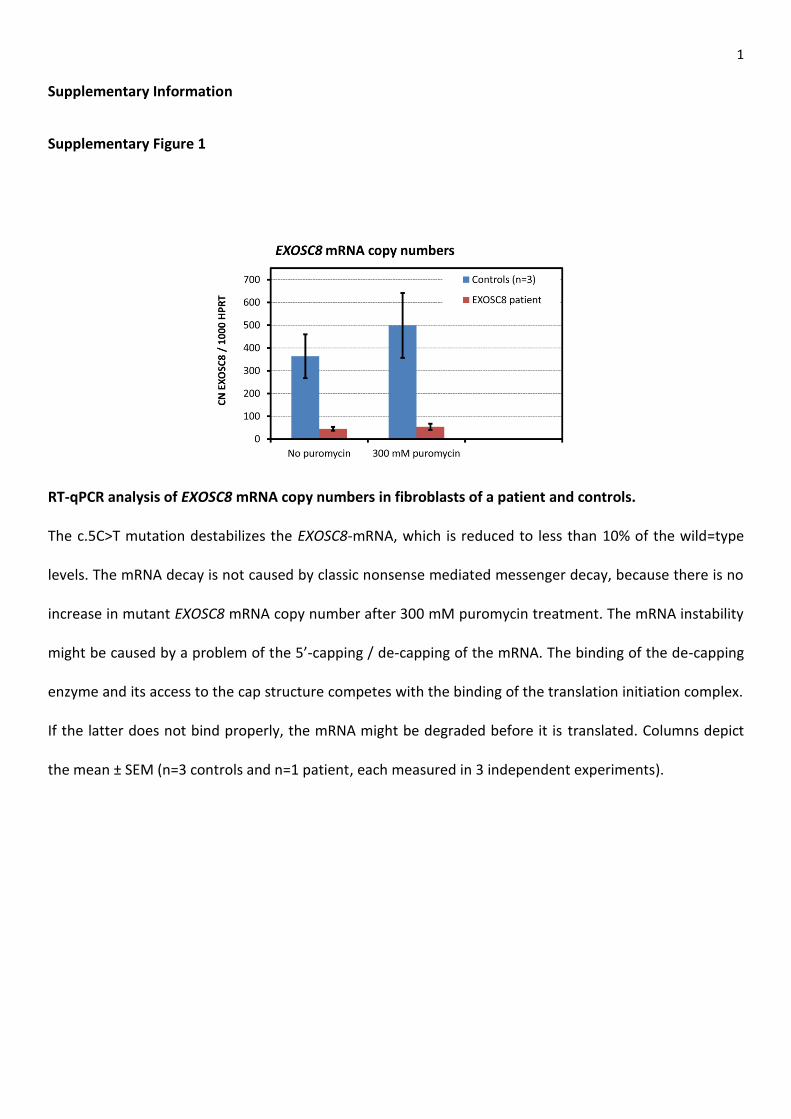
RT-qPCR analysis of EXOSC8 mRNA copy numbers in fibroblasts of a patient and controls.
The c.5C>T mutation destabilizes the EXOSC8-mRNA, which is reduced to less than 10% of the wild=type
levels. The mRNA decay is not caused by classic nonsense mediated messenger decay, because there is no
increase in mutant EXOSC8 mRNA copy number after 300 mM puromycin treatment. The mRNA instability
might be caused by a problem of the 5’-capping / de-capping of the mRNA. The binding of the de-capping
enzyme and its access to the cap structure competes with the binding of the translation initiation complex.
If the latter does not bind properly, the mRNA might be degraded before it is translated. Columns depict
the mean ± SEM (n=3 controls and n=1 patient, each measured in 3 independent experiments).
2
Supplementary Figure 2
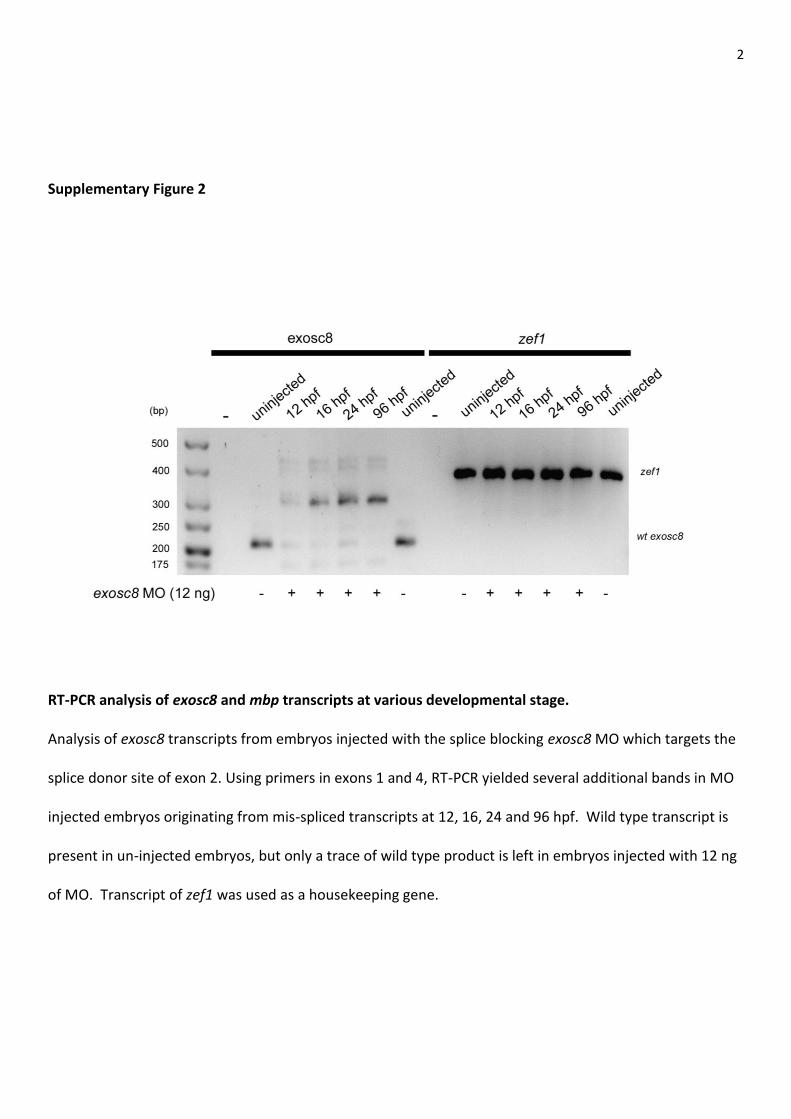
RT-PCR analysis of exosc8 and mbp transcripts at various developmental stage.
Analysis of exosc8 transcripts from embryos injected with the splice blocking exosc8 MO which targets the
splice donor site of exon 2. Using primers in exons 1 and 4, RT-PCR yielded several additional bands in MO
injected embryos originating from mis-spliced transcripts at 12, 16, 24 and 96 hpf. Wild type transcript is
present in un-injected embryos, but only a trace of wild type product is left in embryos injected with 12 ng
of MO. Transcript of zef1 was used as a housekeeping gene.

3
Supplementary Figure 3
Mbp and acetylated tubulin staining after knock-down of the zebrafish orthologue, exosc8 in the head
Un-injected control larvae and exosc8 MO injected larvae were analysed for myelination at 96 hpf. Larvae
of the different phenotype categories and control larvae were stained with antibodies against the myelin
basic protein (Mbp) and against acetylated tubulin to study the presence of axon tracts and their degree of
myelination.
Left column: overlay, with Mbp staining in red and acetylated tubulin staining in green; middle column:
Mbp staining; right column: acetylated tubulin. Top row: head of control larva. Middle row: MO injected
larva with normal external morphology; axons near the eye are not Mbp-positive (white arrowhead).
Bottom row: MO injected larva with a severe phenotype.
4
Supplementary Figure 4
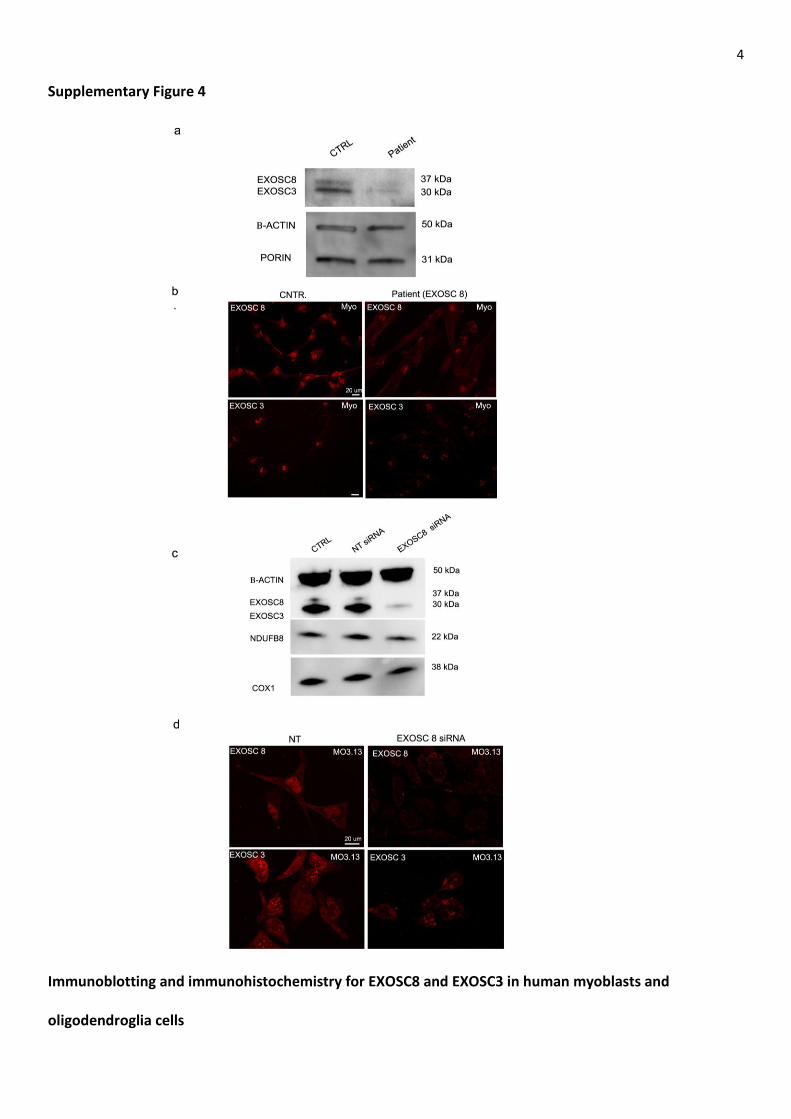
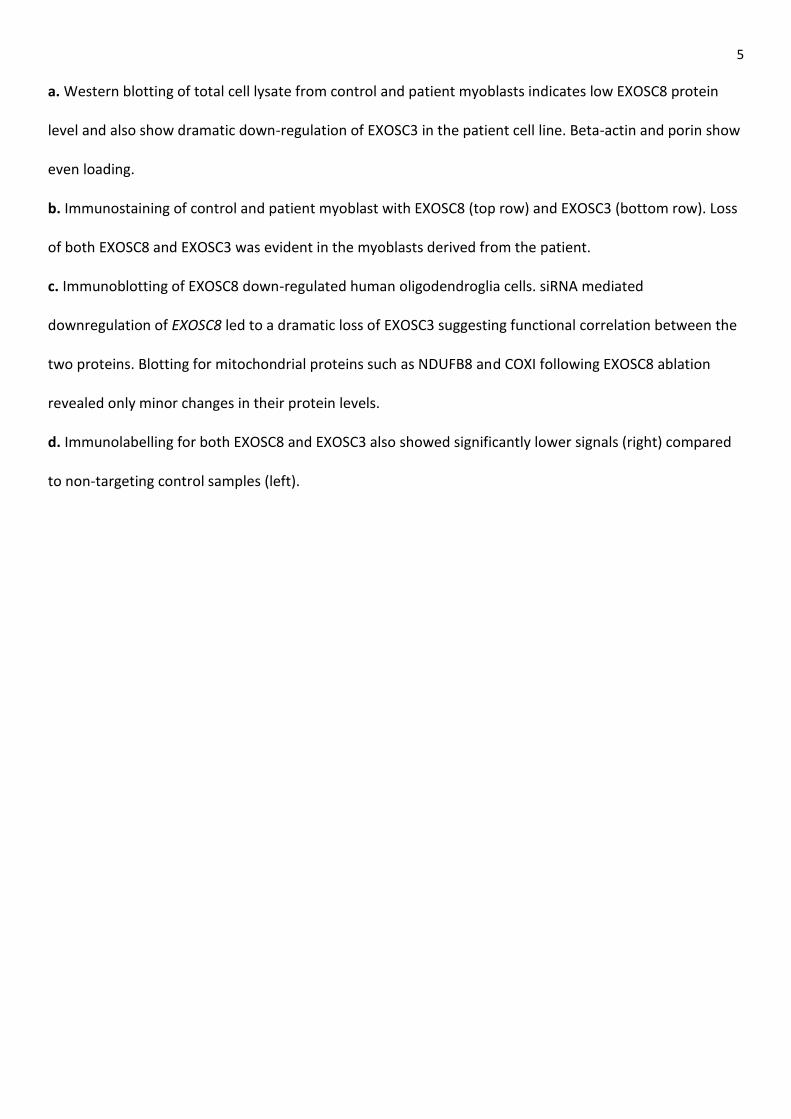
Immunoblotting and immunohistochemistry for EXOSC8 and EXOSC3 in human myoblasts and
oligodendroglia cells
5
a. Western blotting of total cell lysate from control and patient myoblasts indicates low EXOSC8 protein
level and also show dramatic down-regulation of EXOSC3 in the patient cell line. Beta-actin and porin show
even loading.
b. Immunostaining of control and patient myoblast with EXOSC8 (top row) and EXOSC3 (bottom row). Loss
of both EXOSC8 and EXOSC3 was evident in the myoblasts derived from the patient.
c. Immunoblotting of EXOSC8 down-regulated human oligodendroglia cells. siRNA mediated
downregulation of EXOSC8 led to a dramatic loss of EXOSC3 suggesting functional correlation between the
two proteins. Blotting for mitochondrial proteins such as NDUFB8 and COXI following EXOSC8 ablation
revealed only minor changes in their protein levels.
d. Immunolabelling for both EXOSC8 and EXOSC3 also showed significantly lower signals (right) compared
to non-targeting control samples (left).
6
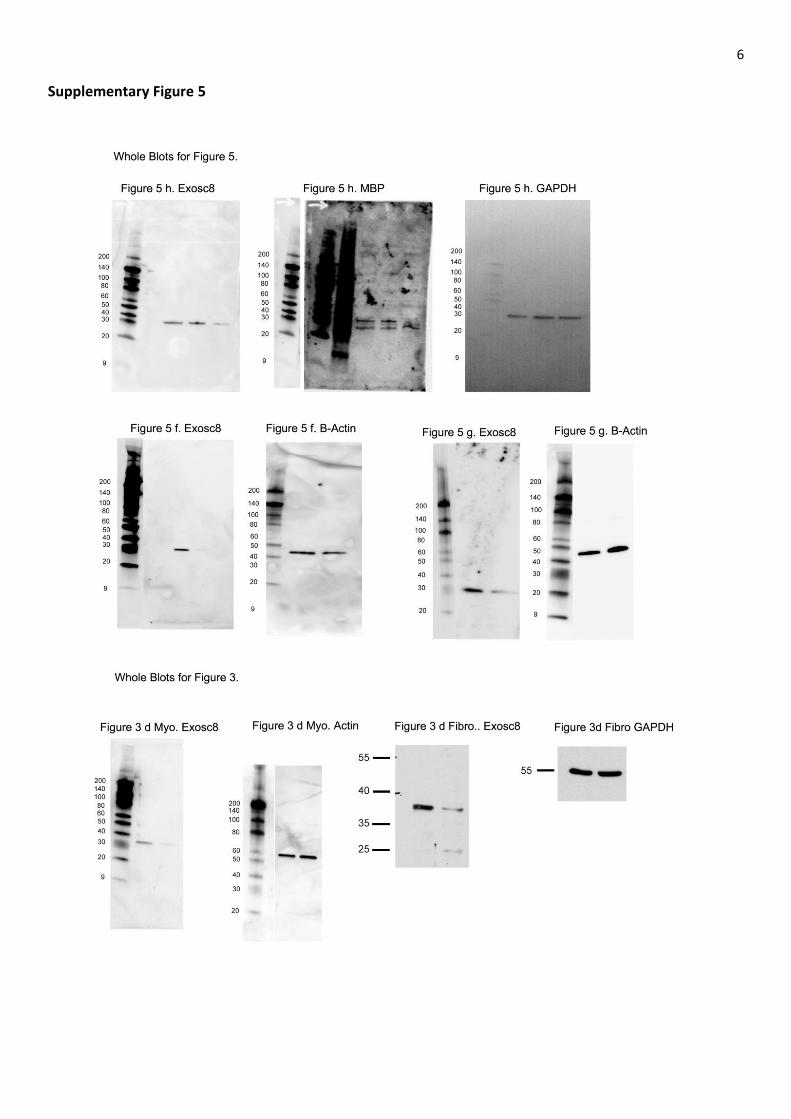
Supplementary Figure 5
7
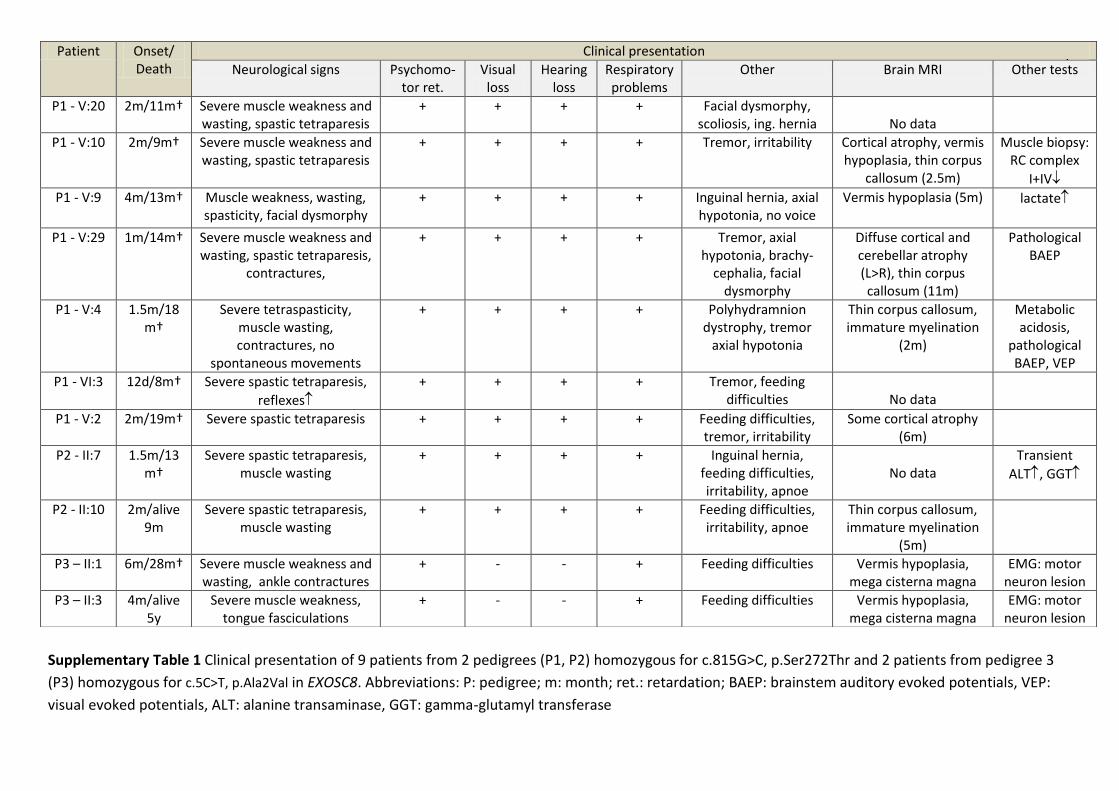
Supplementary Table 1 Clinical presentation of 9 patients from 2 pedigrees (P1, P2) homozygous for c.815G>C, p.Ser272Thr and 2 patients from pedigree 3
(P3) homozygous for c.5C>T, p.Ala2Val in EXOSC8. Abbreviations: P: pedigree; m: month; ret.: retardation; BAEP: brainstem auditory evoked potentials, VEP:
visual evoked potentials, ALT: alanine transaminase, GGT: gamma-glutamyl transferase
Patient Onset/ Death
Clinical presentation
Neurological signs Psychomo-tor ret.
Visual loss
Hearing loss
Respiratory problems
Other Brain MRI Other tests
P1 - V:20 2m/11m† Severe muscle weakness and wasting, spastic tetraparesis
+ + + + Facial dysmorphy, scoliosis, ing. hernia
No data
P1 - V:10 2m/9m† Severe muscle weakness and wasting, spastic tetraparesis
+ + + + Tremor, irritability Cortical atrophy, vermis hypoplasia, thin corpus
callosum (2.5m)
Muscle biopsy: RC complex
I+IV
P1 - V:9 4m/13m† Muscle weakness, wasting, spasticity, facial dysmorphy
+ + + + Inguinal hernia, axial hypotonia, no voice
Vermis hypoplasia (5m) lactate
P1 - V:29 1m/14m† Severe muscle weakness and wasting, spastic tetraparesis,
contractures,
+ + + + Tremor, axial hypotonia, brachy-
cephalia, facial dysmorphy
Diffuse cortical and cerebellar atrophy (L>R), thin corpus callosum (11m)
Pathological BAEP
P1 - V:4 1.5m/18m†
Severe tetraspasticity, muscle wasting, contractures, no
spontaneous movements
+ + + + Polyhydramnion dystrophy, tremor
axial hypotonia
Thin corpus callosum, immature myelination
(2m)
Metabolic acidosis,
pathological BAEP, VEP
P1 - VI:3 12d/8m† Severe spastic tetraparesis,
reflexes
+ + + + Tremor, feeding difficulties
No data
P1 - V:2 2m/19m† Severe spastic tetraparesis + + + + Feeding difficulties, tremor, irritability
Some cortical atrophy (6m)
P2 - II:7 1.5m/13m†
Severe spastic tetraparesis, muscle wasting
+ + + + Inguinal hernia, feeding difficulties, irritability, apnoe
No data
Transient
ALT, GGT
P2 - II:10 2m/alive 9m
Severe spastic tetraparesis, muscle wasting
+ + + + Feeding difficulties, irritability, apnoe
Thin corpus callosum, immature myelination
(5m)
P3 – II:1 6m/28m† Severe muscle weakness and wasting, ankle contractures
+ - - + Feeding difficulties Vermis hypoplasia, mega cisterna magna
EMG: motor neuron lesion
P3 – II:3 4m/alive 5y
Severe muscle weakness, tongue fasciculations
+ - - + Feeding difficulties Vermis hypoplasia, mega cisterna magna
EMG: motor neuron lesion

8
GENES INVOVED IN DEMYELINATION
Cont. siRNA 3d Cont. siRNA 6d EXOSC8 siRNA 3d EXOSC8 siRNA 6d AU rich elements
Fold change ± SD Fold change ± SD Fold change ± SD
MBP 1 0.92 ± 0.36 3.35 ± 0.55 * 6.58 ± 3.43* Au Rich
MOBP 1 1.07 ± 0.51 3.74 ± 2.16 * 8.5 ± 5.02 * Au Rich
AUH 1 0.83 ± 0.08 2.49 ± 0.49 1.27 ± 0.18 Au Rich
PLP1 1 0.74 ± 0.24 0.72 ± 0.32 0.17 ± 0.05 Non AU Rich
PMP22 1 1.15 ± 0.31 0.83 ± 0.05 0.9 ± 0.47 Non AU Rich
EIF2B2 1 0.99 ± 0.26 1.15 ± 0.27 1.27 ± 0.53 Non AU Rich
ABCD1 1 0.71 ± 0.07 1.95 ± 0.24 1.22 ± 0.35 Non AU Rich
ARSA 1 0.52 ± 0.52 0.91 ± 0.14 0.69 ± 0.16 Non AU Rich
GENES INVOLVED IN ATAXIA
SACS 1 1.25±0.29 0.77±0.08 1.01±0.13 Au Rich
ATXN1 1 0.09±0.11 0.89±0.22 0.77±0.07 Au Rich
ATXN2 1 1.05±0.37 1.25±0.2 1.11±0.19 Au Rich
ATXN3 1 0.92±0.28 1.24±0.16 0.95±0.23 Non AU Rich
FXN 1 0.96±0.04 1.46±0.07 1.52±0.13 Non AU Rich
ADCK3 1 0.71±0.08 1.36±0.19 1.04±0.13 Non AU Rich
CACNA1A 1 0.53±0.06 0.59±0.08 0.46±0.06 Non AU Rich
GENES INVOLVED IN MITOCHONDRIAL FUNCTION
COX7A2L 1 0.8±0.07 1.2±0.18 0.8±0.33 Au Rich
COX6A2 1 0.96±0.12 0.92±0.15 1.13±0.26 Au Rich
MRPS30 1 0.98±0.26 0.89±0.19 0.75±0.27 Au Rich
MRPL3 1 0.86±0.52 1.7±0.31 0.64±0.26 Au Rich
MTERF 1 0.63±0.11 1.17±0.31 0.82±0.23 Au Rich
TFBM1 1 1.85±0.35 1.38±0.54 1.76±0.22 Au Rich
TFAM 1 1.24±0.38 1.5±0.26 1.54±0.08 Au Rich
MTRF1 1 0.81±0.27 1.62±0.28 0.7±0.14 Au Rich
OPA1 1 1.08±0.17 1.43±0.12 1.39±0.2 Au Rich
SOD2 1 0.96±0.01 0.37±0.03 0.38±0.17 Au Rich
SURF1 1 0.94±0.4 0.96±0.35 0.83±0.3 Non AU Rich
RRM2B 1 0.76±0.18 1.72±0.43 1.12±0.27 Non AU Rich
EARS2 1 0.96±0.12 1.46±0.1 1.52±0.41 Non AU Rich
RARS2 1 0.81±0.37 1.85±0.49 0.94±0.24 Non AU Rich
DARS2 1 0.89±0.11 1.46±0.22 1.65±0.4 Non AU Rich
GENES ASSOCIATED WITH MOTOR NEURON FUNCTION
SMN1 1 0.57±0.25 0.76±0.23 0.64±0.31 Au Rich
CRIMI 1 0.94±0.3 1.01±0.2 1.87±0.61 Au Rich
BICD2 1 0.47±0.21 0.55±0.3 0.62±0.26 Non AU Rich
IGHMBP2 1 0.17±0.15 0.53±0.08 1.34±0.28 Non AU Rich
Supplementary Table 2 AU-rich and non-AU-rich gene expression after EXOSC8 down-regulation in
myoblasts. Two AU-rich element containing genes, MBP and MOBP were significantly increased after 3 and
6 days of siRNA transfection in myoblasts. All data were normalized to day 3 control siRNA samples. Fold
change and standard deviation are shown as the average of three independent measurements.

9
Cont. siRNA 3d EXOSC8 siRNA 3d AU rich elements
Fold change ± SD
GENES INVOVED IN DEMYELINATION
MBP 1 6.74±1.89 Au Rich
MOBP 1 2.48±0.68 Au Rich
PLP1 1 0.97±0.4 Non AU Rich
GENES ASSOCIATED WITH MOTOR NEURON FUNCTION
SMN1 1 2.72±0.1 Au Rich
VRK1 1 1.1±0.3 Au Rich
CRIMI 1 1.49±0.42 Non AU Rich
BICD2 1 1.26±0.21 Non AU Rich
IGHMBP2 1 0.17±0.15 Non AU Rich
Supplementary Table 3 AU-rich and non-AU-rich element containing gene expression after EXOSC8 down-
regulation in fibroblasts. In addition to MBP and MOBP we detected increased SMN1 in EXOSC8 siRNA
treated fibroblasts. All data were normalized to day 3 control siRNA samples. Fold change and standard
deviation are shown as the average of three independent measurements.

10
Supplementary Table 4 Human primer sequences used for RT-PCR.
Human real-time PCR primers
Forward 5´-3´ Reverse 5´-3´
“Myelin” primers
MBP (ARE) CTATAAATCGGCTCACAAGG AGGCGGTTATATTAAGAAGC
MOBP (ARE) ACTCCGAACACTTCAGCATACACT GATCCAGTCCTCCTCTTTCTTCTG
AUH (ARE) AGGTGGTGGTCTTGAACTGG CACTGCTTTGGCTTCTTTGC
PMP22 TTCTCATCATCACCAAACGAA ACTCATCACGCACAGACCAG
EIF2B2 ATCATTGGCACGAAGACCAT TTGGGGAACTGTGGAGAAAG
ABCD1 AGGTTGGGAGGCTATGTGTG ATGGAGAGCAGGGCAATG
PLP1 AGGCAGTCTCTGTGCTGATG AGGTGGAAGGTCATTTGGAA
ARSA CTGGACCTGCTGCCTACC GGGTGAAGAAGTGAGCCTTG
“Ataxia” primers
SACS (ARE) GGAGCCATCAAAACTGGAAC TCACCACCTTCAGCATCAAC
ATXN7 (ARE) CCTACGCTGCCTCCCTACTT ATCCTCTCTACGGTGCTGGA
ATXN2 (ARE) TGAGGAACTTGAGGCTTTGG ACTGGTTTGCCCTTGCTTC
ATXN3 ATTGCGAAGCTGACCAACTC ATTCCTGAGCCATCATTTGC
FXN TAGCAGAGGAAACGCTGGAC CCTGGATGGAGAAGATAGCC
ADCK3 ACAAGCAGCACAAACAGACG GACAGGAAAGGACTGGAACC
CACNA1A TGCCTGATGATGACAAGACC TCAAACTCCGTCCCAACTGT
“Spinal Muscular Atrophy / Motor Neuron” primers
SMN1 (ARE) ACCACACCTAAAAGAAAACCTGCT CCGTCTTCTGACCAAATGGCAG
CRIM1 (ARE) ACGCGATCACAATGGTTGTCGG GGCATCAGTAAGGAAACCGAAGG
BICD2 TTCTCCTCGCTGCGTGCTATGT AGCAGCGAGTTCAGCGTCTTCT
IGHMBP2 AGGAGGACGAACAGTCGAAAGG GTTGTATGGCGAGACCACAGCA
“Mitochondrial” primers
COX7A2L (ARE) TTTAGTGGCTTCACGCAGAA TGTGGAATCGGAGGTCAGTT
COX6A2 (ARE) CGCCCCGAGTTCCGTCCCTA GGGCAGAGGGTTCACGTGGC
MRPS30 (ARE) ACGGTCACACCCAGTTTCA GCTCCAGTCCAAGCAAAAAG
MRPL3 (ARE) CAGGCACTCCTCTTTATGCTG CTGTGGGTTTTCGTTTGACC
MTERF (ARE) GGCTTTTTGGTGTGAAGTGTC GGTCCTGCTCATTGGTAATCA
TFBM1 (ARE) TTCAAAAGGAAGTGGCAGAGA GGGCTGTATCAAGGGAGTGA
TFAM (ARE) ATGTGGGGCGTGCTGAGT TGCCAAGACAGATGAAAACC
MTRF1 (ARE) GACAAGCGTCAGCAACAAAG CCCTTCCCACCACATAAAAA
OPA1 (ARE) CAATGATGTGGTCTTGTTTTGG CTTGAGGTCTTCCGCCAGT
SOD2 (ARE) GGGTTGGCTTGGTTTCAATA GTAGTAAGCGTGCTCCCACA
SURF1 GCCTCATCTCCTCCTCAACTC CCACTTCTCCCTCAATCTGG
RRM2B CGCTGTTTCTATGGCTTTCA CCACCACTCTTTCCCCAAA
EARS2 CTGGGGCAGCGGAGAATA GGTGAGCAGAAACAGGGGTA
RARS2 TTCCCCAGAAGAAGATTGTG CCAGTTCCCAGAAGACCAAA
DARS2 TTGCGTTCGTCTCACTTAGG GCACCACAGATTCCACAGG
Control gene primers
ACTB CATCGAGCACGGCATCGTCA TAGCACAGCCTGGATAGCAAC
TUBB CTTCGGCCAGATCTTCAGAC AGAGAGTGGGTCAGCTGGAA
GAPDH AACAGCGACACCCATCCTC CATACC AGGAAATGAGCTTGACAA
11
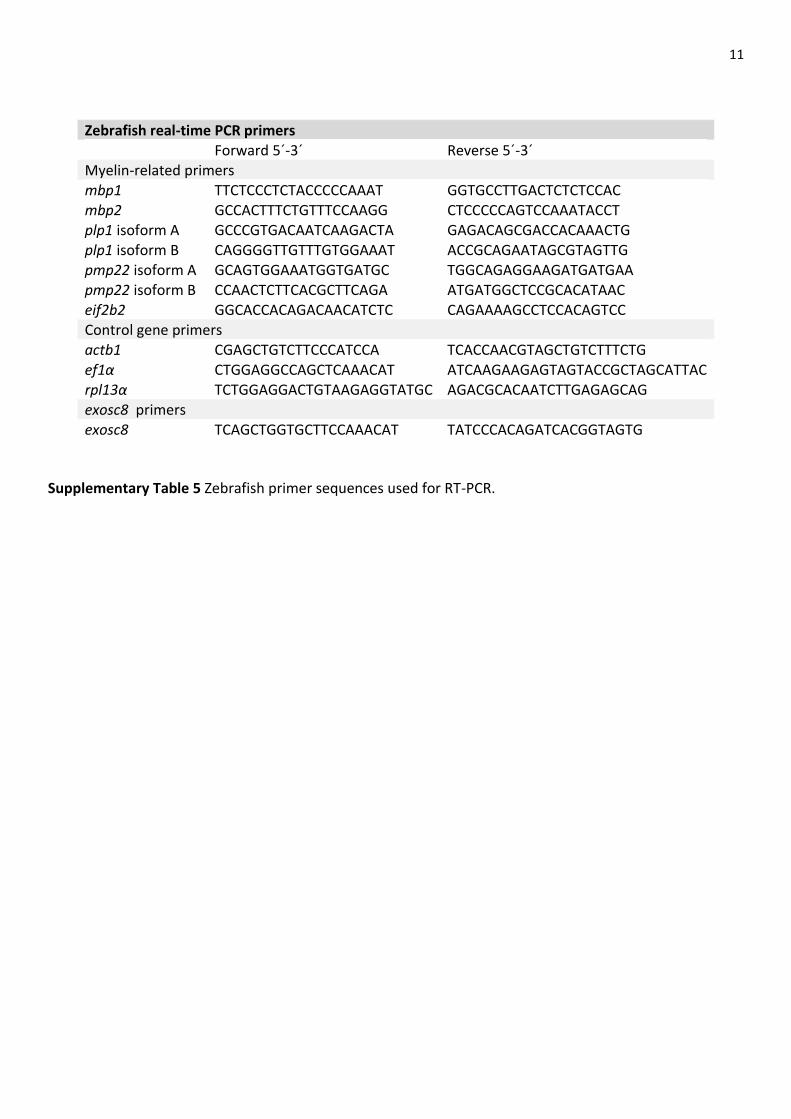
Supplementary Table 5 Zebrafish primer sequences used for RT-PCR.
Zebrafish real-time PCR primers
Forward 5´-3´ Reverse 5´-3´
Myelin-related primers mbp1 TTCTCCCTCTACCCCCAAAT GGTGCCTTGACTCTCTCCAC mbp2 GCCACTTTCTGTTTCCAAGG CTCCCCCAGTCCAAATACCT plp1 isoform A GCCCGTGACAATCAAGACTA GAGACAGCGACCACAAACTG plp1 isoform B CAGGGGTTGTTTGTGGAAAT ACCGCAGAATAGCGTAGTTG pmp22 isoform A GCAGTGGAAATGGTGATGC TGGCAGAGGAAGATGATGAA pmp22 isoform B CCAACTCTTCACGCTTCAGA ATGATGGCTCCGCACATAAC eif2b2 GGCACCACAGACAACATCTC CAGAAAAGCCTCCACAGTCC Control gene primers actb1 CGAGCTGTCTTCCCATCCA TCACCAACGTAGCTGTCTTTCTG
ef1α CTGGAGGCCAGCTCAAACAT ATCAAGAAGAGTAGTACCGCTAGCATTAC rpl13α TCTGGAGGACTGTAAGAGGTATGC AGACGCACAATCTTGAGAGCAG exosc8 primers exosc8 TCAGCTGGTGCTTCCAAACAT TATCCCACAGATCACGGTAGTG
12
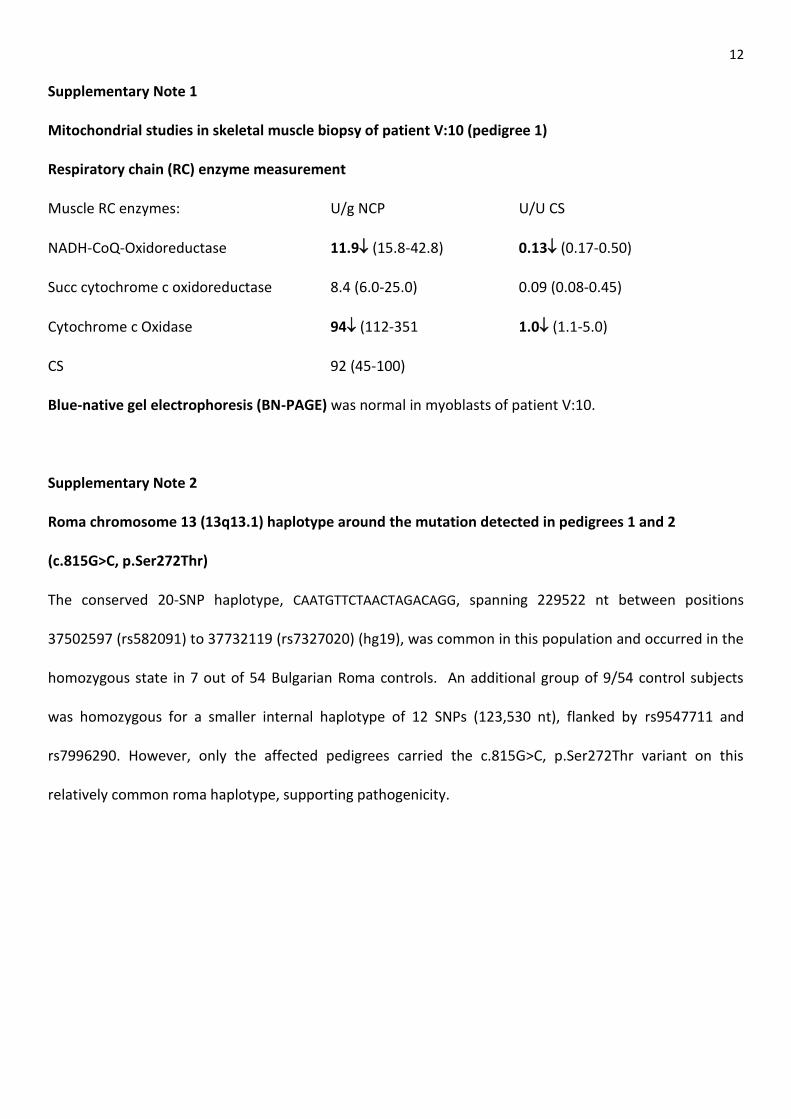
Supplementary Note 1
Mitochondrial studies in skeletal muscle biopsy of patient V:10 (pedigree 1)
Respiratory chain (RC) enzyme measurement
Muscle RC enzymes: U/g NCP U/U CS
NADH-CoQ-Oxidoreductase 11.9 (15.8-42.8) 0.13 (0.17-0.50)
Succ cytochrome c oxidoreductase 8.4 (6.0-25.0) 0.09 (0.08-0.45)
Cytochrome c Oxidase 94 (112-351 1.0 (1.1-5.0)
CS 92 (45-100)
Blue-native gel electrophoresis (BN-PAGE) was normal in myoblasts of patient V:10.
Supplementary Note 2
Roma chromosome 13 (13q13.1) haplotype around the mutation detected in pedigrees 1 and 2
(c.815G>C, p.Ser272Thr)
The conserved 20-SNP haplotype, CAATGTTCTAACTAGACAGG, spanning 229522 nt between positions
37502597 (rs582091) to 37732119 (rs7327020) (hg19), was common in this population and occurred in the
homozygous state in 7 out of 54 Bulgarian Roma controls. An additional group of 9/54 control subjects
was homozygous for a smaller internal haplotype of 12 SNPs (123,530 nt), flanked by rs9547711 and
rs7996290. However, only the affected pedigrees carried the c.815G>C, p.Ser272Thr variant on this
relatively common roma haplotype, supporting pathogenicity.

13
Supplementary Note 3
Gene expression studies were performed for the following selected AU-rich element containing (ARE)
genes and non ARE genes associated with similar clinical presentations
AU-rich element database (ARED) search: http://brp.kfshrc.edu.sa/ARED/
“MYELIN” ARE genes:
ACCESSION UNIGENE TITLE SOURCE mRNA
GENE GENE ID CHR
AK096859 Myelin basic protein AK096859 MBP 4155 18
AK124766 Myelin-associated oligodendrocyte basic protein AK124766 MOBP 4336 3
NM_001698 AU RNA binding protein/enoyl-Coenzyme A hydratase
NM_001698 AUH 549 9
NM_002677 Peripheral myelin protein 2 NM_002677 PMP2 5375 8
“MYELIN” non-ARE genes:
EIF2B2-vanishing white matter disease
PLP1-Pelizaeus-Merzbacher disease
ABCD1-adrenoleukodystrophy
ARSA-arylsulfatase A
PMP22-Charcot-Marie-Tooth disease type 1A
“ATAXIA” ARE genes:
ACCESSION UNIGENE TITLE SOURCE mRNA
GENE GENE ID CHR
NM_000332 Ataxin 1 NM_000332 ATXN1 6310 6
AK128613 Ataxin 2 NM_002973 ATXN2 6311 12
NM_014363 Spastic ataxia of Charlevoix-Saguenay (sacsin) NM_014363 SACS 26278 13
“ATAXIA” non-ARE genes:
ATXN3-spinocerebellar ataxia type 3
FXN-Friedreich ataxia,
ADCK3-autosomal recessive cerebellar ataxia with coenyzme Q deficiency
CACNA1A-spinocerebellar ataxia type 6)
14
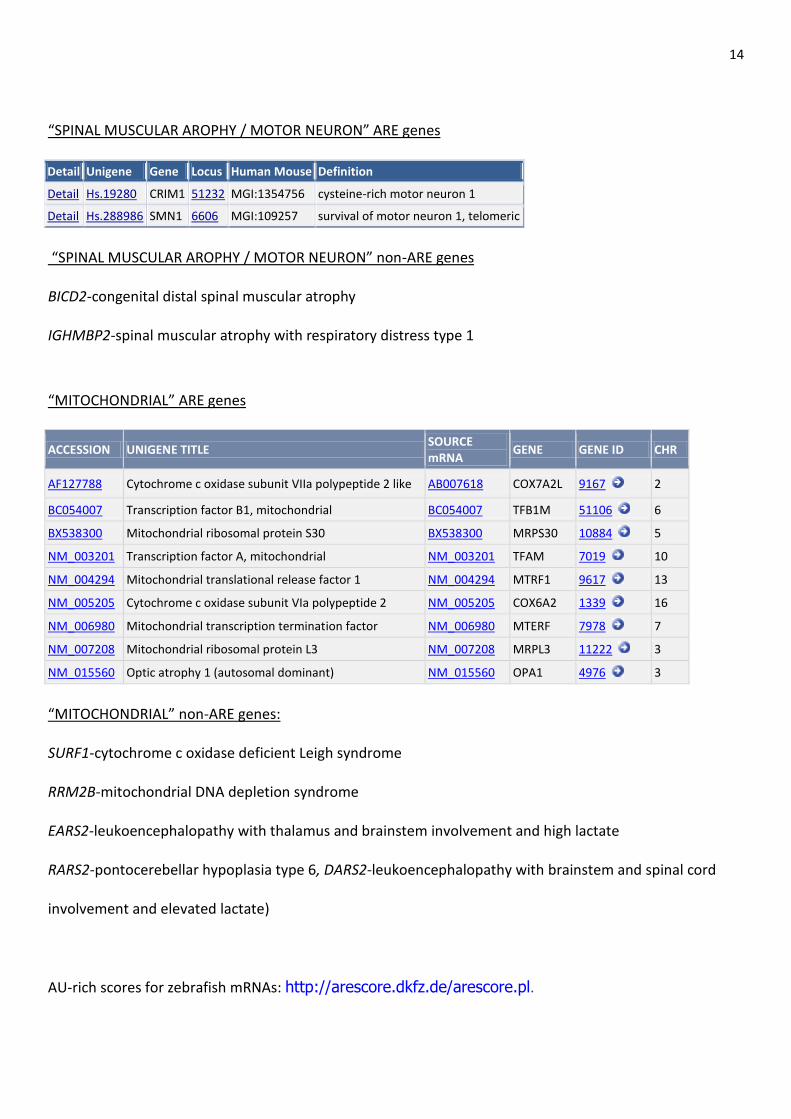
“SPINAL MUSCULAR AROPHY / MOTOR NEURON” ARE genes
Detail Unigene Gene Locus Human Mouse Definition
Detail Hs.19280 CRIM1 51232 MGI:1354756 cysteine-rich motor neuron 1
Detail Hs.288986 SMN1 6606 MGI:109257 survival of motor neuron 1, telomeric
“SPINAL MUSCULAR AROPHY / MOTOR NEURON” non-ARE genes
BICD2-congenital distal spinal muscular atrophy
IGHMBP2-spinal muscular atrophy with respiratory distress type 1
“MITOCHONDRIAL” ARE genes
ACCESSION UNIGENE TITLE SOURCE mRNA
GENE GENE ID CHR
AF127788 Cytochrome c oxidase subunit VIIa polypeptide 2 like AB007618 COX7A2L 9167 2
BC054007 Transcription factor B1, mitochondrial BC054007 TFB1M 51106 6
BX538300 Mitochondrial ribosomal protein S30 BX538300 MRPS30 10884 5
NM_003201 Transcription factor A, mitochondrial NM_003201 TFAM 7019 10
NM_004294 Mitochondrial translational release factor 1 NM_004294 MTRF1 9617 13
NM_005205 Cytochrome c oxidase subunit VIa polypeptide 2 NM_005205 COX6A2 1339 16
NM_006980 Mitochondrial transcription termination factor NM_006980 MTERF 7978 7
NM_007208 Mitochondrial ribosomal protein L3 NM_007208 MRPL3 11222 3
NM_015560 Optic atrophy 1 (autosomal dominant) NM_015560 OPA1 4976 3
“MITOCHONDRIAL” non-ARE genes:
SURF1-cytochrome c oxidase deficient Leigh syndrome
RRM2B-mitochondrial DNA depletion syndrome
EARS2-leukoencephalopathy with thalamus and brainstem involvement and high lactate
RARS2-pontocerebellar hypoplasia type 6, DARS2-leukoencephalopathy with brainstem and spinal cord
involvement and elevated lactate)
AU-rich scores for zebrafish mRNAs: http://arescore.dkfz.de/arescore.pl.