exoplanetary population statistical properties of
TRANSCRIPT

1
Statistical properties of exoplanets
Planets and Astrobiology (2018-2019)G. Vladilo
Main results of exoplanets studies
Statistical properties
Most statistics based on the results obtained with theDoppler and Transit methods
Updated results can be found at:exoplanets.org e exoplanet.eu
Understanding observational biases is fundamental to interpret the observed statistical properties
2
Exoplanetary population
3
• ……………….
Exoplanet statistical properties
• General properties investigated with statistical methods– Orbital properties
Orbital periods, semimajor axis, eccentricity, orbital inclinations– Planetary properties
Masses and radiiwith the Doppler and transit methods, respectively
– Occurrence rates– Distances– Properties of the host stars
Metallicities, chemical abundance patterns • Main results
– Great variety of orbital parameters and planetary masses/radii– Such a variety is not found in the Solar System
4
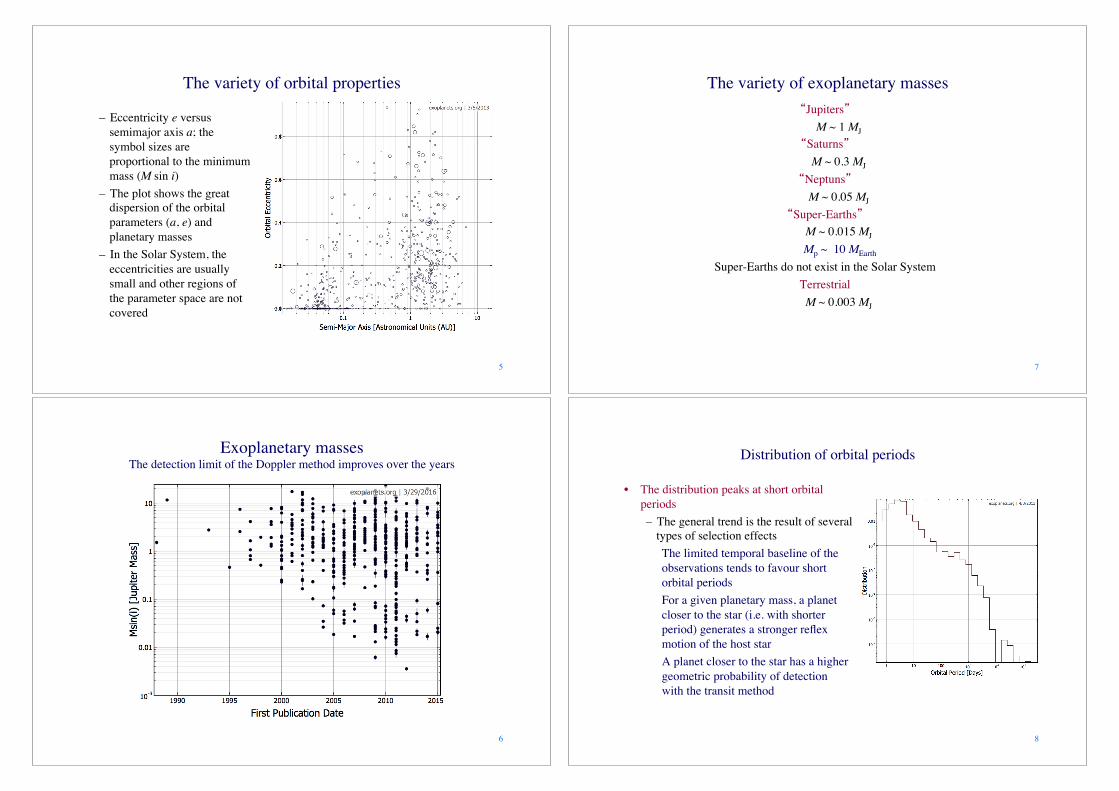
The variety of orbital properties
– Eccentricity e versus semimajor axis a; the symbol sizes are proportional to the minimum mass (M sin i)
– The plot shows the great dispersion of the orbital parameters (a, e) and planetary masses
– In the Solar System, the eccentricities are usually small and other regions of the parameter space are not covered
5
Exoplanetary masses �The detection limit of the Doppler method improves over the years
6
The variety of exoplanetary masses
7
�Jupiters�M ~ 1 MJ
�Saturns�M ~ 0.3 MJ
�Neptuns�M ~ 0.05 MJ
�Super-Earths�M ~ 0.015 MJ
Mp ~ 10 MEarth
Super-Earths do not exist in the Solar SystemTerrestrialM ~ 0.003 MJ
Distribution of orbital periods
• The distribution peaks at short orbital periods – The general trend is the result of several
types of selection effectsThe limited temporal baseline of the observations tends to favour short orbital periodsFor a given planetary mass, a planet closer to the star (i.e. with shorter period) generates a stronger reflex motion of the host star A planet closer to the star has a higher geometric probability of detection with the transit method
8

Distribution of orbital periods
• Evidence for the existence of a peak at P � 3 days– The decrease of frequency at
shorter periods cannot be attributed to selection effects
– The existence of such peak was unexpected from a theoretical point of view
– Provides important constraints on models of planetary formation and evolution
– In particular, suggests the existence of a mechanism that breaks the migration of planets towards the central star
9
Distribution of eccentricities
• The distribution shows the existence of planets in highly eccentric orbits – virtually the whole possible interval of
eccentricities, between 0 and 1, is covered
– the vast majority of eccentricities is higher than in Solar System planets
• Low eccentricity orbits are more frequent – However, the shape of the distribution
is affected by observational selection effects and can vary according to the type of observational method adopted to collect the sample
10
• The large fraction of planets in low-eccentricity orbits is interpreted as the result of orbital evolution in presence of tidal interactions with the host star – Dynamical models indicate that the eccentricity tends to decrease in
the course of planetary system evolution Jackson et al. (2008)
11
Planetary mass versus semimajor axis
• Results from the Doppler method– Most detected planets lie within a
few AU from the central star
• Discovered “hot-Jupiters”, i.e. giant planets within ≤ 1 AU from the stars– Unexpected result from our
previous understanding of the Solar System architecture
12
Mercury’s semimahor axis

Planetary mass versus semimajor axis
• At large distances from the star, the detected planets are quite massive
– Selection effect: at large semimajor axis, only massive planets have the capability to generate a significant reflex motion of the star
– Physical effect: most massive planets form at larger distances from the central star, where the longer orbits provide more material for the planet to form by accretion
13
Radii versus period: Kepler data
14
Large number of small size planets
Exoplanets radii versus semimajor axis
– Sample of exoplanets obtained with the transit method, not corrected for selection bias
– The results are biased because the geometric probability scales as R*/a and the transit depth scales as (Rp/R*)2
– However, the “sub-jovian” desert seems to be real
– Its interpretation is complex an requires invoking planetary migration and disruption (Matsakos & Koenig 2016)
15
Exoplanets radii versus semimajor axis
– A large number of terrestrial-size planets are found, despite the difficulty of detecting small planets
– Terrestrial-size planets are still difficult to detect at large values of semimajor axis
16
�

17
Occurrence rates
– A general result provided by exoplanet surveys is that planetary systems are quite common around stars
– The high occurrence rate favours scenarios in which the process of planetary formation is closely related to the process of stellar formation
– A low occurrence rate would have left room for alternative scenarios, with planets arising from events that are distinct from star formation
An example was the tidal theory, where planets condense from material stripped from a star during an encounter with another starStellar encounters extremely unlikely and would yield a very small fraction of planetary systems, contrary to what we now observe
18
Occurrence rates• The study of occurrence rates corrected for observational selection
effects provides powerful constraints to models of planetary formation• The occurrence rate is the mean number of planets per star having
properties within a specified range– In practice, the planet properties are chosen among those measurable
with a given observational technique – For instance, for a survey performed with the Doppler method one
can define the occurrence rate as the mean number of planets per star having masses and orbital periods within a specified range
– To minimize selection effects, one limits the range of planetary quantities according to the observational limits
– As an example, Mp > 10 M⨁ and P < 1 yr
19
Occurrence rates around FGK stars
20
Trends of occurrence rates
• Within the specified observational limits, occurrence rates can be modelled with analytical functions– For instance, the occurrence rate derived from Doppler surveys of
FGK stars , Mp > 100 M⨁ and P < 5.5 yr can be modelled as
– with α=−0.31±0.20 and β=0.26±0.10 (Cumming et al. 2008)– This result suggests that the planet frequency increases with
decreasing mass and increasing orbital period– The results cannot be extrapolated outside the observational limits

Distribution of planetary masses
– M sin i distribution obtained with the Doppler method • The distribution increases towards values of low mass
– Despite the selection effect that favours the detection of high mass planets– Whether this trend extends to the terrestrial mass regime needs to be
confirmed with a larger sample of Earth-mass planets
21
Mayor et al. (2011)
Distribution of planetary radii
– Once corrected for selection effects, also the distribution of radii indicates that small-size planets are more frequent than large planets
22
23
Occurrence rates of Earth-like planets
• The occurrence rate of Earth-like planets is usually calculated taking into account the planet mass (or size) and the insolation (rather than the orbital period or semimajor axis)– The insolation is a key parameter that governs the planet surface
temperature and habitability
– The motivation for calculating the occurrence rate of Earth-size planets according to their level of insolation is astrobiological
– The choice of the interval of insolations is related to the definition of circumstellar habitable zone (discussed in a subsequent lesson)
24
Occurrence rates of Earth-like planets