existing conditions technical memo
TRANSCRIPT
1
Existing Conditions Technical Memorandum
Technical Memorandum
To: Kevin Jeffers, PE Date: November 19, 2010
From: Tony Wang, PE, PTOE Aziz Rahman, PE
Project: Point Defiance Bypass – Traffic Study Update Nisqually Junction to South Tacoma, Washington
cc:
Buzz Berger, PE WD Baldwin, PE Steve Speth, PE, PTOE Luigi Casinelli, PE
Job No.: 143256
Subject: Existing Conditions Technical Memorandum
1. Introduction
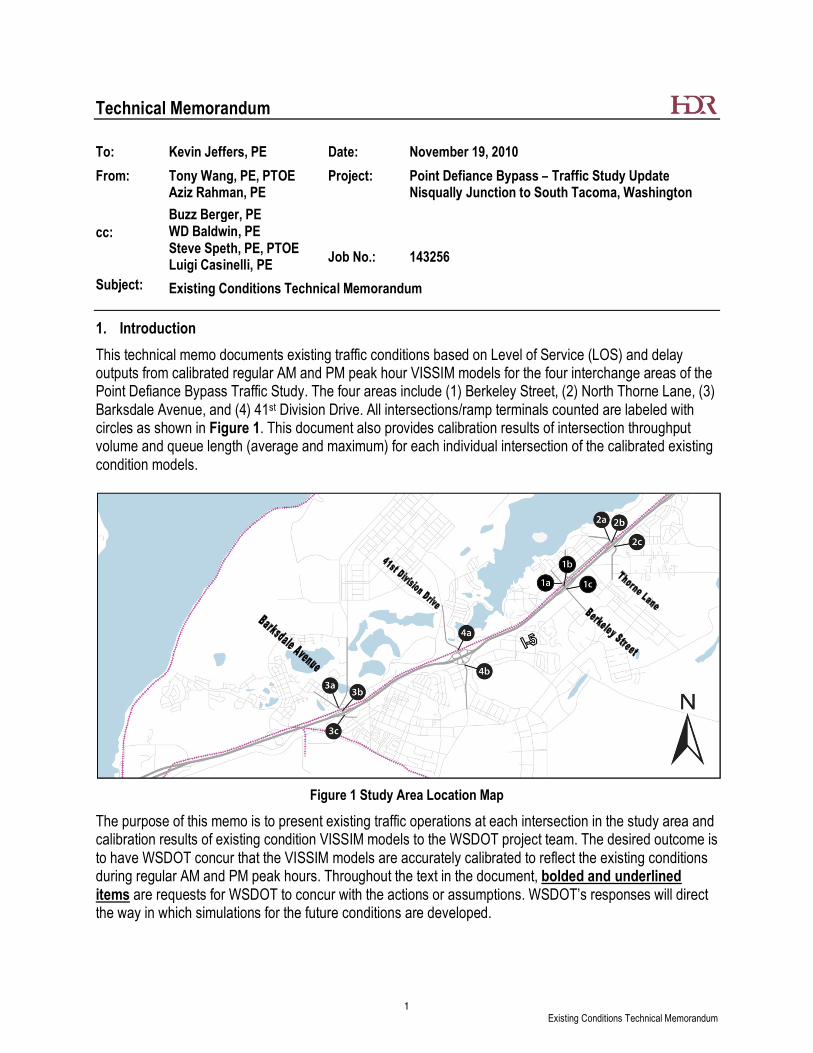
This technical memo documents existing traffic conditions based on Level of Service (LOS) and delay outputs from calibrated regular AM and PM peak hour VISSIM models for the four interchange areas of the Point Defiance Bypass Traffic Study. The four areas include (1) Berkeley Street, (2) North Thorne Lane, (3) Barksdale Avenue, and (4) 41st Division Drive. All intersections/ramp terminals counted are labeled with circles as shown in Figure 1. This document also provides calibration results of intersection throughput volume and queue length (average and maximum) for each individual intersection of the calibrated existing condition models.
Figure 1 Study Area Location Map
The purpose of this memo is to present existing traffic operations at each intersection in the study area and calibration results of existing condition VISSIM models to the WSDOT project team. The desired outcome is to have WSDOT concur that the VISSIM models are accurately calibrated to reflect the existing conditions during regular AM and PM peak hours. Throughout the text in the document, bolded and underlined items are requests for WSDOT to concur with the actions or assumptions. WSDOT’s responses will direct the way in which simulations for the future conditions are developed.

2
Existing Conditions Technical Memorandum
2. Existing VISSIM Simulation Model Development and Calibration Methodology
Existing VISSIM simulation model development includes data collection, geometry and signal timing plan coding, modeling calibration, and field verification. VISSIM simulation model development for all interchange areas is similar to the process presented in an earlier memo for the Berkeley Street VISSIM simulation development. Detailed simulation model development information is presented in Appendix A, including detailed intersection operational performance data for each movement at individual intersections. The operational performance data provides comparisons between the simulation results and observed field data for metrics such as average delay, LOS, and maximum queue length.
Data Collection
Data Collection Units with video cameras were used to collect intersection turning movement counts and the majority of the peak hour queue lengths for the study area. To ensure the traffic counts and queue calibration data were consistent, the traffic counts and queue lengths were collected on the same day for each area/crossing.
Geometry and Signal Timing Plans
Aerial photos obtained from ESRI’s GIS base map were used to develop the geometry of the streets, ramps and intersections employed in the VISSIM models. Existing signal timing plans were provided by WSDOT Olympic Region Traffic Operations Division.
Model Calibration
Both AM and PM peak hour models were calibrated. The calibration of existing VISSIM simulation models was made by comparing modeled volumes against traffic counts and maximum queue length outputs against queue lengths observed on the field videos. The field videos were collected at the same time as the traffic counts were collected to provide good correlation between the videos of the queue lengths and the number of vehicles counted in a given queue. The following calibration targets and general parameters for the calibration are the same as those presented on the Berkeley model development memo discussed with WSDOT on October, 2010. Calibration targets were based on FHWA Traffic Analysis Toolbox Volume III, and are summarized below:
(1) Hourly Flows (Model Versus Observed)
• Individual Link Flows a. Within 100vph for Flow <700vph b. Within 15% for 700vph<Flow<2700vph c. Within 400vph for Flow>2700vph
• All Link Flows: within 5% of sum of all link counts (2) Visual Audits
a. Individual Link Speeds are visually acceptable speed-flow relationship to the satisfaction of analysts and reviewers.
b. Critical Queue Lengths are visually acceptable to the satisfaction of analysts and reviewers.

3
Existing Conditions Technical Memorandum
The parameters selected for the calibration of existing VISSIM simulation models are:
(1) Travel speed constraints at individual segments based on speed limits or adjusted to match the observed discharge flow rates at the signalized intersections.
(2) Connector emergency stop distances (3) Turning movement routing decision point and combined routing to accurately represent ramp
terminal flow pattern (4) Military check point stop durations based on field observation.
Field Verification
Field verification was part of the model development process. It included checking the field detector locations, verifying signal operations, and measuring effective turn pocket lengths, each military check point operations during peak hours, vehicle behaviors (speed reductions and lane utilization, intersection blocking), and other parameters.
3. Existing Intersection Condition Summary
The range of Regular AM and PM peak hour times for individual interchange areas are presented in Table 1. These times were selected to coordinate with the times at which trains were anticipated to arrive at each intersection, based on the preliminary train schedules. The existing traffic operations at each intersection during the regular AM and PM peak hours are presented in Table 2 through Table 5. These tables describe the results of the simulations for each intersection (based on a 20 run average of VISSIM model outputs) in terms of intersection Level of Service (LOS), average delay, worst movement, and the associated maximum queue lengths. Table 2 through Table 5 also include the overall network performance in terms of average delay per vehicle for each area/crossing. For more detailed information, and for comparisons between the VISSIM outputs and the observed field conditions, please refer to Appendix A.
VISSIM quantifies overall and individual intersection delays and queue lengths more realistically than typical HCM methods since VISSIM tracks the individual vehicle interactions in the study corridor that affect overall operating conditions. In this section, intersection performances are measured using VISSIM outputs that might be different from typical HCM methodology. The LOS criteria are based on Highway Capacity Manual (HCM) 2000 metrics which are presented in Appendix B. Appendix C includes the name for each intersection movement approach, illustrated with aerial photos, and provides a key to abbreviations used in this document. For example, “EBL” means eastbound left turn movement, “EBT” means eastbound through movement and “EBR” means eastbound right turn movement at a specific intersection. Appendix D includes the existing signal timing plans used for the existing VISSIM simulation models. Figure 2 through Figure 5 present the maximum queue lengths, based on VISSIM model outputs during the regular AM and PM peak hours displayed on aerial photo backgrounds to provide a visual. The maximum queue lengths are based on 20 simulation runs with random seeds for each simulation model and average (median) of the output values to represent an average day condition. The railroad sections are highlighted in red if the queues extend over the railroad tracks.

4
Existing Conditions Technical Memorandum
Table 1 AM and PM Peak Hours at Each Interchange Area
No. Interchange Areas AM Peak Hour PM Peak Hour
1 Berkeley Street 7:30-8:30 16:30-17:30
2 North Thorne Lane 7:00-8:00 16:30-17:30
3 Barksdale Avenue 7:15-8:15 16:30-17:30
4 41st Division 7:45-8:45 16:00-17:00
Table 2 Berkeley Street VISSIM Outputs - Existing AM and PM Peak Hour Traffic Conditions
No. Intersection Name
AM Peak Hour PM Peak Hour
Intersection LOS
(average delay-sec)
Worst Movement
Worst Movement Maximum Queue
Length-feet
Intersection LOS
(average delay-sec)
Worst Movement (average delay-sec)
Worst Movement Maximum Queue
Length-feet
1a Berkeley Street and
Union Avenue C (21.5)
Berkeley Street WB Left Turn to Camp Murray
230 F (75.3)
Union Avenue Left Turn to Berkeley
Street and I-5
760
1b Berkeley Street and SB I-5 Ramps
C (27.0)
I-5 SB Off-ramp Left Turn to
Madigan Gate
935 B (19)
Berkeley Street EB
Through to I-5 Ramps
320
1c Berkeley Street and NB I-5 Ramps
C (22.0)
Jackson Avenue
(Base) WB Through and Right Turn to
I-5
1110 C (35.0)
Jackson Avenue
(Base) WB Through and Right Turn to
I-5
1245
Network Overall C (24.0) - - D (40.0) - -
Please confirm if the above existing condition simulation for Berkeley Street is acceptable.

5
Existing Conditions Technical Memorandum
Table 3 Thorne Lane VISSIM Outputs - Existing AM and PM Peak Hour Traffic Conditions
No. Intersection Name
AM Peak Hour PM Peak Hour
Intersection LOS
(average delay-sec)
Worst Movement
Worst Movement Maximum Queue
Length-feet
Intersection LOS
(average delay-sec)
Worst Movement (average delay-sec)
Worst Movement Maximum Queue
Length-feet
2a Thorne Lane and Union Avenue
A (7.6)
Union Avenue NB Right Turn to Thorne
Lane and I-5
115 F (52.4) Union Avenue NB Right Turn
to I-5 740
2b Thorne Lane and SB I-
5 Ramps C (26.9)
I-5 SB Off-ramp to
Thorne Lane 615 C (25.6)
I-5 SB Off-ramp to
Thorne Lane 545
2c Thorne Lane and NB I-
5 Ramps C (20.1)
Murray Rd/Thorne Lane WB
Through and Right to I-5 Ramps
425 B (17.2)
Murray Rd/Thorne Lane WB
Through and Right to I-5 Ramps
715
Network Overall C (20.8) - - C (27.5) - -
Please confirm if the above existing condition simulation for North Thorne Lane is acceptable.

6
Existing Conditions Technical Memorandum
Table 4 Barksdale Avenue VISSIM Outputs - Existing AM and PM Peak Hour Traffic Conditions
No. Intersection Name
AM Peak Hour PM Peak Hour
Intersection LOS
(average delay-sec)
Worse Movement
Worst Movement Maximum Queue
Length-feet
Intersection LOS
(average delay-sec)
Worst Movement (average delay-sec)
Worst Movement Maximum Queue
Length-feet
3a Barksdale Avenue and DuPont/Steilacoom
C (21.1)
Steilacoom Road SB Left
Turn to Barksdale Avenue and I-5 Ramps
415 B (14.5)
Steilacoom Road SB Left
Turn to Barksdale Avenue and I-5 Ramps
285
3b Barksdale Avenue and
SB I-5 Ramps B (16.2)
Barksdale Avenue EB Through to I-5 and DuPont Gate (Base)
330 A (8.9)
Barksdale Avenue WB Through and Left to I-5
330
3c Barksdale Avenue and
NB I-5 Ramps C (29.6)
I-5 NB Off-ramp Left Turn to Barksdale Avenue
415 D (53.1)
Barksdale Avenue/
DuPont Gate (Base) WB Through and Right Turn to
I-5
1355
Network Overall C (22.4) - - C (24.3) - -
Please confirm if the above existing condition simulation for Barksdale Avenue is acceptable.

7
Existing Conditions Technical Memorandum
Table 5 41st Division Drive VISSIM Outputs - Existing AM and PM Peak Hour Traffic Conditions
No. Intersection Name
AM Peak Hour PM Peak Hour
Intersection LOS
(average delay-sec)
Worst Movement
Worst Movement Maximum Queue
Length-feet
Intersection LOS
(average delay-sec)
Worst Movement (average delay-sec)
Worst Movement Maximum Queue
Length-feet
4a 41st Division Drive at
I-5 SB Ramps A (3.7)
I-5 SB Off-Ramp to Lewis Main Gate (Base)
395 A (6.3)
41st Division Dr EB
Through and Right Turn to I-5 Ramps
Over Railroad Tracks
170
4b 41st Division Drive at
I-5 NB Ramps A (3.1)
I-5 NB Off-Ramp to Lewis Main Gate (Base)
370 B (12.9)
41st Division Dr WB/ Lewis Main Gate (Base) to I-5 NB On-ramp
1180
Network Overall A (3.4) - - B (10.7) - -
Please confirm if the above existing condition simulation for 41st Division Drive is acceptable.

8
Existing Conditions Technical Memorandum
Figure 2 Berkeley Street– Existing AM and PM Peak Hour Maximum Queue Length (VISSIM Outputs)
AM Peak Hour
Legend
PM Peak Hour
Queue exceeding RR tracks
Maximum Queue Length Representation

9
Existing Conditions Technical Memorandum
Figure 3 N. Thorne Lane– Existing AM and PM Peak Hour Maximum Queue Length (VISSIM Outputs)
Figure 4 Barksdale Avenue– Existing AM and PM Peak Hour Maximum Queue Length (VISSIM Outputs)
AM Peak Hour
Legend
PM Peak Hour
Queue exceeding RR tracks
Maximum Queue Representation
AM Peak Hour
Legend
PM Peak Hour
Queue exceeding RR tracks
Maximum Queue Length Representation

10
Existing Conditions Technical Memorandum
Figure 5 41st Division Drive– Existing AM and PM Peak Hour Maximum Queue Length (VISSIM Outputs) Please confirm if the above queue length representations are reasonable.
AM Peak Hour
Legend
PM Peak Hour
Queue exceeding RR tracks
Maximum Queue Length Representation