exhibition attendees' smart technology actual usage: a case of near field communications
Upload: international-federation-for-information-technologies-in-travel-and-tourism-ifitt
Post on 19-Jul-2015
24 views
TRANSCRIPT

ENTER 2015 Research Track Slide Number 1
Exhibition Attendees' Smart Technology Actual Usage
: A Case of Near Field Communications
Heejeong Hana, Namho Chungb, Chulmo Kooc, and Kyoung Jun Leed
Kyung Hee University, Republic of [email protected]; [email protected]; [email protected]; [email protected]
http://www.strc.khu.ac.kr
ENTER 2015 Research Track Slide Number 2
CONTENTS
1. Introduction
2. Theoretical Background
3. Research model and Hypotheses
4. Research Methodology
5. Data Analysis and Results
6. Conclusions
ENTER 2015 Research Track Slide Number 3
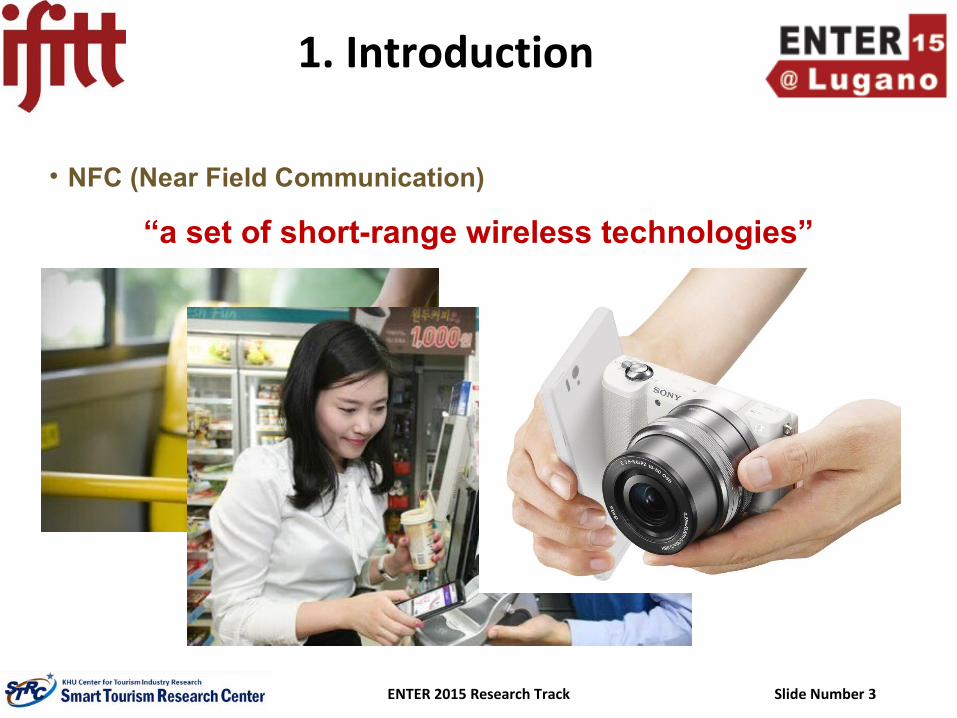
1. Introduction
• NFC (Near Field Communication)
“a set of short-range wireless technologies”
ENTER 2015 Research Track Slide Number 4
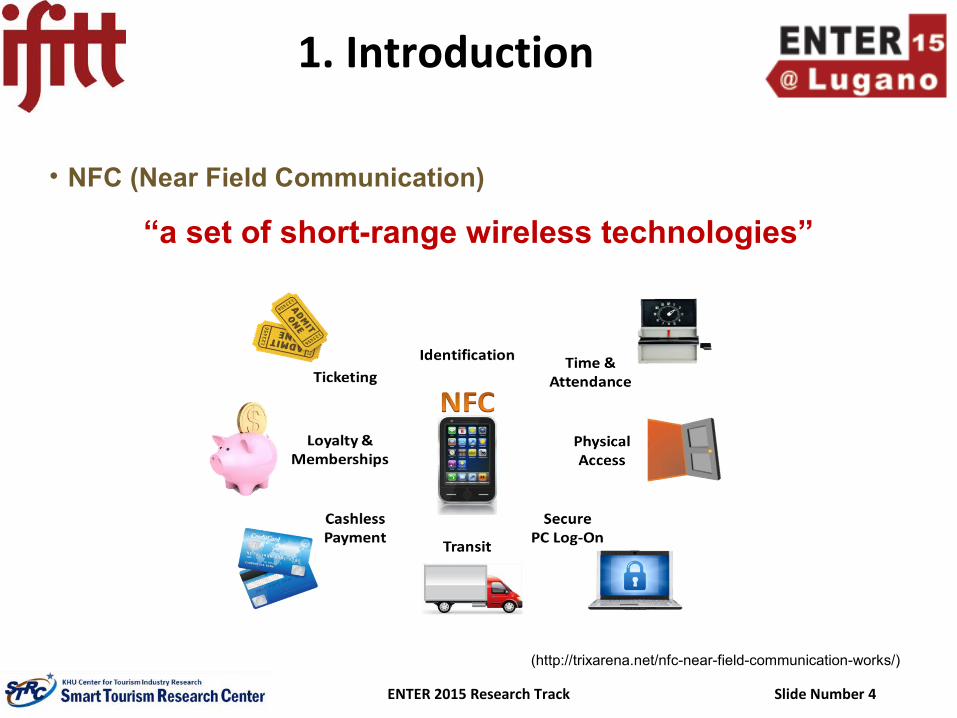
1. Introduction
• NFC (Near Field Communication)
“a set of short-range wireless technologies”
(http://trixarena.net/nfc-near-field-communication-works/)
ENTER 2015 Research Track Slide Number 5
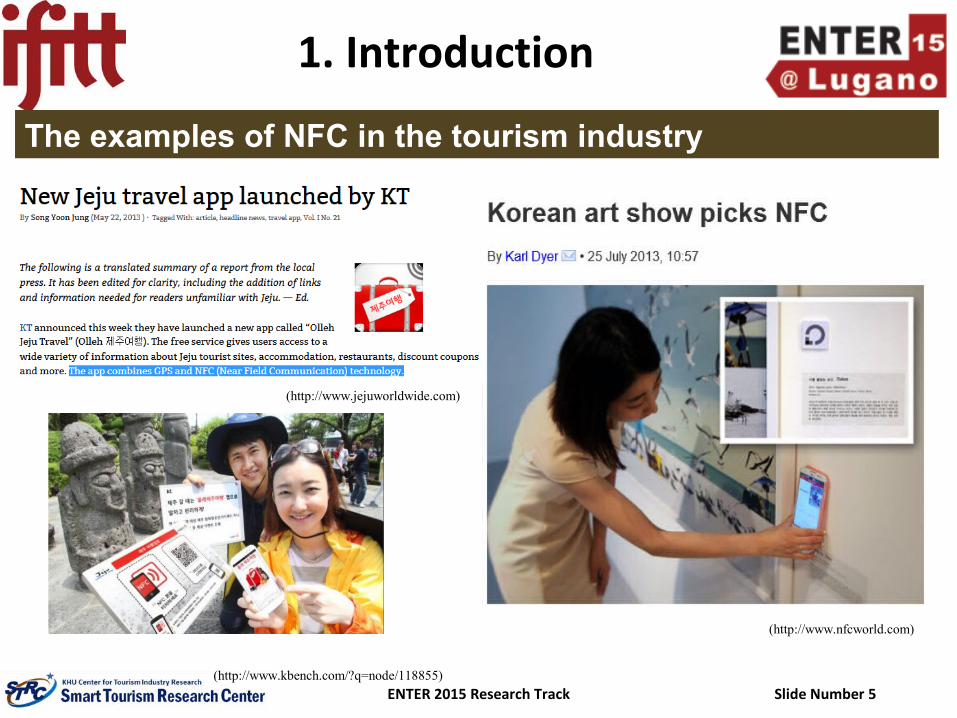
1. Introduction
The examples of NFC in the tourism industry
(http://www.jejuworldwide.com)
(http://www.nfcworld.com)
(http://www.kbench.com/?q=node/118855)
ENTER 2015 Research Track Slide Number 6
1. Introduction
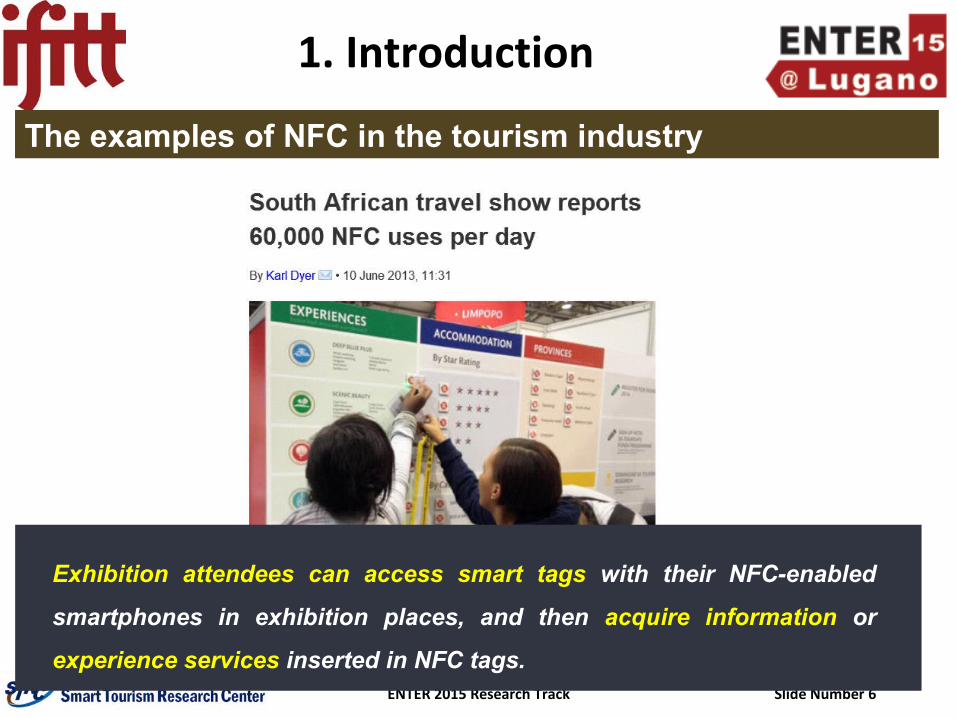
(http://www.nfcworld.com)
The examples of NFC in the tourism industry
Exhibition attendees can access smart tags with their NFC-enabled
smartphones in exhibition places, and then acquire information or
experience services inserted in NFC tags.
ENTER 2015 Research Track Slide Number 7
1. Introduction
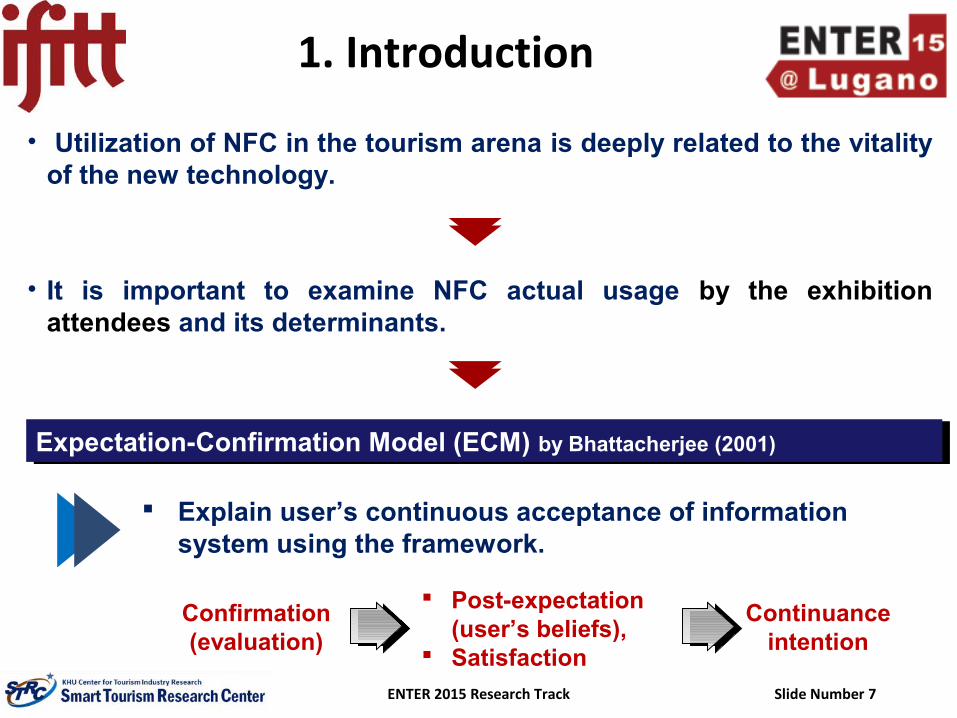
• Utilization of NFC in the tourism arena is deeply related to the vitality of the new technology.
• It is important to examine NFC actual usage by the exhibition attendees and its determinants.
Expectation-Confirmation Model (ECM) by Bhattacherjee (2001) Expectation-Confirmation Model (ECM) by Bhattacherjee (2001)
Explain user’s continuous acceptance of information system using the framework.
Confirmation (evaluation)
Continuance intention
Post-expectation (user’s beliefs),
Satisfaction
ENTER 2015 Research Track Slide Number 8
1. Introduction
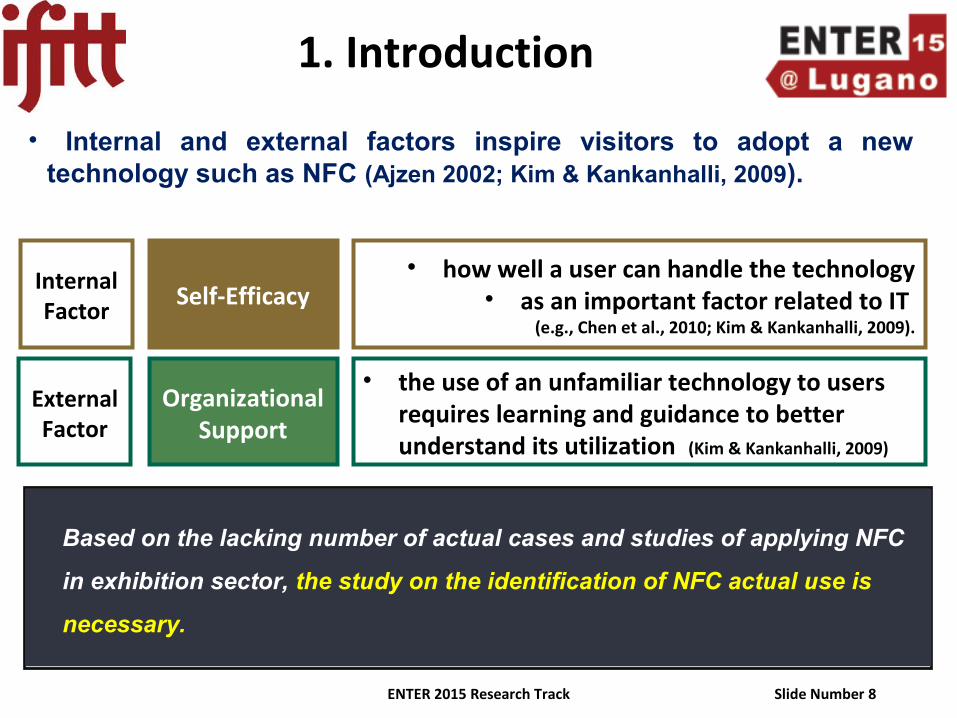
InternalFactor
ExternalFactor
Self-Efficacy
OrganizationalSupport
• Internal and external factors inspire visitors to adopt a new technology such as NFC (Ajzen 2002; Kim & Kankanhalli, 2009).
• how well a user can handle the technology• as an important factor related to IT
(e.g., Chen et al., 2010; Kim & Kankanhalli, 2009).
• the use of an unfamiliar technology to users requires learning and guidance to better understand its utilization (Kim & Kankanhalli, 2009)
However, previous studies on NFC have focused only on technical
understanding, development and behavioral intention (e.g., Chen & Chang,
2013; Egger, 2013; López-de-Ipiña et al., 2007; Luarn & Juo, 2010).
Based on the lacking number of actual cases and studies of applying NFC
in exhibition sector, the study on the identification of NFC actual use is
necessary.
ENTER 2015 Research Track Slide Number 9
1. Introduction
(1) identify the critical internal and external factors influencing on
NFC user’s actual use in the context of exhibition
(2) examine how those factors influence visitor’s perceived
confirmation, NFC quality, NFC satisfaction, planned behavior
and NFC actual use
Research Objectives
ENTER 2015 Research Track Slide Number 10
2.Theoretical Background
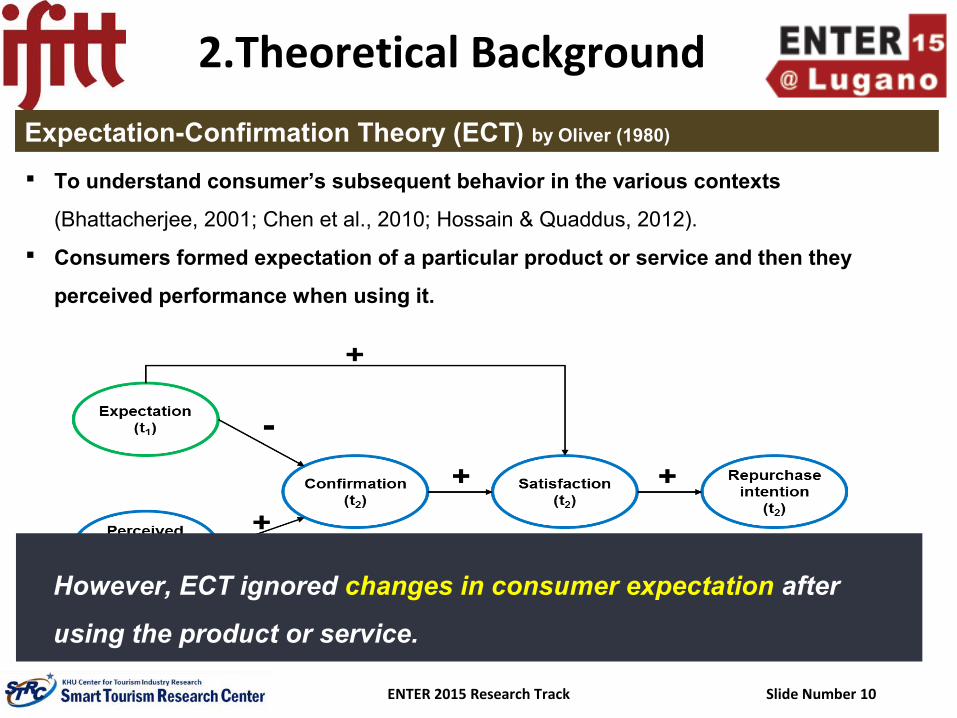
To understand consumer’s subsequent behavior in the various contexts
(Bhattacherjee, 2001; Chen et al., 2010; Hossain & Quaddus, 2012).
Consumers formed expectation of a particular product or service and then they
perceived performance when using it.
Expectation-Confirmation Theory (ECT) by Oliver (1980)
Figure 1. ECT Framework
However, ECT ignored changes in consumer expectation after
using the product or service.

ENTER 2015 Research Track Slide Number 11
2.Theoretical Background
Apply ECT to the use of information system.
Combined with Technology Acceptance Model and ECT.
Focus on post-acceptance variables.
Post-expectation such as perceived belief was replaced with pre-expectation because
its definition is consistent with one of the expectations in ECT.
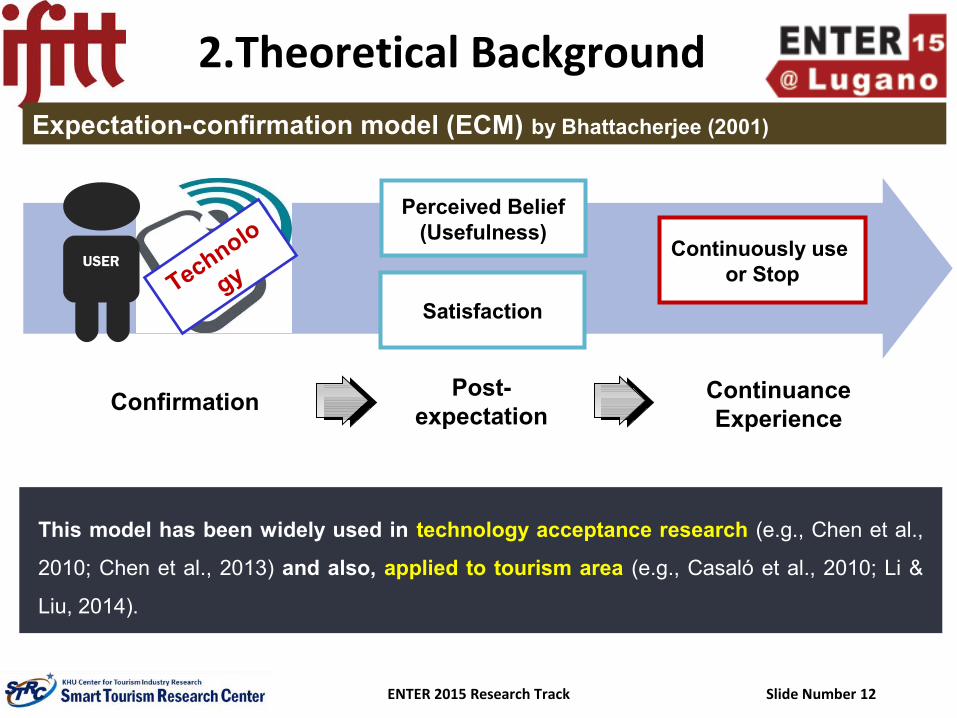
Expectation-confirmation model (ECM) by Bhattacherjee (2001)
Post Expectation
Post Performance
Figure 2. ECM Framework
ENTER 2015 Research Track Slide Number 12
2.Theoretical BackgroundExpectation-confirmation model (ECM) by Bhattacherjee (2001)
Technolo
gyUSER
Satisfaction
Continuously use or Stop
ConfirmationPost-
expectation
Perceived Belief(Usefulness)
Continuance Experience
This model has been widely used in technology acceptance research (e.g., Chen et al.,
2010; Chen et al., 2013) and also, applied to tourism area (e.g., Casaló et al., 2010; Li &
Liu, 2014).
ENTER 2015 Research Track Slide Number 13
2.Theoretical Background
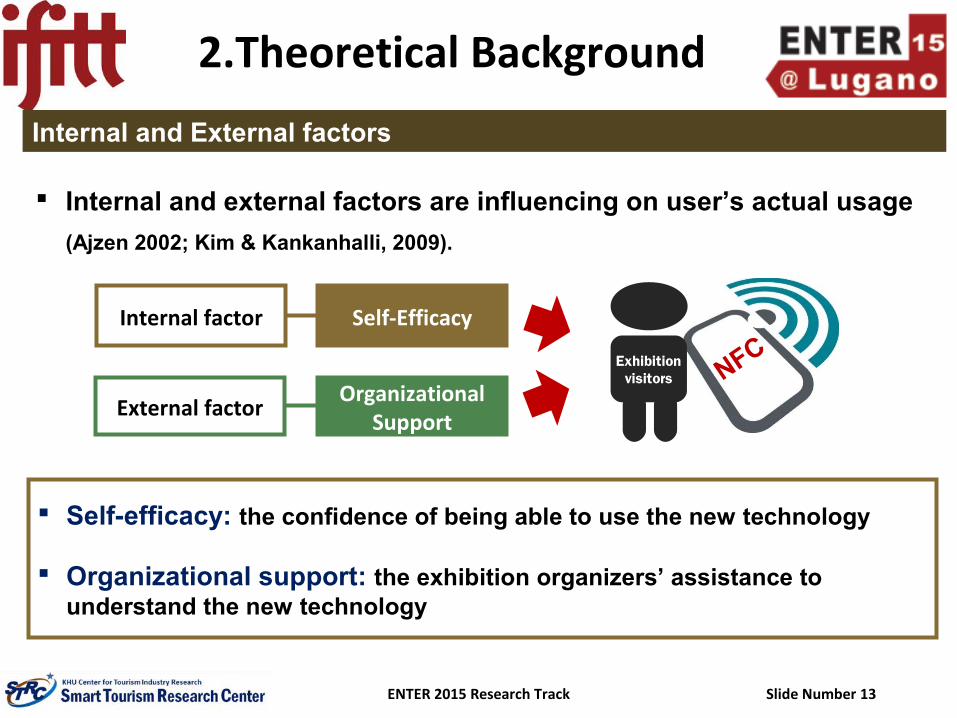
Internal and external factors are influencing on user’s actual usage
(Ajzen 2002; Kim & Kankanhalli, 2009).
NFCExhibitionvisitors
Internal factor
External factor
Self-Efficacy
OrganizationalSupport
Self-efficacy: the confidence of being able to use the new technology Organizational support: the exhibition organizers’ assistance to
understand the new technology
Internal and External factors
ENTER 2015 Research Track Slide Number 14
H7
Self-Efficacy
Confirmation
NFCSatisfaction
OrganizationalSupport
NFCQuality
Planned Behavior
NFCActual Use
H1
H2
H5 H8
H3
H4
H6
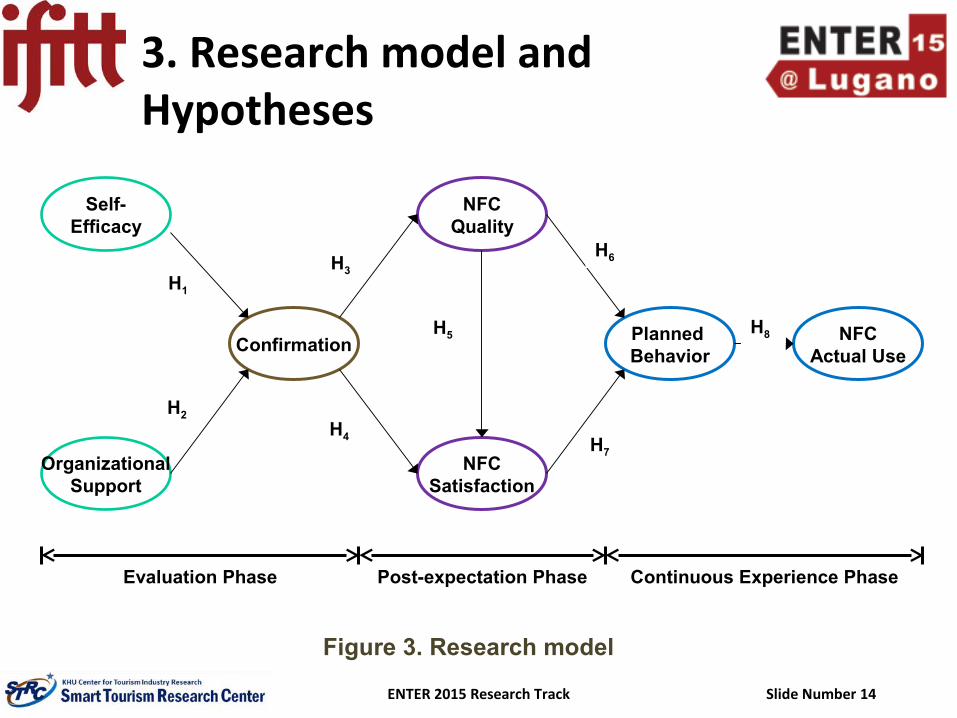
Evaluation Phase Post-expectation Phase Continuous Experience Phase
3. Research model and Hypotheses
Figure 3. Research model
ENTER 2015 Research Track Slide Number 15
H8
H3
H4
H1
H2H7
Self-Efficacy
Confirmation
NFCSatisfaction
OrganizationalSupport
NFCQuality
Planned Behavior
NFCActual Use
H5
H6
3. Research model and Hypotheses
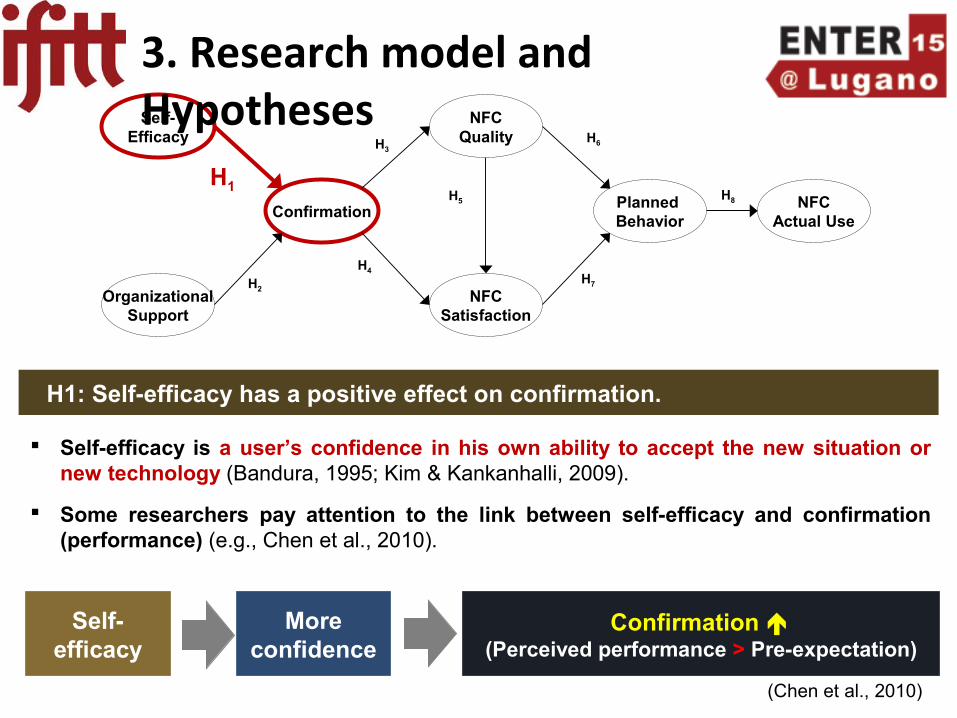
Self-efficacy is a user’s confidence in his own ability to accept the new situation or new technology (Bandura, 1995; Kim & Kankanhalli, 2009).
Some researchers pay attention to the link between self-efficacy and confirmation (performance) (e.g., Chen et al., 2010).
H1: Self-efficacy has a positive effect on confirmation.
Confirmation (Perceived performance > Pre-expectation)
More confidence
Self-efficacy
(Chen et al., 2010)

ENTER 2015 Research Track Slide Number 16
H8
H3
H4
H1
H2
H7
Self-Efficacy
Confirmation
NFCSatisfaction
OrganizationalSupport
NFCQuality
Planned Behavior
NFCActual Use
H5
H6
3. Research model and Hypotheses
H2: Organizational support has a positive effect on confirmation.
Organizational support is defined as the perceived assistance of exhibition organizers to make visitors easily adopt NFC in an exhibition (Kim & Kankanhalli, 2009).
In the context of adopting a new technology, learning and guidance are needed (Igbaria et al., 1996; Kim & Kankanhalli, 2009).
This organizational support to users improves their performance (Lee et al. 2010, Tzeng, 2011) .
The level of confirmation organizational support
ENTER 2015 Research Track Slide Number 17
H8
H3
H4
H1
H2H7
Self-Efficacy
Confirmation
NFCSatisfaction
OrganizationalSupport
NFCQuality
Planned Behavior
NFCActual Use
H5
H6
3. Research model and Hypotheses
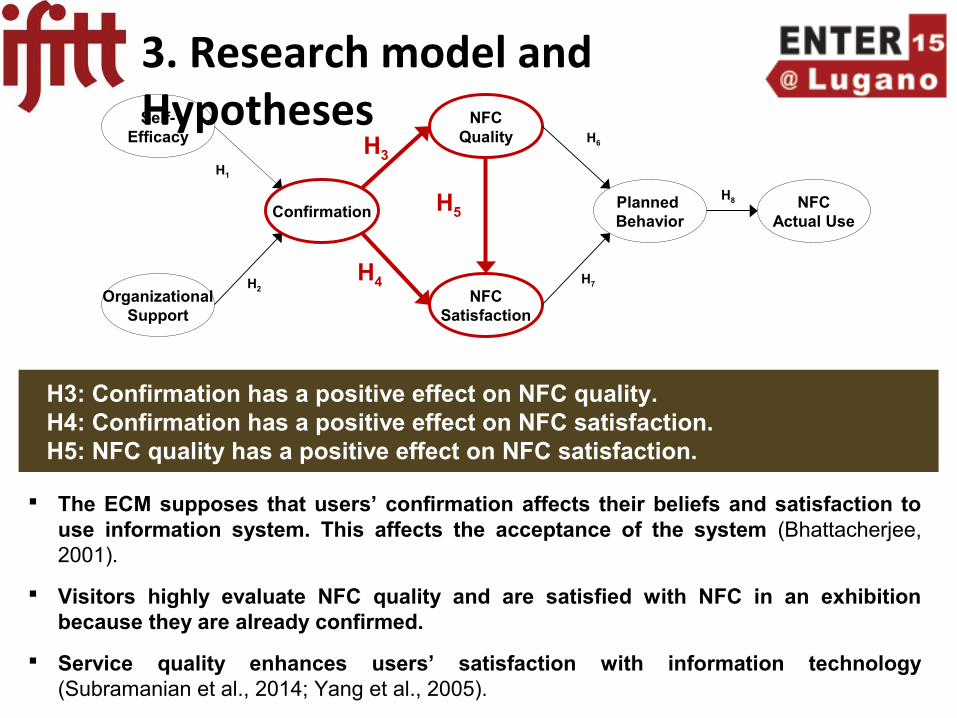
H3: Confirmation has a positive effect on NFC quality.H4: Confirmation has a positive effect on NFC satisfaction.H5: NFC quality has a positive effect on NFC satisfaction.
The ECM supposes that users’ confirmation affects their beliefs and satisfaction to use information system. This affects the acceptance of the system (Bhattacherjee, 2001).
Visitors highly evaluate NFC quality and are satisfied with NFC in an exhibition because they are already confirmed.
Service quality enhances users’ satisfaction with information technology (Subramanian et al., 2014; Yang et al., 2005).
ENTER 2015 Research Track Slide Number 18
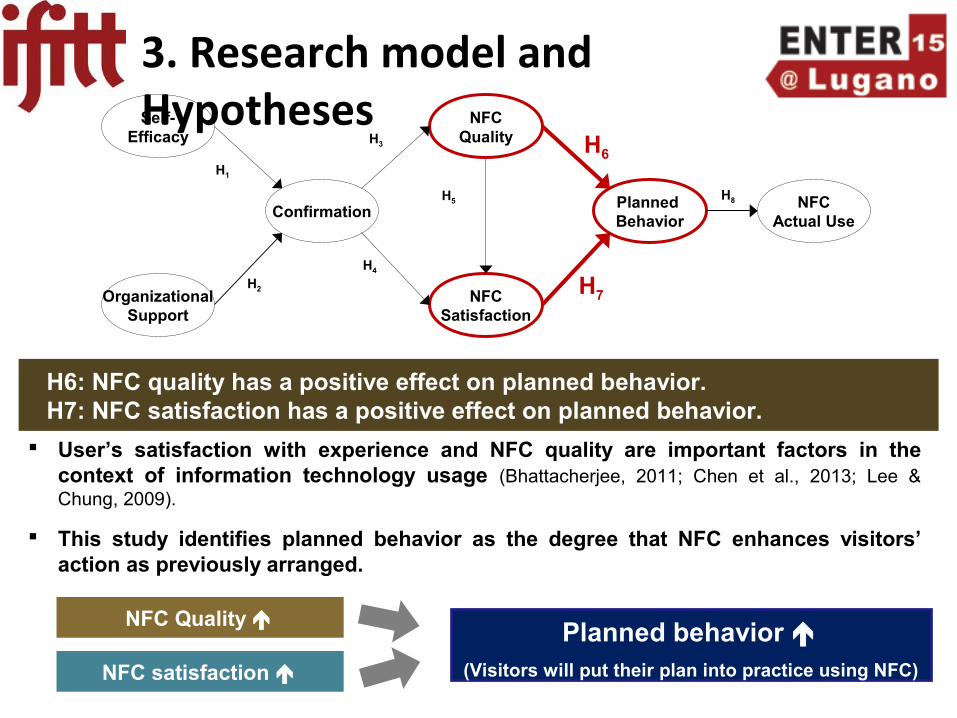
User’s satisfaction with experience and NFC quality are important factors in the context of information technology usage (Bhattacherjee, 2011; Chen et al., 2013; Lee & Chung, 2009).
This study identifies planned behavior as the degree that NFC enhances visitors’ action as previously arranged.
H7
H6
H8
H3
H4
H1
H2
Self-Efficacy
Confirmation
NFCSatisfaction
OrganizationalSupport
NFCQuality
Planned Behavior
NFCActual Use
H5
3. Research model and Hypotheses
H6: NFC quality has a positive effect on planned behavior.H7: NFC satisfaction has a positive effect on planned behavior.
NFC Quality Planned behavior
(Visitors will put their plan into practice using NFC)NFC satisfaction
ENTER 2015 Research Track Slide Number 19
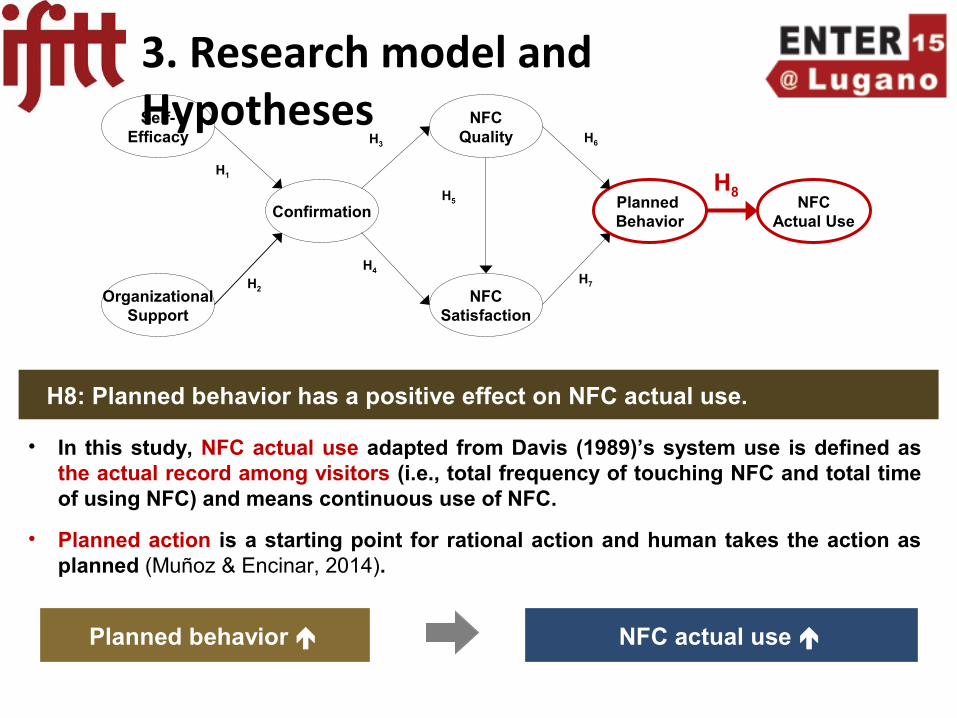
• In this study, NFC actual use adapted from Davis (1989)’s system use is defined as the actual record among visitors (i.e., total frequency of touching NFC and total time of using NFC) and means continuous use of NFC.
• Planned action is a starting point for rational action and human takes the action as planned (Muñoz & Encinar, 2014).
H7
H6
H8
H3
H4
H1
H2
Self-Efficacy
Confirmation
NFCSatisfaction
OrganizationalSupport
NFCQuality
Planned Behavior
NFCActual Use
H5
3. Research model and Hypotheses
H8: Planned behavior has a positive effect on NFC actual use.
NFC actual use Planned behavior

ENTER 2015 Research Track Slide Number 20
4. Research Methodology
4.1 Instrument development
• We modeled the higher-order construct for actual use, as the function of two formative dimensions; touch frequency and usage time.
• The touch frequency and usage time of NFC were derived from a real log file.
Constructs From Scale
Self-efficacy (3 items)Kim & Kankanhalli (2009)
7-poing Likert scale
Organizational support (3 items)
Confirmation (3 items)Bhattacherjee (2001)
Satisfaction (4 items)
NFC quality (5 items) Lee & Chung (2009)
Planned behavior (2 items) Self-deveolped
NFC actual useTouch frequency
real log file from organizerUsage time
the gap time between initial touch and final touch time
ENTER 2015 Research Track Slide Number 21
4. Research Methodology
4.1 Instrument development
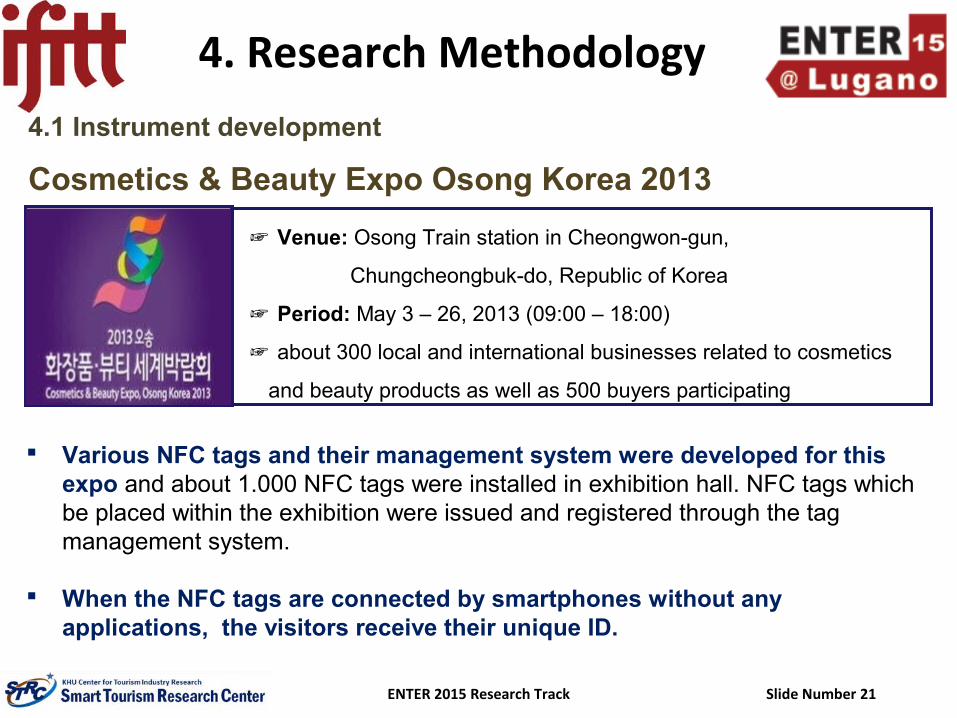
☞ Venue: Osong Train station in Cheongwon-gun,
Chungcheongbuk-do, Republic of Korea
☞ Period: May 3 – 26, 2013 (09:00 – 18:00)
☞ about 300 local and international businesses related to cosmetics
and beauty products as well as 500 buyers participating
Cosmetics & Beauty Expo Osong Korea 2013
Various NFC tags and their management system were developed for this expo and about 1.000 NFC tags were installed in exhibition hall. NFC tags which be placed within the exhibition were issued and registered through the tag management system.
When the NFC tags are connected by smartphones without any applications, the visitors receive their unique ID.
ENTER 2015 Research Track Slide Number 22
4. Research Methodology
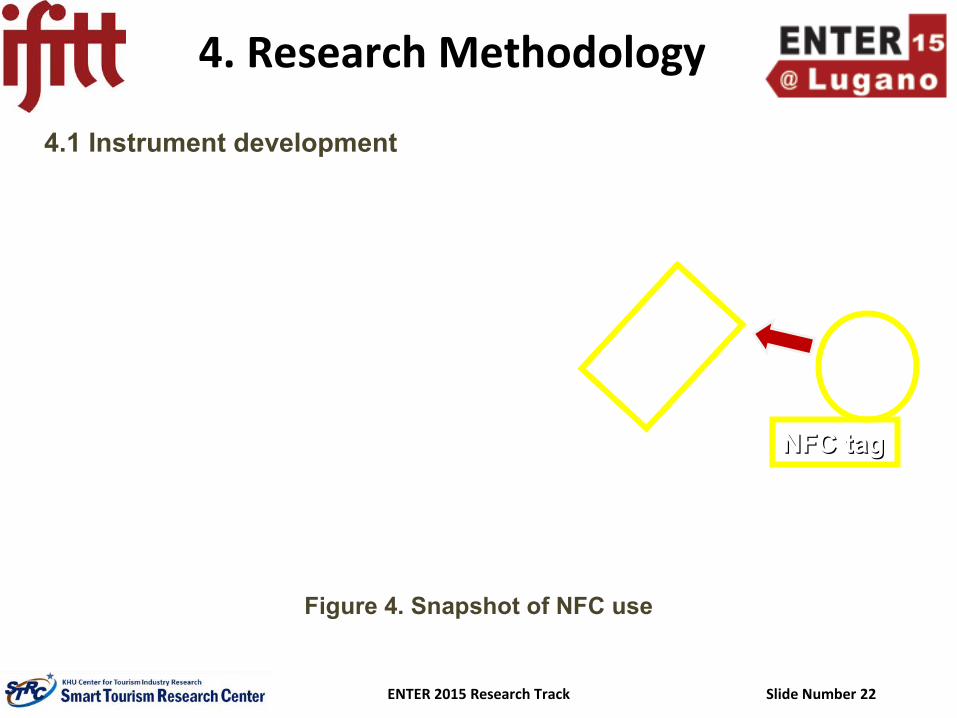
Figure 4. Snapshot of NFC use
4.1 Instrument development
NFC tagNFC tag

ENTER 2015 Research Track Slide Number 23
4. Research Methodology
4.1 Instrument development
Figure 5. Snapshot of NFC services
NFC tags •Recommend popular exhibition halls and surrounding attractions
•Exchange business cards
•Offer discount coupons for products, exhibition information catalogues, and an
exhibition map

ENTER 2015 Research Track Slide Number 24
4. Research Methodology
4.1 Instrument development
387 questionnaires
Data Collection
• Period: May 17 to 21, 2013
• Sample: the visitors who used NFC in the exhibition
• Each staff handed out a flyer about introduction and usage of NFC at the entrance of the exhibition.
• After several hours, visitors answered the self-administered questionnaire at the exit.
• In Total, 614 respondents participated and 227 of them were eliminated due to inconsistent responses or questionnaires without visitor’s ID.

ENTER 2015 Research Track Slide Number 25
4. Research Methodology
Characteristics n % Characteristics n %
GenderMale 144 37.2
Occupation
Worker 175 45.2
Female 243 62.8 Professional 89 23.0
Age
Under 20 3 0.8 Self-employed 23 5.9
20~29 97 25.1 Homemaker 68 17.6
30~39 148 38.2 Others 32 8.3
40~49 111 28.7
Monthly Income
Less than 1 million won* 11 2.8
50~59 20 5.2 1~1.9 million won 88 22.7
Over 60 6 1.6 2~2.9 million won 119 30.7
None 2 0.5 3~3.9 million won 63 16.3
Education
Middle and high school
80 20.7 4~4.9 million won 51 13.2
2 year college 107 27.6 5~6.9 million won 22 5.7
University 159 41.1 7~9.9 million won 14 3.6
Graduate school 39 10.1 Over 10 million won 10 2.6
None 2 0.5 None 9 2.3
Total 387 100.0 Total 387 100.0
4.2 Data collection
Table 1. Demographic information of respondents

ENTER 2015 Research Track Slide Number 26 Note. a) Composite Reliability, b) average variance extracted
Constructs VariablesStandardiz
edloadings
C.R.a) AVE b) α
Self-efficacy
Based on my own knowledge, skills and abilities, using NFC would be easy for me.
0.908
0.942 0.845 0.908I am able to use NFC without the help of others. 0.944
I am able to change to use NFC reasonably well on my own. 0.905
Organization support
The Expo provides me guidance on how to use NFC. 0.922
0.952 0.869 0.924The Expo provides the necessary help and resources to enable
me to use NFC.0.950
I am given the necessary support and assistance to use NFC by the Expo.
0.924
Confirmation
My experience with using NFC was better than what I expected. 0.915
0.950 0.865 0.921The service level provided by NFC was better than what I
expected.0.940
Overall, most of my expectations from using NFC were confirmed.
0.935
NFCQuality
NFC is easy to access. 0.906
0.957 0.816 0.943
NFC is reliable. 0.922
The connection speed to NFC is fast. 0.904
The screen configuration in NFC is simple and easy to see. 0.913
The NFC provides me with helpful information of the exhibition. 0.870
5. Data Analysis and Results
Table 2. Descriptive statistics of constructs
5.1 Measurement Model
(continued)

ENTER 2015 Research Track Slide Number 27
Constructs VariablesStandardiz
edloadings
C.R.a) AVE b) α
NFCSatisfaction
I felt very satisfied about my overall experience of NFC use. 0.938
0.964 0.869 0.950
I felt very pleased about my overall experience of NFC use. 0.944
I felt very contented about my overall experience of NFC use. 0.936
I felt absoulutely delighted about my overall experience of NFC use.
0.911
PlannedBehavior
I adopt information as initially planned in this exhibition. 0.9270.921 0.854 0.829
I could watch this exhibition according to the schedule. 0.921
NFCActual Use
Total frequency of NFC touch 0.6770.794 0.665 -
NFC Usage time 0.933
5. Data Analysis and Results
Table 2. Descriptive statistics of constructs
Note. a) Composite Reliability, b) average variance extracted
5.1 Measurement Model
ENTER 2015 Research Track Slide Number 28
5. Data Analysis and Results
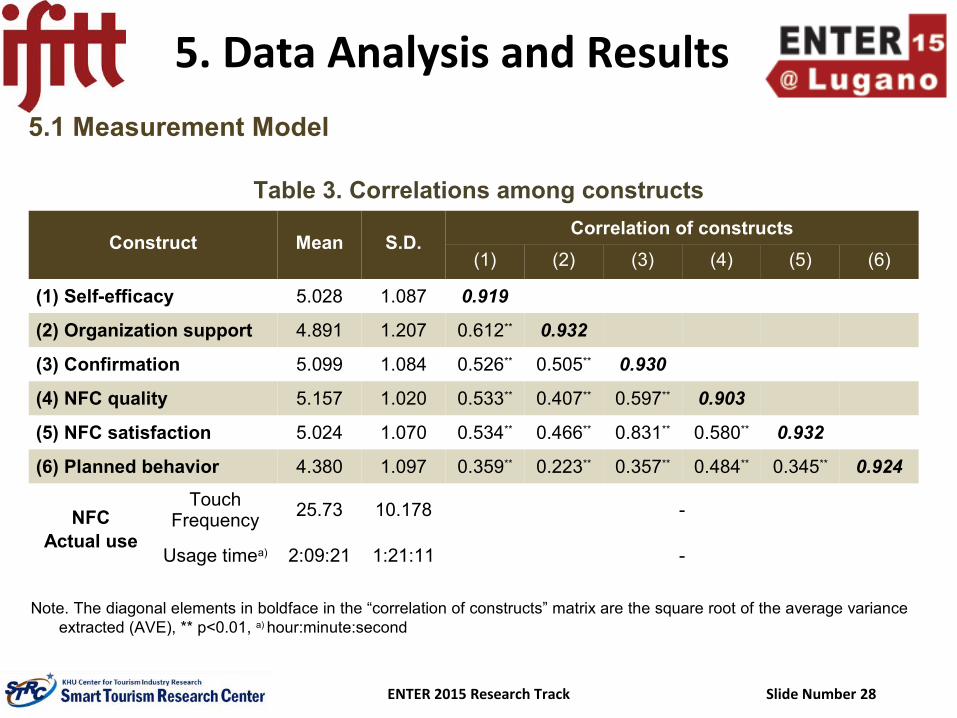
Table 3. Correlations among constructs
Note. The diagonal elements in boldface in the “correlation of constructs” matrix are the square root of the average variance extracted (AVE), ** p<0.01, a) hour:minute:second
5.1 Measurement Model
Construct Mean S.D.Correlation of constructs
(1) (2) (3) (4) (5) (6)
(1) Self-efficacy 5.028 1.087 0.919
(2) Organization support 4.891 1.207 0.612** 0.932
(3) Confirmation 5.099 1.084 0.526** 0.505** 0.930
(4) NFC quality 5.157 1.020 0.533** 0.407** 0.597** 0.903
(5) NFC satisfaction 5.024 1.070 0.534** 0.466** 0.831** 0.580** 0.932
(6) Planned behavior 4.380 1.097 0.359** 0.223** 0.357** 0.484** 0.345** 0.924
NFCActual use
Touch Frequency
25.73 10.178 -
Usage timea) 2:09:21 1:21:11 -
ENTER 2015 Research Track Slide Number 29
5. Data Analysis and Results
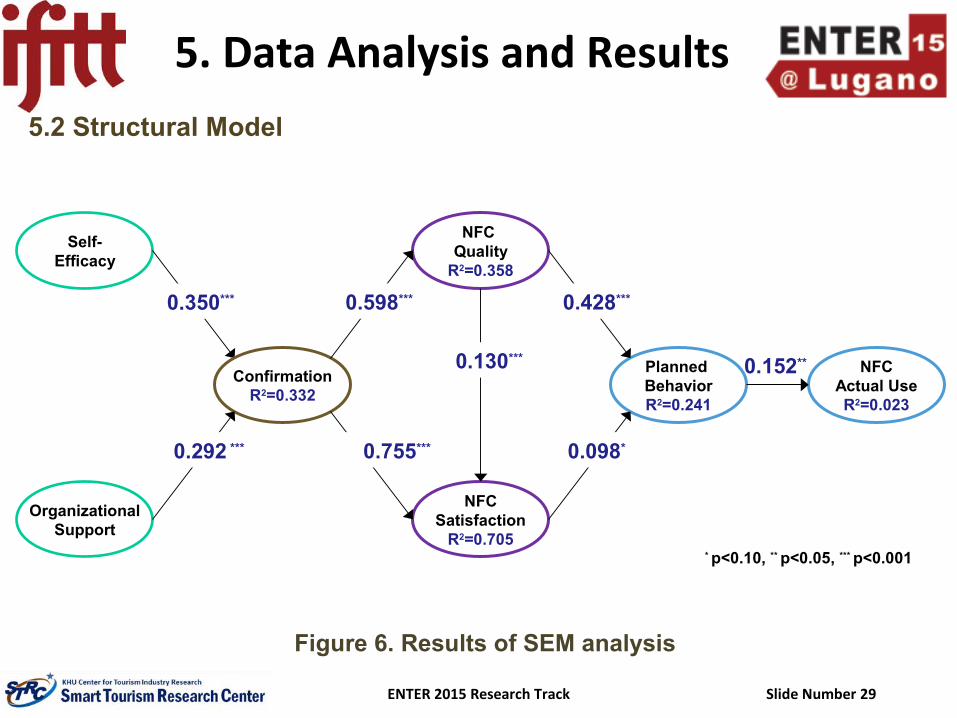
0.152**
Self-Efficacy
ConfirmationR2=0.332
NFCSatisfaction
R2=0.705
OrganizationalSupport
NFC Quality
R2=0.358
Planned BehaviorR2=0.241
NFCActual UseR2=0.023
0.350***
0.292 ***
0.130***
0.598***
0.755*** 0.098*
0.428***
* p<0.10, ** p<0.05, *** p<0.001
Figure 6. Results of SEM analysis
5.2 Structural Model

ENTER 2015 Research Track Slide Number 30
5. Data Analysis and Results
5.2 Structural Model
Table 4. Standardized Structural Estimates and Hypotheses tests.
Hypothesis Path Estimates t-value Results
H1 Self-efficacy → Confirmation 0.350 5.704 Supported
H2Organizational
support→ Confirmation 0.292 4.609 Supported
H3 Confirmation → NFC quality 0.598 15.123 Supported
H4 Confirmation → NFC satisfaction 0.755 21.956 Supported
H5 NFC quality → NFC satisfaction 0.130 3.678 Supported
H6 NFC quality → Planned behavior 0.428 6.779 Supported
H7 NFC satisfaction → Planned behavior 0.098 1.841 Supported
H8 Planned behavior → NFC actual use 0.152 2.563 Supported

ENTER 2015 Research Track Slide Number 31
6. Conclusions
– Personally, though visitors may handle NFC well, exhibition organizer’s assistance also are necessary so that users perceive its performance more than they expected.
– In order to increase the usage of a new technology, interested parties (i.e., DMOs, tourism applications developers, tourism marketers, and its associated organizations) should build experience centers or attempt promotions and provide assistances for tourists using NFC.
Self-efficacy and organizational support positively affected confirmation (H1 and H2) .

ENTER 2015 Research Track Slide Number 32
6. Conclusions
– NFC developers and exhibition organizers should try to meet visitor’s needs related to NFC.
Confirmation positively affected NFC actual use via NFC quality, NFC satisfaction, and
planed behavior (H3, H4, H5, H6, H7, and H8) .
H1
H2
H3
H4
H5
H6
H7
H8

ENTER 2015 Research Track Slide Number 33
6. Conclusions
– This study attempted to empirically explain the actual usage of NFC in
tourism based on ECM with a real NFC log data that presented visitors’ use
time and touch frequencies.
– Our theoretical attempt is the start of a promising era for tourism industry.
Theoretical Implications
In line with this, this study tried to understand visitor’s actual NFC use with ECM.
Actual usage is directly linked with benefits from organizational investment, vitality and advance in technology (Bhattacherjee, 2001; Li & Liu, 2014).

ENTER 2015 Research Track Slide Number 34
6. Conclusions
– This study used the data in only one exhibition, which limits generalization.
⇒ More research should be conducted about NFC in the context of tourism.
– For better understanding NFC actual use, future study should be applied to
other factors, such as technical factors, social influence, affective factors and
visitor’s personality.
Limitation