exhibit ii financial statement ratios draft based on
TRANSCRIPT

2017 2018 2019 2020 2021 2022 2023Profitability Ratios
Return on Assets 10.09% 14.91% 9.38% 8.57% 8.11% 8.08% 7.79%Revenue Growth N/A 6.45% 4.05% 4.17% 4.12% 4.08% 4.04%Gross Margin Percentage 36.60% 42.02% 42.56% 42.13% 42.19% 42.24% 42.29%
Solvency RatiosDebt Ratio 0.85 0.82 0.75 0.70 0.66 0.62 0.59Debt-to-Equity Ratio 5.69 4.42 3.05 2.39 1.92 1.65 1.42
Liquidity RatiosCurrent Ratio 1.54 1.70 1.48 1.37 1.32 1.28 1.30Quick Ratio 0.82 1.06 0.93 0.83 0.79 0.71 0.70
Activity RatiosAverage collection period 45.65 46.61 49.86 58.33 71.80 79.98 86.35Accounts Receivable Turnover 8.00 7.83 7.32 6.26 5.08 4.56 4.23Inventory Turnover 5.62 5.07 4.29 3.50 2.94 2.42 2.03
Exhibit IIFinancial Statement Ratios
Draft Based on Current Operations Projected

Notes 2019 2020 2021 2022 2023Terminal (4%
Growth)Net Income Before Taxes 1 $3,166 $3,329 $3,553 $3,982 $4,317 $4,490Add: Interest Expense 452 404 308 212 116 116Add: Depreciation 700 600 600 500 400 400EBITDA 4,318 4,333 4,461 4,694 4,833 5,006Less: Income Taxes @ 25% (1,080) (1,083) (1,115) (1,174) (1,208) (1,251)Less: Capital Expenditures (net of tax shield) 2 (525) (525) (525) (525) (525) (525)Less: Working Capital Investments 3 (403) (200) (200) (200) (150) (150)Free Cash Flows 2,311 2,525 2,621 2,796 2,950 3,079Capitalization rate 6% 4 16.67
51,321
Discount Factor 10% 5 0.9091 0.8264 0.7513 0.6830 0.6209 0.6209Present Value of Free Cash Flows $2,100 $2,087 $1,969 $1,909 $1,832 $31,866
Present Value of Free Cash Flows $41,763Add: Present value of existing tax shield 6 250Add: Net realizable value of redundant assets 7 500Enterprise Value 42,513Less: Interest bearing debt (11,300)Equity value $31,213
Low HighRange of equity value (+/- 5%) 8 $29,653 $32,774
Notes:1
234567
8
9We used the discounted cash flow approach because the buyer is interested in continuing the business operations and reliable projections are available.
Tax shield calculated as: $600 expenditure *10% estimated average CCA rate * 25% tax rate / (10% estimated CCA rate + 10% Discount Factor) = $75. $600 expenditure - $75 tax shield = $525 netChange in working capital from Appendix X of case.
Determined by TKA in Appendix III of case.Weighted Average Cost of Capital (10%) from Appendix III of case.
The marketable securities were added to the valuation as they are not required to earn income (at Net Realizable Value).
Weighted Average Cost of Capital (10%) - Growth rate (4%) = 6%
Exhibit III
Assumption: Sales will continue to grow beyond 2023 at the 4% industry growth rate.
Discounted Cash Flow Approach (In C$'000s)Valuation of Marmani Inc.
Due to the calculation being based on projected future results it won't be perfectly accurate. We have added and subtracted 5% of our result to give us a range of values, which will better represent the possible value of Marmani.
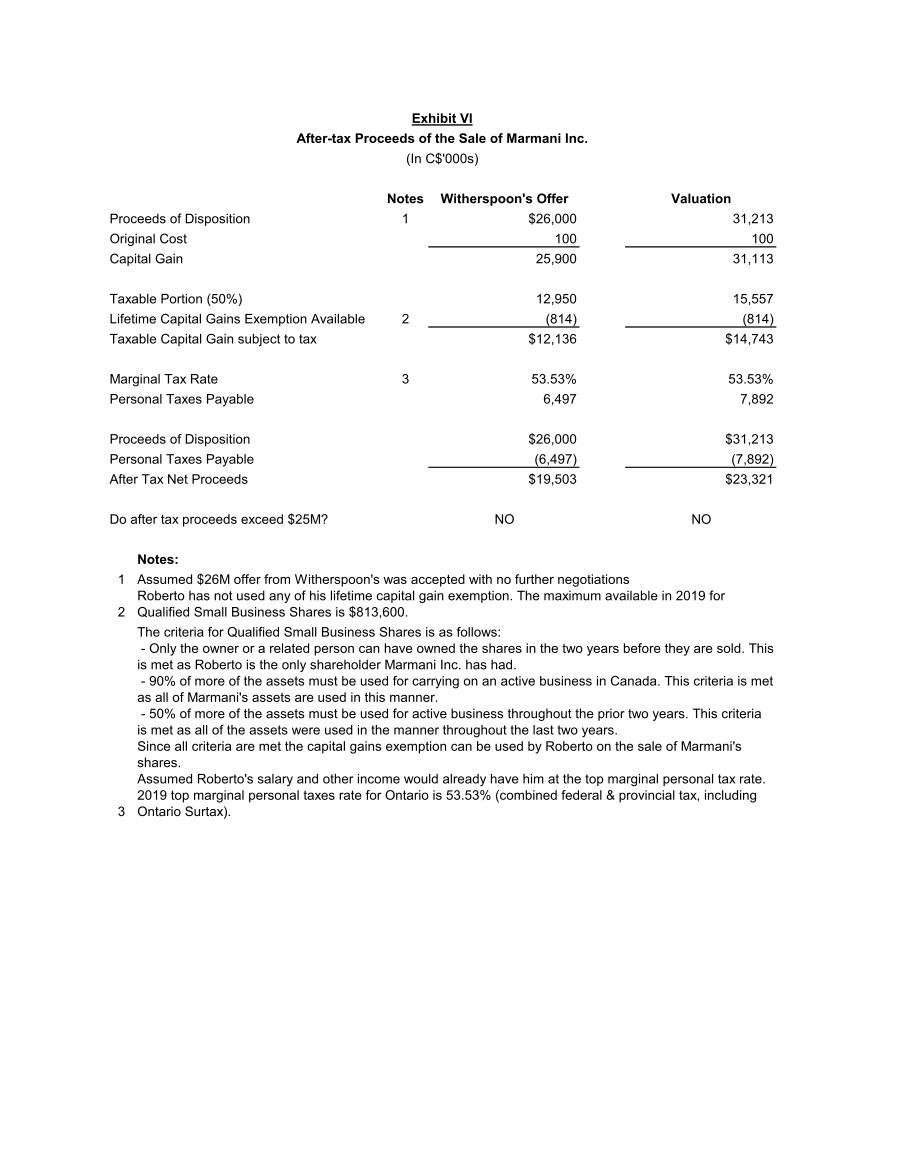
Notes Witherspoon's Offer ValuationProceeds of Disposition 1 $26,000 31,213Original Cost 100 100Capital Gain 25,900 31,113
Taxable Portion (50%) 12,950 15,557Lifetime Capital Gains Exemption Available 2 (814) (814)Taxable Capital Gain subject to tax $12,136 $14,743
Marginal Tax Rate 3 53.53% 53.53%Personal Taxes Payable 6,497 7,892
Proceeds of Disposition $26,000 $31,213Personal Taxes Payable (6,497) (7,892)After Tax Net Proceeds $19,503 $23,321
Do after tax proceeds exceed $25M? NO NO
Notes:1
2
3
Assumed Roberto's salary and other income would already have him at the top marginal personal tax rate. 2019 top marginal personal taxes rate for Ontario is 53.53% (combined federal & provincial tax, including Ontario Surtax).
- Only the owner or a related person can have owned the shares in the two years before they are sold. This is met as Roberto is the only shareholder Marmani Inc. has had.
Roberto has not used any of his lifetime capital gain exemption. The maximum available in 2019 for Qualified Small Business Shares is $813,600.The criteria for Qualified Small Business Shares is as follows:
- 90% of more of the assets must be used for carrying on an active business in Canada. This criteria is met as all of Marmani's assets are used in this manner.
Assumed $26M offer from Witherspoon's was accepted with no further negotiations
(In C$'000s)After-tax Proceeds of the Sale of Marmani Inc.
Exhibit VI
Since all criteria are met the capital gains exemption can be used by Roberto on the sale of Marmani's shares.
- 50% of more of the assets must be used for active business throughout the prior two years. This criteria is met as all of the assets were used in the manner throughout the last two years.

NotesYear 0 (2019)
Year 1 (2020)
Year 2 (2021)
Year 3 (2022)
Year 4 (2023)
Year 5 (2024)
Initial investment 2 (752)$
Revenue $4,000 $4,120 $4,182 $4,245 $4,308Cost of goods sold
Production 1 (1,400) (1,442) (1,464) (1,486) (1,508) Labour (600) (609) (618) (627) (637) Shipping (120) (124) (125) (127) (129)
Gross margin 1,880 1,945 1,975 2,004 2,034 Operating Costs
Selling, general & admin 1 (400) (412) (418) (424) (431) Lease payments 4 (990) (1,080) (1,080) (1,080) (990) Marketing (50) (20) (20) (21) (21) Operating costs (1,440) (1,512) (1,518) (1,525) (1,442) Return leasehold to original 5 (50)
Net cash flow before tax (752) 440 433 456 479 543 CCA tax shield 1, 3 50 24 23 23 23
Income tax - (110) (108) (114) (120) (136) Net cash flow after tax (752) 380 349 365 382 430
Discount Factor 1 1.0000 0.8696 0.7561 0.6575 0.5718 0.4972Present value (752) $331 $264 $240 $219 $214
Net Present Value $515
Notes:1 Assumptions:
Production costs (as % of revenue) 35%Selling, general & admin (as % of revenue 10%Shipping (as % of revenue) 3%Inflation (per Appendix V) 1.50%Discount rate 15%Tax rate 25%
2 Initial investment is as follows:Leasehold improvements 450 Equipment 100 Inventory 167 IT system 20 Refurbishments 15
752 Note: cost of report in Appendix V excluded as it is a sunk cost
3 Depreciable property classified as followsLeasehold Straight Line 5 yearsEquipment Class 53 50%IT system Class 46 30%Equipment and furnishings Class 8 20%
Exhibit VIIExpansion in Athleisure Market with a New Production Facility
Discounted Cash Flow Approach (In C$'000s)

2020 2021 2022 2023 2024Leasehold 90 90 90 90 90 Equipment 100 - - - - IT system 7 2 2 1 1 Furnishings 5 2 2 1 1 Total 201 95 93 93 92 Tax Shield 50 24 23 23 23
4
Square feet 20,000 Cost per square foot 4.50 Monthly Cost 90
2020 2021 2022 2023 2024Months (first and last free) 11 12 12 12 11Annual Payments 990 1,080 1,080 1,080 990
5 Expense to return leased property to original condition (assuming lease is not extended)Cost 50
Annual lease payments adjusted for incentive (first and last payment free) to amortize over length of the lease.
Note: CCA rate multiplied by 1.5 in the year of acquisition per the CCA Accelerated Investment Incentive. Manufacturing equipment is assumed to be eligible for full cost CCA claim in first year of operation. (Government of Canada)

NotesYear 0 (2019)
Year 1 (2020)
Year 2 (2021)
Year 3 (2022)
Year 4 (2023)
Year 5 (2024)
Initial investment 2 (153)$ Revenue $2,000 $2,000 $2,000 $2,000 $2,000Cost of goods sold
Production 1 (1,000) (1,028) (1,055) (1,063) (1,071)Labour (250) (254) (258) (261) (265)
Shipping (120) (120) (120) (120) (120)Gross margin 630 599 567 556 544Selling, general & admin 1 (200) (200) (200) (200) (200)Marketing (65) (26) (26) (27) (27)Operating costs (265) (226) (226) (227) (227)Net cash flow before tax (153) 365 373 341 329 317CCA tax shield 1, 3 14 1 1 0 0Tax - (91) (93) (85) (82) (79)Net cash flow after tax (153) 288 280 256 247 238PV Factor @ 15% 1.0000 0.8696 0.7561 0.6575 0.5718 0.4972 Present value (153) 250 212 168 141 118
Net Present Value $737
Notes1 Assumptions:
Internal production cost (increasing at inflation) 500 Outsourcing production costs (as % of revenue) 25% Y1, 26% Y2, 27% Y3 onwardsSelling, general & admin (as % of revenue) 10%Shipping (as % of revenue) 6%Inflation (per Appendix V) 1.50%Discount rate 15%Tax rate 25%
2 Initial investment is as follows:Inventory 83 Equipment parts 50 Shelving and other misc. furniture 20
153 Note: assumed inventory required is half of Richmond as sales are half of Richmond
3 Depreciable property classified as follows:Equipment Class 53 50%Furniture Class 8 20%
Year 1 (2020)
Year 2 (2021)
Year 3 (2022)
Year 4 (2023)
Year 5 (2024)
Equipment 50 0 0 0 0Furniture 6 3 2 2 1Total 56 3 2 2 1Tax Shield 14 1 1 0 0
Exhibit VIIIExpansion in Athleisure Market with a Existing Production Facility
Discounted Cash Flow Approach (In C$'000s)
CCA rate multiplied by 1.5 in the year of acquisition per the CCA Accelerated Investment Incentive. Manufacturing equipment is assumed to be eligible for full cost CCA claim in first year of operation. (Government of Canada)

NotesYear 0 (2019)
Year 1 (2020)
Year 2 (2021)
Year 3 (2022)
Year 4 (2023)
Year 5 (2024)
Initial investment 2 (145)$ Revenue $2,000 $2,000 $2,000 $2,000 $2,000Cost of goods sold
Production 1 (1,020) (1,020) (1,020) (1,020) (1,020) Shipping (120) (120) (120) (120) (120)
Gross margin 860 860 860 860 860 Selling, general & admin 1 (200) (200) (200) (200) (200) Rental expense 4 (480) (487) (495) (502) (509) Marketing (65) (26) (26) (27) (27) Operating costs (745) (713) (721) (729) (737) Net cash flow before tax (145) 115 147 139 131 123 CCA tax shield (25%) 1, 3 - 8 2 1 1 1 Tax (25%) - (29) (37) (35) (33) (31) Net cash flow after tax (145) 95 112 106 99 93 PV Factor @ 15% 1.0000 0.8696 0.7561 0.6575 0.5718 0.4972 Present value (145) 82 85 69 57 46
Net Present Value $194
Notes1 Assumptions:
Production costs (as % of revenue) 51%Selling, general & admin (as % of revenue) 10%Shipping (as % of revenue) 6%Inflation 1.5%Discount rate 15%Tax rate 25%
2 Initial investment is as follows:Inventory 83 Shelving 30 Office equipment and furniture 20 IT system 12
145 Note: assumed inventory required is half of Richmond as sales are half of Richmond
3 Depreciable property classified as follows:Shelving Class 8 20%Office equipment and furnitureClass 53 50%IT system Class 50 55%
Year 1 (2020)
Year 2 (2021)
Year 3 (2022)
Year 4 (2023)
Year 5 (2024)
Leasehold 9 4 3 3 2 Office equipment 15 3 1 1 0 IT system 10 1 1 0 0 Total 34 8 5 4 3 Tax Shield 8 2 1 1 1
4 Annual rent payment calculation:Square feet 4,000 Cost per square foot 10 Months 12
480
Exhibit IX
Discounted Cash Flow Approach (In C$'000s)Expansion in Athleisure Market with Outsourced Production
CCA rate multiplied by 1.5 in the year of acquisition per the CCA accelerated investment

Notes
External Sales Team
(8%)Internal
Sales Team IncrementalGross Sales 1 42,650 42,650 0Cost of Sales 24,500 24,500 0Commission Costs 3,412 853 (2,559)Additional Fixed Costs 2 0 495 495Total Cost of Sales $27,912 $25,848 (2,064)
Notes:1 Projected Sales from 20192 Additional fixed salaries cost: $135,000 + ($40,000 x 9)
Assumption: The commision will increase to 8% in order to keep agents motivated and effective.
NotesYear 1 (2019)
Year 2 (2020) Year 3 (2021)
Year 4 (2022)
Year 5 (2023)
Revenue 42,650$ 44,428$ 46,259$ 48,145$ 50,089$ Cost of Sales 24,500 25,710 26,743 27,808 28,907Gross Margin 18,150 18,718 19,516 20,337 21,182Expenses: Selling, General, and Adm 1 11,500 11,411 11,319 11,225 11,128 Commission 2 2,772 3,554 3,701 3,852 4,007 Other 200 200 300 300 400 Depreciation 700 600 600 500 400Total Expenses 15,172 15,765 15,920 15,876 15,935Operating Income 2,978 2,953 3,596 4,461 5,247Five year Total 19,236
Notes:
1 Commission of 5% Removed2 Commission of 8%
NotesYear 1 (2019)
Year 2 (2020) Year 3 (2021)
Year 4 (2022)
Year 5 (2023)
Revenue 42,650$ 44,428$ 46,259$ 48,145$ 50,089$ Cost of Sales 24,500 25,710 26,743 27,808 28,907Gross Margin 18,150 18,718 19,516 20,337 21,182Expenses: Selling, General, and Adm 1 11,747 11,906 11,814 11,720 11,623 Commission 2 1,493 889 925 963 1,002 Other 200 200 300 300 400 Depreciation 700 600 600 500 400Total Expenses 14,140 13,594 13,639 13,483 13,424Operating Income 4,010 5,124 5,877 6,854 7,758Five Year Total 29,623
Marmani 5-year Profit Analysis @ 8% Commission (In C$'000s)
External vs. Internal Sales Team AnalysisExhibit X
Marmani Incremental Analysis - External Sales Team 8% to Internal Sales Team (In C$'000s)
Marmani 5-year Profit Analysis with Internal Sales Team (In C$'000s)
Assumption: Year 1 (2019) is split 50/50 from the current to the proposed cost structure

Notes:
1 Commission @ 5% removed + Additional Salary Costs: $135 + ($40 x 9)2 Commission of 2%
Formula's:
External Sales Team (8%) vs Internal Sales TeamGross Sales x 8% = $135,000 + ($40,000 x 9) + (Gross Sales x 2%)
Indifference Point (Sales) $8,250,000
Internal Sales Team $135,000 + ($40,000 x 9) +
Assumption: Year 1 (2019) is split 50/50 from the current to the proposed cost structure
Gross Sales x 8%
Marmani Point of Indifference Analysis - Sales
External Sales Team (8%)

Notes
(2019)
(2020)
(2021)
(2022)
(2023)
(2024)Initial Investment 1 (120)$ Cash Inflows:Revenue 2, 3 463$ 481$ 501$ 521$ Cash Outflows: Hosting 4 (7) (7) (7) (7) (7) IT Staff 4 (210) (213) (216) (220) (223) Marketing Staff 4 (70) (71) (72) (73) (74) Consultant (75) (25) (10) (10) (10)Total Cash Outflows (362) (316) (306) (310) (315)Total Cash Flow (362) 146 176 191 206Income Tax (25%) 91 (37) (44) (48) (52)Capital Expenditure (120) (13)Tax Shield 5 14 8 3 2 2 1After-tax Cash Flow (106) (277) 113 134 145 156PV Factor @ 10% 6 1.0000 0.9091 0.8264 0.7513 0.6830 0.6209
(106) (251) 93 101 99 97
Net Present Value 32.6$
Notes:1 Initial Investment:
IT Server 60$ System Software 15 Computer Hardware 12 Furniture & Equipment 8 Website Development 25 Total Initial Investment Costs 120$
2 Increase expected to be 1% of sales beginning Year 33 Assumption : Revenue Growth to remain steady at 4%4 Assumption : Inflation is to remain steady at 1.5% as per Appendix V5 Tax Shield Calculation:
Class 8: 20%Class 12: 100%Class 46: 30%Class 50: 55%
Rate Year 1 Year 2 Year 3 Year 4 Year 5 Year 6IT Server 30% 27 10 7 5 3 2 System Software 30% 7 2 2 1 1 1 Computer Hardware 55% 10 1 1 0 0 0 Furniture & Equipment 20% 2 1 1 1 1 0 Website Development 30% 11 4 3 2 1 1 Customer Service Software 100% - 13 - - - - Total Depreciation 57 32 13 9 6 4 Tax Shield 25% 14$ 8$ 3$ 2$ 2$ 1$
Assumption: Accelerated Investment Incentive of 1.5x CCA for the first year. (Government of Canada)
6Assumption : Website Development costs will be treated as a capital expenditure as the website will have Assumption: Discounted at 10% (weighted average cost of capital)
Digital Marketing NPV AnalysisExhibit XI
Discounted Cash Flow Approach (In C$'000s)
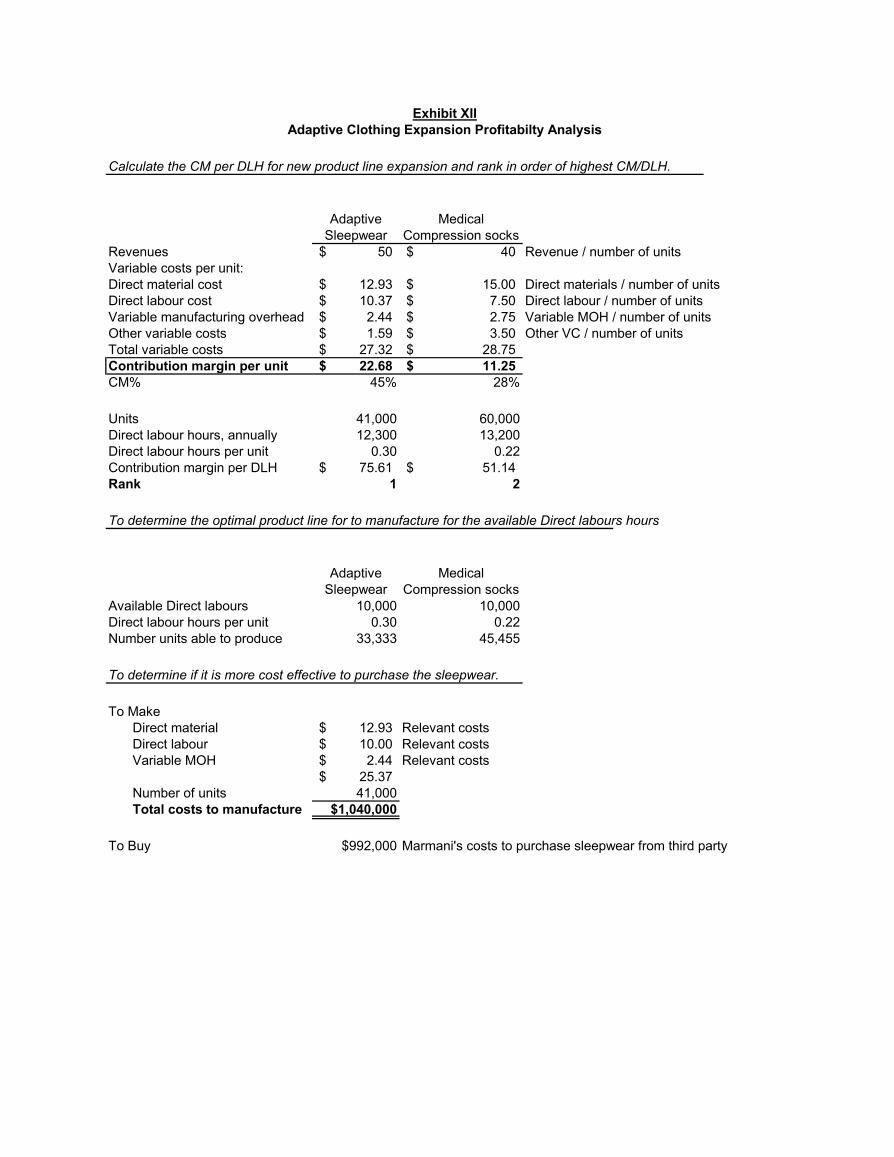
Calculate the CM per DLH for new product line expansion and rank in order of highest CM/DLH.
Adaptive Sleepwear
Medical Compression socks
Revenues 50$ 40$ Revenue / number of unitsVariable costs per unit:Direct material cost 12.93$ 15.00$ Direct materials / number of unitsDirect labour cost 10.37$ 7.50$ Direct labour / number of unitsVariable manufacturing overhead 2.44$ 2.75$ Variable MOH / number of unitsOther variable costs 1.59$ 3.50$ Other VC / number of unitsTotal variable costs 27.32$ 28.75$ Contribution margin per unit 22.68$ 11.25$ CM% 45% 28%
Units 41,000 60,000Direct labour hours, annually 12,300 13,200Direct labour hours per unit 0.30 0.22Contribution margin per DLH 75.61$ 51.14$ Rank 1 2
To determine the optimal product line for to manufacture for the available Direct labours hours
Adaptive Sleepwear
Medical Compression socks
Available Direct labours 10,000 10,000Direct labour hours per unit 0.30 0.22Number units able to produce 33,333 45,455
To determine if it is more cost effective to purchase the sleepwear.
To MakeDirect material 12.93$ Relevant costsDirect labour 10.00$ Relevant costsVariable MOH 2.44$ Relevant costs
25.37$ Number of units 41,000Total costs to manufacture $1,040,000
To Buy $992,000 Marmani's costs to purchase sleepwear from third party
Exhibit XIIAdaptive Clothing Expansion Profitabilty Analysis

NotesYear 0 (2019)
Year 1 (2020)
Year 2 (2021)
Year 3 (2022)
Year 4 (2023)
Year 5 (2024)
Initial Investment 1 (90)$ Cash inflow 2 1,667$ 1,750$ 1,838$ 1,929$ 2,026$ Cash outflows
Direct material cost 2 (431) (452) (475) (499) (524)Direct labour cost 2 (346) (363) (381) (400) (420)Variable manufacturing overhead 2 (81) (85) (90) (94) (99)Other variable costs 2 (53) (55) (58) (61) (64)Fixed manufacturing cost (100) (100) (100) (100) (100)Selling, general & administrative expenses 3 (133) (140) (147) (154) (162)
Total Cash Outflows (1,144) (1,196) (1,251) (1,308) (1,369)Pre-tax cash flows 523 554 587 621 657Income tax (25%) (131) (138) (147) (155) (164)Capital expenditure (90)Tax Shield 4,7 19 1 1 0 0After tax cash Flow (90) 411 416 441 466 493PV Factor @ 8% 5 1.0000 0.9259 0.8573 0.7938 0.7350 0.6806
(90) 381 357 350 343 336
Net Present Value $1,675
Exhibit XIIIAdaptive Sleepware NPV Analysis
Discounted Cash Flow Approach (In C$'000s)
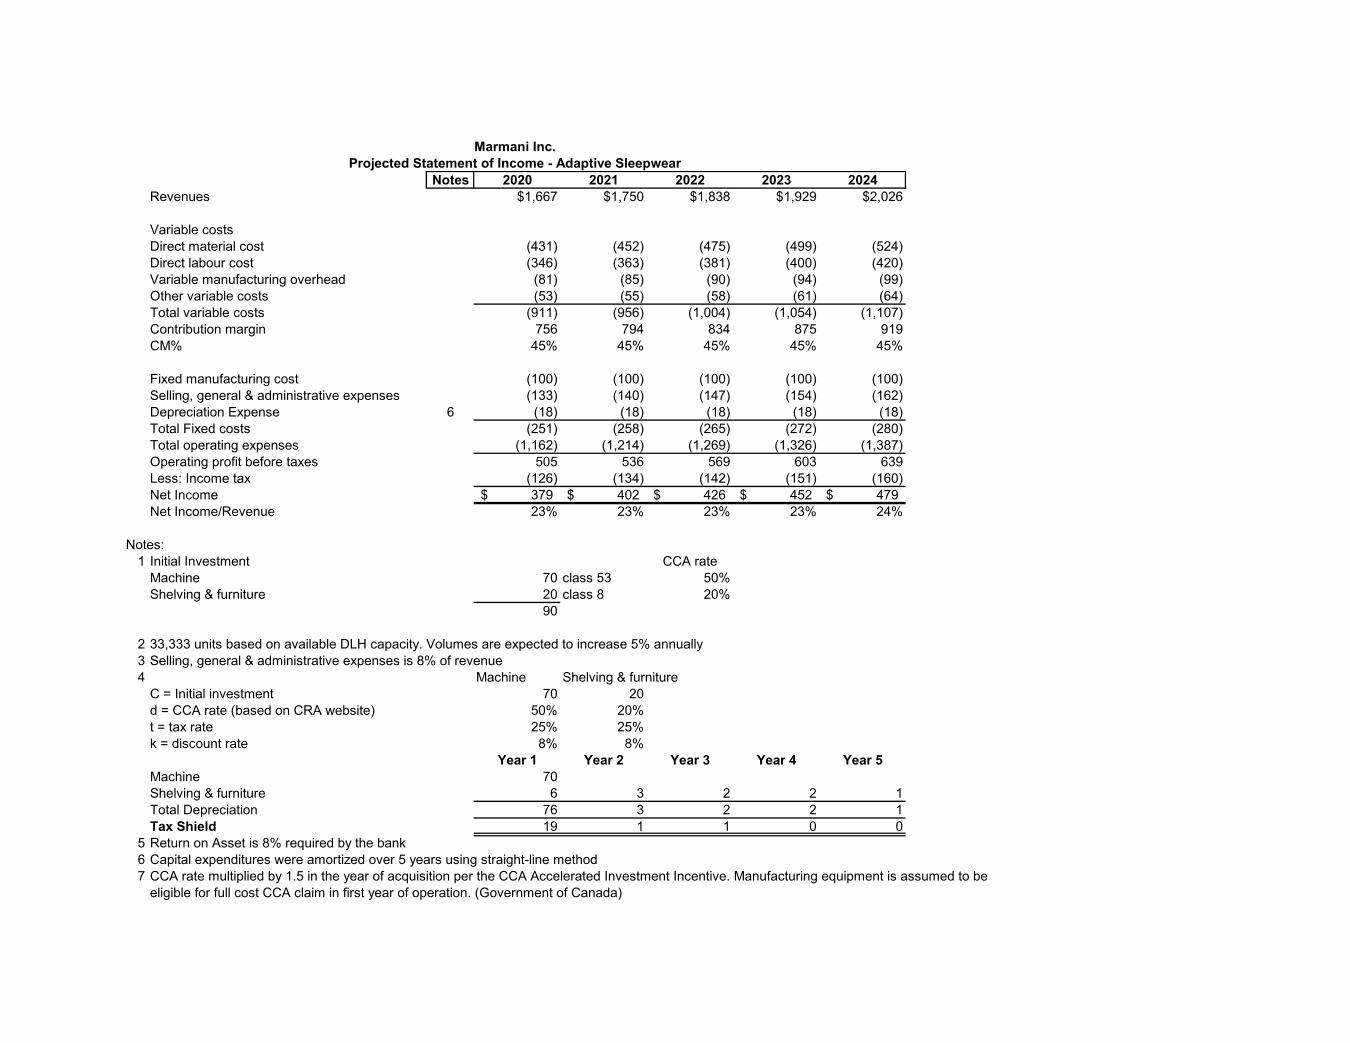
Notes 2020 2021 2022 2023 2024Revenues $1,667 $1,750 $1,838 $1,929 $2,026
Variable costs Direct material cost (431) (452) (475) (499) (524)Direct labour cost (346) (363) (381) (400) (420)Variable manufacturing overhead (81) (85) (90) (94) (99)Other variable costs (53) (55) (58) (61) (64)Total variable costs (911) (956) (1,004) (1,054) (1,107)Contribution margin 756 794 834 875 919CM% 45% 45% 45% 45% 45%
Fixed manufacturing cost (100) (100) (100) (100) (100)Selling, general & administrative expenses (133) (140) (147) (154) (162)Depreciation Expense 6 (18) (18) (18) (18) (18)Total Fixed costs (251) (258) (265) (272) (280)Total operating expenses (1,162) (1,214) (1,269) (1,326) (1,387)Operating profit before taxes 505 536 569 603 639Less: Income tax (126) (134) (142) (151) (160)Net Income 379$ 402$ 426$ 452$ 479$ Net Income/Revenue 23% 23% 23% 23% 24%
Notes:1 Initial Investment CCA rate
Machine 70 class 53 50%Shelving & furniture 20 class 8 20%
90
2 33,333 units based on available DLH capacity. Volumes are expected to increase 5% annually3 Selling, general & administrative expenses is 8% of revenue4 Machine Shelving & furniture
C = Initial investment 70 20d = CCA rate (based on CRA website) 50% 20%t = tax rate 25% 25%k = discount rate 8% 8%
Year 1 Year 2 Year 3 Year 4 Year 5Machine 70Shelving & furniture 6 3 2 2 1Total Depreciation 76 3 2 2 1Tax Shield 19 1 1 0 0
5 Return on Asset is 8% required by the bank6 Capital expenditures were amortized over 5 years using straight-line method7 CCA rate multiplied by 1.5 in the year of acquisition per the CCA Accelerated Investment Incentive. Manufacturing equipment is assumed to be
eligible for full cost CCA claim in first year of operation. (Government of Canada)
Projected Statement of Income - Adaptive SleepwearMarmani Inc.
NotesYear 0 (2019)
Year 1 (2020)
Year 2 (2021)
Year 3 (2022)
Year 4 (2023)
Year 5 (2024)
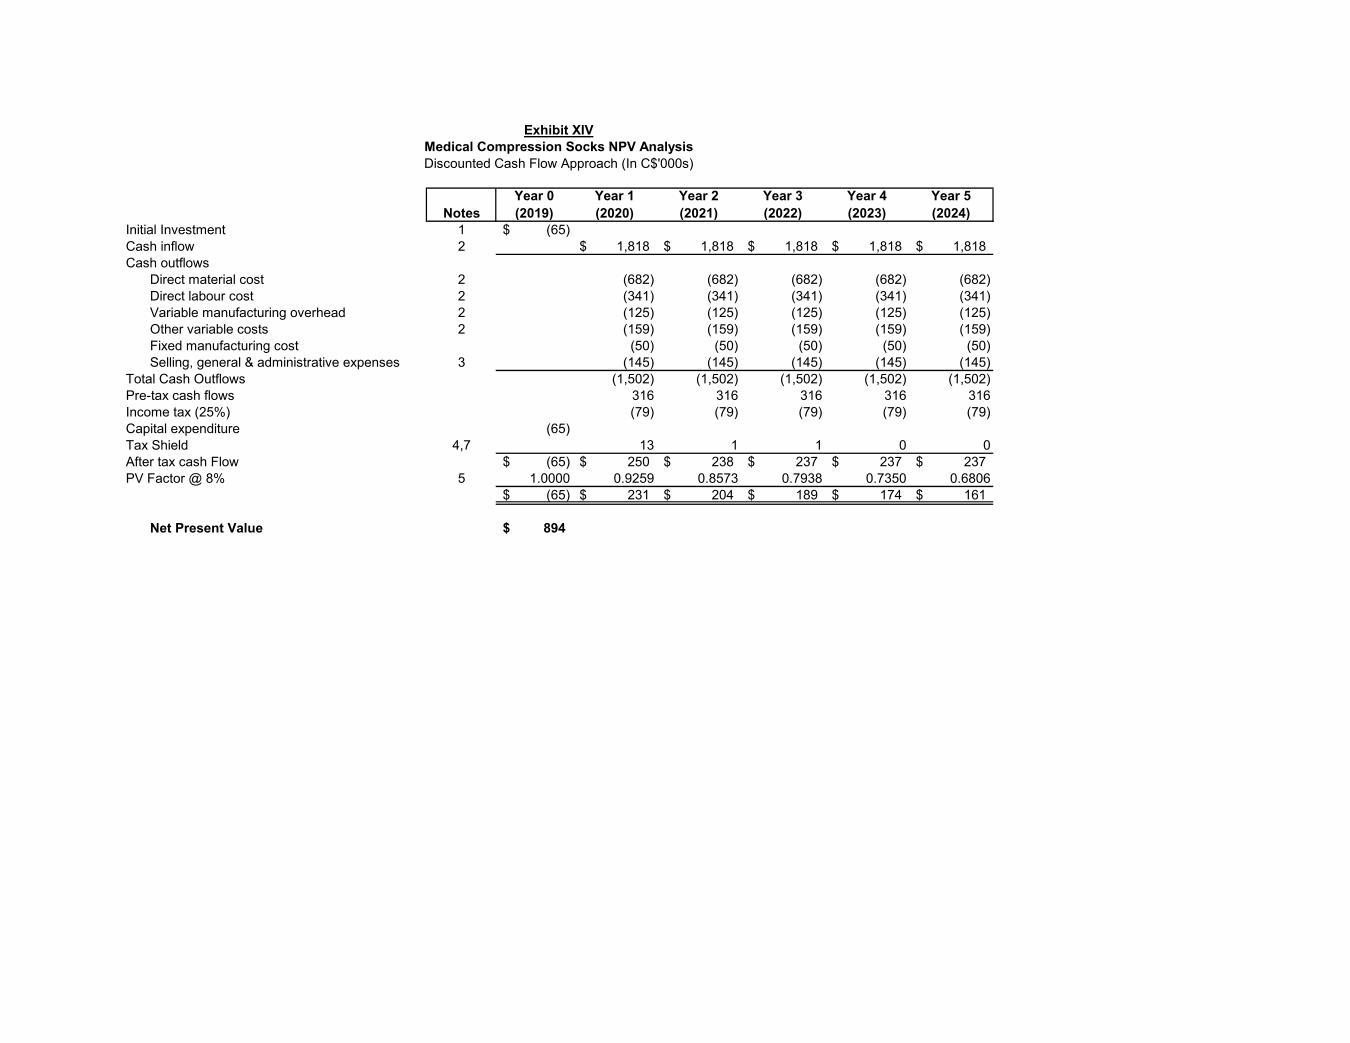
Initial Investment 1 (65)$ Cash inflow 2 1,818$ 1,818$ 1,818$ 1,818$ 1,818$ Cash outflows
Direct material cost 2 (682) (682) (682) (682) (682)Direct labour cost 2 (341) (341) (341) (341) (341)Variable manufacturing overhead 2 (125) (125) (125) (125) (125)Other variable costs 2 (159) (159) (159) (159) (159)Fixed manufacturing cost (50) (50) (50) (50) (50)Selling, general & administrative expenses 3 (145) (145) (145) (145) (145)
Total Cash Outflows (1,502) (1,502) (1,502) (1,502) (1,502)Pre-tax cash flows 316 316 316 316 316Income tax (25%) (79) (79) (79) (79) (79)Capital expenditure (65)Tax Shield 4,7 13 1 1 0 0After tax cash Flow (65)$ 250$ 238$ 237$ 237$ 237$ PV Factor @ 8% 5 1.0000 0.9259 0.8573 0.7938 0.7350 0.6806
(65)$ 231$ 204$ 189$ 174$ 161$
Net Present Value 894$
Exhibit XIVMedical Compression Socks NPV AnalysisDiscounted Cash Flow Approach (In C$'000s)
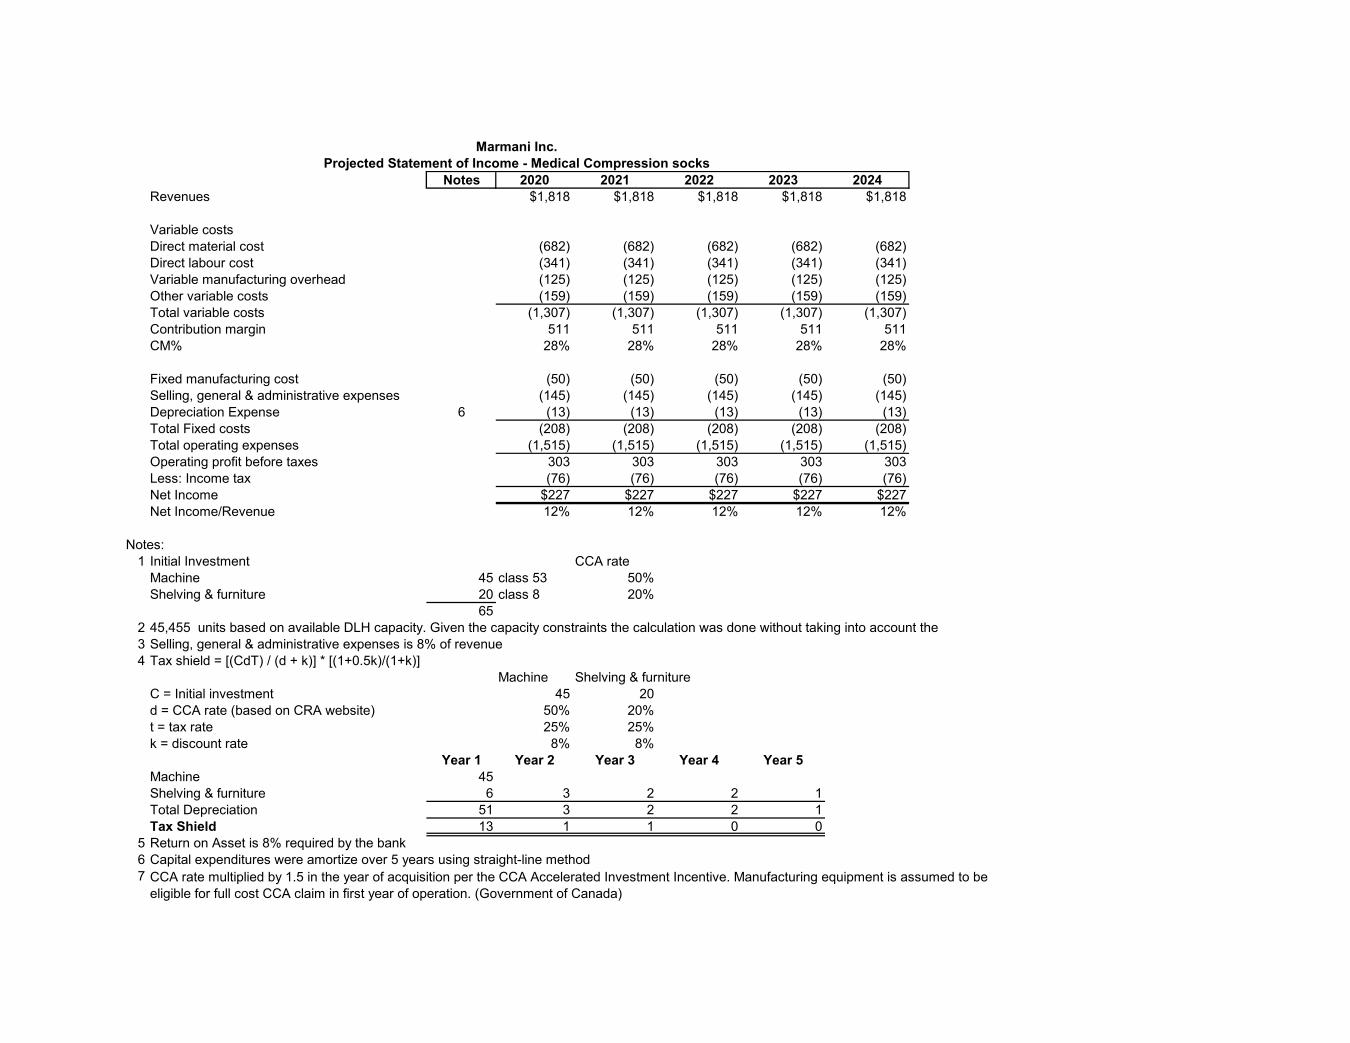
Notes 2020 2021 2022 2023 2024Revenues $1,818 $1,818 $1,818 $1,818 $1,818
Variable costsDirect material cost (682) (682) (682) (682) (682)Direct labour cost (341) (341) (341) (341) (341)Variable manufacturing overhead (125) (125) (125) (125) (125)Other variable costs (159) (159) (159) (159) (159)Total variable costs (1,307) (1,307) (1,307) (1,307) (1,307)Contribution margin 511 511 511 511 511CM% 28% 28% 28% 28% 28%
Fixed manufacturing cost (50) (50) (50) (50) (50)Selling, general & administrative expenses (145) (145) (145) (145) (145)Depreciation Expense 6 (13) (13) (13) (13) (13)Total Fixed costs (208) (208) (208) (208) (208)Total operating expenses (1,515) (1,515) (1,515) (1,515) (1,515)Operating profit before taxes 303 303 303 303 303Less: Income tax (76) (76) (76) (76) (76)Net Income $227 $227 $227 $227 $227Net Income/Revenue 12% 12% 12% 12% 12%
Notes:1 Initial Investment CCA rate
Machine 45 class 53 50%Shelving & furniture 20 class 8 20%
6523 Selling, general & administrative expenses is 8% of revenue4 Tax shield = [(CdT) / (d + k)] * [(1+0.5k)/(1+k)]
Machine Shelving & furnitureC = Initial investment 45 20d = CCA rate (based on CRA website) 50% 20%t = tax rate 25% 25%k = discount rate 8% 8%
Year 1 Year 2 Year 3 Year 4 Year 5Machine 45Shelving & furniture 6 3 2 2 1Total Depreciation 51 3 2 2 1Tax Shield 13 1 1 0 0
5 Return on Asset is 8% required by the bank6 Capital expenditures were amortize over 5 years using straight-line method7 CCA rate multiplied by 1.5 in the year of acquisition per the CCA Accelerated Investment Incentive. Manufacturing equipment is assumed to be
eligible for full cost CCA claim in first year of operation. (Government of Canada)
Projected Statement of Income - Medical Compression socksMarmani Inc.
45,455 units based on available DLH capacity. Given the capacity constraints the calculation was done without taking into account the
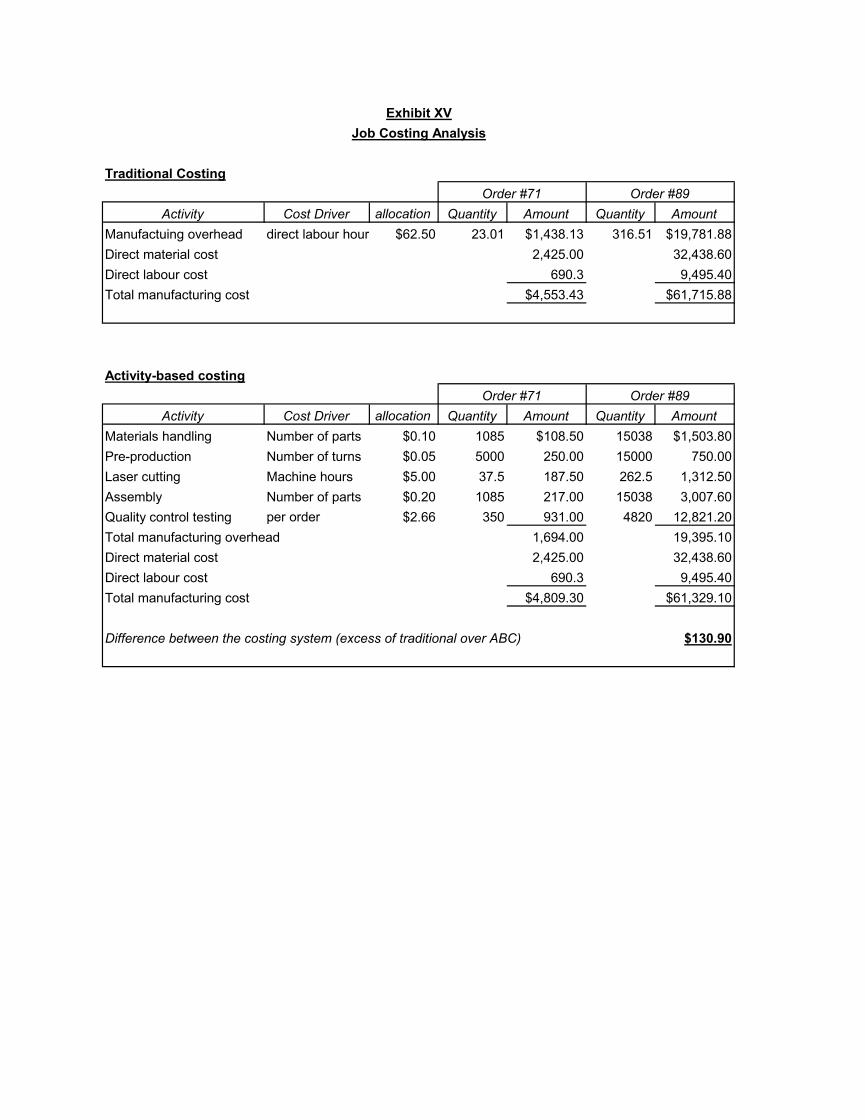
Traditional Costing
Activity Cost Driver
allocation Quantity Amount Quantity AmountManufactuing overhead direct labour hour $62.50 23.01 $1,438.13 316.51 $19,781.88Direct material cost 2,425.00 32,438.60Direct labour cost 690.3 9,495.40Total manufacturing cost $4,553.43 $61,715.88
Activity-based costing
Activity Cost Driver
allocation Quantity Amount Quantity AmountMaterials handling Number of parts $0.10 1085 $108.50 15038 $1,503.80Pre-production Number of turns $0.05 5000 250.00 15000 750.00Laser cutting Machine hours $5.00 37.5 187.50 262.5 1,312.50Assembly Number of parts $0.20 1085 217.00 15038 3,007.60Quality control testing
per order $2.66 350 931.00 4820 12,821.20
1,694.00 19,395.10Direct material cost 2,425.00 32,438.60Direct labour cost 690.3 9,495.40Total manufacturing cost $4,809.30 $61,329.10
Difference between the costing system (excess of traditional over ABC) $130.90
Total manufacturing overhead
Exhibit XVJob Costing Analysis
Order #71 Order #89
Order #71 Order #89
Draft2018 2019 2020 2021 2022 2023
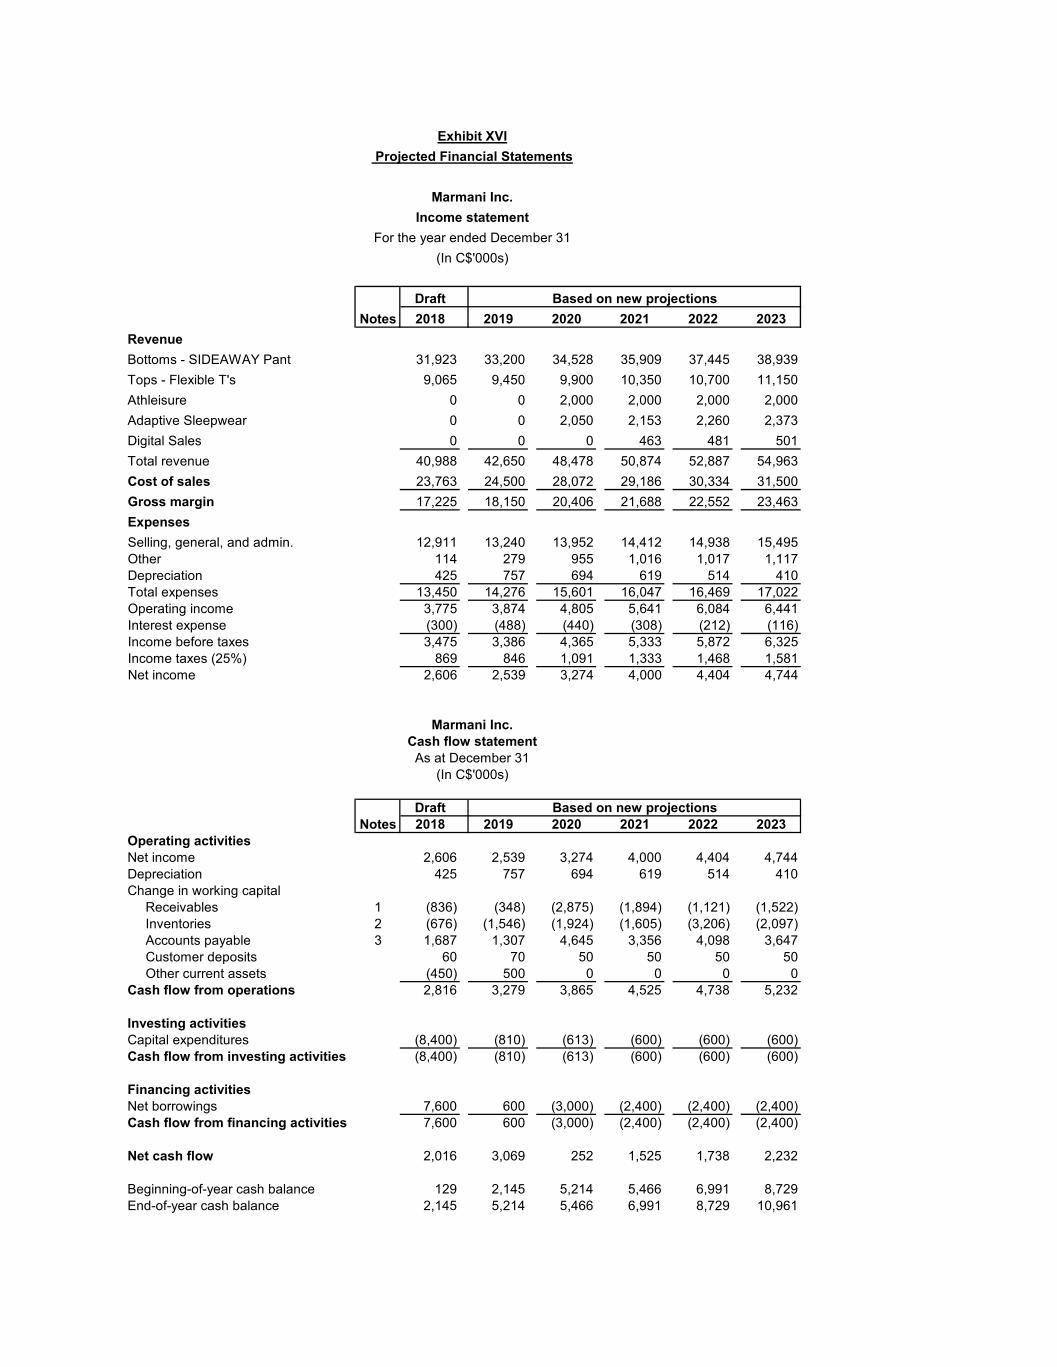
RevenueBottoms - SIDEAWAY Pant 31,923 33,200 34,528 35,909 37,445 38,939Tops - Flexible T's 9,065 9,450 9,900 10,350 10,700 11,150Athleisure 0 0 2,000 2,000 2,000 2,000Adaptive Sleepwear 0 0 2,050 2,153 2,260 2,373Digital Sales 0 0 0 463 481 501Total revenue 40,988 42,650 48,478 50,874 52,887 54,963Cost of sales 23,763 24,500 28,072 29,186 30,334 31,500Gross margin 17,225 18,150 20,406 21,688 22,552 23,463ExpensesSelling, general, and admin. 12,911 13,240 13,952 14,412 14,938 15,495Other 114 279 955 1,016 1,017 1,117Depreciation 425 757 694 619 514 410Total expenses 13,450 14,276 15,601 16,047 16,469 17,022Operating income 3,775 3,874 4,805 5,641 6,084 6,441Interest expense (300) (488) (440) (308) (212) (116)Income before taxes 3,475 3,386 4,365 5,333 5,872 6,325Income taxes (25%) 869 846 1,091 1,333 1,468 1,581Net income 2,606 2,539 3,274 4,000 4,404 4,744
Draft2018 2019 2020 2021 2022 2023
Operating activitiesNet income 2,606 2,539 3,274 4,000 4,404 4,744Depreciation 425 757 694 619 514 410Change in working capital
Receivables 1 (836) (348) (2,875) (1,894) (1,121) (1,522)Inventories 2 (676) (1,546) (1,924) (1,605) (3,206) (2,097)Accounts payable 3 1,687 1,307 4,645 3,356 4,098 3,647Customer deposits 60 70 50 50 50 50Other current assets (450) 500 0 0 0 0
Cash flow from operations 2,816 3,279 3,865 4,525 4,738 5,232
Investing activitiesCapital expenditures (8,400) (810) (613) (600) (600) (600)Cash flow from investing activities (8,400) (810) (613) (600) (600) (600)
Financing activitiesNet borrowings 7,600 600 (3,000) (2,400) (2,400) (2,400)Cash flow from financing activities 7,600 600 (3,000) (2,400) (2,400) (2,400)
Net cash flow 2,016 3,069 252 1,525 1,738 2,232
Beginning-of-year cash balance 129 2,145 5,214 5,466 6,991 8,729End-of-year cash balance 2,145 5,214 5,466 6,991 8,729 10,961
Notes
(In C$'000s)
Marmani Inc.Cash flow statement
As at December 31
Based on new projections
NotesBased on new projections
Marmani Inc.
Exhibit XVI
Income statement
(In C$'000s)For the year ended December 31
Projected Financial Statements

Notes:
1
23 Assumed 25% of new cost of sales will be unpaid at each year end (Based on 90 day payment period)4 Assumed internal sales team is implemented for half of 2019.
5
2019 2020 2021 2022 2023Profitability Ratios
Return on Assets 9.88% 10.75% 11.29% 10.74% 10.07%Revenue Growth 4.05% 13.66% 4.94% 3.96% 3.93%Gross Margin Percentage 42.56% 42.09% 42.63% 42.64% 42.69%
Solvency RatiosDebt Ratio 0.75 0.69 0.63 0.58 0.54Debt-to-Equity Ratio 3.07 2.25 1.68 1.38 1.15
Liquidity RatiosCurrent Ratio 1.46 1.40 1.41 1.42 1.48Quick Ratio 0.92 0.88 0.90 0.86 0.91
Activity RatiosAverage collection period 49.86 56.00 70.47 78.19 84.02Accounts Receivable Turnover 7.32 6.52 5.18 4.67 4.34Inventory Turnover 4.23 3.73 3.14 2.59 2.19
Based on new projections
Assumed two months of new sales will be uncollected at each year end (Based on 60 day collection period)Assumed half of one month's next year sales are required in inventory in the prior year (Based on Roberto's estimate on Atheisure).
Sales team changes are shown as negative expense as it is expected to save money on the reduced commission fees.
Financial Ratios
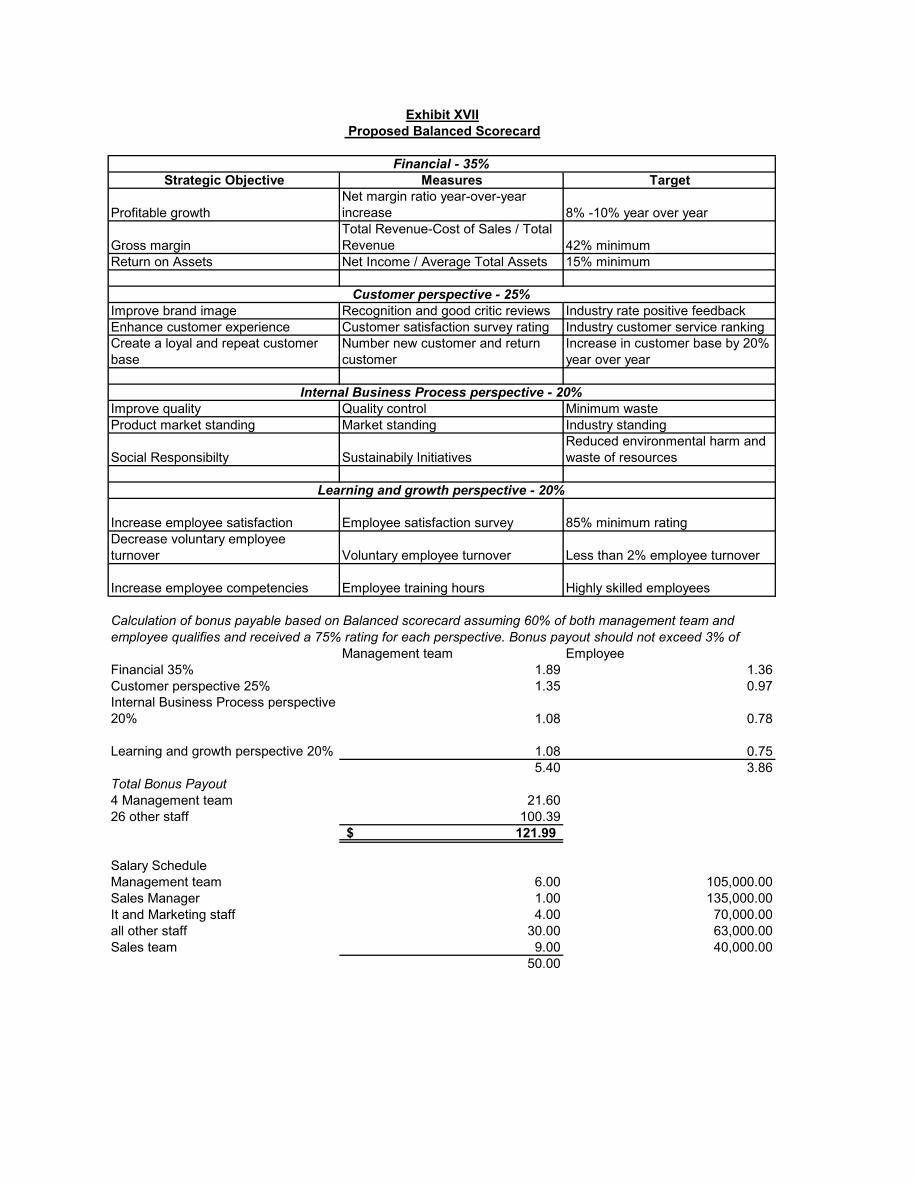
Strategic Objective Measures Target
Profitable growthNet margin ratio year-over-year increase 8% -10% year over year
Gross marginTotal Revenue-Cost of Sales / Total Revenue 42% minimum
Return on Assets Net Income / Average Total Assets 15% minimum
Improve brand image Recognition and good critic reviews Industry rate positive feedbackEnhance customer experience Customer satisfaction survey rating Industry customer service rankingCreate a loyal and repeat customer base
Number new customer and return customer
Increase in customer base by 20% year over year
Improve quality Quality control Minimum wasteProduct market standing Market standing Industry standing
Social Responsibilty Sustainabily InitiativesReduced environmental harm and waste of resources
Increase employee satisfaction Employee satisfaction survey 85% minimum ratingDecrease voluntary employee turnover Voluntary employee turnover Less than 2% employee turnover
Increase employee competencies Employee training hours Highly skilled employees
Management team Employee Financial 35% 1.89 1.36Customer perspective 25% 1.35 0.97Internal Business Process perspective 20% 1.08 0.78
Learning and growth perspective 20% 1.08 0.755.40 3.86
Total Bonus Payout4 Management team 21.6026 other staff 100.39
121.99$
Salary ScheduleManagement team 6.00 105,000.00Sales Manager 1.00 135,000.00It and Marketing staff 4.00 70,000.00all other staff 30.00 63,000.00Sales team 9.00 40,000.00
50.00
Learning and growth perspective - 20%
Calculation of bonus payable based on Balanced scorecard assuming 60% of both management team and employee qualifies and received a 75% rating for each perspective. Bonus payout should not exceed 3% of
Exhibit XVII Proposed Balanced Scorecard
Financial - 35%
Customer perspective - 25%
Internal Business Process perspective - 20%
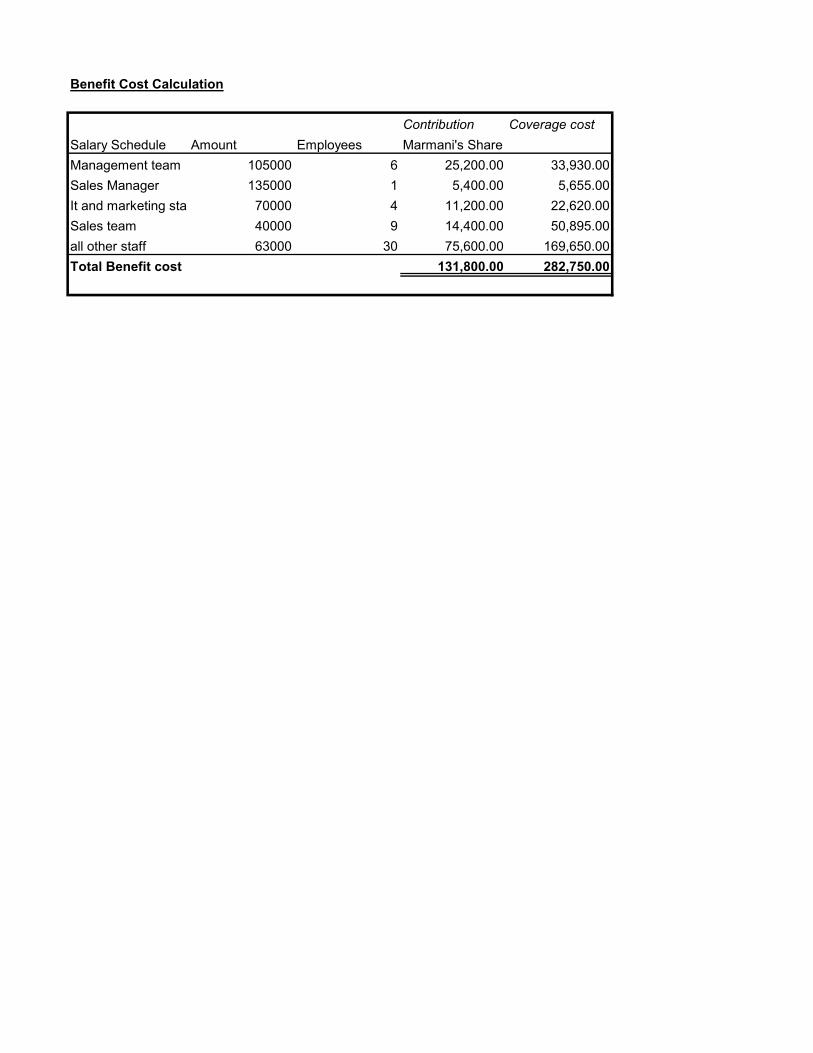
Contribution
Coverage cost
Salary Schedule Amount Employees Marmani's ShareManagement team 105000 6 25,200.00 33,930.00Sales Manager 135000 1 5,400.00 5,655.00It and marketing staf 70000 4 11,200.00 22,620.00Sales team 40000 9 14,400.00 50,895.00all other staff 63000 30 75,600.00 169,650.00Total Benefit cost 131,800.00 282,750.00
Benefit Cost Calculation

Athleisure Lease - ASPE 3065 Criteria
Lease analysis
Fair value of property 8,000,000.00Square feet 20,000.00Cost per square foot 4.50Payment 90,000.00 4500000Payment (factoring incentive) 75,000.00Lease term (years) 5.00Payments (monthly) 60.00Rate (using provided discount rate) 15%
PV of lease payments -$499,885.95