exhibit 99.2 investor presentation q3 2017 final · ctl 14% crc 14% cpl 16% sccl 0% ... ebitda*...
TRANSCRIPT
CENTURY CASINOSFinancial Results
Q3 2017
1
Forward-Looking Statements,Business Environment and Risk FactorsThis presentation may contain “forward-looking statements” within the meaning of Section 27A of the Securities Act of 1933, asamended, Section 21E of the Securities Exchange Act of 1934, as amended (the “Exchange Act”), and the Private SecuritiesLitigation Reform Act of 1995. In addition, Century Casinos, Inc. (together with its subsidiaries, the “Company”) may make otherwritten and oral communications from time to time that contain such statements. Forward-looking statements include statementsas to industry trends and future expectations of the Company and other matters that do not relate strictly to historical facts and arebased on certain assumptions by management at the time such statements are made. Forward-looking statements in thispresentation include statements regarding future results of operations, operating efficiencies, synergies and operationalperformance, the prospects for and timing and costs of new projects, projects in development and other opportunities, includingthe Century Mile and Saw Close Casino Ltd. (“SCCL”) projects, debt repayment, investments in joint ventures, outcomes of legalproceedings and plans for our casinos and our Company. These statements are often identified by the use of words such as “may,”“will,” “expect,” “believe,” “anticipate,” “intend,” “could,” “estimate,” or “continue,” and similar expressions or variations. Thesestatements are based on the beliefs and assumptions of the management of the Company based on information currently availableto management. Such forward-looking statements are subject to risks, uncertainties and other factors that could cause actualresults to differ materially from future results expressed or implied by such forward-looking statements. Important factors that couldcause actual results to differ materially from the forward-looking statements include, among others, the risks described in thesection entitled “Risk Factors” under Item 1A in our Annual Report on Form 10-K for the year ended December 31, 2016 and oursubsequent periodic and current reports filed with the SEC. We caution the reader to carefully consider such factors. Furthermore,such forward-looking statements speak only as of the date on which such statements are made. We undertake no obligation toupdate any forward-looking statements to reflect events or circumstances after the date of such statements.
2
Forward-Looking Statements,Business Environment and Risk Factors continuedIn this presentation the term “USD” refers to US dollars, the term “CAD” refers to Canadian dollars, the term “PLN” refers to Polishzloty and the term “GBP” refers to the British pound.
Adjusted EBITDA and Adjusted EBITDA margin are non-GAAP financial measures. See Appendix A for the definition andreconciliation of Adjusted EBITDA and Adjusted EBITDA margin.
The 2016 financial statements reflect adjustments to net operating revenue, earnings from operations, net earnings attributable toCentury Casinos, Inc. shareholders and Adjusted EBITDA to correct an erroneously recognized reduction in pari-mutuel revenuetotaling $0.7 million (CAD 0.9 million) in the nine months ended September 30, 2016.
Amounts presented are rounded. As such, rounding differences could occur in period-over-period changes and percentagesreported throughout this presentation.
The names of the Company’s subsidiaries and certain operating segments are abbreviated on certain of the following slides. SeeAppendix A for a list of the subsidiaries and their abbreviations.
3

Q3 2017 Net Operating Revenue by Reportable Segment and Operating Segment (in USD)Excluding Corporate and Other Operating Segment
Canada37%
UnitedStates22%
Poland38%
Ships&Other3%
CRA
13%
CSA
5% CAL
5%
CDR
12%
CBS
2% CMR
0% CTL
13% CRC
9%
CPL38%
SCCL
0%
Ships&Other3%
4
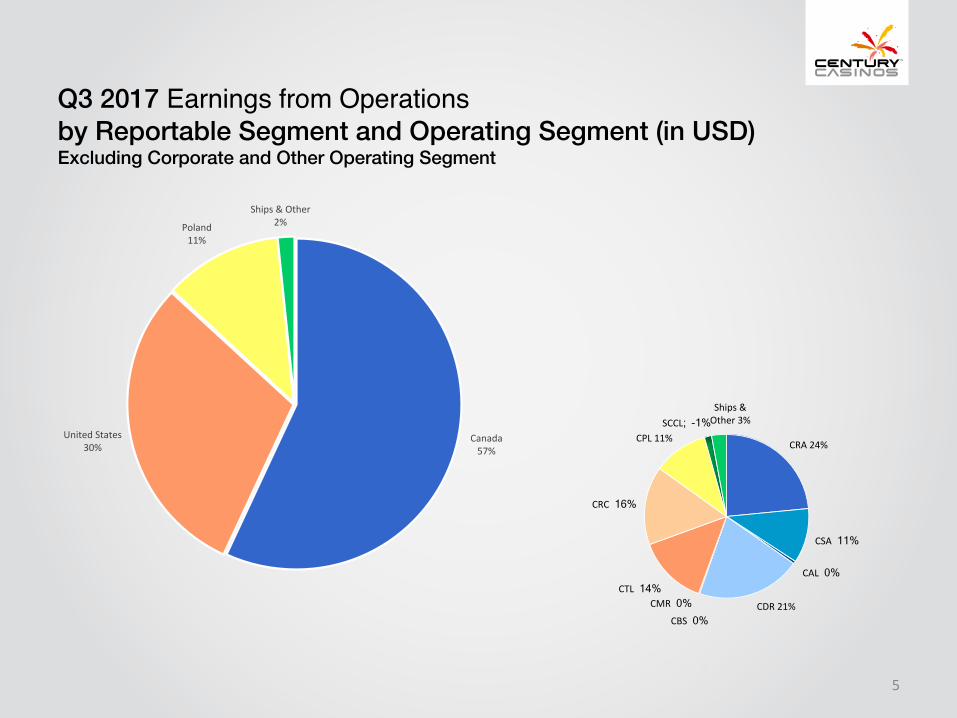
Q3 2017 Earnings from Operationsby Reportable Segment and Operating Segment (in USD)Excluding Corporate and Other Operating Segment
Canada57%
UnitedStates30%
Poland11%
Ships&Other2%
CRA 24%
CSA 11%
CAL 0%
CDR 21%CBS 0%
CMR 0% CTL 14%
CRC 16%
CPL 11%SCCL; -1%
Ships&Other 3%
5
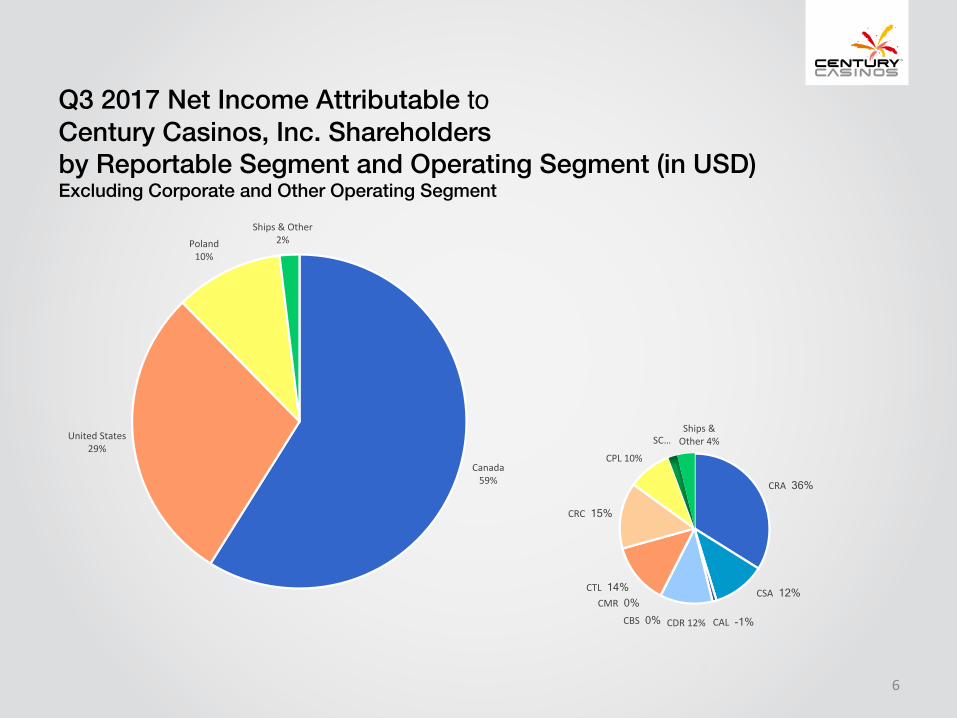
Q3 2017 Net Income Attributable to Century Casinos, Inc. Shareholdersby Reportable Segment and Operating Segment (in USD)Excluding Corporate and Other Operating Segment
Canada59%
UnitedStates29%
Poland10%
Ships&Other2%
CRA 36%
CSA 12%
CAL -1% CDR 12%CBS 0% CMR 0%
CTL 14%
CRC 15%
CPL 10%
SC…Ships&Other 4%
6
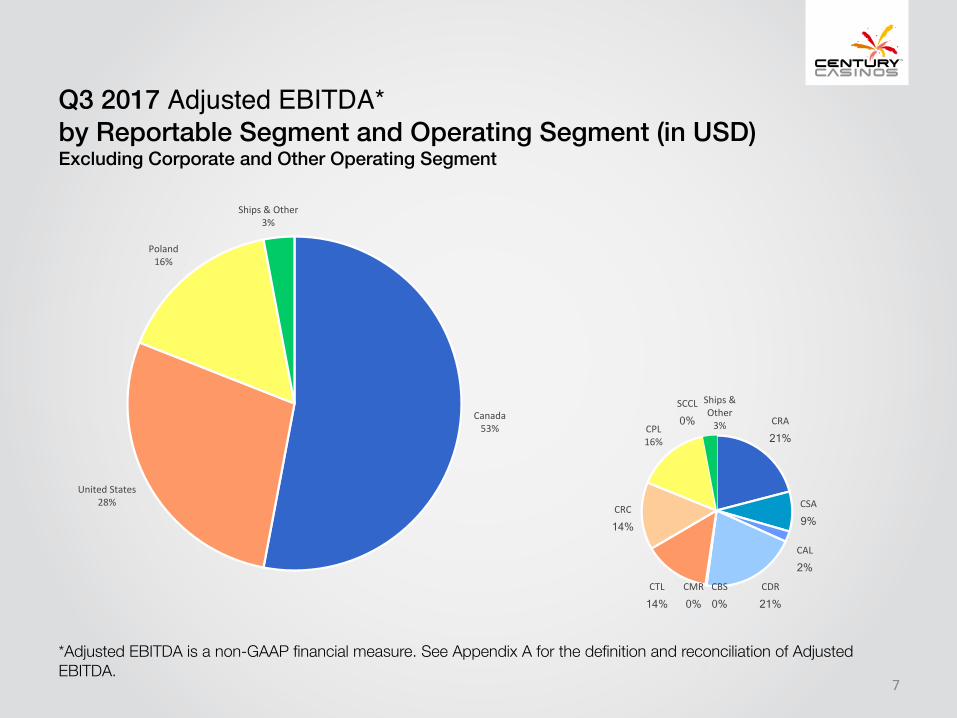
Q3 2017 Adjusted EBITDA*by Reportable Segment and Operating Segment (in USD)Excluding Corporate and Other Operating Segment
Canada53%
UnitedStates28%
Poland16%
Ships&Other3%
CRA
21%
CSA
9%
CAL
2% CDR
21% CBS
0% CMR
0% CTL
14%
CRC
14%
CPL16%
SCCL
0%
Ships&Other3%
7
*Adjusted EBITDA is a non-GAAP financial measure. See Appendix A for the definition and reconciliation of Adjusted EBITDA.
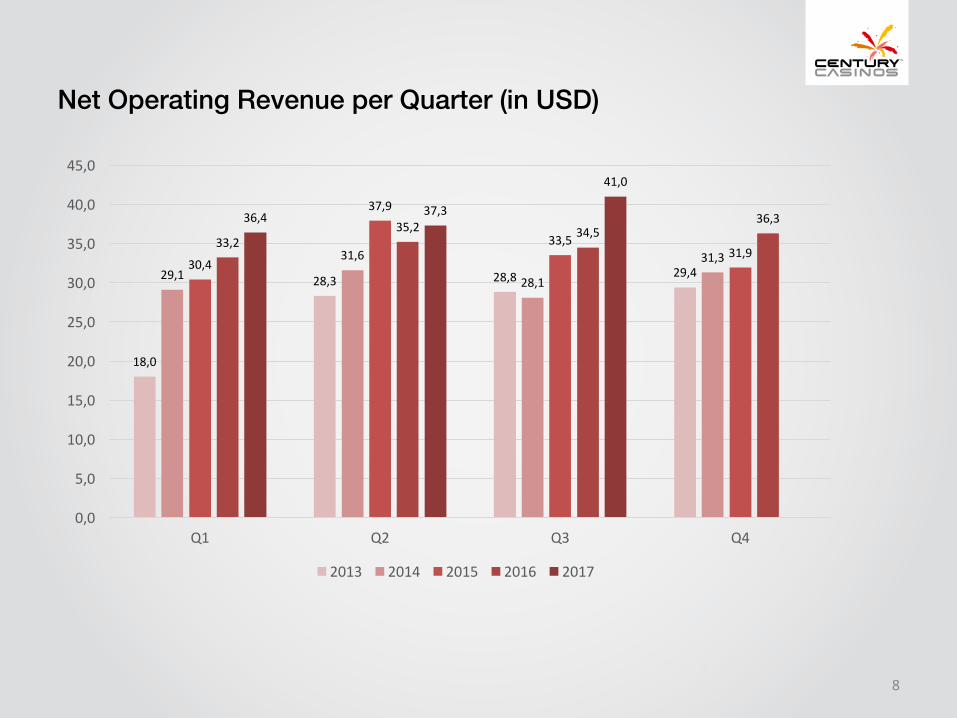
Net Operating Revenue per Quarter (in USD)
18,0
28,3 28,8 29,429,131,6
28,1
31,330,4
37,9
33,531,9
33,235,2 34,5
36,336,4 37,3
41,0
0,0
5,0
10,0
15,0
20,0
25,0
30,0
35,0
40,0
45,0
Q1 Q2 Q3 Q4
2013 2014 2015 2016 2017
8
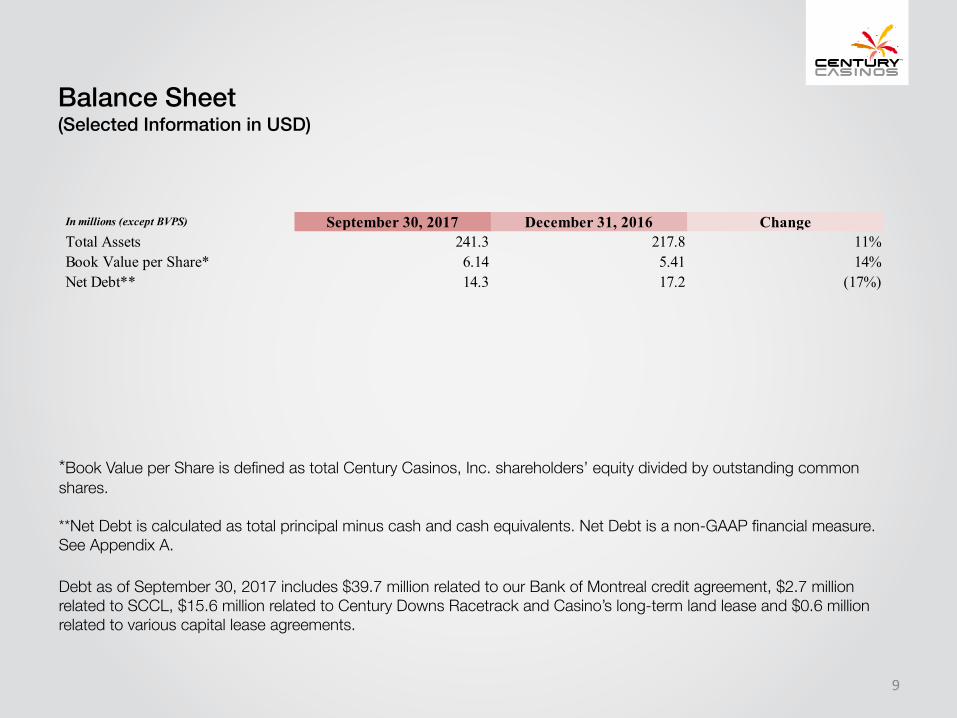
Balance Sheet(Selected Information in USD)
*Book Value per Share is defined as total Century Casinos, Inc. shareholders’ equity divided by outstanding common shares.
**Net Debt is calculated as total principal minus cash and cash equivalents. Net Debt is a non-GAAP financial measure. See Appendix A.
Debt as of September 30, 2017 includes $39.7 million related to our Bank of Montreal credit agreement, $2.7 million related to SCCL, $15.6 million related to Century Downs Racetrack and Casino’s long-term land lease and $0.6 million related to various capital lease agreements.
In millions (except BVPS) September 30, 2017 December 31, 2016 ChangeTotal Assets 241.3 217.8 11%Book Value per Share* 6.14 5.41 14%Net Debt** 14.3 17.2 (17%)
9
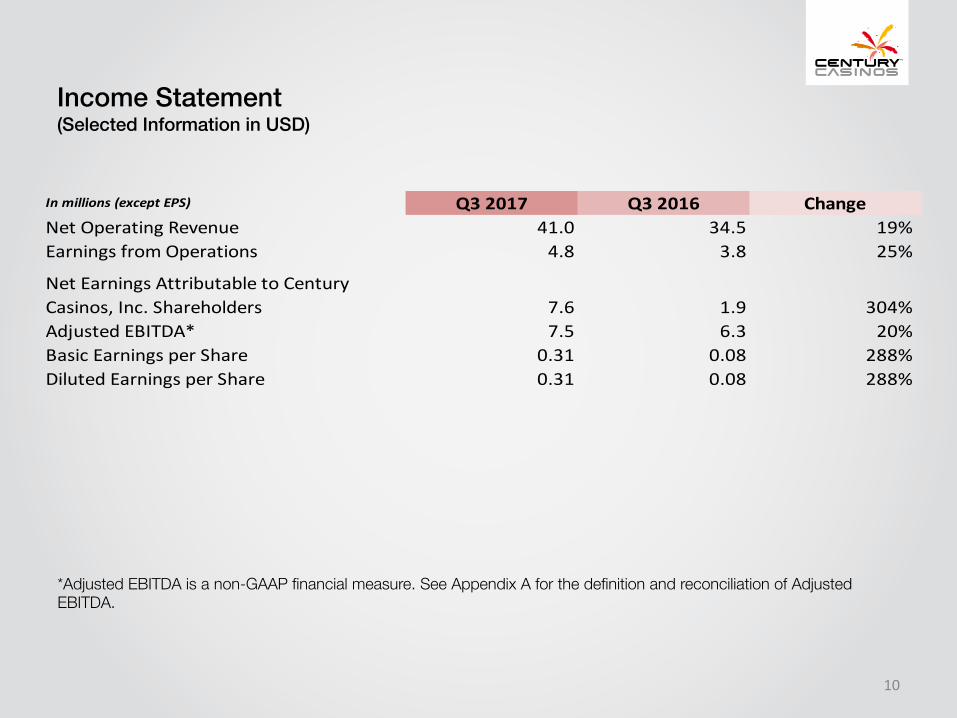
Income Statement(Selected Information in USD)
*Adjusted EBITDA is a non-GAAP financial measure. See Appendix A for the definition and reconciliation of Adjusted EBITDA.
10
Inmillions(exceptEPS) Q32017 Q32016 ChangeNetOperatingRevenue 41.0 34.5 19%EarningsfromOperations 4.8 3.8 25%
NetEarningsAttributabletoCenturyCasinos,Inc.Shareholders 7.6 1.9 304%AdjustedEBITDA* 7.5 6.3 20%BasicEarningsperShare 0.31 0.08 288%DilutedEarningsperShare 0.31 0.08 288%
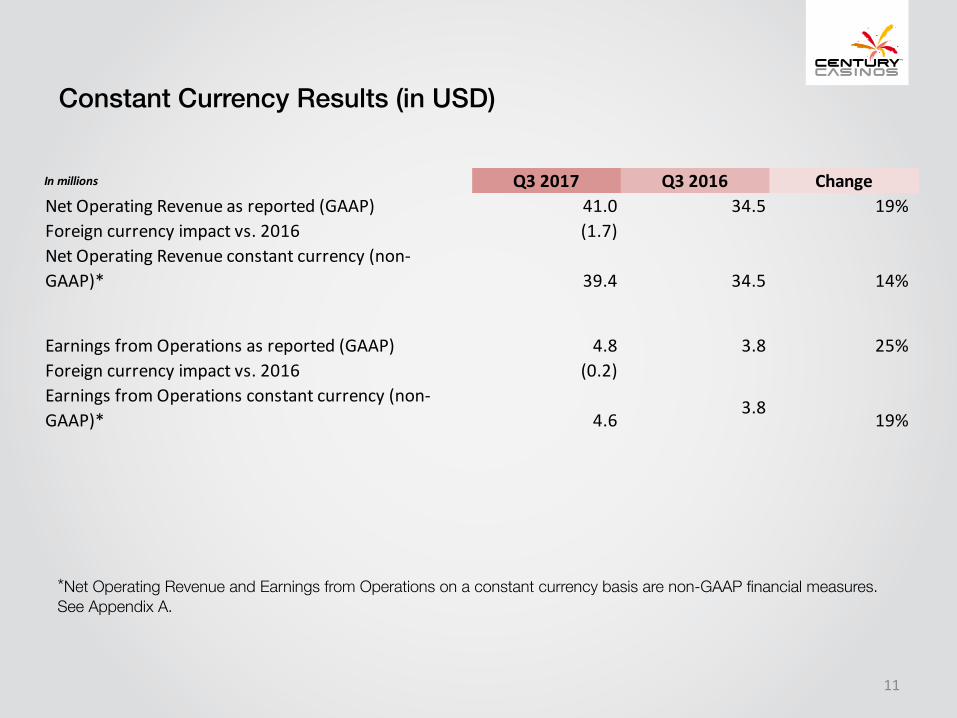
Constant Currency Results (in USD)
*Net Operating Revenue and Earnings from Operations on a constant currency basis are non-GAAP financial measures. See Appendix A.
11
Inmillions Q32017 Q32016 ChangeNetOperatingRevenueasreported(GAAP) 41.0 34.5 19%Foreigncurrencyimpactvs.2016 (1.7)NetOperatingRevenueconstantcurrency(non-GAAP)* 39.4 34.5 14%
EarningsfromOperationsasreported(GAAP) 4.8 3.8 25%Foreigncurrencyimpactvs.2016 (0.2)EarningsfromOperationsconstantcurrency(non-GAAP)* 4.6
3.819%
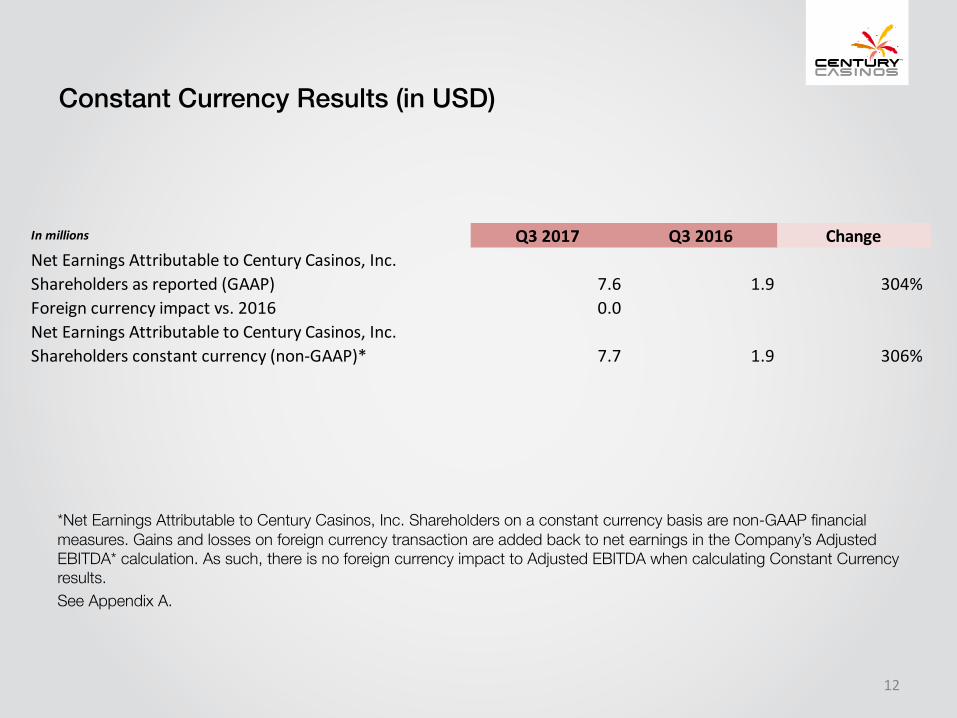
Constant Currency Results (in USD)
*Net Earnings Attributable to Century Casinos, Inc. Shareholders on a constant currency basis are non-GAAP financial measures. Gains and losses on foreign currency transaction are added back to net earnings in the Company’s Adjusted EBITDA* calculation. As such, there is no foreign currency impact to Adjusted EBITDA when calculating Constant Currency results.See Appendix A.
12
Inmillions Q32017 Q32016 ChangeNetEarningsAttributabletoCenturyCasinos,Inc.Shareholdersasreported(GAAP) 7.6 1.9 304%Foreigncurrencyimpactvs.2016 0.0NetEarningsAttributabletoCenturyCasinos,Inc.Shareholdersconstantcurrency(non-GAAP)* 7.7 1.9 306%
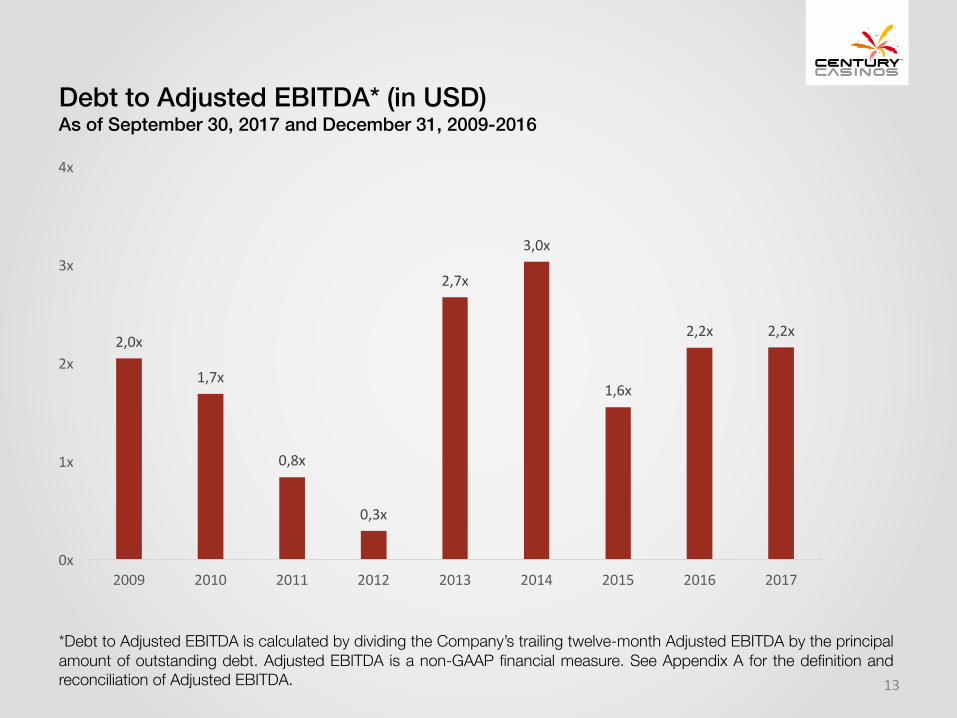
Debt to Adjusted EBITDA* (in USD)As of September 30, 2017 and December 31, 2009-2016
2,0x
1,7x
0,8x
0,3x
2,7x
3,0x
1,6x
2,2x 2,2x
0x
1x
2x
3x
4x
2009 2010 2011 2012 2013 2014 2015 2016 2017
13
*Debt to Adjusted EBITDA is calculated by dividing the Company’s trailing twelve-month Adjusted EBITDA by the principalamount of outstanding debt. Adjusted EBITDA is a non-GAAP financial measure. See Appendix A for the definition andreconciliation of Adjusted EBITDA.
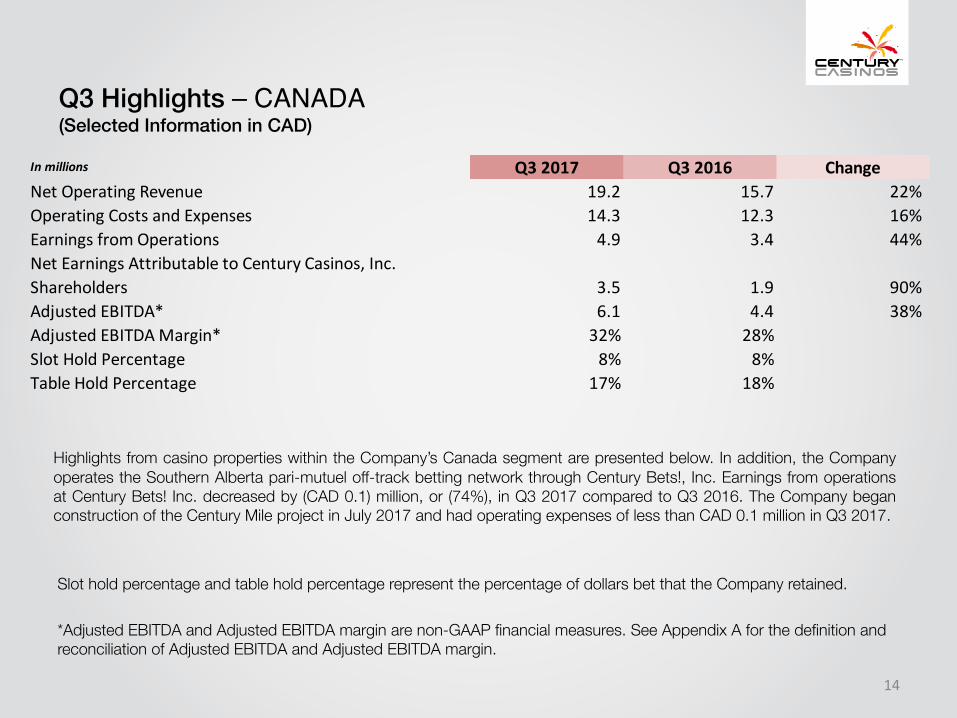
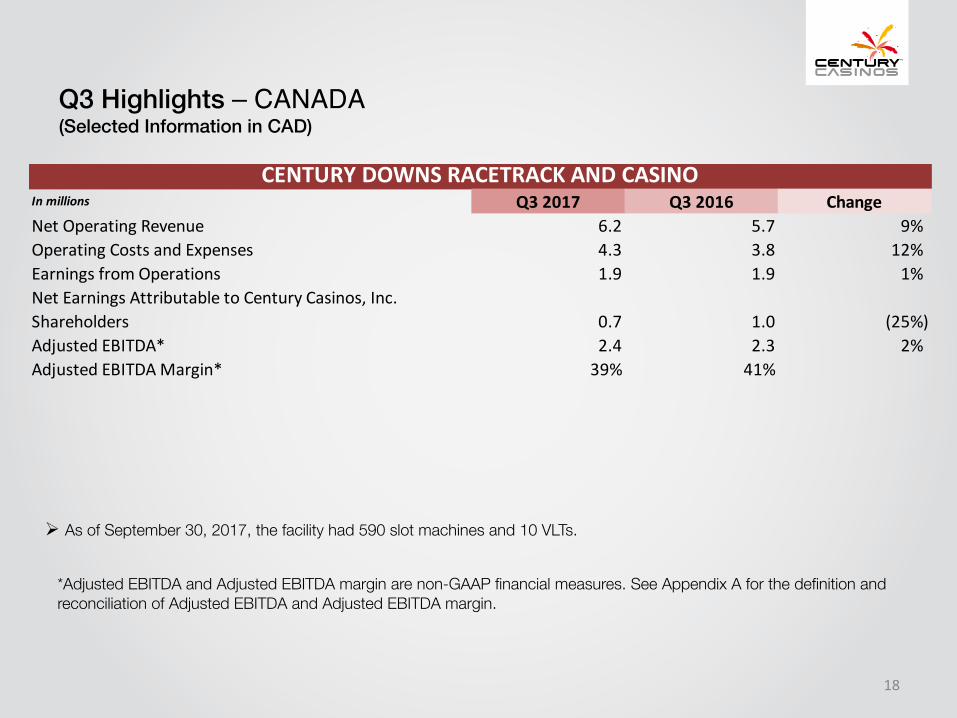
Q3 Highlights – CANADA(Selected Information in CAD)
Slot hold percentage and table hold percentage represent the percentage of dollars bet that the Company retained.
*Adjusted EBITDA and Adjusted EBITDA margin are non-GAAP financial measures. See Appendix A for the definition and reconciliation of Adjusted EBITDA and Adjusted EBITDA margin.
14
Inmillions Q32017 Q32016 ChangeNetOperatingRevenue 19.2 15.7 22%OperatingCostsandExpenses 14.3 12.3 16%EarningsfromOperations 4.9 3.4 44%NetEarningsAttributabletoCenturyCasinos,Inc.Shareholders 3.5 1.9 90%AdjustedEBITDA* 6.1 4.4 38%AdjustedEBITDAMargin* 32% 28%SlotHoldPercentage 8% 8%TableHoldPercentage 17% 18%
Highlights from casino properties within the Company’s Canada segment are presented below. In addition, the Companyoperates the Southern Alberta pari-mutuel off-track betting network through Century Bets!, Inc. Earnings from operationsat Century Bets! Inc. decreased by (CAD 0.1) million, or (74%), in Q3 2017 compared to Q3 2016. The Company beganconstruction of the Century Mile project in July 2017 and had operating expenses of less than CAD 0.1 million in Q3 2017.
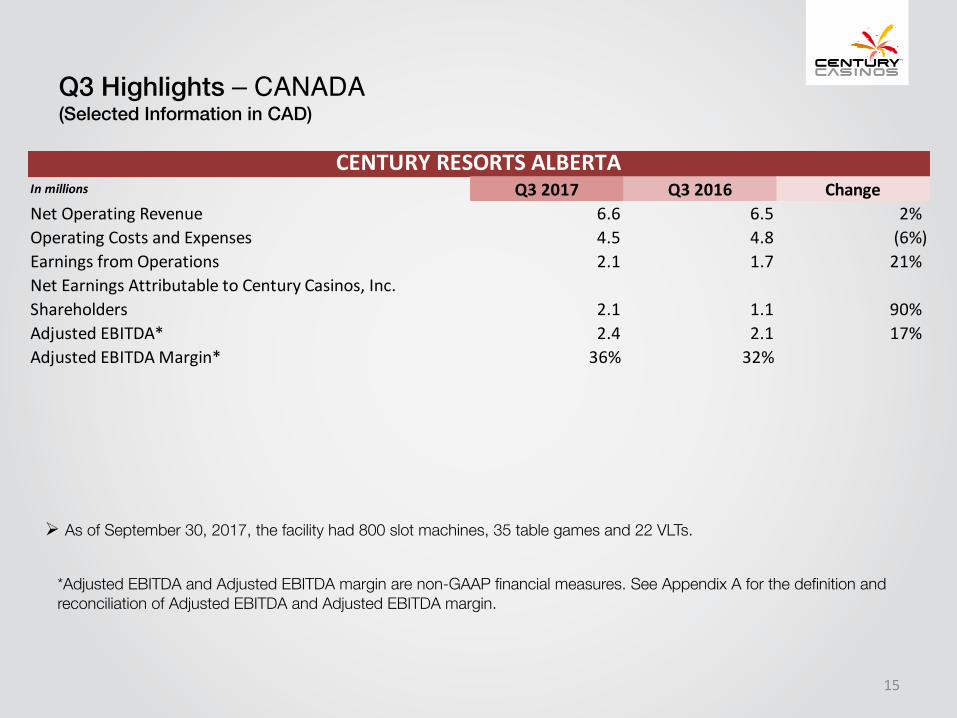
Q3 Highlights – CANADA(Selected Information in CAD)
*Adjusted EBITDA and Adjusted EBITDA margin are non-GAAP financial measures. See Appendix A for the definition and reconciliation of Adjusted EBITDA and Adjusted EBITDA margin.
Ø As of September 30, 2017, the facility had 800 slot machines, 35 table games and 22 VLTs.
15
Inmillions Q32017 Q32016 ChangeNetOperatingRevenue 6.6 6.5 2%OperatingCostsandExpenses 4.5 4.8 (6%)EarningsfromOperations 2.1 1.7 21%NetEarningsAttributabletoCenturyCasinos,Inc.Shareholders 2.1 1.1 90%AdjustedEBITDA* 2.4 2.1 17%AdjustedEBITDAMargin* 36% 32%
CENTURYRESORTSALBERTA
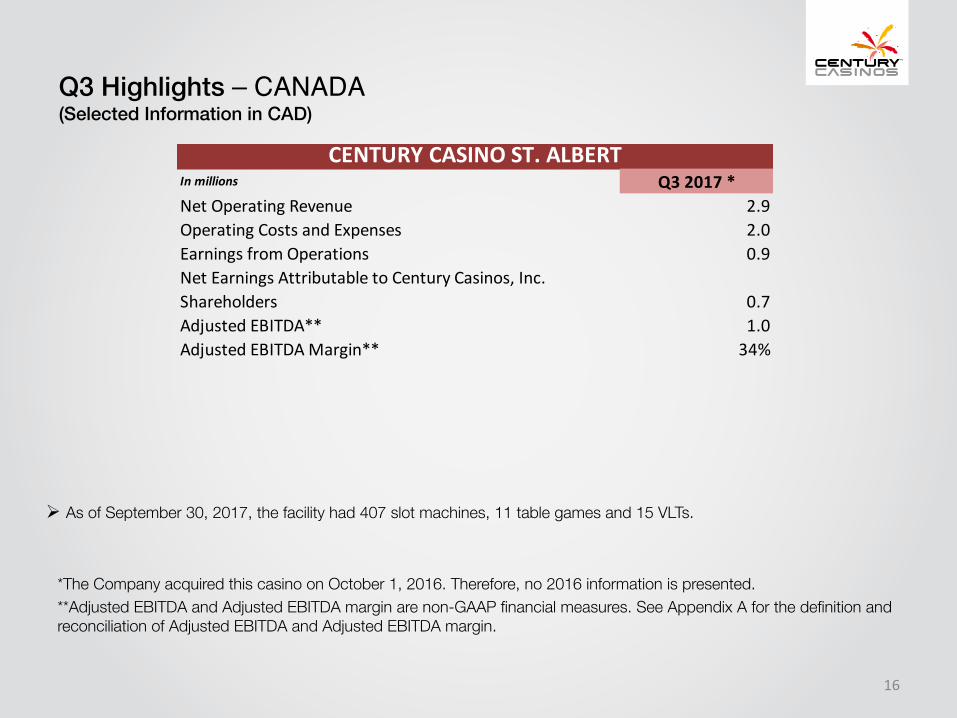
Q3 Highlights – CANADA(Selected Information in CAD)
*The Company acquired this casino on October 1, 2016. Therefore, no 2016 information is presented.**Adjusted EBITDA and Adjusted EBITDA margin are non-GAAP financial measures. See Appendix A for the definition and reconciliation of Adjusted EBITDA and Adjusted EBITDA margin.
Ø As of September 30, 2017, the facility had 407 slot machines, 11 table games and 15 VLTs.
16
Inmillions Q32017*NetOperatingRevenue 2.9OperatingCostsandExpenses 2.0EarningsfromOperations 0.9NetEarningsAttributabletoCenturyCasinos,Inc.Shareholders 0.7AdjustedEBITDA** 1.0AdjustedEBITDAMargin** 34%
CENTURYCASINOST.ALBERT
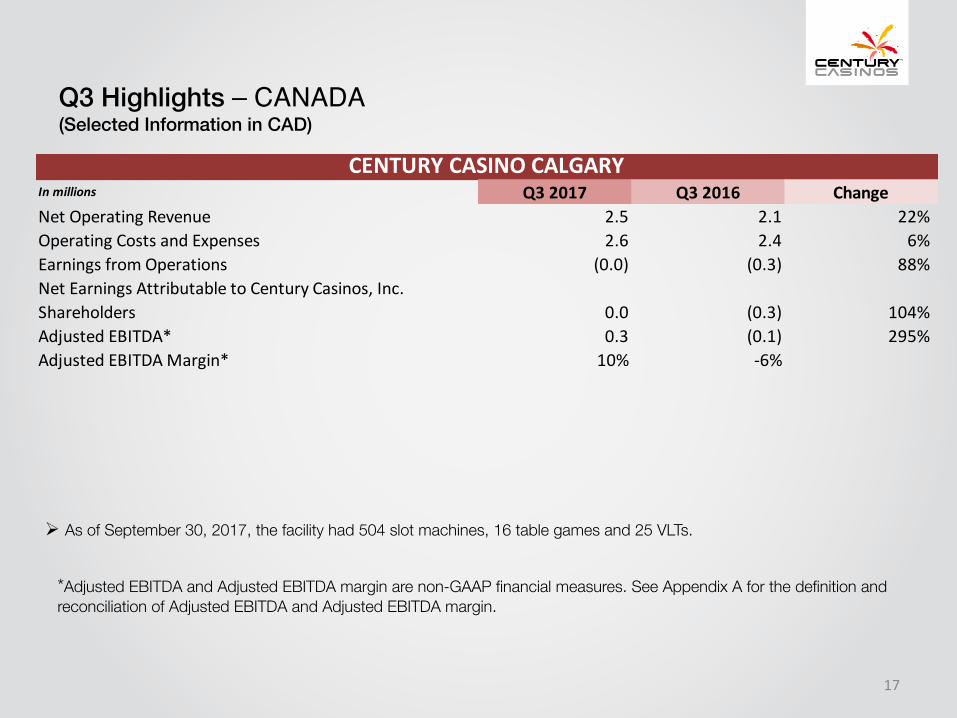
Q3 Highlights – CANADA(Selected Information in CAD)
*Adjusted EBITDA and Adjusted EBITDA margin are non-GAAP financial measures. See Appendix A for the definition and reconciliation of Adjusted EBITDA and Adjusted EBITDA margin.
Ø As of September 30, 2017, the facility had 504 slot machines, 16 table games and 25 VLTs.
17
Inmillions Q32017 Q32016 ChangeNetOperatingRevenue 2.5 2.1 22%OperatingCostsandExpenses 2.6 2.4 6%EarningsfromOperations (0.0) (0.3) 88%NetEarningsAttributabletoCenturyCasinos,Inc.Shareholders 0.0 (0.3) 104%AdjustedEBITDA* 0.3 (0.1) 295%AdjustedEBITDAMargin* 10% -6%
CENTURYCASINOCALGARY
Q3 Highlights – CANADA(Selected Information in CAD)
*Adjusted EBITDA and Adjusted EBITDA margin are non-GAAP financial measures. See Appendix A for the definition and reconciliation of Adjusted EBITDA and Adjusted EBITDA margin.
Ø As of September 30, 2017, the facility had 590 slot machines and 10 VLTs.
18
Inmillions Q32017 Q32016 ChangeNetOperatingRevenue 6.2 5.7 9%OperatingCostsandExpenses 4.3 3.8 12%EarningsfromOperations 1.9 1.9 1%NetEarningsAttributabletoCenturyCasinos,Inc.Shareholders 0.7 1.0 (25%)AdjustedEBITDA* 2.4 2.3 2%AdjustedEBITDAMargin* 39% 41%
CENTURYDOWNSRACETRACKANDCASINO
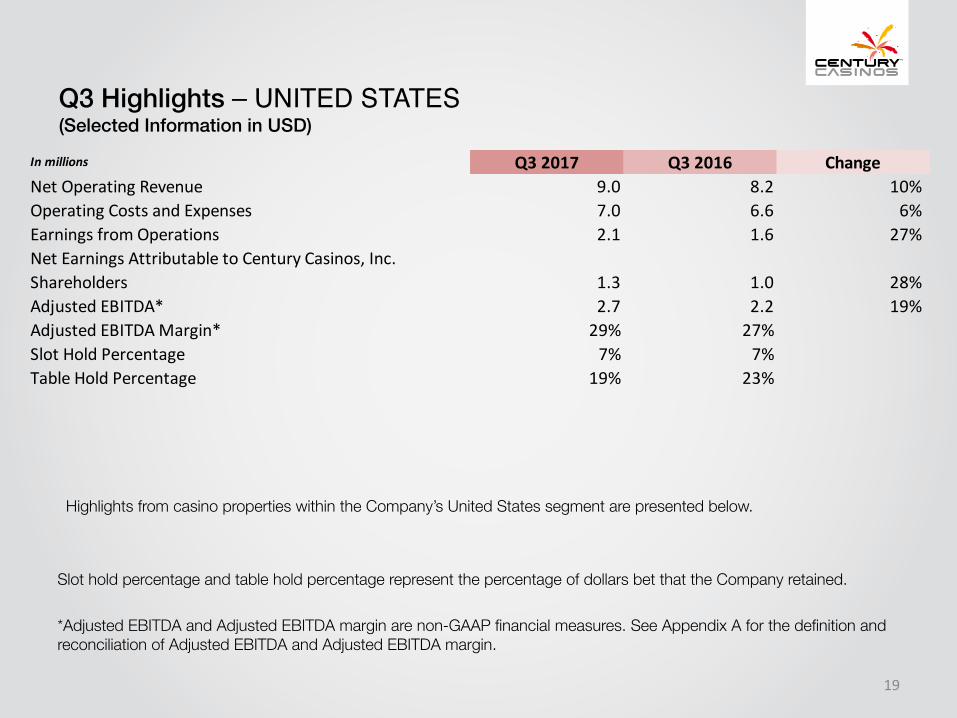
Q3 Highlights – UNITED STATES(Selected Information in USD)
Slot hold percentage and table hold percentage represent the percentage of dollars bet that the Company retained.
*Adjusted EBITDA and Adjusted EBITDA margin are non-GAAP financial measures. See Appendix A for the definition and reconciliation of Adjusted EBITDA and Adjusted EBITDA margin.
19
Inmillions Q32017 Q32016 ChangeNetOperatingRevenue 9.0 8.2 10%OperatingCostsandExpenses 7.0 6.6 6%EarningsfromOperations 2.1 1.6 27%NetEarningsAttributabletoCenturyCasinos,Inc.Shareholders 1.3 1.0 28%AdjustedEBITDA* 2.7 2.2 19%AdjustedEBITDAMargin* 29% 27%SlotHoldPercentage 7% 7%TableHoldPercentage 19% 23%
Highlights from casino properties within the Company’s United States segment are presented below.
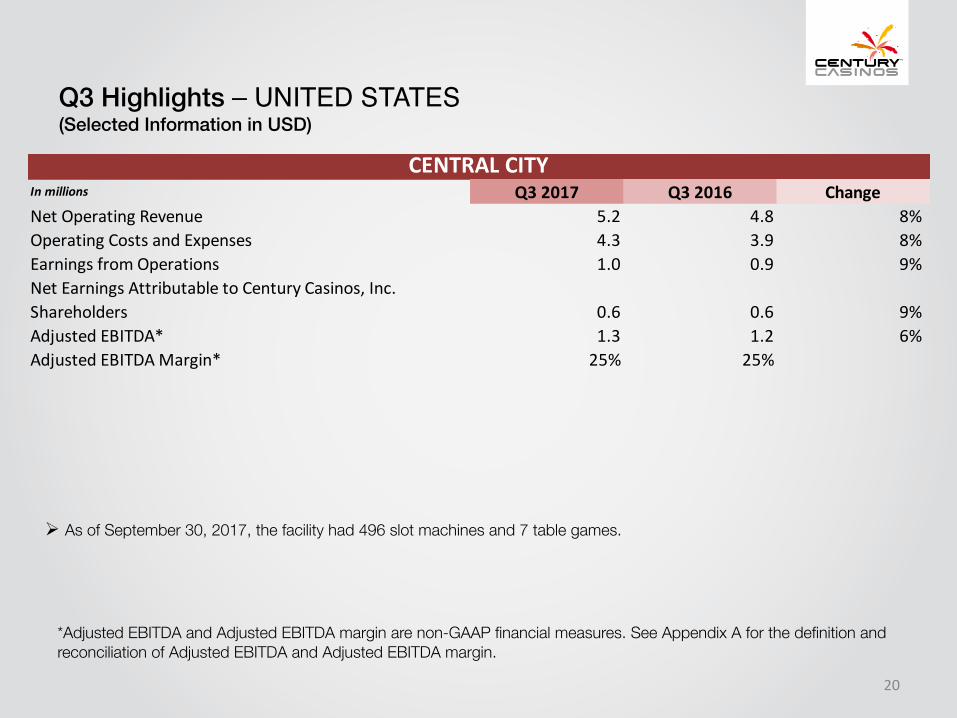
Q3 Highlights – UNITED STATES(Selected Information in USD)
*Adjusted EBITDA and Adjusted EBITDA margin are non-GAAP financial measures. See Appendix A for the definition and reconciliation of Adjusted EBITDA and Adjusted EBITDA margin.
Ø As of September 30, 2017, the facility had 496 slot machines and 7 table games.
20
Inmillions Q32017 Q32016 ChangeNetOperatingRevenue 5.2 4.8 8%OperatingCostsandExpenses 4.3 3.9 8%EarningsfromOperations 1.0 0.9 9%NetEarningsAttributabletoCenturyCasinos,Inc.Shareholders 0.6 0.6 9%AdjustedEBITDA* 1.3 1.2 6%AdjustedEBITDAMargin* 25% 25%
CENTRALCITY
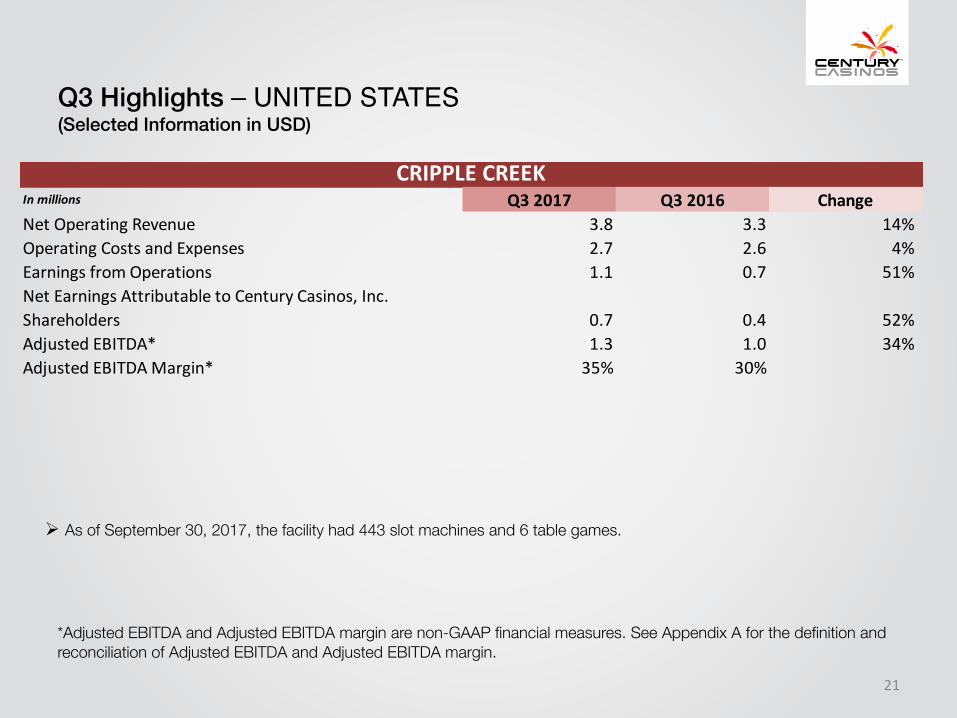
Q3 Highlights – UNITED STATES(Selected Information in USD)
*Adjusted EBITDA and Adjusted EBITDA margin are non-GAAP financial measures. See Appendix A for the definition and reconciliation of Adjusted EBITDA and Adjusted EBITDA margin.
Ø As of September 30, 2017, the facility had 443 slot machines and 6 table games.
21
Inmillions Q32017 Q32016 ChangeNetOperatingRevenue 3.8 3.3 14%OperatingCostsandExpenses 2.7 2.6 4%EarningsfromOperations 1.1 0.7 51%NetEarningsAttributabletoCenturyCasinos,Inc.Shareholders 0.7 0.4 52%AdjustedEBITDA* 1.3 1.0 34%AdjustedEBITDAMargin* 35% 30%
CRIPPLECREEK
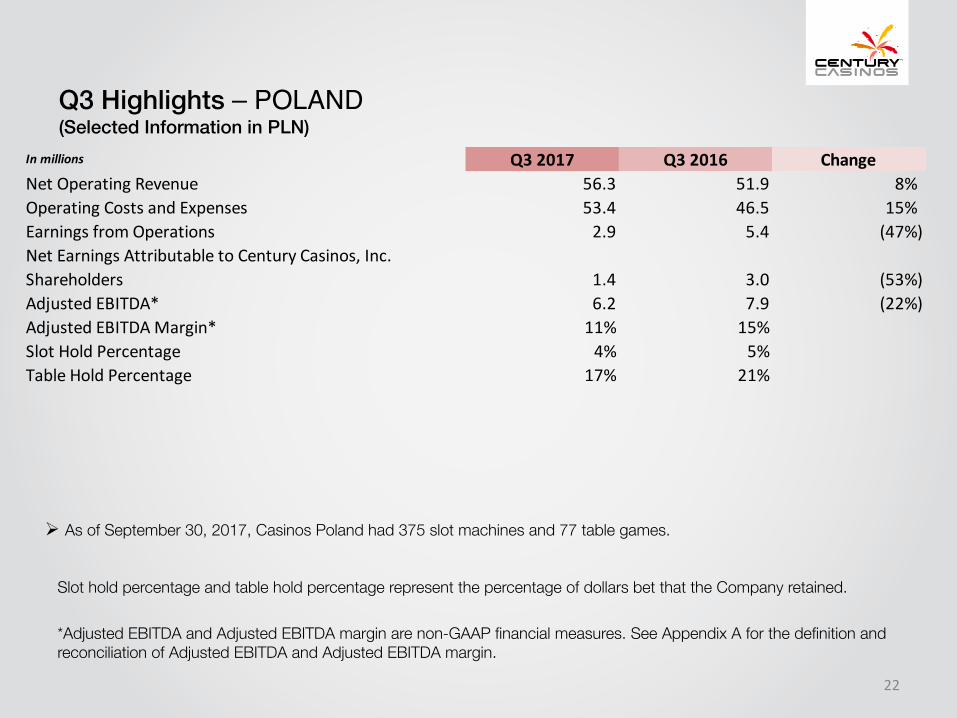
Q3 Highlights – POLAND(Selected Information in PLN)
Slot hold percentage and table hold percentage represent the percentage of dollars bet that the Company retained.
*Adjusted EBITDA and Adjusted EBITDA margin are non-GAAP financial measures. See Appendix A for the definition and reconciliation of Adjusted EBITDA and Adjusted EBITDA margin.
Ø As of September 30, 2017, Casinos Poland had 375 slot machines and 77 table games.
22
Inmillions Q32017 Q32016 ChangeNetOperatingRevenue 56.3 51.9 8%OperatingCostsandExpenses 53.4 46.5 15%EarningsfromOperations 2.9 5.4 (47%)NetEarningsAttributabletoCenturyCasinos,Inc.Shareholders 1.4 3.0 (53%)AdjustedEBITDA* 6.2 7.9 (22%)AdjustedEBITDAMargin* 11% 15%SlotHoldPercentage 4% 5%TableHoldPercentage 17% 21%

Q3 Highlights – CORPORATE AND OTHER(Selected Information in USD)
Slot hold percentage and table hold percentage represent the percentage of dollars bet that the Company retained.
*Adjusted EBITDA and Adjusted EBITDA margin are non-GAAP financial measures. See Appendix A for the definition and reconciliation of Adjusted EBITDA and Adjusted EBITDA margin.
Ø The Corporate and Other segment includes Cruise Ships and Other and Corporate Other reportable segments. Highlights fromCruise Ships and Other within the Company’s Corporate and Other segment are presented below.
Ø Expenses incurred by Corporate Other consist primarily of legal and accounting fees, corporate travel expenses, corporatepayroll, amortization of stock-based compensation and other expenses not directly related to any of our individual properties.Corporate Other losses from operations increased by $0.1 million, or 7.2%, in Q3 2017 compared to Q3 2016 primarily relatedto legal fees for the SCCL acquisition.
Ø The Company released its U.S. valuation allowance in Q3 2017 resulting in a tax benefit of $5.1 million and increasing netearnings.
Ø The Company had $0.1 million in operating expenses related to the SCCL project in Q3 2017.
23
Inmillions Q32017 Q32016 ChangeNetOperatingRevenue 1.2 1.0 20%OperatingCostsandExpenses 3.2 2.7 15%EarningsfromOperations (2.0) (1.8) (12%)NetEarningsAttributabletoCenturyCasinos,Inc.Shareholders 3.3 (1.3) 359%AdjustedEBITDA* (1.4) (1.4) (5%)AdjustedEBITDAMargin* N/A N/ASlotHoldPercentage 7% 7%TableHoldPercentage 11% 17%
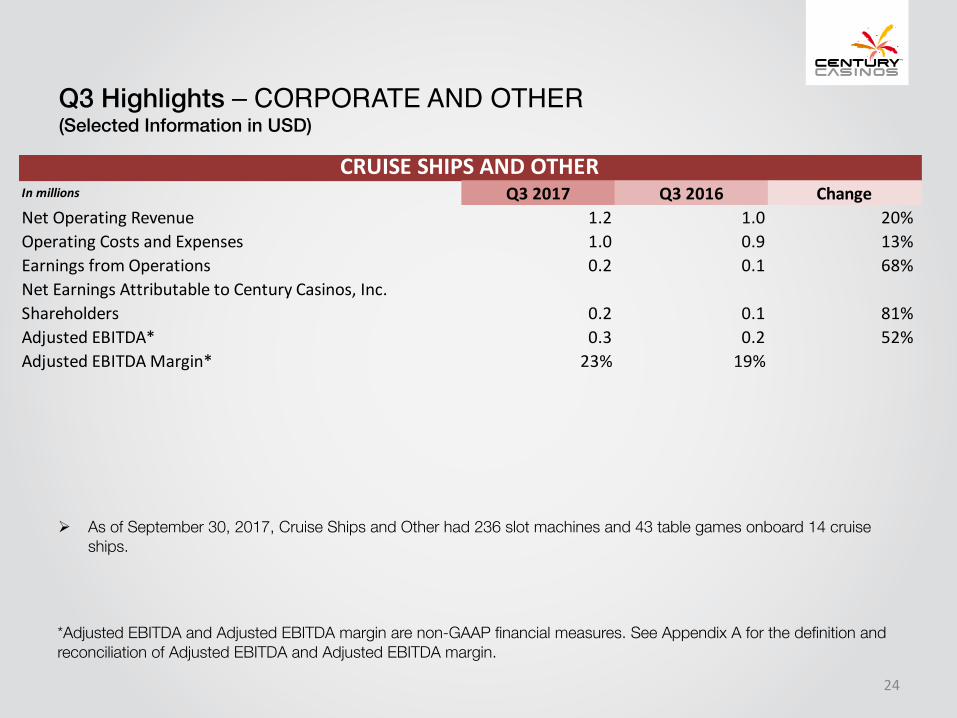
Q3 Highlights – CORPORATE AND OTHER(Selected Information in USD)
*Adjusted EBITDA and Adjusted EBITDA margin are non-GAAP financial measures. See Appendix A for the definition and reconciliation of Adjusted EBITDA and Adjusted EBITDA margin.
24
Ø As of September 30, 2017, Cruise Ships and Other had 236 slot machines and 43 table games onboard 14 cruise ships.
Inmillions Q32017 Q32016 ChangeNetOperatingRevenue 1.2 1.0 20%OperatingCostsandExpenses 1.0 0.9 13%EarningsfromOperations 0.2 0.1 68%NetEarningsAttributabletoCenturyCasinos,Inc.Shareholders 0.2 0.1 81%AdjustedEBITDA* 0.3 0.2 52%AdjustedEBITDAMargin* 23% 19%
CRUISESHIPSANDOTHER
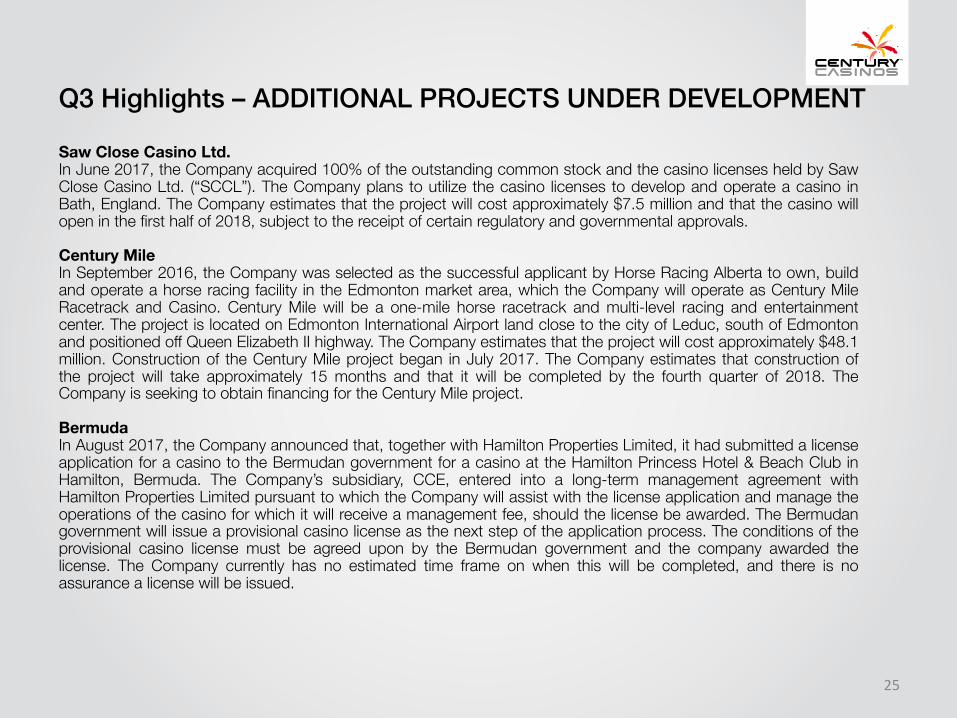
Q3 Highlights – ADDITIONAL PROJECTS UNDER DEVELOPMENT
Saw Close Casino Ltd.In June 2017, the Company acquired 100% of the outstanding common stock and the casino licenses held by SawClose Casino Ltd. (“SCCL”). The Company plans to utilize the casino licenses to develop and operate a casino inBath, England. The Company estimates that the project will cost approximately $7.5 million and that the casino willopen in the first half of 2018, subject to the receipt of certain regulatory and governmental approvals.
Century MileIn September 2016, the Company was selected as the successful applicant by Horse Racing Alberta to own, buildand operate a horse racing facility in the Edmonton market area, which the Company will operate as Century MileRacetrack and Casino. Century Mile will be a one-mile horse racetrack and multi-level racing and entertainmentcenter. The project is located on Edmonton International Airport land close to the city of Leduc, south of Edmontonand positioned off Queen Elizabeth II highway. The Company estimates that the project will cost approximately $48.1million. Construction of the Century Mile project began in July 2017. The Company estimates that construction ofthe project will take approximately 15 months and that it will be completed by the fourth quarter of 2018. TheCompany is seeking to obtain financing for the Century Mile project.
BermudaIn August 2017, the Company announced that, together with Hamilton Properties Limited, it had submitted a licenseapplication for a casino to the Bermudan government for a casino at the Hamilton Princess Hotel & Beach Club inHamilton, Bermuda. The Company’s subsidiary, CCE, entered into a long-term management agreement withHamilton Properties Limited pursuant to which the Company will assist with the license application and manage theoperations of the casino for which it will receive a management fee, should the license be awarded. The Bermudangovernment will issue a provisional casino license as the next step of the application process. The conditions of theprovisional casino license must be agreed upon by the Bermudan government and the company awarded thelicense. The Company currently has no estimated time frame on when this will be completed, and there is noassurance a license will be issued.
25
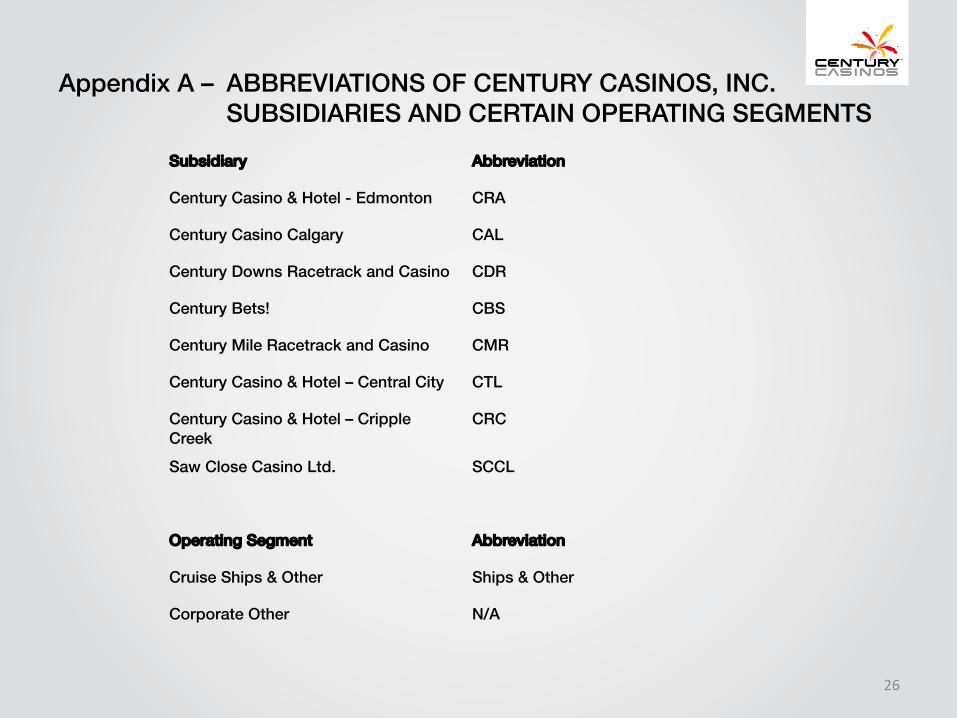
Appendix A – ABBREVIATIONS OF CENTURY CASINOS, INC. SUBSIDIARIES AND CERTAIN OPERATING SEGMENTS
26
Subsidiary Abbreviation
Century Casino & Hotel - Edmonton CRA
Century Casino Calgary CAL
Century Downs Racetrack and Casino CDR
Century Bets! CBS
Century Mile Racetrack and Casino CMR
Century Casino & Hotel – Central City CTL
Century Casino & Hotel – Cripple Creek
CRC
Saw Close Casino Ltd. SCCL
Operating Segment Abbreviation
Cruise Ships & Other Ships & Other
Corporate Other N/A
Appendix A – NON-GAAP FINANCIAL MEASURESThe Company supplements its condensed consolidated financial statements prepared in accordance with U.S.generally accepted accounting principles (“US GAAP”) by using the following non-GAAP financial measures,which management believes are useful in properly understanding the Company’s short-term and long-termfinancial trends. Management uses these non-GAAP financial measures to forecast and evaluate the operationalperformance of the Company as well as to compare results of current periods to prior periods on a consolidatedbasis.
Ø Adjusted EBITDAØ Adjusted EBITDA marginØ Constant currency resultsØ Net Debt
Management believes presenting the non-GAAP financial measures used in this presentation provides investorsgreater transparency to the information used by management for financial and operational decision-making andallows investors to see the Company’s results “through the eyes” of management. Management also believesproviding this information better enables our investors to understand the Company’s operating performance andevaluate the methodology used by management to evaluate and measure such performance.
The adjustments made to U.S. GAAP financial measures result from facts and circumstances that vary infrequency and impact on the Company’s results of operations. The following is an explanation of each of theadjustments that management excludes in calculating its non-GAAP financial measures.
27

Appendix A – NON-GAAP FINANCIAL MEASURESThe Company defines Adjusted EBITDA as net earnings (loss) attributable to Century Casinos, Inc. shareholdersbefore interest expense (income), net, income taxes (benefit), depreciation, amortization, non-controlling interest(earnings) losses and transactions, pre-opening expenses, acquisition costs, non-cash stock-basedcompensation charges, asset impairment costs, (gain) loss on disposition of fixed assets, discontinuedoperations, (gain) loss on foreign currency transactions and other, gain on business combination and certainother one-time items, such as acquisition costs. Intercompany transactions consisting primarily of managementand royalty fees and interest, along with their related tax effects, are excluded from the presentation of netearnings (loss) and Adjusted EBITDA reported for each segment and property. Not all of the aforementioneditems occur in each reporting period, but have been included in the definition based on historical activity. Theseadjustments have no effect on the consolidated results as reported under US GAAP. Adjusted EBITDA is notconsidered a measure of performance recognized under US GAAP. Management believes that Adjusted EBITDAis a valuable measure of the relative performance of the Company and its properties. The gaming industrycommonly uses Adjusted EBITDA as a method of arriving at the economic value of a casino operation.Management uses Adjusted EBITDA to compare the relative operating performance of separate operating unitsby eliminating the above mentioned items associated with the varying levels of capital expenditures forinfrastructure required to generate revenue, and the often high cost of acquiring existing operations. AdjustedEBITDA is used by the Company’s lending institution to gauge operating performance. The Company’scomputation of Adjusted EBITDA may be different from, and therefore may not be comparable to, similarmeasures used by other companies within the gaming industry. Please see the reconciliation of AdjustedEBITDA to net earnings (loss) attributable to Century Casinos, Inc. shareholders below.
The Company defines Adjusted EBITDA margin as Adjusted EBITDA divided by net operating revenue.Management uses this margin as one of several measures to evaluate the efficiency of the Company’s casinooperations.
28
Appendix A – NON-GAAP FINANCIAL MEASURES
The impact of foreign exchange rates is highly variable and difficult to predict. The Company uses a ConstantCurrency basis to show the impact from foreign exchange rates on current period revenue compared to priorperiod revenue using the prior period’s foreign exchange rates. In order to properly understand the underlyingbusiness trends and performance of the Company’s ongoing operations, management believes that investorsmay find it useful to consider the impact of excluding changes in foreign exchange rates from the Company’snet operating revenue, net earnings (loss) attributable to Century Casinos, Inc. shareholders and AdjustedEBITDA.
The Company defines Net Debt as total long-term debt (including current portion) plus deferred financing costsminus cash and cash equivalents. Net Debt is not considered a liquidity measure recognized under US GAAP.Management believes that Net Debt is a valuable measure of our overall financial situation. Net Debt providesinvestors with an indication of our ability to pay off all of our long-term debt if it became due simultaneously.
29
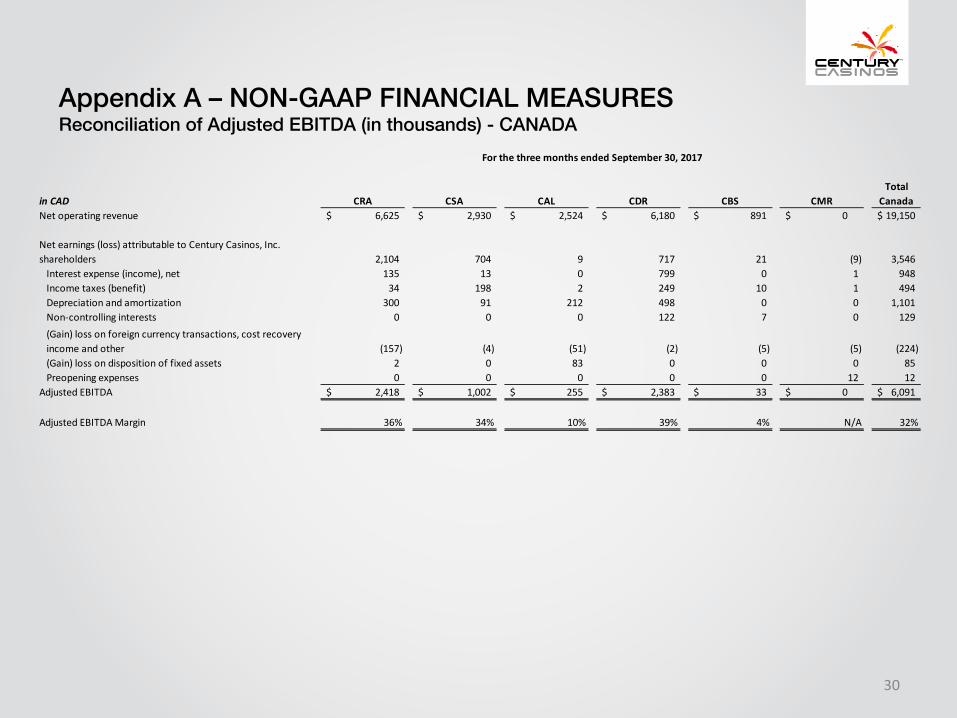
Appendix A – NON-GAAP FINANCIAL MEASURESReconciliation of Adjusted EBITDA (in thousands) - CANADA
30
inCAD CRA CSA CAL CDR CBS CMRTotal
CanadaNetoperatingrevenue 6,625$ 2,930$ 2,524$ 6,180$ 891$ 0$ 19,150$
Netearnings(loss)attributabletoCenturyCasinos,Inc.shareholders 2,104 704 9 717 21 (9) 3,546Interestexpense(income),net 135 13 0 799 0 1 948Incometaxes(benefit) 34 198 2 249 10 1 494Depreciationandamortization 300 91 212 498 0 0 1,101Non-controllinginterests 0 0 0 122 7 0 129(Gain)lossonforeigncurrencytransactions,costrecoveryincomeandother (157) (4) (51) (2) (5) (5) (224)(Gain)lossondispositionoffixedassets 2 0 83 0 0 0 85Preopeningexpenses 0 0 0 0 0 12 12
AdjustedEBITDA 2,418$ 1,002$ 255$ 2,383$ 33$ 0$ 6,091$
AdjustedEBITDAMargin 36% 34% 10% 39% 4% N/A 32%
ForthethreemonthsendedSeptember30,2017
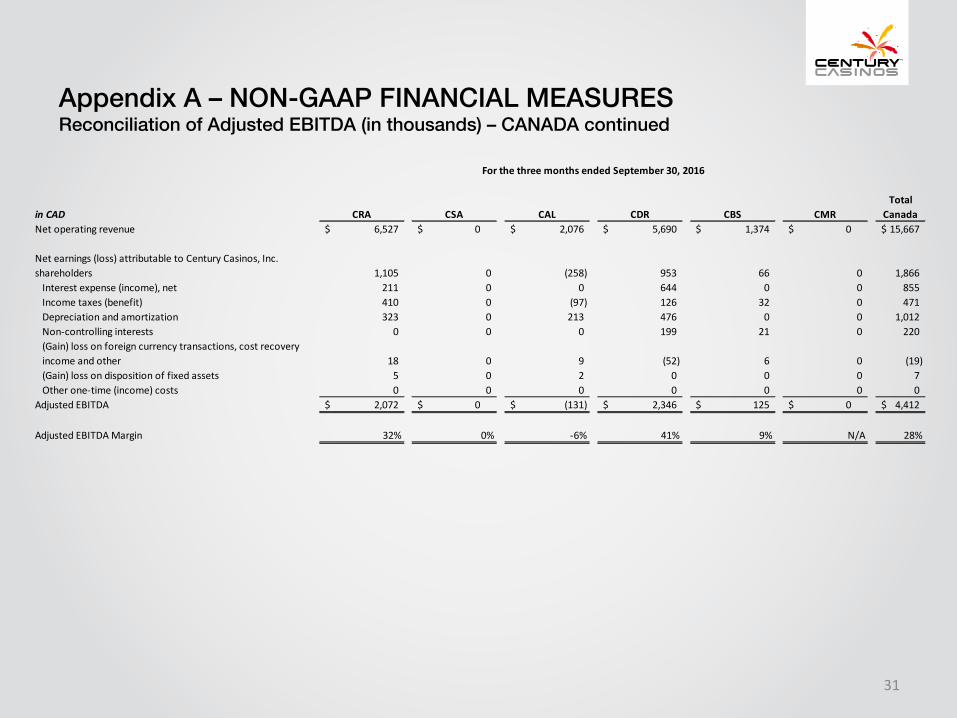
Appendix A – NON-GAAP FINANCIAL MEASURESReconciliation of Adjusted EBITDA (in thousands) – CANADA continued
31
inCAD CRA CSA CAL CDR CBS CMRTotal
CanadaNetoperatingrevenue 6,527$ 0$ 2,076$ 5,690$ 1,374$ 0$ 15,667$
Netearnings(loss)attributabletoCenturyCasinos,Inc.shareholders 1,105 0 (258) 953 66 0 1,866Interestexpense(income),net 211 0 0 644 0 0 855Incometaxes(benefit) 410 0 (97) 126 32 0 471Depreciationandamortization 323 0 213 476 0 0 1,012Non-controllinginterests 0 0 0 199 21 0 220(Gain)lossonforeigncurrencytransactions,costrecoveryincomeandother 18 0 9 (52) 6 0 (19)(Gain)lossondispositionoffixedassets 5 0 2 0 0 0 7Otherone-time(income)costs 0 0 0 0 0 0 0
AdjustedEBITDA 2,072$ 0$ (131)$ 2,346$ 125$ 0$ 4,412$
AdjustedEBITDAMargin 32% 0% -6% 41% 9% N/A 28%
ForthethreemonthsendedSeptember30,2016
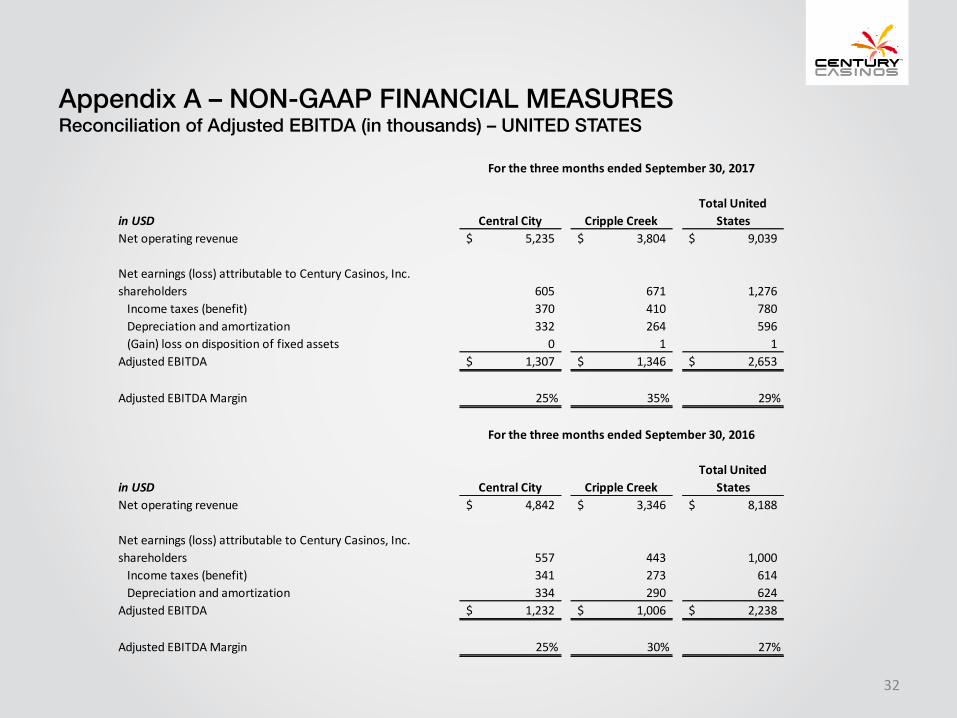
Appendix A – NON-GAAP FINANCIAL MEASURESReconciliation of Adjusted EBITDA (in thousands) – UNITED STATES
32
inUSD CentralCity CrippleCreekTotalUnited
StatesNetoperatingrevenue 5,235$ 3,804$ 9,039$
Netearnings(loss)attributabletoCenturyCasinos,Inc.shareholders 605 671 1,276Incometaxes(benefit) 370 410 780Depreciationandamortization 332 264 596(Gain)lossondispositionoffixedassets 0 1 1
AdjustedEBITDA 1,307$ 1,346$ 2,653$
AdjustedEBITDAMargin 25% 35% 29%
inUSD CentralCity CrippleCreekTotalUnited
StatesNetoperatingrevenue 4,842$ 3,346$ 8,188$
Netearnings(loss)attributabletoCenturyCasinos,Inc.shareholders 557 443 1,000Incometaxes(benefit) 341 273 614Depreciationandamortization 334 290 624
AdjustedEBITDA 1,232$ 1,006$ 2,238$
AdjustedEBITDAMargin 25% 30% 27%
ForthethreemonthsendedSeptember30,2017
ForthethreemonthsendedSeptember30,2016
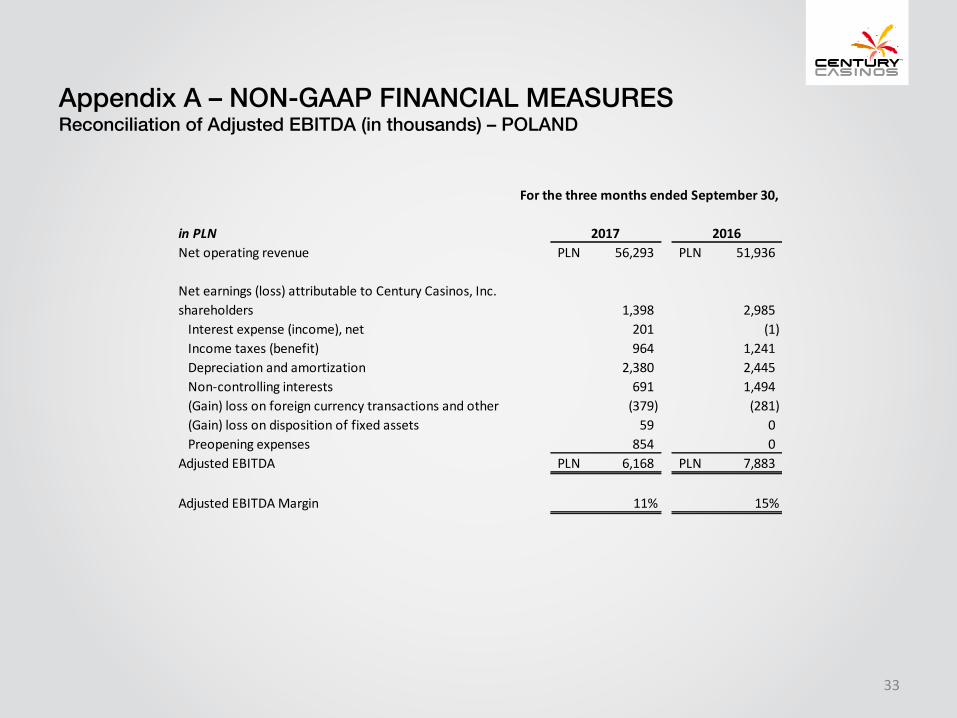
Appendix A – NON-GAAP FINANCIAL MEASURESReconciliation of Adjusted EBITDA (in thousands) – POLAND
33
inPLN 2017 2016Netoperatingrevenue 56,293PLN 51,936PLN
Netearnings(loss)attributabletoCenturyCasinos,Inc.shareholders 1,398 2,985Interestexpense(income),net 201 (1)Incometaxes(benefit) 964 1,241Depreciationandamortization 2,380 2,445Non-controllinginterests 691 1,494(Gain)lossonforeigncurrencytransactionsandother (379) (281)(Gain)lossondispositionoffixedassets 59 0Preopeningexpenses 854 0
AdjustedEBITDA 6,168PLN 7,883PLN
AdjustedEBITDAMargin 11% 15%
ForthethreemonthsendedSeptember30,
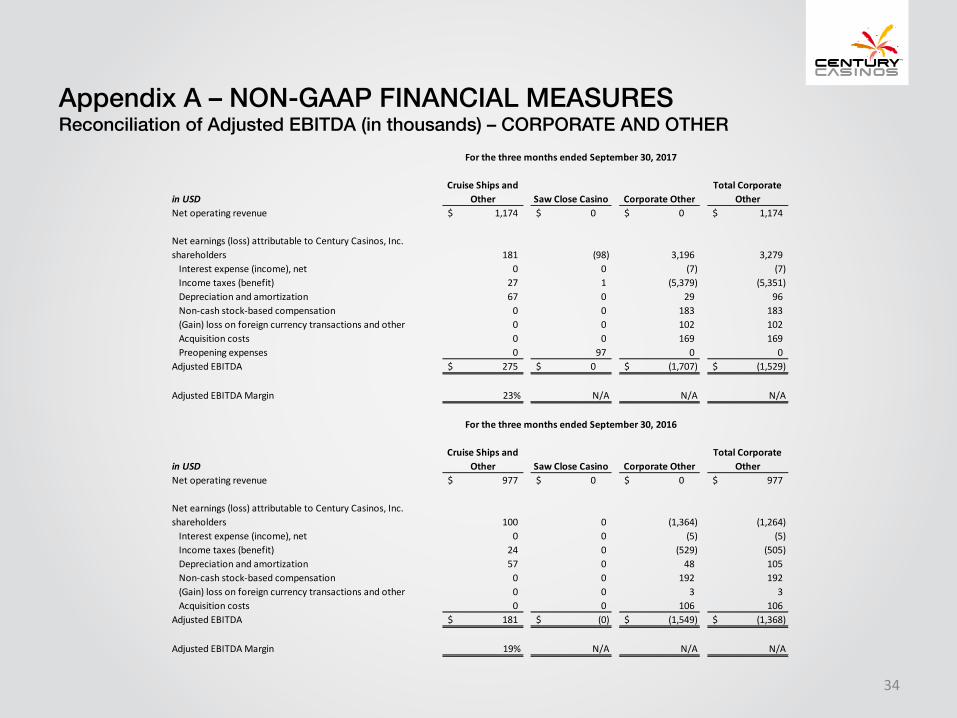
Appendix A – NON-GAAP FINANCIAL MEASURESReconciliation of Adjusted EBITDA (in thousands) – CORPORATE AND OTHER
34
inUSDCruiseShipsand
Other SawCloseCasino CorporateOtherTotalCorporate
OtherNetoperatingrevenue 1,174$ 0$ 0$ 1,174$
Netearnings(loss)attributabletoCenturyCasinos,Inc.shareholders 181 (98) 3,196 3,279Interestexpense(income),net 0 0 (7) (7)Incometaxes(benefit) 27 1 (5,379) (5,351)Depreciationandamortization 67 0 29 96Non-cashstock-basedcompensation 0 0 183 183(Gain)lossonforeigncurrencytransactionsandother 0 0 102 102Acquisitioncosts 0 0 169 169Preopeningexpenses 0 97 0 0
AdjustedEBITDA 275$ 0$ (1,707)$ (1,529)$
AdjustedEBITDAMargin 23% N/A N/A N/A
inUSDCruiseShipsand
Other SawCloseCasino CorporateOtherTotalCorporate
OtherNetoperatingrevenue 977$ 0$ 0$ 977$
Netearnings(loss)attributabletoCenturyCasinos,Inc.shareholders 100 0 (1,364) (1,264)Interestexpense(income),net 0 0 (5) (5)Incometaxes(benefit) 24 0 (529) (505)Depreciationandamortization 57 0 48 105Non-cashstock-basedcompensation 0 0 192 192(Gain)lossonforeigncurrencytransactionsandother 0 0 3 3Acquisitioncosts 0 0 106 106
AdjustedEBITDA 181$ (0)$ (1,549)$ (1,368)$
AdjustedEBITDAMargin 19% N/A N/A N/A
ForthethreemonthsendedSeptember30,2017
ForthethreemonthsendedSeptember30,2016
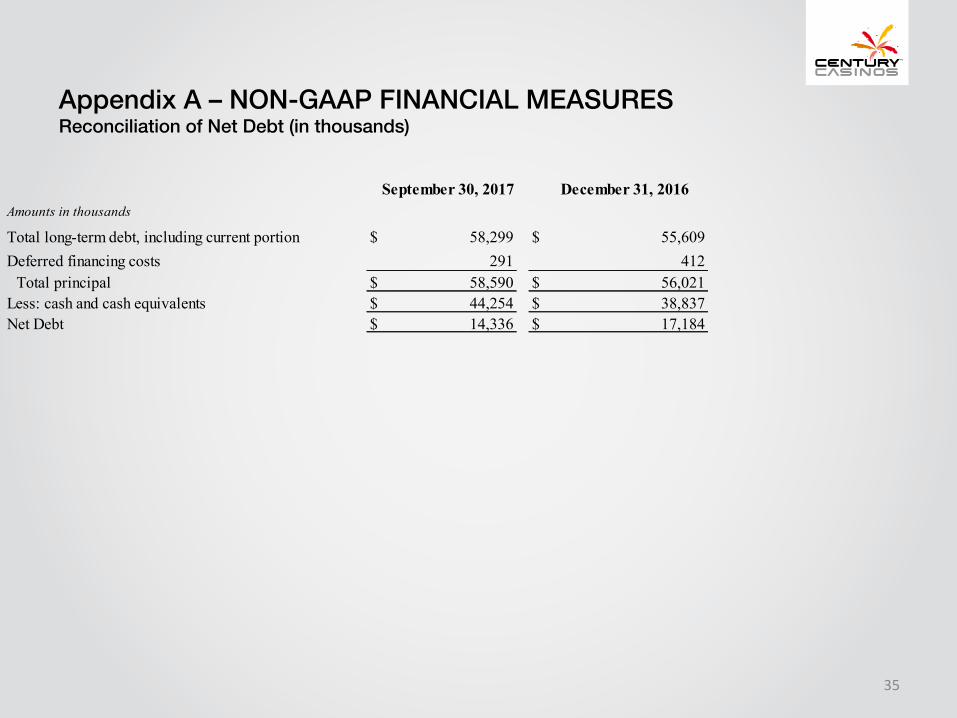
Appendix A – NON-GAAP FINANCIAL MEASURESReconciliation of Net Debt (in thousands)
35
September 30, 2017 December 31, 2016Amounts in thousands
Total long-term debt, including current portion $ 58,299 $ 55,609Deferred financing costs 291 412
Total principal $ 58,590 $ 56,021Less: cash and cash equivalents $ 44,254 $ 38,837Net Debt $ 14,336 $ 17,184