exetertrust company collective investment funds …...exetertrust company collective investment...
TRANSCRIPT

ExeterTrust CompanyCollective Investment Funds for
Employee Benefit Trusts
Manning & Napier RetirementTarget 2060 Collective InvestmentTrustManning & Napier RetirementTarget 2055 Collective InvestmentTrustManning & Napier RetirementTarget 2050 Collective InvestmentTrustManning & Napier RetirementTarget 2045 Collective InvestmentTrustManning & Napier RetirementTarget 2040 Collective InvestmentTrustManning & Napier RetirementTarget 2035 Collective InvestmentTrustManning & Napier RetirementTarget 2030 Collective InvestmentTrustManning & Napier RetirementTarget 2025 Collective InvestmentTrustManning & Napier RetirementTarget 2020 Collective InvestmentTrustManning & Napier RetirementTarget 2015 Collective InvestmentTrustManning & Napier RetirementTarget Income Collective InvestmentTrust
Annual ReportFebruary 28, 2019


Retirement Target 2060
AFFILIATED COLLECTIVE INVESTMENT TRUSTS 100.0%100.0%
Manning & Napier Pro-Mix®
Maximum Term CollectiveInvestment Trust, Class U. . . . . . . . . . . . 606,335 $ 8,612,678 $ 8,870,677
100.0%
TOTAL INVESTMENTS . . . . . . . . . . . . . $8,612,678 $8,870,677
Retirement Target 2055
AFFILIATED COLLECTIVE INVESTMENT TRUSTS 100.0%100.0%
Manning & Napier Pro-Mix®
Maximum Term CollectiveInvestment Trust, Class U. . . . . . . . . . . . 1,135,397 $ 15,412,770 $ 16,610,859
100.0%
TOTAL INVESTMENTS . . . . . . . . . . . . . $15,412,770 $16,610,859
Retirement Target 2050
AFFILIATED COLLECTIVE INVESTMENT TRUSTS 100.0%100.0%
Manning & Napier Pro-Mix®
Maximum Term CollectiveInvestment Trust, Class U. . . . . . . . . . . . 4,929,534 $ 62,783,439 $ 72,119,079
100.0%
TOTAL INVESTMENTS . . . . . . . . . . . . . $62,783,439 $72,119,079
Retirement Target 2045
AFFILIATED COLLECTIVE INVESTMENT TRUSTS 100.0%100.0%
Manning & Napier Pro-Mix®
Extended Term CollectiveInvestment Trust, Class U. . . . . . . . . . . . 528,308 $ 6,545,366 $ 6,788,757
Manning & Napier Pro-Mix®
Maximum Term CollectiveInvestment Trust, Class U. . . . . . . . . . . . 1,922,682 25,599,832 28,128,841
TOTAL AFFILIATEDCOLLECTIVE INVESTMENTTRUSTS . . . . . . . . . . . . . . . . . . . . . . . . . . . . 32,145,198 34,917,598
100.0%
TOTAL INVESTMENTS . . . . . . . . . . . . . $32,145,198 $34,917,598
Retirement Target 2040
AFFILIATED COLLECTIVE INVESTMENT TRUSTS 100.0%100.0%
Manning & Napier Pro-Mix®
Extended Term CollectiveInvestment Trust, Class U. . . . . . . . . . . . 5,539,424 $ 66,611,343 $ 71,181,601
Manning & Napier Pro-Mix®
Maximum Term CollectiveInvestment Trust, Class U. . . . . . . . . . . . 6,155,114 76,220,170 90,049,316
TOTAL AFFILIATEDCOLLECTIVE INVESTMENTTRUSTS . . . . . . . . . . . . . . . . . . . . . . . . . . . . 142,831,513 161,230,917
100.0%
TOTAL INVESTMENTS . . . . . . . . . . . . . $142,831,513 $161,230,917
Retirement Target 2035
AFFILIATED COLLECTIVE INVESTMENT TRUSTS 100.0%100.0%
Manning & Napier Pro-Mix®
Extended Term CollectiveInvestment Trust, Class U. . . . . . . . . . . . 2,963,736 $ 35,910,094 $ 38,084,005
Manning & Napier Pro-Mix®
Maximum Term CollectiveInvestment Trust, Class U. . . . . . . . . . . . 1,155,601 15,502,097 16,906,439
TOTAL AFFILIATEDCOLLECTIVE INVESTMENTTRUSTS . . . . . . . . . . . . . . . . . . . . . . . . . . . . 51,412,191 54,990,444
100.0%
TOTAL INVESTMENTS . . . . . . . . . . . . . $51,412,191 $54,990,444
Retirement Target 2030
AFFILIATED COLLECTIVE INVESTMENT TRUSTS 100.0%100.0%
Manning & Napier Pro-Mix®
Extended Term CollectiveInvestment Trust, Class U. . . . . . . . . . . . 16,545,999 $ 193,988,901 $ 212,616,081
Manning & Napier Pro-Mix®
Maximum Term CollectiveInvestment Trust, Class U. . . . . . . . . . . . 806,802 10,614,144 11,803,513
TOTAL AFFILIATEDCOLLECTIVE INVESTMENTTRUSTS . . . . . . . . . . . . . . . . . . . . . . . . . . . . 204,603,045 224,419,594
100.0%
TOTAL INVESTMENTS . . . . . . . . . . . . . $204,603,045 $224,419,594
Investment Portfolios — February 28, 2019
Units CostValue
(Note A) Units CostValue
(Note A)
The accompanying notes are an integral part of the financial statements.
1

Retirement Target 2025
AFFILIATED COLLECTIVE INVESTMENT TRUSTS 100.0%100.0%
Manning & Napier Pro-Mix®
Extended Term CollectiveInvestment Trust, Class U. . . . . . . . . . . . 2,323,913 $ 28,381,010 $ 29,862,287
Manning & Napier Pro-Mix®
Moderate Term CollectiveInvestment Trust, Class U. . . . . . . . . . . . 3,585,666 42,305,306 44,139,546
TOTAL AFFILIATEDCOLLECTIVE INVESTMENTTRUSTS . . . . . . . . . . . . . . . . . . . . . . . . . . . . 70,686,316 74,001,833
100.0%
TOTAL INVESTMENTS . . . . . . . . . . . . . $70,686,316 $74,001,833
Retirement Target 2020
AFFILIATED COLLECTIVE INVESTMENT TRUSTS 100.0%100.0%
Manning & Napier Pro-Mix®
Extended Term CollectiveInvestment Trust, Class U. . . . . . . . . . . . 669,280 $ 7,900,159 $ 8,600,252
Manning & Napier Pro-Mix®
Moderate Term CollectiveInvestment Trust, Class U. . . . . . . . . . . . 12,968,946 146,761,285 159,647,731
TOTAL AFFILIATEDCOLLECTIVE INVESTMENTTRUSTS . . . . . . . . . . . . . . . . . . . . . . . . . . . . 154,661,444 168,247,983
100.0%
TOTAL INVESTMENTS . . . . . . . . . . . . . $154,661,444 $168,247,983
Retirement Target 2015
AFFILIATED COLLECTIVE INVESTMENT TRUSTS 100.0%100.0%
Manning & Napier Pro-Mix®
Conservative Term CollectiveInvestment Trust, Class U. . . . . . . . . . . . 1,096,189 $ 12,909,192 $ 13,274,849
Manning & Napier Pro-Mix®
Moderate Term CollectiveInvestment Trust, Class U. . . . . . . . . . . . 274,297 3,280,810 3,376,600
TOTAL AFFILIATEDCOLLECTIVE INVESTMENTTRUSTS . . . . . . . . . . . . . . . . . . . . . . . . . . . . 16,190,002 16,651,449
100.0%
TOTAL INVESTMENTS . . . . . . . . . . . . . $16,190,002 $16,651,449
Retirement Target Income
AFFILIATED COLLECTIVE INVESTMENT TRUSTS 100.0%100.0%
Manning & Napier Pro-Mix®
Conservative Term CollectiveInvestment Trust, Class U. . . . . . . . . . . . 5,014,048 $ 54,898,518 $ 60,720,122
100.0%
TOTAL INVESTMENTS . . . . . . . . . . . . . $54,898,518 $60,720,122
Investment Portfolios — February 28, 2019
Units CostValue
(Note A) Units CostValue
(Note A)
The accompanying notes are an integral part of the financial statements.
2

Statements of Assets and Liabilities
February 28, 2019Retirement
Target2060
RetirementTarget2055
RetirementTarget2050
RetirementTarget2045
RetirementTarget2040
RetirementTarget2035
ASSETS:Total investments in securities (Note A):
At value* ...................................... $8,870,677 $16,610,859 $72,119,079 $34,917,598 $161,230,917 $54,990,444Receivable for units sold...................... 11,216 29,035 49,608 45,275 50,794 66,589Receivable for securities sold................ 28,650 — — — 88,424 —Receivable from Trustee (Note C).......... 2,258 1,299 — — — —
TOTAL ASSETS................................ 8,912,801 16,641,193 72,168,687 34,962,873 161,370,135 55,057,033
LIABILITIES:Accrued Trustee fees - advisory (Note
C) ................................................ — — 3,981 435 10,223 2,033Payable for securities purchased ............ — 21,392 3,805 15,246 — 51,330Audit fees payable .............................. 2,598 2,598 2,598 2,598 2,598 2,598Payable for units redeemed................... 2,323 7,643 45,072 17,514 138,122 15,260
TOTAL LIABILITIES ........................ 4,921 31,633 55,456 35,793 150,943 71,221
NET ASSETS ................................... $8,907,880 $16,609,560 $72,113,231 $34,927,080 $161,219,192 $54,985,812
Class SNet Assets ........................................ $ 805,398 $ 2,092,517 $14,410,621 $ 6,453,374 $ 30,294,553 $ 9,803,808UNITS OUTSTANDING ................... 59,014 120,422 779,575 372,718 1,225,046 615,291NET ASSET VALUE ......................... $ 13.65 $ 17.38 $ 18.49 $ 17.31 $ 24.73 $ 15.93
Class INet Assets ........................................ $ 681,135 $ 4,417,646 $14,711,724 $ 7,127,382 $ 23,685,050 $11,034,981UNITS OUTSTANDING ................... 49,547 254,328 790,465 396,521 1,336,913 669,915NET ASSET VALUE ......................... $ 13.75 $ 17.37 $ 18.61 $ 17.97 $ 17.72 $ 16.47
Class U1Net Assets ........................................ $7,421,347 $10,099,397 $42,990,886 $21,346,324 $107,239,589 $34,147,023UNITS OUTSTANDING ................... 550,008 802,034 3,414,769 1,716,587 8,725,921 2,879,729NET ASSET VALUE ......................... $ 13.49 $ 12.59 $ 12.59 $ 12.44 $ 12.29 $ 11.86
*At identified cost.............................. $8,612,678 $15,412,770 $62,783,439 $32,145,198 $142,831,513 $51,412,191
The accompanying notes are an integral part of the financial statements.
3

Statements of Assets and Liabilities
February 28, 2019Retirement
Target2030
RetirementTarget2025
RetirementTarget2020
RetirementTarget2015
RetirementTargetIncome
ASSETS:Total investments in securities (Note A):
At value* ............................................. $224,419,594 $74,001,833 $168,247,983 $16,651,449 $60,720,122Receivable for units sold............................. 75,713 49,965 34,678 4,786 3,066Receivable for securities sold....................... — 682 278,670 — 7,966Receivable from Trustee (Note C)................. — — — 1,567 —
TOTAL ASSETS....................................... 224,495,307 74,052,480 168,561,331 16,657,802 60,731,154
LIABILITIES:Accrued Trustee fees - advisory (Note C)....... 22,453 1,742 18,949 — 9,274Payable for securities purchased ................... 65,423 — — 3,920 —Audit fees payable ..................................... 2,598 2,598 2,598 2,598 2,598Payable for units redeemed.......................... 9,867 50,647 313,348 867 10,440
TOTAL LIABILITIES ............................... 100,341 54,987 334,895 7,385 22,312
NET ASSETS .......................................... $224,394,966 $73,997,493 $168,226,436 $16,650,417 $60,708,842
Class SNet Assets ............................................... $ 63,456,138 $ 7,679,523 $ 53,036,593 $ 2,301,412 $30,923,666UNITS OUTSTANDING .......................... 2,668,442 531,159 2,427,632 170,973 1,612,464NET ASSET VALUE ................................ $ 23.78 $ 14.46 $ 21.85 $ 13.46 $ 19.18
Class INet Assets ............................................... $ 37,333,789 $13,127,006 $ 33,578,682 $ 2,114,026 $15,100,667UNITS OUTSTANDING .......................... 2,183,218 881,970 2,036,543 153,043 896,568NET ASSET VALUE ................................ $ 17.10 $ 14.88 $ 16.49 $ 13.81 $ 16.84
Class U1Net Assets ............................................... $123,605,039 $53,190,964 $ 81,611,161 $12,234,979 $14,684,509UNITS OUTSTANDING .......................... 10,614,785 4,730,612 7,300,055 1,104,812 1,317,155NET ASSET VALUE ................................ $ 11.64 $ 11.24 $ 11.18 $ 11.07 $ 11.15
*At identified cost..................................... $204,603,045 $70,686,316 $154,661,444 $16,190,002 $54,898,518
The accompanying notes are an integral part of the financial statements.
4

Statements of Operations
For the Year Ended February 28, 2019Retirement
Target2060
RetirementTarget2055
RetirementTarget2050
RetirementTarget2045
RetirementTarget2040
RetirementTarget2035
INVESTMENT INCOME:Total Investment Income...................... $ — $ — $ — $ — $ — $ —
EXPENSES:Trustee fees - advisory (Class S)
(Note C)........................................ 2,286 6,925 52,455 22,961 118,203 33,601Trustee fees - advisory (Class I)
(Note C)........................................ 1,553 8,056 41,444 13,067 73,643 20,858Audit fees ......................................... 7,610 7,610 7,610 7,610 7,610 7,610
Total Expenses .................................. 11,449 22,591 101,509 43,638 199,456 62,069Less reimbursement of expenses
(Note C)........................................ (7,610) (7,610) (7,610) (7,610) (7,610) (7,610)
Net Expenses .................................... 3,839 14,981 93,899 36,028 191,846 54,459
NET INVESTMENT LOSS ................. (3,839) (14,981) (93,899) (36,028) (191,846) (54,459)
REALIZED AND UNREALIZEDGAIN ON INVESTMENTS:Net realized gain on investments ........... 319,296 626,393 4,156,940 989,324 9,287,405 1,272,245Net change in unrealized appreciation
(depreciation) on investments ............ (124,104) (159,429) (2,156,860) (72,711) (5,191,657) (43,565)
NET REALIZED AND UNREALIZEDGAIN ON INVESTMENTS ............. 195,192 466,964 2,000,080 916,613 4,095,748 1,228,680
NET INCREASE IN NET ASSETSRESULTING FROM OPERATIONS.. $ 191,353 $ 451,983 $ 1,906,181 $880,585 $ 3,903,902 $1,174,221
The accompanying notes are an integral part of the financial statements.
5

Statements of Operations
For the Year Ended February 28, 2019Retirement
Target2030
RetirementTarget2025
RetirementTarget2020
RetirementTarget2015
RetirementTargetIncome
INVESTMENT INCOME:Total Investment Income............................. $ — $ — $ — $ — $ —
EXPENSES:Trustee fees - advisory (Class S)
(Note C)............................................... 245,068 28,670 212,734 9,077 122,151Trustee fees - advisory (Class I)
(Note C)............................................... 110,623 25,013 92,332 4,623 37,951Audit fees ................................................ 7,610 7,610 7,610 7,610 7,610
Total Expenses ......................................... 363,301 61,293 312,676 21,310 167,712Less reimbursement of expenses
(Note C)............................................... (7,610) (7,610) (7,610) (7,610) (7,610)
Net Expenses ........................................... 355,691 53,683 305,066 13,700 160,102
NET INVESTMENT LOSS ........................ (355,691) (53,683) (305,066) (13,700) (160,102)
REALIZED AND UNREALIZED GAINON INVESTMENTS:Net realized gain on investments .................. 9,849,377 2,059,716 8,166,637 484,120 2,299,433Net change in unrealized appreciation
(depreciation) on investments ................... (4,680,363) (457,918) (3,979,417) (29,478) (494,394)
NET REALIZED AND UNREALIZEDGAIN ON INVESTMENTS .................... 5,169,014 1,601,798 4,187,220 454,642 1,805,039
NET INCREASE IN NET ASSETSRESULTING FROM OPERATIONS......... $ 4,813,323 $1,548,115 $ 3,882,154 $440,942 $1,644,937
The accompanying notes are an integral part of the financial statements.
6
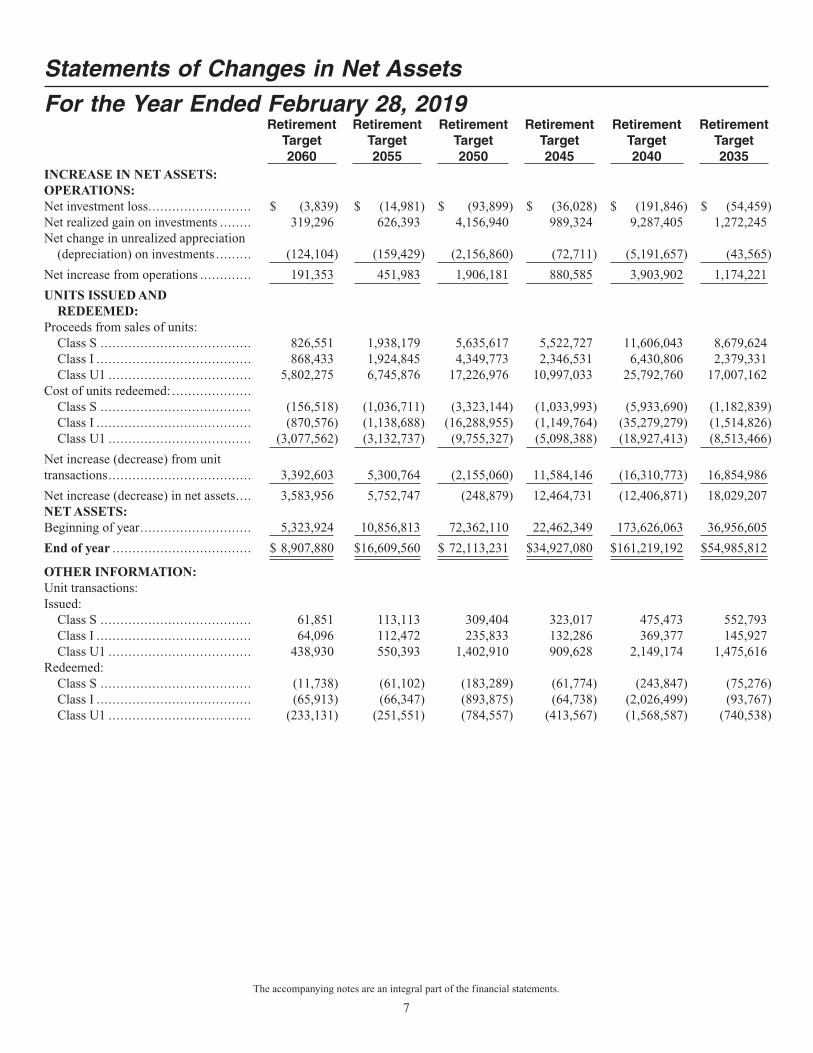
Statements of Changes in Net Assets
For the Year Ended February 28, 2019Retirement
Target2060
RetirementTarget2055
RetirementTarget2050
RetirementTarget2045
RetirementTarget2040
RetirementTarget2035
INCREASE IN NET ASSETS:OPERATIONS:Net investment loss.......................... $ (3,839) $ (14,981) $ (93,899) $ (36,028) $ (191,846) $ (54,459)Net realized gain on investments ........ 319,296 626,393 4,156,940 989,324 9,287,405 1,272,245Net change in unrealized appreciation
(depreciation) on investments ......... (124,104) (159,429) (2,156,860) (72,711) (5,191,657) (43,565)
Net increase from operations ............. 191,353 451,983 1,906,181 880,585 3,903,902 1,174,221
UNITS ISSUED ANDREDEEMED:
Proceeds from sales of units:Class S ...................................... 826,551 1,938,179 5,635,617 5,522,727 11,606,043 8,679,624Class I ....................................... 868,433 1,924,845 4,349,773 2,346,531 6,430,806 2,379,331Class U1 .................................... 5,802,275 6,745,876 17,226,976 10,997,033 25,792,760 17,007,162
Cost of units redeemed: ....................Class S ...................................... (156,518) (1,036,711) (3,323,144) (1,033,993) (5,933,690) (1,182,839)Class I ....................................... (870,576) (1,138,688) (16,288,955) (1,149,764) (35,279,279) (1,514,826)Class U1 .................................... (3,077,562) (3,132,737) (9,755,327) (5,098,388) (18,927,413) (8,513,466)
Net increase (decrease) from unittransactions.................................... 3,392,603 5,300,764 (2,155,060) 11,584,146 (16,310,773) 16,854,986
Net increase (decrease) in net assets.... 3,583,956 5,752,747 (248,879) 12,464,731 (12,406,871) 18,029,207NET ASSETS:Beginning of year............................ 5,323,924 10,856,813 72,362,110 22,462,349 173,626,063 36,956,605
End of year ................................... $ 8,907,880 $16,609,560 $ 72,113,231 $34,927,080 $161,219,192 $54,985,812
OTHER INFORMATION:Unit transactions:Issued:
Class S ...................................... 61,851 113,113 309,404 323,017 475,473 552,793Class I ....................................... 64,096 112,472 235,833 132,286 369,377 145,927Class U1 .................................... 438,930 550,393 1,402,910 909,628 2,149,174 1,475,616
Redeemed:Class S ...................................... (11,738) (61,102) (183,289) (61,774) (243,847) (75,276)Class I ....................................... (65,913) (66,347) (893,875) (64,738) (2,026,499) (93,767)Class U1 .................................... (233,131) (251,551) (784,557) (413,567) (1,568,587) (740,538)
The accompanying notes are an integral part of the financial statements.
7

Statements of Changes in Net Assets
For the Year Ended February 28, 2019Retirement
Target2030
RetirementTarget2025
RetirementTarget2020
RetirementTarget2015
RetirementTargetIncome
INCREASE (DECREASE) IN NET ASSETS:OPERATIONS:Net investment loss.......................................... $ (355,691) $ (53,683) $ (305,066) $ (13,700) $ (160,102)Net realized gain on investments ........................ 9,849,377 2,059,716 8,166,637 484,120 2,299,433Net change in unrealized appreciation
(depreciation) on investments ......................... (4,680,363) (457,918) (3,979,417) (29,478) (494,394)
Net increase from operations ............................. 4,813,323 1,548,115 3,882,154 440,942 1,644,937
UNITS ISSUED AND REDEEMED:Proceeds from sales of units:
Class S ...................................................... 14,586,989 5,212,733 7,044,241 861,229 3,885,226Class I ....................................................... 6,215,908 4,142,142 4,934,237 359,961 1,659,473Class U1 .................................................... 31,771,578 22,064,749 20,891,563 3,169,836 4,147,706
Cost of units redeemed:Class S ...................................................... (9,978,579) (1,581,064) (8,647,684) (303,316) (5,113,623)Class I ....................................................... (49,183,119) (3,410,243) (38,866,585) (1,013,708) (9,529,740)Class U1 .................................................... (20,833,234) (13,705,892) (24,121,326) (4,537,466) (5,685,016)
Net increase (decrease) from unit transactions ...... (27,420,457) 12,722,425 (38,765,554) (1,463,464) (10,635,974)
Net increase (decrease) in net assets.................... (22,607,134) 14,270,540 (34,883,400) (1,022,522) (8,991,037)NET ASSETS:Beginning of year............................................ 247,002,100 59,726,953 203,109,836 17,672,939 69,699,879
End of year ................................................... $224,394,966 $ 73,997,493 $168,226,436 $16,650,417 $ 60,708,842
OTHER INFORMATION:Unit transactions:Issued:
Class S ...................................................... 623,302 365,015 327,974 65,361 206,723Class I ....................................................... 367,794 280,800 304,525 26,551 100,423Class U1 .................................................... 2,799,057 2,013,371 1,910,028 294,447 382,975
Redeemed:Class S ...................................................... (427,964) (111,153) (401,662) (23,070) (272,844)Class I ....................................................... (2,915,088) (232,427) (2,389,989) (75,006) (578,103)Class U1 .................................................... (1,840,820) (1,253,306) (2,209,273) (418,971) (524,367)
The accompanying notes are an integral part of the financial statements.
8

Financial HighlightsRetirement Target 2060 Retirement Target 2055
ForThe Year
Ended2/28/19
ForThe Year
Ended2/28/19
ForThe Year
Ended2/28/19
ForThe Year
Ended2/28/19
ForThe Year
Ended2/28/19
ForThe Year
Ended2/28/19
Class S Class I Class U1 Class S Class I Class U1Per unit data (for a unitoutstanding throughoutthe year):Net asset value -
Beginning of year ........ $ 13.33 $ 13.40 $ 13.12 $ 16.98 $ 16.94 $ 12.26
Income from investmentoperations:
Net investment loss1 ........ (0.05) (0.03) — (0.07) (0.03) —Net realized and
unrealized gain (loss)on investments ............ 0.37 0.38 0.37 0.47 0.46 0.33
Total from investmentoperations .................. 0.32 0.35 0.37 0.40 0.43 0.33
Net asset value - End ofyear .......................... $ 13.65 $ 13.75 $ 13.49 $ 17.38 $ 17.37 $ 12.59
Net assets - End of year(000’s omitted)............ $ 806 $ 681 $ 7,421 $ 2,093 $ 4,418 $10,099
Total return2................... 2.40% 2.61% 2.82% 2.36% 2.54% 2.69%Ratios (to average netassets):Expenses3 ...................... 0.40% 0.20% —% 0.40% 0.20% —%Net investment loss.......... (0.40%) (0.20%) —% (0.40%) (0.20%) —%Portfolio turnover ............ 36% 36% 36% 22% 22% 22%Without the voluntary expense waivers and reimbursements, the expense ratio would have been increased by the following amount:
0.10% 0.11% 0.10% 0.05% 0.05% 0.05%1 Calculated based on average daily units outstanding during the year.2 Represents aggregate total return for the year. The return would have been lower absent the voluntary waivers and reimbursements of expenses.3 The ratio includes only those expenses charged directly to the Trust and does not include those charged directly to participating accounts or any expenses incurred indirectly throughinvestment in the underlying trusts.
The expense ratios of theunderlying trusts were: 0.49% 0.49% 0.49% 0.49% 0.49% 0.49%The expense ratios of the Trustswere: 0.40% 0.20% —% 0.40% 0.20% —%
The net expense ratios of the Trustsand the underlying trusts were: 0.89% 0.69% 0.49% 0.89% 0.69% 0.49%
The accompanying notes are an integral part of the financial statements.
9

Financial HighlightsRetirement Target 2050 Retirement Target 2045
ForThe Year
Ended2/28/19
ForThe Year
Ended2/28/19
ForThe Year
Ended2/28/19
ForThe Year
Ended2/28/19
ForThe Year
Ended2/28/19
ForThe Year
Ended2/28/19
Class S Class I Class U1 Class S Class I Class U1Per unit data (for a unitoutstanding throughoutthe year):Net asset value -
Beginning of year ........ $ 18.06 $ 18.15 $ 12.25 $ 16.95 $ 17.56 $ 12.12
Income from investmentoperations:
Net investment loss1 ........ (0.07) (0.04) — (0.07) (0.04) —Net realized and
unrealized gain (loss)on investments ............ 0.50 0.50 0.34 0.43 0.45 0.32
Total from investmentoperations .................. 0.43 0.46 0.34 0.36 0.41 0.32
Net asset value - End ofyear .......................... $ 18.49 $ 18.61 $ 12.59 $ 17.31 $ 17.97 $ 12.44
Net assets - End of year(000’s omitted)............ $ 14,410 $ 14,712 $42,991 $ 6,453 $ 7,128 $21,346
Total return2................... 2.38% 2.53% 2.78% 2.12% 2.33% 2.64%Ratios (to average netassets):Expenses3 ...................... 0.40% 0.20% —% 0.40% 0.20% —%Net investment loss.......... (0.40%) (0.20%) —% (0.40%) (0.20%) —%Portfolio turnover ............ 25% 25% 25% 17% 17% 17%Without the voluntary expense waivers and reimbursements, the expense ratio would have been increased by the following amount:
0.01% 0.01% 0.01% 0.02% 0.02% 0.02%1 Calculated based on average daily units outstanding during the year.2 Represents aggregate total return for the year. The return would have been lower absent the voluntary waivers and reimbursements of expenses.3 The ratio includes only those expenses charged directly to the Trust and does not include those charged directly to participating accounts or any expenses incurred indirectly throughinvestment in the underlying trusts.
The expense ratios of theunderlying trusts were: 0.49% 0.49% 0.49% 0.49% 0.49% 0.49%The expense ratios of the Trustswere: 0.40% 0.20% —% 0.40% 0.20% —%
The net expense ratios of the Trustsand the underlying trusts were: 0.89% 0.69% 0.49% 0.89% 0.69% 0.49%
The accompanying notes are an integral part of the financial statements.
10

Financial HighlightsRetirement Target 2040 Retirement Target 2035
ForThe Year
Ended2/28/19
ForThe Year
Ended2/28/19
ForThe Year
Ended2/28/19
ForThe Year
Ended2/28/19
ForThe Year
Ended2/28/19
ForThe Year
Ended2/28/19
Class S Class I Class U1 Class S Class I Class U1Per unit data (for a unitoutstanding throughoutthe year):Net asset value -
Beginning of year ........ $ 24.23 $ 17.32 $ 11.99 $ 15.63 $ 16.12 $ 11.58
Income from investmentoperations:
Net investment loss1 ........ (0.10) (0.04) — (0.06) (0.03) —Net realized and
unrealized gain (loss)on investments ............ 0.60 0.44 0.30 0.36 0.38 0.28
Total from investmentoperations .................. 0.50 0.40 0.30 0.30 0.35 0.28
Net asset value - End ofyear .......................... $ 24.73 $ 17.72 $ 12.29 $ 15.93 $ 16.47 $ 11.86
Net assets - End of year(000’s omitted)............ $ 30,295 $ 23,685 $107,239 $ 9,804 $ 11,035 $34,147
Total return2................... 2.06% 2.31% 2.50% 1.92% 2.17% 2.42%Ratios (to average netassets):Expenses3 ...................... 0.40% 0.20% —% 0.40% 0.20% —%Net investment loss.......... (0.40%) (0.20%) —% (0.40%) (0.20%) —%Portfolio turnover ............ 21% 21% 21% 18% 18% 18%Without the voluntary expense waivers and reimbursements, the expense ratio would have been increased by the following amount:
0.00%4 0.00%4 0.00%4 0.01% 0.01% 0.01%1 Calculated based on average daily units outstanding during the year.2 Represents aggregate total return for the year. The return would have been lower absent the voluntary waivers and reimbursements of expenses.3 The ratio includes only those expenses charged directly to the Trust and does not include those charged directly to participating accounts or any expenses incurred indirectly throughinvestment in the underlying trusts.
The expense ratios of theunderlying trusts were: 0.49% 0.49% 0.49% 0.49% 0.49% 0.49%The expense ratios of the Trustswere: 0.40% 0.20% —% 0.40% 0.20% —%
The net expense ratios of the Trustsand the underlying trusts were: 0.89% 0.69% 0.49% 0.89% 0.69% 0.49%
4 Less than 0.01%.
The accompanying notes are an integral part of the financial statements.
11

Financial HighlightsRetirement Target 2030 Retirement Target 2025
ForThe Year
Ended2/28/19
ForThe Year
Ended2/28/19
ForThe Year
Ended2/28/19
ForThe Year
Ended2/28/19
ForThe Year
Ended2/28/19
ForThe Year
Ended2/28/19
Class S Class I Class U1 Class S Class I Class U1Per unit data (for a unitoutstanding throughoutthe year):Net asset value -
Beginning of year ........ $ 23.35 $ 16.76 $ 11.39 $ 14.19 $ 14.58 $ 10.99
Income from investmentoperations:
Net investment loss1 ........ (0.09) (0.03) — (0.06) (0.03) —Net realized and
unrealized gain (loss)on investments ............ 0.52 0.37 0.25 0.33 0.33 0.25
Total from investmentoperations .................. 0.43 0.34 0.25 0.27 0.30 0.25
Net asset value - End ofyear .......................... $ 23.78 $ 17.10 $ 11.64 $ 14.46 $ 14.88 $ 11.24
Net assets - End of year(000’s omitted)............ $ 63,456 $ 37,334 $123,605 $ 7,679 $ 13,127 $53,191
Total return2................... 1.84% 2.03% 2.19% 1.90% 2.06% 2.27%Ratios (to average netassets):Expenses3 ...................... 0.40% 0.20% —% 0.40% 0.20% —%Net investment loss.......... (0.40%) (0.20%) —% (0.40%) (0.20%) —%Portfolio turnover ............ 20% 20% 20% 28% 28% 28%Without the voluntary expense waivers and reimbursements, the expense ratio would have been increased by the following amount:
0.00%4 0.00%4 0.00%4 0.01% 0.01% 0.01%1 Calculated based on average daily units outstanding during the year.2 Represents aggregate total return for the year. The return would have been lower absent the voluntary waivers and reimbursements of expenses.3 The ratio includes only those expenses charged directly to the Trust and does not include those charged directly to participating accounts or any expenses incurred indirectly throughinvestment in the underlying trusts.
The expense ratios of theunderlying trusts were: 0.49% 0.49% 0.49% 0.49% 0.49% 0.49%The expense ratios of the Trustswere: 0.40% 0.20% —% 0.40% 0.20% —%
The net expense ratios of the Trustsand the underlying trusts were: 0.89% 0.69% 0.49% 0.89% 0.69% 0.49%
4 Less than 0.01%.
The accompanying notes are an integral part of the financial statements.
12

Financial HighlightsRetirement Target 2020 Retirement Target 2015
ForThe Year
Ended2/28/19
ForThe Year
Ended2/28/19
ForThe Year
Ended2/28/19
ForThe Year
Ended2/28/19
ForThe Year
Ended2/28/19
ForThe Year
Ended2/28/19
Class S Class I Class U1 Class S Class I Class U1Per unit data (for a unitoutstanding throughoutthe year):Net asset value -
Beginning of year ........ $ 21.43 $ 16.14 $ 10.92 $ 13.16 $ 13.48 $ 10.79
Income from investmentoperations:
Net investment loss1 ........ (0.09) (0.03) — (0.05) (0.03) —Net realized and
unrealized gain (loss)on investments ............ 0.51 0.38 0.26 0.35 0.36 0.28
Total from investmentoperations .................. 0.42 0.35 0.26 0.30 0.33 0.28
Net asset value - End ofyear .......................... $ 21.85 $ 16.49 $ 11.18 $ 13.46 $ 13.81 $ 11.07
Net assets - End of year(000’s omitted)............ $ 53,036 $ 33,579 $ 81,611 $ 2,301 $ 2,114 $12,235
Total return2................... 1.96% 2.17% 2.38% 2.28% 2.45% 2.59%Ratios (to average netassets):Expenses3 ...................... 0.40% 0.20% —% 0.40% 0.20% —%Net investment loss.......... (0.40%) (0.20%) —% (0.40%) (0.20%) —%Portfolio turnover ............ 15% 15% 15% 38% 38% 38%Without the voluntary expense waivers and reimbursements, the expense ratio would have been increased by the following amount:
0.00%4 0.00%4 0.00%4 0.04% 0.04% 0.04%1 Calculated based on average daily units outstanding during the year.2 Represents aggregate total return for the year. The return would have been lower absent the voluntary waivers and reimbursements of expenses.3 The ratio includes only those expenses charged directly to the Trust and does not include those charged directly to participating accounts or any expenses incurred indirectly throughinvestment in the underlying trusts.
The expense ratios of theunderlying trusts were: 0.49% 0.49% 0.49% 0.49% 0.49% 0.49%The expense ratios of the Trustswere: 0.40% 0.20% —% 0.40% 0.20% —%
The net expense ratios of the Trustsand the underlying trusts were: 0.89% 0.69% 0.49% 0.89% 0.69% 0.49%
4 Less than 0.01%.
The accompanying notes are an integral part of the financial statements.
13

Financial HighlightsRetirement Target Income
ForThe Year
Ended2/28/19
ForThe Year
Ended2/28/19
ForThe Year
Ended2/28/19
Class S Class I Class U1Per unit data (for a unit outstanding throughoutthe year):Net asset value - Beginning of year .......................... $ 18.70 $ 16.39 $ 10.83
Income from investment operations:Net investment loss1 ............................................. (0.08) (0.03) —Net realized and unrealized gain (loss) on investments. 0.56 0.48 0.32
Total from investment operations............................. 0.48 0.45 0.32
Net asset value - End of year ................................ $ 19.18 $ 16.84 $ 11.15
Net assets - End of year(000’s omitted)................................................. $ 30,924 $ 15,101 $14,684
Total return2........................................................ 2.57% 2.75% 2.95%Ratios (to average net assets):Expenses3 ........................................................... 0.40% 0.20% —%Net investment loss............................................... (0.40%) (0.20%) —%Portfolio turnover ................................................. 10% 10% 10%Without the voluntary expense waivers and reimbursements, the expense ratio would have been increased by the following amount:
0.01% 0.01% 0.01%1 Calculated based on average daily units outstanding during the year.2 Represents aggregate total return for the year. The return would have been lower absent the voluntary waivers and reimbursements of expenses.3 The ratio includes only those expenses charged directly to the Trust and does not include those charged directly to participating accounts or any expenses incurred indirectly throughinvestment in the underlying trusts.
The expense ratios of the underlying trusts were: 0.49% 0.49% 0.49%The expense ratios of the Trusts were: 0.40% 0.20% —%
The net expense ratios of the Trusts and the underlying trusts were: 0.89% 0.69% 0.49%
The accompanying notes are an integral part of the financial statements.
14

A. ORGANIZATION AND SIGNIFICANT ACCOUNTING POLICIES
Exeter Trust Company (the “Trustee”) established the Manning & Napier Retirement Target 2050 Collective InvestmentTrust, Manning & Napier Retirement Target 2040 Collective Investment Trust, Manning & Napier Retirement Target 2030Collective Investment Trust, Manning & Napier Retirement Target 2020 Collective Investment Trust, and Manning & NapierRetirement Target Income Collective Investment Trust on January 26, 2004. The Manning & Napier Retirement Target 2055Collective Investment Trust, Manning & Napier Retirement Target 2045 Collective Investment Trust, Manning & NapierRetirement Target 2035 Collective Investment Trust, Manning & Napier Retirement Target 2025 Collective Investment Trustand Manning & Napier Retirement Target 2015 Collective Investment Trust (collectively, the “Trusts”) were established bythe Trustee in August 2012. The Manning & Napier Retirement Target 2060 Collective Investment Trust (collectively, the“Trusts”) was established by the Trustee on September 21, 2015. The Trusts are governed by the Amended and RestatedDeclaration of Trust of Exeter Trust Company Collective Investment Funds for Employee Benefit Trusts dated January 1,2012.
The following is a summary of significant accounting policies followed by the Trusts. The Trusts are each an investmentcompany and, accordingly, follow the investment company accounting and reporting guidance of the Financial AccountingStandards BoardAccounting Standards CodificationTopic 946 - Investment Companies, which is part of accounting principlesgenerally accepted in the United States of America (“GAAP”).
The investment objectives of the Trusts are to provide various Trust options, with each option designed as a single diversifiedinvestment and defined by an approximate date of either retirement or when assets are needed to meet ongoing living expenses.The Trusts, with the exception of the Manning & Napier Retirement Target Income Collective Investment Trust, seek toprovide capital growth and manage risk consistent with the target retirement date defined in the Trust’s name. The Manning& Napier RetirementTarget Income Collective InvestmentTrust seeks to provide protection of capital while generating incomefor investors in retirement or for those who want to assume only a minimal amount of capital risk.
The Trusts are authorized to issue three classes of units (Class S, Class I and Class U1). Each class of units are substantiallythe same, except the class specific Trustee fee borne by the specific class of units to which they relate. Effective September15, 2017, Class U shares of the Trusts have been merged into Class U1 shares with the same relative aggregate net asset valueas the original shares held immediately prior to the merger.
The Trusts are group trusts within the meaning of Internal Revenue Service Ruling 81-100, as amended. The Trusts areavailable only to certain qualified and governmental retirement plans and collective investment funds and are not offered tothe general public. The Trusts are required to comply with the applicable provisions of the Employee Retirement IncomeSecurityAct of 1974, as amended, and theTrustee is subject to the supervision and regulation by the Office of the Comptrollerof the Currency including Regulation 9 of the Rules and Regulations of the Comptroller of the Currency.
Fund-of-FundsThe Trusts invest primarily in other collective investment trusts (“underlying trusts”) with similar investment objectives,which have characteristics consistent with each Trust’s overall investment objective. The Trusts are designed to provide asingle investment portfolio that adjusts over time to meet the changing risk and return objectives of investors over their expectedinvestment horizon. As the target retirement date approaches, the Trust’s portfolio becomes more conservative with a largerfixed-income investment component. This is achieved by allocation of investment in the underlying trusts. The following isa summary of the underlying trusts’ investment portfolio composition at February 28, 2019:
Notes to Financial Statements
15

A. ORGANIZATION AND SIGNIFICANT ACCOUNTING POLICIES (continued)
Fund-of-Funds (continued)
Equitysecurities
Corporate debt,Commercial
mortgage-backedsecurities,Foreign
Governmentbonds and
Asset-backedsecurities
U.S. Treasuryand
Other U.S.Government
agencies
Mutual fundsand
Short-terminvestments
Manning & Napier Pro-Mix Maximum TermCollective Investment Trust 84.2% 4.0% 11.7% 0.1%
Manning & Napier Pro-Mix Extended TermCollective Investment Trust 48.3% 25.3% 26.3% 0.1%
Manning & Napier Pro-Mix Moderate TermCollective Investment Trust 36.6% 32.4% 30.9% 0.1%
Manning & Napier Pro-Mix Conservative TermCollective Investment Trust 27.7% 41.3% 30.9% 0.1%
The Trusts have the ability to redeem their investments in the underlying trusts at net asset value, each business day, withoutrestriction or notice of redemption. As of February 28, 2019, no Trust had unfunded commitments to the underlying trusts inwhich the Trusts invested. The financial statements of the underlying trusts should be read in conjunction with the Trusts’financial statements.
Valuation of InvestmentsInvestments in other collective investment trusts are valued at their net asset value per unit on valuation date. The net assetvalue, or price per unit, of each underlying trust is determined each business day. In the absence of the availability of a netasset value per unit on the underlying trust, security valuations may be determined in good faith by the Trustee.
Volume and level of activity in established markets for an asset or liability are evaluated to determine whether recent transactionsand quoted prices are determinative of fair value. Where there have been significant decreases in volume and level of activity,further analysis and adjustment may be necessary to estimate fair value. The Trusts measure fair value in these instances bythe use of inputs and valuation techniques which may be based upon current market prices of securities that are comparablein coupon, rating, maturity and industry and/or expectation of future cash flows.As a result of trading in relatively thin marketsand/or markets that experience significant volatility, the prices used by the Trusts to value these securities may differ from thevalue that would be realized if these securities were sold, and the differences could be material.
Securities for which representative valuations or prices are not available from the Trust’s pricing service may be valued at fairvalue. Due to the inherent uncertainty of valuations of such securities, the fair value may differ significantly from the valuesthat would have been used had a ready market for such securities existed. If trading or events occurring after the close of theprincipal market in which securities are traded are expected to materially affect the value of those securities, then they maybe valued at their fair value, taking this trading or these events into account. Fair value is determined in good faith by theTrustee by reference to such standards as the Trustee, in good faith, deems applicable in the circumstances.
Various inputs are used in determining the value of the Trusts’ assets or liabilities carried at fair value. These inputs aresummarized in three broad levels. Level 1 includes quoted prices in active markets for identical assets and liabilities. Level2 includes other significant observable inputs (including quoted prices for similar securities, interest rates, prepayment speeds,credit risk, etc.). Level 3 includes significant unobservable inputs (including the Trusts’ own assumptions in determining thefair value of investments). A financial instrument’s level within the fair value hierarchy is based on the lowest level of anyinput both individually and in aggregate that is significant to the fair value measurement. The inputs or methodology used forvaluing securities are not necessarily an indication of the risk associated with investing in those securities.
Notes to Financial Statements (continued)
16
A. ORGANIZATION AND SIGNIFICANT ACCOUNTING POLICIES (continued)
Valuation of Investments (continued)The Trusts’ investments in the underlying collective investment trusts, as disclosed individually in the Statements of Assetsand Liabilities, are classified within Level 2 of the fair value hierarchy, since the Trusts have the ability to redeem theirinvestments in the portfolio at net asset value without restrictions.
There were no Level 3 securities held by the Trusts as of February 28, 2018 or February 28, 2019.
New Accounting PronouncementsOn August 28, 2018, the FASB issued ASU 2018-13, “Disclosure Framework – Changes to the Disclosure Requirements forFairValue Measurement,” which amends the fair value measurement disclosure requirements under U.S. GAAP.The amendmentsof ASU 2018-13 include new, eliminated, and modified disclosure requirements. In addition, the amendments clarify thatmateriality is an appropriate consideration of entities when evaluating disclosure requirements. The ASU is effective for allentities for fiscal years beginning after December 15, 2019, including interim periods therein. An entity is permitted to earlyadopt any eliminated or modified disclosures upon issuance of this ASU and delay adoption of the new disclosures until theireffective date. As such, each Trust has early adopted the eliminated and modified disclosures, as permitted by this ASU.
Frequency of ValuationThe net asset value, or price per unit, is determined each business day (“valuation date”).
Security Transactions, Investment Income and ExpensesSecurity transactions are accounted for on trade date. For financial reporting purposes, theTrusts use the specific identificationaccounting method for determining realized gain or loss on the sale of investments. Distributions received from other collectiveinvestment trusts, if any, are recorded on the ex-dividend date and retain the character of income as earned by the underlyingtrust. Certain collective investment trusts, in which the Trusts invest, may retain investment income and net realized gains.Accordingly, realized and unrealized gains and losses reported by the Trusts may include a component attributable to theundistributed investment income of the underlying collective investment trusts.
Expenses are recorded on an accrual basis.
Income TaxesIt is the policy of the Trusts to comply with the requirements of the Internal Revenue Code which are applicable to pooledemployee benefit trusts.Accordingly, theTrusts are exempt from federal income taxes, and no income tax provision is requiredin the financial statements.
Management evaluates its tax positions to determine if the tax positions taken meet the minimum recognition threshold inconnection with accounting for uncertainties in income tax positions taken or expected to be taken for the purposes of measuringand recognizing tax liabilities in the financial statements. Recognition of tax benefits of an uncertain tax position is requiredonly when the position is “more likely than not” to be sustained assuming examination by taxing authorities. At February 28,2019, the Trusts have recorded no liability for net unrecognized tax benefits relating to uncertain income tax positions takenor expected to be taken in future tax returns. The Trusts do not file income tax returns in the U.S. federal jurisdiction or anystates.
Units of ParticipationThe beneficial interest of each participant in the net assets of the Trusts is represented by Class S, Class I and Class U1 units.There are no distributions of net investment gain or investment income to the Trusts’participants. Such amounts are added tothe net assets of theTrusts.The issue and redemption of units are recorded upon receipt of purchase and redemption authorizationsthat are in good order, and are based on the next determined net asset value per unit. In certain circumstances, units may bepurchased or redeemed through the delivery to the Trusts or receipt by the unit holders, respectively, of securities, the fairvalue of which is used to determine the number of units issued or redeemed.
In calculating the net asset value per unit of each class, investment income, realized and unrealized gains and losses andexpenses, other than class specific expenses, are allocated daily to each class of units based upon the proportion of net assets
Notes to Financial Statements (continued)
17

A. ORGANIZATION AND SIGNIFICANT ACCOUNTING POLICIES (continued)
Units of Participation (continued)of each class at the beginning of each day. Each class of units bears its pro-rata portion of expenses attributable to the Trust,except that each class separately bears expenses related specifically to that class.
OtherThe preparation of financial statements in conformity with GAAP requires management to make estimates and assumptionsthat affect the reported amounts of assets and liabilities and the disclosure of contingent assets and liabilities at the date of thefinancial statements and the reported amounts of income and expenses during the reporting period. Actual results coulddiffer from those estimates.
B. PURCHASES AND SALES OF SECURITIES
For the year ended February 28, 2019, purchases and sales of the underlying trusts were as follows:
Trust PurchasesProceeds
from SalesRealized
Gains
Retirement Target 2060 $ 6,011,564 $ 2,653,259 $ 319,296Retirement Target 2055 8,413,233 3,127,046 626,393Retirement Target 2050 18,065,792 20,316,148 4,156,940Retirement Target 2045 16,953,383 5,416,203 989,324Retirement Target 2040 35,889,631 52,395,671 9,287,405Retirement Target 2035 25,847,399 9,044,430 1,272,245Retirement Target 2030 47,487,058 75,268,326 9,849,377Retirement Target 2025 32,793,666 20,123,728 2,059,716Retirement Target 2020 27,764,881 66,840,908 8,166,637Retirement Target 2015 6,955,797 8,432,855 484,120Retirement Target Income 6,177,781 16,975,525 2,299,433
C. EXPENSES AND TRANSACTIONS WITH AFFILIATES
The Trustee has voluntarily agreed to bear all operating expenses of the Trust, other than the audit and Trustee fees.
For the services it provides to the Trusts, the Trustee receives a fee, computed daily and payable monthly, at an annual rate of0.89% of the average daily net assets of Class S shares, 0.69% of the average daily net assets of Class I shares and 0.49% ofthe average daily net assets of Class U1 shares of each Trust. Of the total Trustee fee, 0.84% for Class S shares, 0.64% forClass I shares and 0.44% for Class U1 shares is paid by the Trustee to Manning & Napier Advisors, LLC (the “Advisor”), anaffiliate of the Trustee, for advisory services performed on behalf of each Trust. This amount is presented in the Statementsof Operations as Trustee fees - advisory. The remaining 0.05% for Class U1, Class S and Class I shares is retained by theTrustee for the services it provides to the Trusts and, if not reduced to 0% as described below, is presented in the Statementsof Operations asTrustee fees.The advisory andTrustee fees are reduced to the extent of the advisory andTrustee fees incurredindirectly by the Trusts through their investment in the underlying trusts. This eliminates the double payment of advisory andTrustee fees. The expense limits described below are also adjusted down by the same percentage. This is done to maintain theexpenses of the Trusts, including the indirect expenses of the underlying trusts, at the existing expense limits. The Trustee hasvoluntarily agreed to limit expenses of the Trusts in order to maintain total expenses of the Trusts at no more than 0.89% ofthe average daily net assets of Class S shares, 0.69% of the average daily net assets of Class I shares and 0.49% of the averagedaily net assets of Class U1 shares each year. The Advisor may change or eliminate all or part of its voluntary waiver at anytime.
Notes to Financial Statements (continued)
18
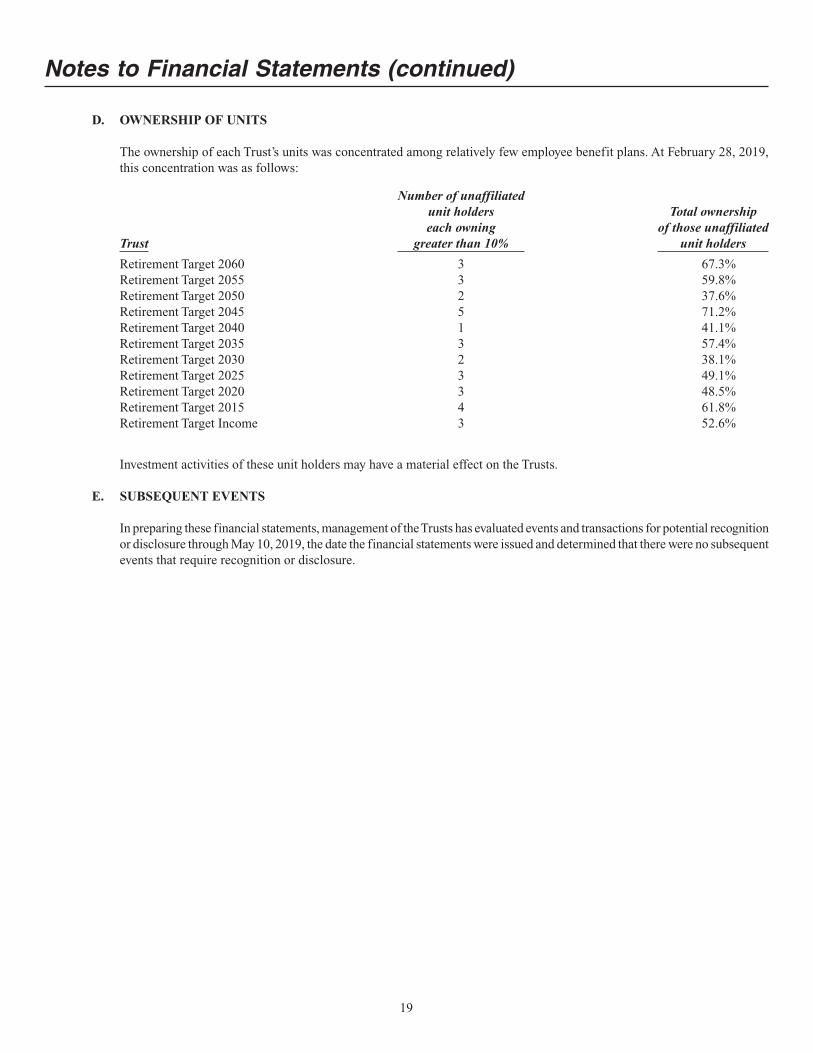
D. OWNERSHIP OF UNITS
The ownership of each Trust’s units was concentrated among relatively few employee benefit plans. At February 28, 2019,this concentration was as follows:
Trust
Number of unaffiliatedunit holderseach owning
greater than 10%
Total ownershipof those unaffiliated
unit holders
Retirement Target 2060 3 67.3%Retirement Target 2055 3 59.8%Retirement Target 2050 2 37.6%Retirement Target 2045 5 71.2%Retirement Target 2040 1 41.1%Retirement Target 2035 3 57.4%Retirement Target 2030 2 38.1%Retirement Target 2025 3 49.1%Retirement Target 2020 3 48.5%Retirement Target 2015 4 61.8%Retirement Target Income 3 52.6%
Investment activities of these unit holders may have a material effect on the Trusts.
E. SUBSEQUENT EVENTS
In preparing these financial statements, management of theTrusts has evaluated events and transactions for potential recognitionor disclosure through May 10, 2019, the date the financial statements were issued and determined that there were no subsequentevents that require recognition or disclosure.
Notes to Financial Statements (continued)
19

To the Board of Directors of ExeterTrust Company:We have audited the accompanying financial statements of Manning & Napier Retirement Target 2060 Collective InvestmentTrust, Manning & Napier RetirementTarget 2055 Collective InvestmentTrust, Manning & Napier RetirementTarget 2050 CollectiveInvestment Trust, Manning & Napier Retirement Target 2045 Collective Investment Trust, Manning & Napier Retirement Target2040 Collective Investment Trust, Manning & Napier Retirement Target 2035 Collective Investment Trust, Manning & NapierRetirementTarget 2030 Collective InvestmentTrust, Manning & Napier RetirementTarget 2025 Collective InvestmentTrust, Manning& Napier Retirement Target 2020 Collective Investment Trust, Manning & Napier Retirement Target 2015 Collective InvestmentTrust, and Manning & Napier RetirementTarget Income Collective InvestmentTrust (each a trust of ExeterTrust Company CollectiveInvestment Funds for Employee Benefit Trusts, hereafter collectively referred to as the “Trusts”), which comprise the statementsof assets and liabilities, including the investment portfolios, as of February 28, 2019 and the related statements of operations, ofchanges in net assets and the financial highlights for the year then ended. These financial statements and financial highlights arehereafter collectively referred to as “financial statements”.
Management’s Responsibility for the Financial StatementsManagement is responsible for the preparation and fair presentation of the financial statements in accordance with accountingprinciples generally accepted in the United States ofAmerica; this includes the design, implementation and maintenance of internalcontrol relevant to the preparation and fair presentation of financial statements that are free from material misstatement, whetherdue to fraud or error.
Auditors’ ResponsibilityOur responsibility is to express an opinion on the financial statements based on our audits. We conducted our audits in accordancewith auditing standards generally accepted in the United States of America. Those standards require that we plan and perform theaudit to obtain reasonable assurance about whether the financial statements are free from material misstatement.
An audit involves performing procedures to obtain audit evidence about the amounts and disclosures in the financial statements.Theprocedures selected depend on our judgment, including the assessment of the risks of material misstatement of the financial statements,whether due to fraud or error. In making those risk assessments, we consider internal control relevant to the Trusts’preparation andfair presentation of the financial statements in order to design audit procedures that are appropriate in the circumstances, but notfor the purpose of expressing an opinion on the effectiveness of the Trusts’ internal control. Accordingly, we express no suchopinion. An audit also includes evaluating the appropriateness of accounting policies used and the reasonableness of significantaccounting estimates made by management, as well as evaluating the overall presentation of the financial statements. We believethat the audit evidence we have obtained is sufficient and appropriate to provide a basis for our audit opinion.
OpinionIn our opinion, the financial statements referred to above present fairly, in all material respects, the financial position of Manning& Napier Retirement Target 2060 Collective Investment Trust, Manning & Napier Retirement Target 2055 Collective InvestmentTrust, Manning & Napier RetirementTarget 2050 Collective InvestmentTrust, Manning & Napier RetirementTarget 2045 CollectiveInvestment Trust, Manning & Napier Retirement Target 2040 Collective Investment Trust, Manning & Napier Retirement Target2035 Collective Investment Trust, Manning & Napier Retirement Target 2030 Collective Investment Trust, Manning & NapierRetirementTarget 2025 Collective InvestmentTrust, Manning & Napier RetirementTarget 2020 Collective InvestmentTrust, Manning& Napier RetirementTarget 2015 Collective InvestmentTrust, and Manning & Napier RetirementTarget Income Collective InvestmentTrust as of February 28, 2019, and the results of their operations, changes in their net assets and the financial highlights for the yearthen ended, in accordance with accounting principles generally accepted in the United States of America.
New York, New YorkMay 10, 2019
Report of Independent Auditors
20

