exergy analysis for fuel reduction strategies in crude
TRANSCRIPT

lable at ScienceDirect
Energy 66 (2014) 891e897
Contents lists avai
Energy
journal homepage: www.elsevier .com/locate/energy
يريمد
Exergy analysis for fuel reduction strategies in crude distillation unit
Z. Nur Izyan a,*, M. Shuhaimi b
aDepartment of Plant Maintenance, Faculty of Mechanical Engineering, Universiti Teknikal Malaysia Melaka, Hang Tuah Jaya,76100 Durian Tunggal, Melaka, MalaysiabDepartment of Chemical Engineering, Universiti Teknologi PETRONAS, Bandar Seri Iskandar, 31750 Tronoh, Perak, Malaysia ت ا
نش
a r t i c l e i n f o
Article history:Received 22 July 2013Received in revised form23 December 2013Accepted 8 January 2014Available online 6 February 2014
Keywords:Exergy analysisExergy lossCrude preheat trainFurnace
* Corresponding author. Tel.: þ60 62346882.E-mail address: [email protected] (Z. Nur Iz
0360-5442/$ e see front matter � 2014 Elsevier Ltd.http://dx.doi.org/10.1016/j.energy.2014.01.026
a b s t r a c t
Inefficient furnaces and heat exchangers contribute to the depletion of fossil fuel problem due to higherfuel demand and higher carbon emission. The method of exergy analysis is applied to the furnace andcrude preheat train (CPT) in a crude distillation unit (CDU) to determine performance benchmark of thesystem. This paper presents exergy analysis and strategies to reduce exergy loss through processmodification. The highest exergy loss was found to be located at the inlet furnace. The proposed optionsfor fuel reduction strategies are reduction of heat loss from furnace stack and overall cleaning schedule ofCPT. The feasibility and economic analysis for both options are investigated. From the results, overallcleaning schedule of CPT contributes to the highest energy saving of 5.6%. However, reduction of heat lossfrom furnace stack is the highest cost saving by about 6.4%.
� 2014 Elsevier Ltd. All rights reserved.الايي_پرژ
گ
اه 1. IntroductionThe exergy of the system is defined as the ability to do work orthe work potential of a great variety of streams such as mass, heatand work that flow through a system at a specified referencetemperature [1]. Exergy analysis is an effective method based onthe second law of thermodynamic which can be used to system-atically locate and quantify the inefficiency of a process system.Once the locations of the system’s inefficiencies are identified,improvement can be made to reduce exergy loss of the system.Many researches and engineers conduct exergy analysis as amethod for analyzing, designing and improving systems and pro-cesses. Some of the previous works done on the application ofexergy analysis in industrial processes has been reported on crudedistillation unit, power plant, cogeneration plant, cooling systemand fuel cell system [2e6]. Doldersum [7] applied exergy analysison distillation process. The author found that the exergy lossoccurred in the furnace and distillation column. Several processmodifications to reduce exergy loss were proposed. After the pro-cess modification, the total exergy loss was able to reduce by 70%that directly related in a reduction of fuel for almost 40%. Riveroet al. [8] studied exergy analysis on crude oil combined distillationunit. The economic improvement potential was analyzed for theprocess streams. The authors found that the highest cost of exergyزند شاره(ني)خمي
مام ا
yan).
All rights reserved.
loss is the atmospheric fired heater which about 45% of the totalcost of exergy loss.
While there are many published approaches on determinationof location and magnitude of exergy loss in distillation column [7e11], the strategies to achieve operational improvement is usuallyuncertain. This paper presents fuel reduction strategies in CDU byapplying the concept of exergy analysis to determine location andquantity of exergy loss as well as to generate possible fuel reductionstrategies through process modification.
2. Methodology
2.1. Establishment of base case data
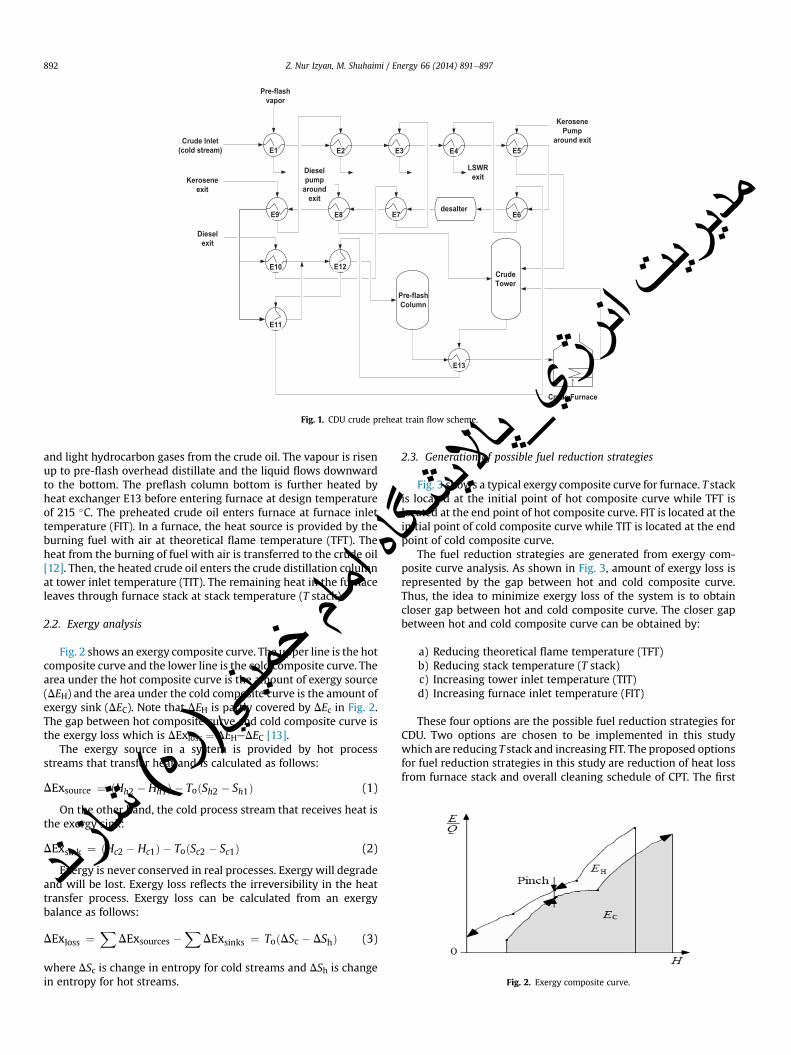
The crude distillation unit (CDU) is the first step in a refinerycomplex to separate crude oil into different fractions. In a typicalCDU, crude oil feed stream is preheated in a crude preheat train(CPT). CPT utilizes high temperatures of the distillation columnproduct streams. The relevant process data are extracted from atypical refinery in Malaysia. The selected data has been agreed andvalidated by a local oil refinery’s engineers after careful consider-ation. Fig. 1 shows a simplified process flow scheme of CDU crudepreheat train. The crude oil is heated up to 112 �C before enteringthe desalter. The hot streams are the hot product streams comingout from crude tower. After desalter, the crude oil stream is furtherheated up using heat recovered from the process streams. At thisend, the crude oil starts to vaporize at 203 �C. Then, the crude oilenters a pre-flash column to remove light naphtha, mixed naphtha
E1 E2 E3 E4 E5
E6desalter
E7E8E9
E10 E12
E11
Pre-flashColumn
E13
Crude Furnace
CrudeTower
Pre-flashvapor
Dieselpump
aroundexit
KerosenePump
around exitCrude Inlet(cold stream)
Keroseneexit
Dieselexit
LSWRexit
Fig. 1. CDU crude preheat train flow scheme.
Fig. 2. Exergy composite curve.
Z. Nur Izyan, M. Shuhaimi / Energy 66 (2014) 891e897892
ه
ي_رژت انيريمد
and light hydrocarbon gases from the crude oil. The vapour is risenup to pre-flash overhead distillate and the liquid flows downwardto the bottom. The preflash column bottom is further heated byheat exchanger E13 before entering furnace at design temperatureof 215 �C. The preheated crude oil enters furnace at furnace inlettemperature (FIT). In a furnace, the heat source is provided by theburning fuel with air at theoretical flame temperature (TFT). Theheat from the burning of fuel with air is transferred to the crude oil[12]. Then, the heated crude oil enters the crude distillation columnat tower inlet temperature (TIT). The remaining heat in the furnaceleaves through furnace stack at stack temperature (T stack).
2.2. Exergy analysis
Fig. 2 shows an exergy composite curve. The upper line is the hotcomposite curve and the lower line is the cold composite curve. Thearea under the hot composite curve is the amount of exergy source(DEH) and the area under the cold composite curve is the amount ofexergy sink (DEC). Note that DEH is partly covered by DEc in Fig. 2.The gap between hot composite curve and cold composite curve isthe exergy loss which is DExloss ¼ DEHeDEC [13].
The exergy source in a system is provided by hot processstreams that transfer heat and is calculated as follows:
DExsource ¼ ðHh2 � Hh1Þ � ToðSh2 � Sh1Þ (1)
On the other hand, the cold process stream that receives heat isthe exergy sink:
DExsink ¼ ðHc2 � Hc1Þ � ToðSc2 � Sc1Þ (2)
Exergy is never conserved in real processes. Exergy will degradeand will be lost. Exergy loss reflects the irreversibility in the heattransfer process. Exergy loss can be calculated from an exergybalance as follows:
DExloss ¼X
DExsources �X
DExsinks ¼ ToðDSc � DShÞ (3)
where DSc is change in entropy for cold streams and DSh is changein entropy for hot streams.
زند شاره(ني)خمي
مام ا
2.3. Generation of possible fuel reduction strategies
Fig. 3 shows a typical exergy composite curve for furnace. T stackis located at the initial point of hot composite curve while TFT islocated at the end point of hot composite curve. FIT is located at theinitial point of cold composite curve while TIT is located at the endpoint of cold composite curve.
The fuel reduction strategies are generated from exergy com-posite curve analysis. As shown in Fig. 3, amount of exergy loss isrepresented by the gap between hot and cold composite curve.Thus, the idea to minimize exergy loss of the system is to obtaincloser gap between hot and cold composite curve. The closer gapbetween hot and cold composite curve can be obtained by:
a) Reducing theoretical flame temperature (TFT)b) Reducing stack temperature (T stack)c) Increasing tower inlet temperature (TIT)d) Increasing furnace inlet temperature (FIT)
These four options are the possible fuel reduction strategies forCDU. Two options are chosen to be implemented in this studywhich are reducing T stack and increasing FIT. The proposed optionsfor fuel reduction strategies in this study are reduction of heat lossfrom furnace stack and overall cleaning schedule of CPT. The first
شگاالايپ
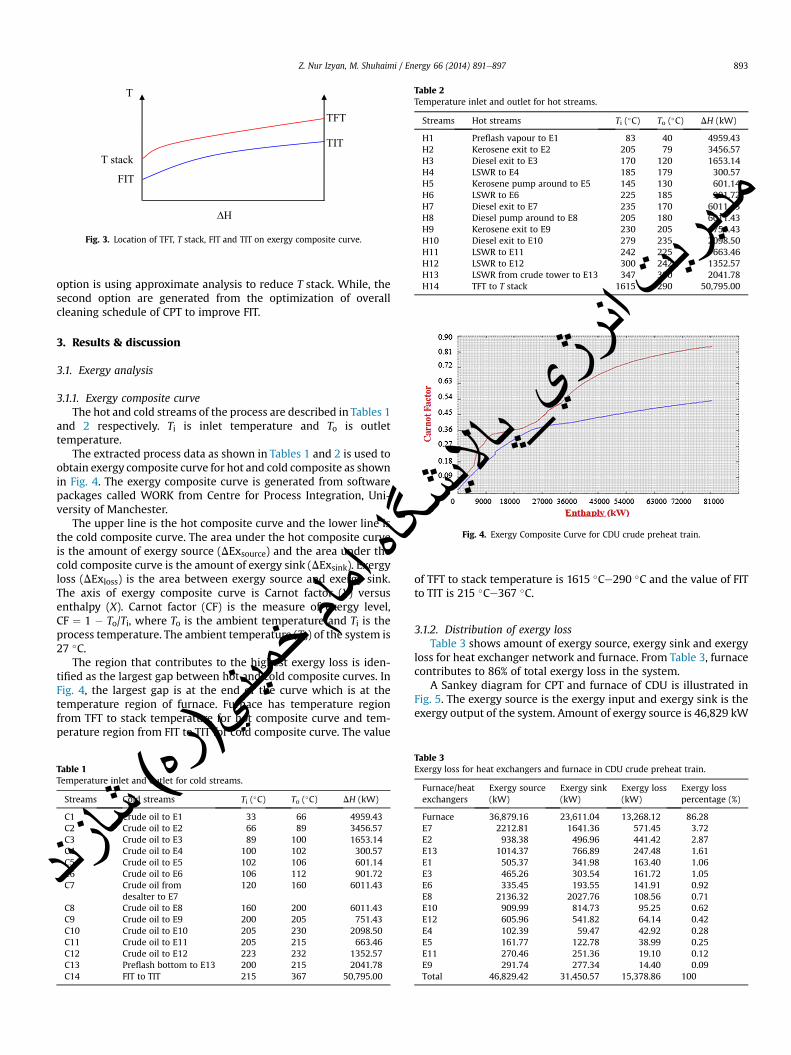
Table 2Temperature inlet and outlet for hot streams.
Streams Hot streams Ti (�C) To (�C) DH (kW)
H1 Preflash vapour to E1 83 40 4959.43H2 Kerosene exit to E2 205 79 3456.57H3 Diesel exit to E3 170 120 1653.14H4 LSWR to E4 185 179 300.57H5 Kerosene pump around to E5 145 130 601.14H6 LSWR to E6 225 185 901.72H7 Diesel exit to E7 235 170 6011.43H8 Diesel pump around to E8 205 180 6011.43H9 Kerosene exit to E9 230 205 751.43H10 Diesel exit to E10 279 235 2098.50H11 LSWR to E11 242 225 663.46H12 LSWR to E12 300 242 1352.57H13 LSWR from crude tower to E13 347 300 2041.78H14 TFT to T stack 1615 290 50,795.00
Fig. 4. Exergy Composite Curve for CDU crude preheat train.
∆H
TFT
T
TIT
FIT
T stack
Fig. 3. Location of TFT, T stack, FIT and TIT on exergy composite curve.
Z. Nur Izyan, M. Shuhaimi / Energy 66 (2014) 891e897 893
شگاالايي_پرژت انيريمد
option is using approximate analysis to reduce T stack. While, thesecond option are generated from the optimization of overallcleaning schedule of CPT to improve FIT.
3. Results & discussion
3.1. Exergy analysis
3.1.1. Exergy composite curveThe hot and cold streams of the process are described in Tables 1
and 2 respectively. Ti is inlet temperature and To is outlettemperature.
The extracted process data as shown in Tables 1 and 2 is used toobtain exergy composite curve for hot and cold composite as shownin Fig. 4. The exergy composite curve is generated from softwarepackages called WORK from Centre for Process Integration, Uni-versity of Manchester.
The upper line is the hot composite curve and the lower line isthe cold composite curve. The area under the hot composite curveis the amount of exergy source (DExsource) and the area under thecold composite curve is the amount of exergy sink (DExsink). Exergyloss (DExloss) is the area between exergy source and exergy sink.The axis of exergy composite curve is Carnot factor (Y) versusenthalpy (X). Carnot factor (CF) is the measure of exergy level,CF ¼ 1 � To/Ti, where To is the ambient temperature and Ti is theprocess temperature. The ambient temperature (To) of the system is27 �C.
The region that contributes to the highest exergy loss is iden-tified as the largest gap between hot and cold composite curves. InFig. 4, the largest gap is at the end of the curve which is at thetemperature region of furnace. Furnace has temperature regionfrom TFT to stack temperature for hot composite curve and tem-perature region from FIT to TIT for cold composite curve. The valueيني
خممامه ا
Table 1Temperature inlet and outlet for cold streams.
Streams Cold streams Ti (�C) To (�C) DH (kW)
C1 Crude oil to E1 33 66 4959.43C2 Crude oil to E2 66 89 3456.57C3 Crude oil to E3 89 100 1653.14C4 Crude oil to E4 100 102 300.57C5 Crude oil to E5 102 106 601.14C6 Crude oil to E6 106 112 901.72C7 Crude oil from
desalter to E7120 160 6011.43
C8 Crude oil to E8 160 200 6011.43C9 Crude oil to E9 200 205 751.43C10 Crude oil to E10 205 230 2098.50C11 Crude oil to E11 205 215 663.46C12 Crude oil to E12 223 232 1352.57C13 Preflash bottom to E13 200 215 2041.78C14 FIT to TIT 215 367 50,795.00
زند شاره((
of TFT to stack temperature is 1615 �Ce290 �C and the value of FITto TIT is 215 �Ce367 �C.
3.1.2. Distribution of exergy lossTable 3 shows amount of exergy source, exergy sink and exergy
loss for heat exchanger network and furnace. From Table 3, furnacecontributes to 86% of total exergy loss in the system.
A Sankey diagram for CPT and furnace of CDU is illustrated inFig. 5. The exergy source is the exergy input and exergy sink is theexergy output of the system. Amount of exergy source is 46,829 kW
Table 3Exergy loss for heat exchangers and furnace in CDU crude preheat train.
Furnace/heatexchangers
Exergy source(kW)
Exergy sink(kW)
Exergy loss(kW)
Exergy losspercentage (%)
Furnace 36,879.16 23,611.04 13,268.12 86.28E7 2212.81 1641.36 571.45 3.72E2 938.38 496.96 441.42 2.87E13 1014.37 766.89 247.48 1.61E1 505.37 341.98 163.40 1.06E3 465.26 303.54 161.72 1.05E6 335.45 193.55 141.91 0.92E8 2136.32 2027.76 108.56 0.71E10 909.99 814.73 95.25 0.62E12 605.96 541.82 64.14 0.42E4 102.39 59.47 42.92 0.28E5 161.77 122.78 38.99 0.25E11 270.46 251.36 19.10 0.12E9 291.74 277.34 14.40 0.09Total 46,829.42 31,450.57 15,378.86 100
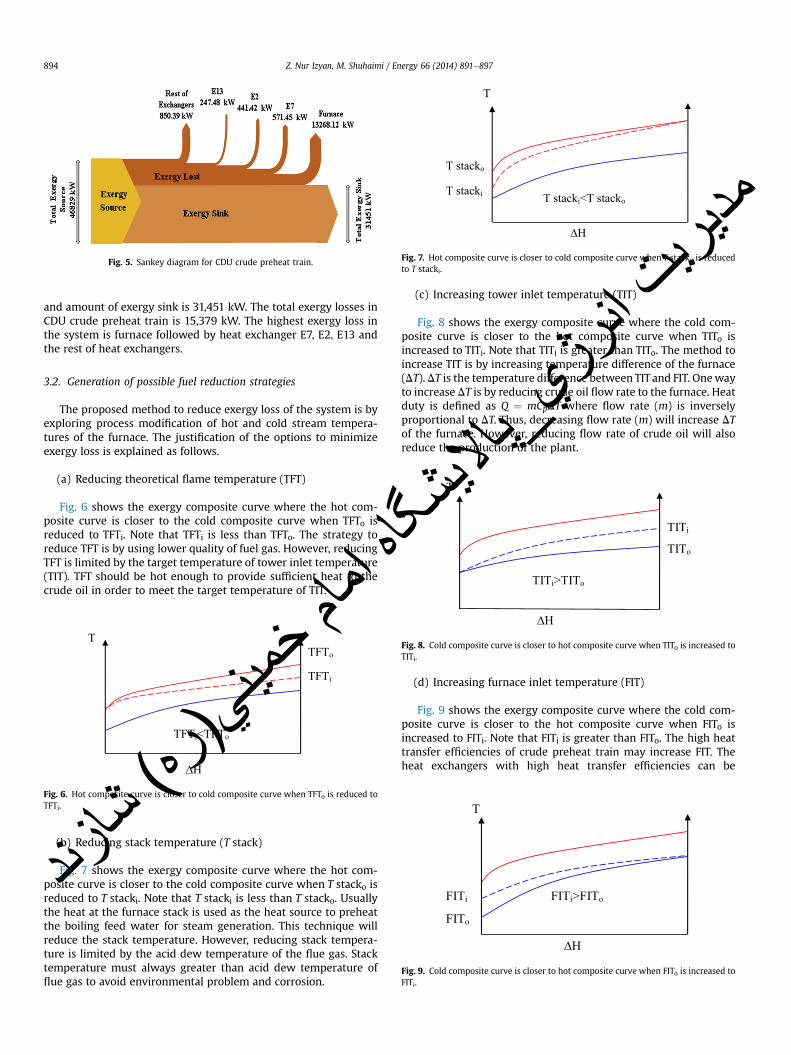
Fig. 5. Sankey diagram for CDU crude preheat train.
∆H
T
T stacko
T stacki T stacki<T stacko
Fig. 7. Hot composite curve is closer to cold composite curve when T stacko is reducedto T stacki.
Z. Nur Izyan, M. Shuhaimi / Energy 66 (2014) 891e897894
يريمد
and amount of exergy sink is 31,451 kW. The total exergy losses inCDU crude preheat train is 15,379 kW. The highest exergy loss inthe system is furnace followed by heat exchanger E7, E2, E13 andthe rest of heat exchangers.
T
TITo
TITi
TITi>TITo
گاهلايش
3.2. Generation of possible fuel reduction strategies
The proposed method to reduce exergy loss of the system is byexploring process modification of hot and cold stream tempera-tures of the furnace. The justification of the options to minimizeexergy loss is explained as follows.
(a) Reducing theoretical flame temperature (TFT)
Fig. 6 shows the exergy composite curve where the hot com-posite curve is closer to the cold composite curve when TFTo isreduced to TFTi. Note that TFTi is less than TFTo. The strategy toreduce TFT is by using lower quality of fuel gas. However, reducingTFT is limited by the target temperature of tower inlet temperature(TIT). TFT should be hot enough to provide sufficient heat to thecrude oil in order to meet the target temperature of TIT.
ا
TFTiTFTi<TFTo
∆H
TFTo
T
Fig. 6. Hot composite curve is closer to cold composite curve when TFTo is reduced toTFTi.
∆H
Fig. 8. Cold composite curve is closer to hot composite curve when TITo is increased toTITi.
FITo
FITi
∆H
FITi>FITo
T
Fig. 9. Cold composite curve is closer to hot composite curve when FITo is increased toFITi.
ره( ني)خمي
مام
(b) Reducing stack temperature (T stack)
Fig. 7 shows the exergy composite curve where the hot com-posite curve is closer to the cold composite curve when T stacko isreduced to T stacki. Note that T stacki is less than T stacko. Usuallythe heat at the furnace stack is used as the heat source to preheatthe boiling feed water for steam generation. This technique willreduce the stack temperature. However, reducing stack tempera-ture is limited by the acid dew temperature of the flue gas. Stacktemperature must always greater than acid dew temperature offlue gas to avoid environmental problem and corrosion.
زندشا
(c) Increasing tower inlet temperature (TIT)
Fig. 8 shows the exergy composite curve where the cold com-posite curve is closer to the hot composite curve when TITo isincreased to TITi. Note that TITi is greater than TITo. The method toincrease TIT is by increasing temperature difference of the furnace(DT). DT is the temperature difference between TIT and FIT. Onewayto increase DT is by reducing crude oil flow rate to the furnace. Heatduty is defined as Q ¼ mCpDT where flow rate (m) is inverselyproportional to DT. Thus, decreasing flow rate (m) will increase DTof the furnace. However, reducing flow rate of crude oil will alsoreduce the production of the plant.پا_
ژي انرت
(d) Increasing furnace inlet temperature (FIT)
Fig. 9 shows the exergy composite curve where the cold com-posite curve is closer to the hot composite curve when FITo isincreased to FITi. Note that FITi is greater than FITo. The high heattransfer efficiencies of crude preheat train may increase FIT. Theheat exchangers with high heat transfer efficiencies can be
3450
3500
3550
3600
3650
3700
3750
3800
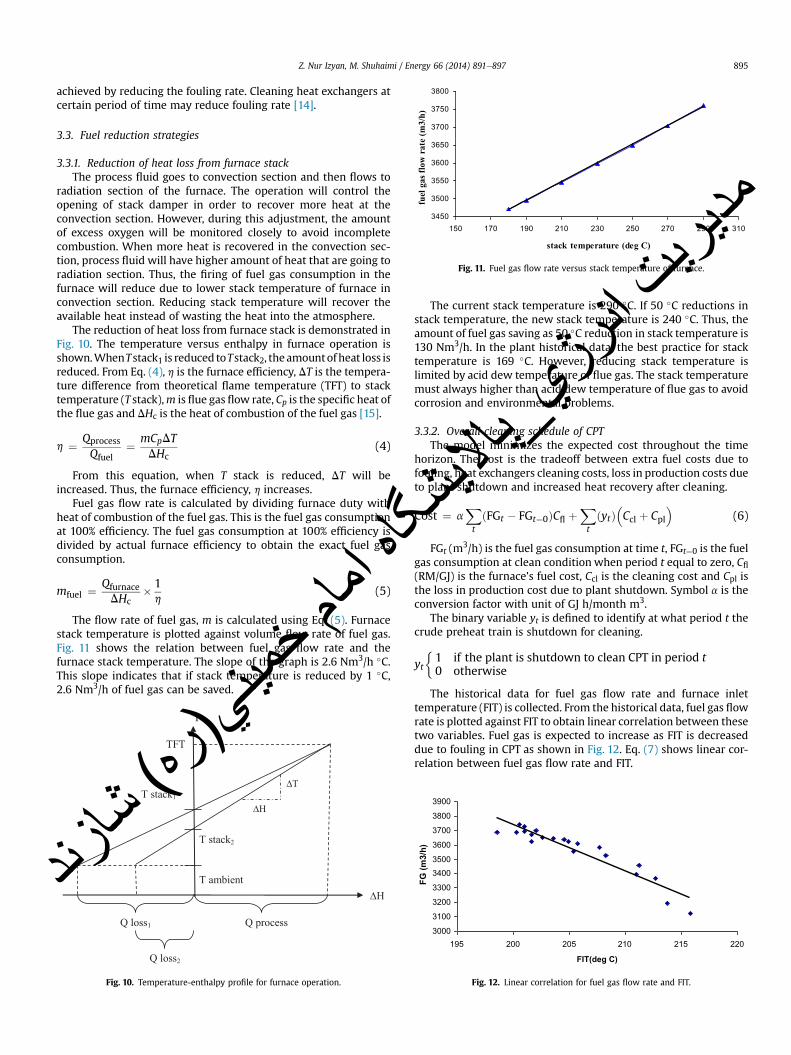
150 170 190 210 230 250 270 290 310
stack temperature (deg C)
fuel
gas
flow
rat
e (m
3/h)
Fig. 11. Fuel gas flow rate versus stack temperature of furnace.
Z. Nur Izyan, M. Shuhaimi / Energy 66 (2014) 891e897 895
ا
يريمد
achieved by reducing the fouling rate. Cleaning heat exchangers atcertain period of time may reduce fouling rate [14].
3.3. Fuel reduction strategies
3.3.1. Reduction of heat loss from furnace stackThe process fluid goes to convection section and then flows to
radiation section of the furnace. The operation will control theopening of stack damper in order to recover more heat at theconvection section. However, during this adjustment, the amountof excess oxygen will be monitored closely to avoid incompletecombustion. When more heat is recovered in the convection sec-tion, process fluid will have higher amount of heat that are going toradiation section. Thus, the firing of fuel gas consumption in thefurnace will reduce due to lower stack temperature of furnace inconvection section. Reducing stack temperature will recover theavailable heat instead of wasting the heat into the atmosphere.
The reduction of heat loss from furnace stack is demonstrated inFig. 10. The temperature versus enthalpy in furnace operation isshown.WhenTstack1 is reduced toTstack2, theamountofheat loss isreduced. From Eq. (4), h is the furnace efficiency, DT is the tempera-ture difference from theoretical flame temperature (TFT) to stacktemperature (T stack),m is flue gas flow rate, Cp is the specific heat ofthe flue gas and DHc is the heat of combustion of the fuel gas [15].
h ¼ Qprocess
Qfuel¼ mCpDT
DHc(4)
From this equation, when T stack is reduced, DT will beincreased. Thus, the furnace efficiency, h increases.
Fuel gas flow rate is calculated by dividing furnace duty withheat of combustion of the fuel gas. This is the fuel gas consumptionat 100% efficiency. The fuel gas consumption at 100% efficiency isdivided by actual furnace efficiency to obtain the exact fuel gasconsumption.
mfuel ¼QfurnaceDHc
� 1h
(5)
The flow rate of fuel gas, m is calculated using Eq. (5). Furnacestack temperature is plotted against volume flow rate of fuel gas.Fig. 11 shows the relation between fuel gas flow rate and thefurnace stack temperature. The slope of the graph is 2.6 Nm3/h �C.This slope indicates that if stack temperature is reduced by 1 �C,2.6 Nm3/h of fuel gas can be saved. خمي
مام ه ا
T
∆H
T stack1
T stack2
T ambient
Q processQ loss1
Q loss2
TFT
∆T
∆H
Fig. 10. Temperature-enthalpy profile for furnace operation.
زند شاره(ني)
The current stack temperature is 290 �C. If 50 �C reductions instack temperature, the new stack temperature is 240 �C. Thus, theamount of fuel gas saving as 50 �C reduction in stack temperature is130 Nm3/h. In the plant historical data, the best practice for stacktemperature is 169 �C. However, reducing stack temperature islimited by acid dew temperature of flue gas. The stack temperaturemust always higher than acid dew temperature of flue gas to avoidcorrosion and environmental problems.
3.3.2. Overall cleaning schedule of CPTThe model minimizes the expected cost throughout the time
horizon. The cost is the tradeoff between extra fuel costs due tofouling, heat exchangers cleaning costs, loss in production costs dueto plant shutdown and increased heat recovery after cleaning.
Cost ¼ aXtðFGt � FGt¼0ÞCfl þ
XtðytÞ
�Ccl þ Cpl
�(6)
FGt (m3/h) is the fuel gas consumption at time t, FGt¼0 is the fuelgas consumption at clean condition when period t equal to zero, Cfl(RM/GJ) is the furnace’s fuel cost, Ccl is the cleaning cost and Cpl isthe loss in production cost due to plant shutdown. Symbol a is theconversion factor with unit of GJ h/month m3.
The binary variable yt is defined to identify at what period t thecrude preheat train is shutdown for cleaning.
yt
�1 if the plant is shutdown to clean CPT in period t0 otherwise
The historical data for fuel gas flow rate and furnace inlettemperature (FIT) is collected. From the historical data, fuel gas flowrate is plotted against FIT to obtain linear correlation between thesetwo variables. Fuel gas is expected to increase as FIT is decreaseddue to fouling in CPT as shown in Fig. 12. Eq. (7) shows linear cor-relation between fuel gas flow rate and FIT.
شگالايي_پرژت ان
3000
3100
3200
3300
3400
3500
3600
3700
3800
3900
195 200 205 210 215 220
FIT(deg C)
FG (m
3/h)
Fig. 12. Linear correlation for fuel gas flow rate and FIT.
y = -0.5603x + 213.06R2 = 0.9452
196198200202204206208210212214216
0 5 10 15 20 25 30
month
FIT
(deg
C)
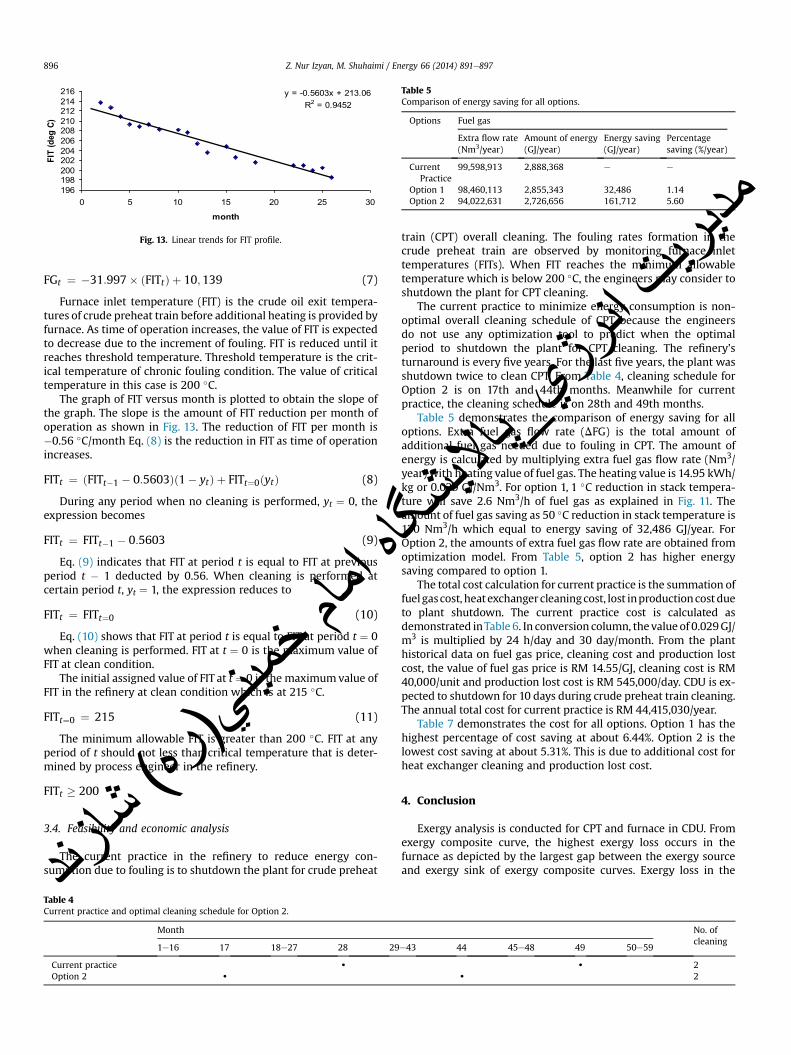
Fig. 13. Linear trends for FIT profile.
Table 5Comparison of energy saving for all options.
Options Fuel gas
Extra flow rate(Nm3/year)
Amount of energy(GJ/year)
Energy saving(GJ/year)
Percentagesaving (%/year)
CurrentPractice
99,598,913 2,888,368 e e
Option 1 98,460,113 2,855,343 32,486 1.14Option 2 94,022,631 2,726,656 161,712 5.60
Z. Nur Izyan, M. Shuhaimi / Energy 66 (2014) 891e897896
ه
م
FGt ¼ �31:997� ðFITtÞ þ 10;139 (7)Furnace inlet temperature (FIT) is the crude oil exit tempera-tures of crude preheat train before additional heating is provided byfurnace. As time of operation increases, the value of FIT is expectedto decrease due to the increment of fouling. FIT is reduced until itreaches threshold temperature. Threshold temperature is the crit-ical temperature of chronic fouling condition. The value of criticaltemperature in this case is 200 �C.
The graph of FIT versus month is plotted to obtain the slope ofthe graph. The slope is the amount of FIT reduction per month ofoperation as shown in Fig. 13. The reduction of FIT per month is�0.56 �C/month Eq. (8) is the reduction in FIT as time of operationincreases.
FITt ¼ ðFITt�1 � 0:5603Þð1� ytÞ þ FITt¼0ðytÞ (8)
During any period when no cleaning is performed, yt ¼ 0, theexpression becomes
FITt ¼ FITt�1 � 0:5603 (9)
Eq. (9) indicates that FIT at period t is equal to FIT at previousperiod t � 1 deducted by 0.56. When cleaning is performed atcertain period t, yt ¼ 1, the expression reduces to
FITt ¼ FITt¼0 (10)
Eq. (10) shows that FIT at period t is equal to FIT at period t ¼ 0when cleaning is performed. FIT at t ¼ 0 is the maximum value ofFIT at clean condition.
The initial assigned value of FIT at t ¼ 0 is the maximumvalue ofFIT in the refinery at clean condition which is at 215 �C.
FITt¼0 ¼ 215 (11)
The minimum allowable FIT is greater than 200 �C. FIT at anyperiod of t should not less than critical temperature that is deter-mined by process engineer in the refinery.
FITt � 200 ره(ني)خمي
مام ا
3.4. Feasibility and economic analysisThe current practice in the refinery to reduce energy con-sumption due to fouling is to shutdown the plant for crude preheatازن
ش
Table 4Current practice and optimal cleaning schedule for Option 2.Month
1e16 17 18e27 28 29
Current practice $Option 2 $
د
train (CPT) overall cleaning. The fouling rates formation in thecrude preheat train are observed by monitoring furnace inlettemperatures (FITs). When FIT reaches the minimum allowabletemperature which is below 200 �C, the engineers may consider toshutdown the plant for CPT cleaning.
The current practice to minimize energy consumption is non-optimal overall cleaning schedule of CPT because the engineersdo not use any optimization tool to predict when the optimalperiod to shutdown the plant for CPT cleaning. The refinery’sturnaround is every five years. For the last five years, the plant wasshutdown twice to clean CPT. From Table 4, cleaning schedule forOption 2 is on 17th and 44th months. Meanwhile for currentpractice, the cleaning schedule is on 28th and 49th months.
Table 5 demonstrates the comparison of energy saving for alloptions. Extra fuel gas flow rate (DFG) is the total amount ofadditional fuel gas needed due to fouling in CPT. The amount ofenergy is calculated by multiplying extra fuel gas flow rate (Nm3/year) with heating value of fuel gas. The heating value is 14.95 kWh/kg or 0.029 GJ/Nm3. For option 1, 1 �C reduction in stack tempera-ture will save 2.6 Nm3/h of fuel gas as explained in Fig. 11. Theamount of fuel gas saving as 50 �C reduction in stack temperature is130 Nm3/h which equal to energy saving of 32,486 GJ/year. ForOption 2, the amounts of extra fuel gas flow rate are obtained fromoptimization model. From Table 5, option 2 has higher energysaving compared to option 1.
The total cost calculation for current practice is the summation offuel gascost, heatexchangercleaningcost, lost inproductioncostdueto plant shutdown. The current practice cost is calculated asdemonstrated inTable 6. In conversion column, the value of 0.029GJ/m3 is multiplied by 24 h/day and 30 day/month. From the planthistorical data on fuel gas price, cleaning cost and production lostcost, the value of fuel gas price is RM 14.55/GJ, cleaning cost is RM40,000/unit and production lost cost is RM 545,000/day. CDU is ex-pected to shutdown for 10 days during crude preheat train cleaning.The annual total cost for current practice is RM 44,415,030/year.
Table 7 demonstrates the cost for all options. Option 1 has thehighest percentage of cost saving at about 6.44%. Option 2 is thelowest cost saving at about 5.31%. This is due to additional cost forheat exchanger cleaning and production lost cost.
شگاالايي_پرژت انيريد
4. Conclusion
Exergy analysis is conducted for CPT and furnace in CDU. Fromexergy composite curve, the highest exergy loss occurs in thefurnace as depicted by the largest gap between the exergy sourceand exergy sink of exergy composite curves. Exergy loss in the
No. ofcleaning
e43 44 45e48 49 50e59
$ 2
$ 2
Table 6Current practice cost calculation.
Details Amount Cost Multiply Conversion RM
Total extra fuel gas flow rate 11,528 Nm3/h RM 14.55/GJ 60 months 20.88 GJ.h/month.m3 210,135,151Heat exchanger cleaning 13 units RM 40,000/unit 2 times e 1,040,000Production lost 10 days RM 545,000/day 2 times e 10,900,000Total (RM) 222,075,151Annual cost (RM/year) 44,415,030
Table 7Cost for all options.
Options Total cost (RM) Annual cost (RM/year) Cost saving per year (RM/year) Percentage of cost saving (%/year)
Current Practice 222,075,151 44,415,030 e e
Option 1 207,765,480 41,553,096 2,861,934 6.44Option 2 210,290,613 42,058,123 2,356,908 5.31
Z. Nur Izyan, M. Shuhaimi / Energy 66 (2014) 891e897 897
ا
ت ايريمد
furnace contributes to 86% of total exergy loss in the system. Fromexergy composite curve analysis, possible fuel reduction strategiesare generated. From the possible fuel reduction strategies, twoproposed options are implemented. The proposed options arereduction of heat loss from furnace stack and overall cleaningschedule of CPT. Comparison of energy and cost saving aremade forall the options. From the results, option 2 is the highest energysaving compared to option 1. However, option 1 is the highest costsaving. This is due to additional cost for heat exchanger cleaningand lost production in option 2.
Acknowledgment
The authors would like to express greatest gratitude and thanksto chemical engineering department, Universiti Teknologi PETRO-NAS for their helpful assistance throughout this research. The au-thors acknowledge Faculty of Mechanical Engineering, UniversitiTeknikal Malaysia Melaka for providing research grant and support.
References
[1] Dincer I, Rosen MA. Exergy: energy, environment and sustainable develop-ment. 1st ed. Oxford: Elsevier; 2007.
[2] Al-Muslim H, Dincer I, Zubair SM. Exergy analysis of single- and two-stagecrude oil distillation units. J Energy Resour Technol Trans ASME 2003;125:199e207.
[3] Dincer I, Al-Muslim H. Thermodynamic analysis of reheat cycle steam powerplants. Fuel Energy Abstr 2002;43:264.
[4] Kamate SC, Gangavati PB. Exergy analysis of cogeneration power plants insugar industries. Appl Therm Eng 2009;29:1187e94.
[5] Kanoglu M, Özdinç Çarpınlıoglu M, Yıldırım M. Energy and exergy analyses ofan experimental open-cycle desiccant cooling system. Appl Therm Eng2004;24:919e32.
[6] Hussain MM, Baschuk JJ, Li X, Dincer I. Thermodynamic modeling of a PEMfuel cell power system. Int J Therm Sci 2005;44:903e11.
[7] Doledersum A. Exergy analysis proves viability of process modifications. En-ergy Convers Manag 1998;39:1781e9.)ره
ني)خمي
مام ه ا
زند شا
[8] Rivero R, Rendón C, Gallegos S. Exergy and exeroeconomic analysis of a crudeoil combined distillation unit. Energy 2004;29:1909e27.
[9] Rivero R, Garcia M, Urquiza J. Simulation, exergy analysis and application ofdiabatic distillation to a tertiary amyl methyl ether production unit of a crudeoil refinery. Energy 2004;29:467e89.
[10] Antonio BA, Romildo PB, Luís SV. Exergy analysis of distillation processes-acase study. Energy 2007;32:1185e93.
[11] Ricardo R, Consuelo R, Salvador G. Exergy and exergoeconomic analysis of acrude oil combined distillation unit. Energy 2004;29:1909e27.
[12] Mullinger P, Jenkins B. Industrial and process furnace principles, design andoperation. 1st ed. Oxford: Elsevier; 2008.
[13] Wall Goral, Gong Mei. Exergy analysis versus pinch technology. Efficiency,cost, optimization, simulation and environmental aspect of energy systems;1996. pp. 451e5.
[14] Bott TR. Fouling of heat exchangers. Amsterdam: Elsevier; 1995.[15] Trinks W, Mawhinney MH, Shannon RA, Reed RJ, Garvey JR. Industrial fur-
naces. 6th ed. New Jersey: John Wiley & Sons; 2003.
Nomenclature
Ccl: heat exchanger cleaning cost (RM/unit)Cfl: furnace’s fuel cost (RM/GJ)Cpl: production lost cost due to plant shutdown (RM/unit)FG: fuel gas flow rate (m3/h)FIT: furnace inlet temperature (�C)m: mass flow rate (kg/h)T: temperature (K)T stack: stack temperature (�C)TFT: theoretical flame temperature (�C)TIT: tower inlet temperature (�C)Q: heat duty (kW)y: binary variable for CPT cleaningDExsource: exergy source (kW)DExsink: exergy sink (kW)DExloss: exergy loss (kW)DFG: extra fuel gas flow rate (m3/h)DH: enthalpy (kW)DHc: heat of combustion (kW)DSc: entropy change for cold stream (kW/�C)DSh: entropy change for hot stream (kW/�C)a: conversion factor (GJ h/month m3)h: furnace efficiency
شگالايي_پرژن