executive summary - welcome to the texas department of...
TRANSCRIPT

ES-1TEXAS TRANSPORTATION PLAN EXECUTIVE SUMMARY
The Texas Transportation Plan (TTP) 2040 documents the existing infrastructure and funding needs for all passenger and freight modes in the state over a 25-year horizon. As the state’s first performance-based long-range transportation plan, the TTP provides a path forward to align transportation investment decisions with performance outcomes to address passenger and freight needs and demands amid unprecedented growth and declining revenues. The population in Texas is expected to increase by 17 million to 45 million people between 2014 and 2040. As people continue to move to Texas, and the economy continues to grow, the transportation system must expand to accommodate this growth in a manner consistent with the priorities and desires of Texans and business leaders.
One of many challenges continues to be the increasing disparity between demand and available capacity. Since 1990, the state’s population has increased by 55 percent. During the same period, daily vehicle miles traveled have increased 70 percent and daily truck miles traveled have increased 110 percent on TxDOT-maintained roadways, while roadway centerline miles have increased at a disproportionate rate of 7 percent (Exhibit ES-1).
This demand is expected to continue to increase. Daily vehicle miles traveled are expected to increase by 300 million miles to 800 million total miles by the year 2040 – up by more than 60 percent from the 500 million miles that were driven on the state-maintained system in 2012. The projected increase in traffic will impact safety, congestion, and the condition of the pavement and bridges on Texas roadways.
EXECUTIVE SUMMARY
Exhibit ES-1. Highway System and Growth Trends

ES-2TEXAS TRANSPORTATION PLAN EXECUTIVE SUMMARY
Plan PurposeThe TTP was developed concurrently with TxDOT’s first freight plan – the Texas Freight Mobility Plan (TFMP) – to support TxDOT goals established in its 2015-2019 Strategic Plan, and the national goals defined in the Moving Ahead for Progress in the 21st Century (MAP-21) Act.
To address needs amid increasingly constrained resources it is critical to understand investment trade-offs and maximize the impact of every dollar spent to achieve performance objectives. Performance-based planning and programming decisions are informed by:
Strategic Direction – Where do we want to go? Goals and objectives Performance expectations and measures
Long-Range Planning – How are we going to get there? Identification of current trends, performance expectations, and targets Development of strategies consistent with Strategic Plan and TFMP goals Development of investment priorities based on needs and available funding
Transportation Programming – What will it take? Fiscally-constrained approach to reaching targets Investment and resource allocation based on project prioritization and selection criteria Project selection consistent with system performance expectations
Implementation and Evaluation – How did we do? Monitoring and reporting Communication of performance outcomes Collaborative evaluation to improve strategies
Strategic Direction – Where do we want to go?Preliminary TTP goal areas and objectives – that aligned with Strategic Plan and MAP-21 goal areas – were identified by an internal Technical Advisory Committee, and then vetted with stakeholders and the public during outreach efforts in the early stages of the TTP development (Fall 2013).
The preliminary or “draft” goal areas were refined over time based on continuous feedback from stakeholders and the public, and finalized after an extensive stakeholder and public outreach campaign conducted between June and August of 2014 (Exhibit ES-2).
In addition to MAP-21 performance measures, TTP performance measures were developed to support state and federal transportation goals and objectives. The TTP performance measures will serve as the basis for evaluating and
Exhibit ES-2. Texas Transportation Plan Goal Areas
ES-3TEXAS TRANSPORTATION PLAN EXECUTIVE SUMMARY
comparing investment policies and strategies and tracking the results over time to ensure TxDOT is making investments that optimize the performance of the statewide transportation system. Chapter 3 of the TTP provides additional information on the performance measures.
Long Range Planning – How are we going to get there?Long-range transportation needs such as maintenance and replacement of aging infrastructure cannot be met with declining revenues from traditional funding sources such as the gas tax and vehicle registrations. Just as critical is the need to identify new and sustainable funding sources to fill the remaining gaps.
To define priorities for the TTP goal areas, TxDOT analyzed existing modal plans, metropolitan planning organization (MPO) transportation plans and programs, and rural plans to ensure consistency between state and local initiatives to address freight and passenger needs. Exhibit 2-2 in Chapter 2 of the TTP provides a summary of the documents reviewed, considered, and incorporated by reference.
Safety is TxDOT’s number one priority and TxDOT strives to keep the transportation system infrastructure for which we are
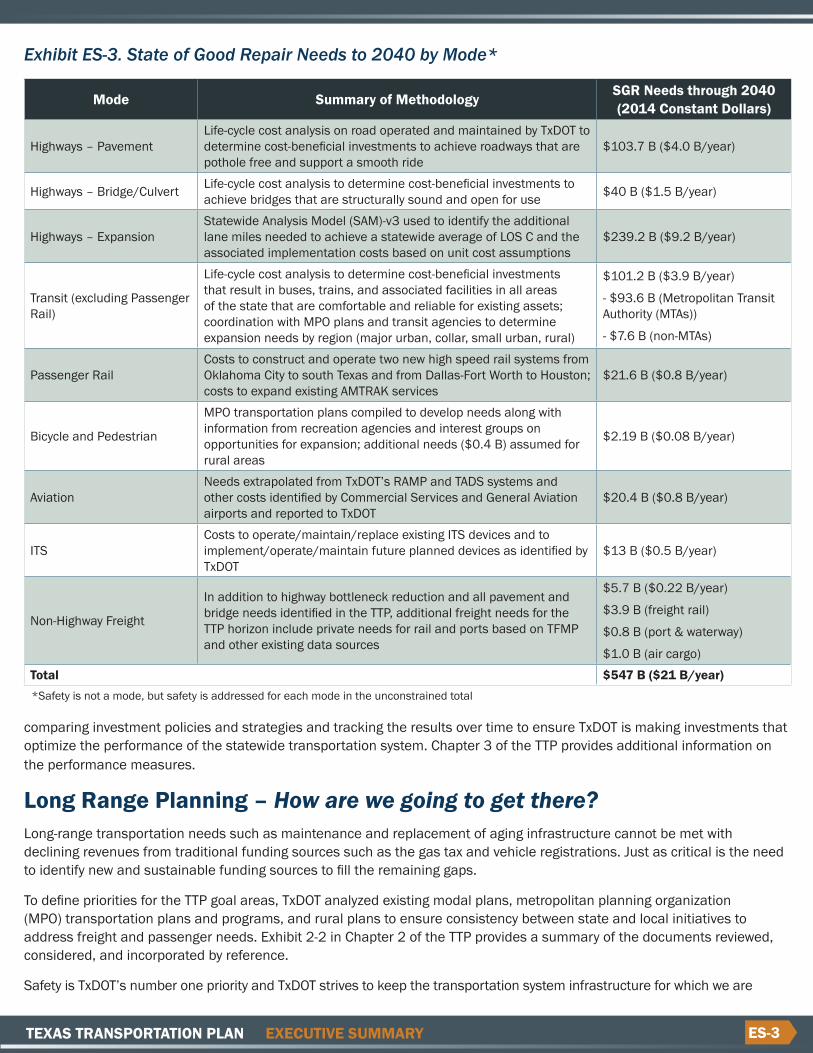
Exhibit ES-3. State of Good Repair Needs to 2040 by Mode*
Mode Summary of Methodology SGR Needs through 2040 (2014 Constant Dollars)
Highways – PavementLife-cycle cost analysis on road operated and maintained by TxDOT to determine cost-beneficial investments to achieve roadways that are pothole free and support a smooth ride
$103.7 B ($4.0 B/year)
Highways – Bridge/Culvert Life-cycle cost analysis to determine cost-beneficial investments to achieve bridges that are structurally sound and open for use $40 B ($1.5 B/year)
Highways – ExpansionStatewide Analysis Model (SAM)-v3 used to identify the additional lane miles needed to achieve a statewide average of LOS C and the associated implementation costs based on unit cost assumptions
$239.2 B ($9.2 B/year)
Transit (excluding Passenger Rail)
Life-cycle cost analysis to determine cost-beneficial investments that result in buses, trains, and associated facilities in all areas of the state that are comfortable and reliable for existing assets; coordination with MPO plans and transit agencies to determine expansion needs by region (major urban, collar, small urban, rural)
$101.2 B ($3.9 B/year)
- $93.6 B (Metropolitan Transit Authority (MTAs))
- $7.6 B (non-MTAs)
Passenger RailCosts to construct and operate two new high speed rail systems from Oklahoma City to south Texas and from Dallas-Fort Worth to Houston; costs to expand existing AMTRAK services
$21.6 B ($0.8 B/year)
Bicycle and Pedestrian
MPO transportation plans compiled to develop needs along with information from recreation agencies and interest groups on opportunities for expansion; additional needs ($0.4 B) assumed for rural areas
$2.19 B ($0.08 B/year)
AviationNeeds extrapolated from TxDOT’s RAMP and TADS systems and other costs identified by Commercial Services and General Aviation airports and reported to TxDOT
$20.4 B ($0.8 B/year)
ITSCosts to operate/maintain/replace existing ITS devices and to implement/operate/maintain future planned devices as identified by TxDOT
$13 B ($0.5 B/year)
Non-Highway Freight
In addition to highway bottleneck reduction and all pavement and bridge needs identified in the TTP, additional freight needs for the TTP horizon include private needs for rail and ports based on TFMP and other existing data sources
$5.7 B ($0.22 B/year)
$3.9 B (freight rail)
$0.8 B (port & waterway)
$1.0 B (air cargo)Total $547 B ($21 B/year)*Safety is not a mode, but safety is addressed for each mode in the unconstrained total

ES-4TEXAS TRANSPORTATION PLAN EXECUTIVE SUMMARY
responsible in a state of good repair (SGR). Highway pavements are in a SGR when the roadway has minimal cracking and rides smooth while bridges are in a SGR when they are structurally sound. The TTP documents the funding needs for all passenger and freight modes to achieve performance outcomes (e.g., SGR) aligned with TTP goals.
Exhibit ES-3 summarizes the methodology used for determining SGR for various highway and non-highway modes of transportation in the state. Based on these criteria, needs were projected to meet SGR definitions and costs were calculated by mode through year 2040.
A comprehensive statewide analysis of transportation demand to capacity across various modes identified baseline performance levels to maintain the system in SGR as is required by MAP-21. SGR generally considers asset condition, service life, and operational effectiveness. The results of this analysis are presented in Exhibit ES-4, which incrementally accounts for transportation revenue needs required to address various levels of system performance, up to and including achieving SGR for all modes.
Transportation Programming – What will it take?TxDOT maintains that approximately $5 billion dollars annually are needed – above existing revenues of $5.5 billion – to maintain current conditions on the state’s highway system. With an extra $5 billion a year in funding, TxDOT has stated that $1 billion (20 percent) would address our backlog of statewide maintenance needs on roads and bridges, $1 billion (20 percent) would address the additional highway system impacts in our energy sector regions of the state, and $3 billion (60 percent) would address the program of mobility and connectivity needs (Exhibit ES-5).
Funding needs and gaps presented in the TTP were based on reasonably expected revenues for all passenger and freight modes to achieve performance outcomes aligned with TTP goals and federal performance goals under MAP-21. Of the $21 billion dollar projection to achieve SGR on the entire system, TxDOT would need approximately $14.7 billion a year to achieve SGR for multimodal infrastructure for which it is responsible – while $6.3 billion would need to be invested by external transportation partners and providers. Proposition 1 will provide approximately $1.74 billion of the $5 billion needed for fiscal year 2015 and TxDOT is recommending the same percentage distribution illustrated in Exhibit ES-5.
Exhibit ES-6 illustrates system performance for each of the funding levels in Exhibit ES-4. At current reasonably expected revenues, “good” condition can be achieved for existing highway (bridge and pavement) infrastructure; however, this could occur only by shifting all highway expansion dollars to preventive maintenance and capital rehabilitation activities for existing assets. The system performance for each funding level described by the following conditions:
*$1.74B in Proposition 1 funding addresses some needs for fiscal year 2015, but future Proposition 1 funds are uncertain
Exhibit ES-4. Average Annual Revenue Needs for System Performance (2014-2040)
Exhibit ES-5. Proposed $5 Billion Disbursement

ES-5TEXAS TRANSPORTATION PLAN EXECUTIVE SUMMARY
Poor –signs of significant wear, tear, and deterioration Fair – signs of some aging is evident and reduced function Good – state of good repair as previously defined
Exhibit ES-6. System Performance Outcomes for Average Annual Revenue Needs (2014-2040)
ModeInvestment Category
Performance MeasureCurrent Hwy
Forecast ($5.5 B/yr)
Current Hwy + $5 B
($10.5 B/yr)
SGR Hwy ($14.7 B/yr)
SGR All Modes
($21 B/yr)
Pavement
National Highway System (NHS) Pavements
% NHS Pavement Lane-Miles in a State of Good Repair (based on IRI) Poor Good Good Good
% NHS Pavement Lane-Miles in a State of Good Repair (based on Condition Score)
Poor Good Good Good
Non-NHS Pavements
% Non-NHS Pavement Lane-Miles in a State of Good Repair (based on IRI)
Poor Poor Good Good
% Non-NHS Pavement Lane-Miles in a State of Good Repair (based on Condition Score)
Poor Poor Good Good
Bridge
NHS Bridges
% Structurally Deficient NHS Bridge Deck Area Good Good Good Good
Count of Structurally Deficient NHS Bridges Fair Good Good Good
Non-NHS Bridges
% Structurally Deficient Non-NHS Bridge Deck Area (on State System) Good Good Good Good
Count of Structurally Deficient Non-NHS Bridges (on State System) Fair Good Good Good
Highway Mobility
Rural Mobility Rural Level-of-Service Poor Fair Good GoodUrban Mobility Urban Level-of-Service Poor Poor Good Good
Transit
MTA Transit Asset Preservation
% of MTA Assets in a State of Good Repair Good
MTA Transit Service Enhancements
Additional MTA Annual Rider Trips in Millions Good
Non-MTA Transit Asset Preservation
% of Non-MTA Assets in a State of Good Repair Good
Non-MTA Transit Service Enhancements
Additional Non-MTA Annual Rider Trips in Millions Good
Passenger Rail Passenger Rail % Passenger Rail Needs Met GoodNon-Highway Freight
Non-Highway Freight % Non-Highway Freight Needs Met Good
Intelligent Transportation Systems (ITS)
ITS % ITS Needs Met Good
Aviation
National Plan of Integrated Airport Systems (NPIAS) Aviation
NPIAS Project Backlog Good
Non-NPIAS Aviation Non-NPIAS Project Backlog GoodBicycle and Pedestrian
Bicycle and Pedestrian
% Bicycle and Pedestrian Needs Met Good

ES-6TEXAS TRANSPORTATION PLAN EXECUTIVE SUMMARY
If transportation investments continue to be made using historical funding allocations, the condition and performance of the state’s multimodal transportation system would decline over the long-term. The $1.7 billion for fiscal year 2015 for highway infrastructure recently approved by Texas voters addresses strategic capacity enhancements and the immediate backlog in highway asset infrastructure, but little else.
If $5 billion in transportation funds becomes available for multimodal transportation, and is invested using under an allocation strategy similar to that which is used today, the condition of the system’s assets (pavements, bridges, and transit) would remain as “good.” Subsequently, congestion and mobility in urban areas would be slightly worse than today’s levels, and congestion and mobility in rural areas would be comparable to today’s levels.
To support greater public understanding of the gap between needs and available funding, TxDOT developed a bilingual, interactive planning scenario tool that enabled users to visualize the systemic impacts and trade-offs in performance that result from shifting financial resources from one transportation investment priority to another (e.g., from system preservation to roadway expansion). The user could also evaluate what a given level of investment “buys” in terms of various performance levels and then build their own transportation budget to reflect personal preferences for resource allocation and system performance.
The MetroQuest tool (Exhibit ES-7) was available at meetings and via a web address disseminated to meeting participants and advertised through social media. In total, more than 500 people visited the interactive planning tool website between June and September of 2014.
English and Spanish versions of the MetroQuest tool can be viewed at the following web addresses:
English: http://p1.txdot.metroquest.com/ Spanish: http://spanish.p1.txdot.metroquest.com/
Given the size and scale of the Texas transportation system, and the recent and projected population influx to the state, currently available revenues will be inadequate to meet transportation needs and growing demand. Increased funding will allow TxDOT to address more of the unfunded needs, but in a fiscally constrained environment, funding decisions and project selections must result in performance-based outcomes.
Guided by the performance goals outlined in the TTP, TxDOT is improving its current investment strategies and project selection process to link TTP goals to performance-based programming decisions that inform project selection. This performance based project selection process and current evaluation criteria are illustrated in Exhibit ES-8. Through this process, projects selected and programmed through mid-range plans and programs such as the Unified Transportation Program (UTP) and the Statewide Transportation Improvement Program (STIP) can be objectively evaluated and linked to potential performance outcomes.
Additional steps must be taken by TxDOT and our planning partners to effectively meet TTP and MAP-21 performance goals and to deliver safe and sustainable multimodal transportation options into the future, TxDOT must:
Exhibit ES-7. MetroQuest Tool Introduction Page (Spanish version)

ES-7TEXAS TRANSPORTATION PLAN EXECUTIVE SUMMARY
Build on the existing project selection criteria to develop a transparent performance-based project prioritization process that weights and ranks all UTP projects using both quantitative and qualitative criteria to meet short- and long-term performance goals and state transportation priorities. This should combine asset management priorities with major projects identified in the UTP.
Advance asset management planning and predictive capabilities for all project types, both at the Division and District levels.
Make strategic capacity enhancements to reduce bottlenecks and improve travel times in key passenger and freight corridors (Exhibit ES-9).
Compare preventive treatments against system expansion projects in order to determine the best possible allocation of existing and new transportation funds.
Exhibit ES-9. Texas Freight Network
Exhibit ES-8. Performance – Based Project Selection Criteria
ES-8TEXAS TRANSPORTATION PLAN EXECUTIVE SUMMARY
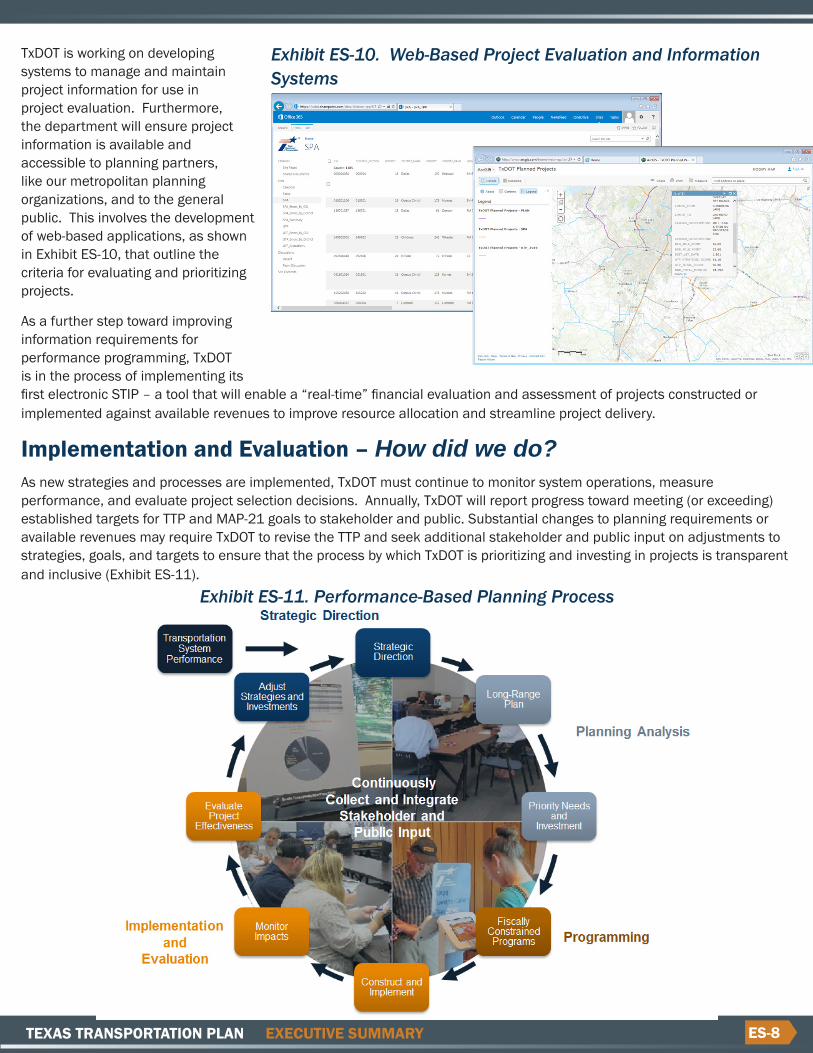
TxDOT is working on developing systems to manage and maintain project information for use in project evaluation. Furthermore, the department will ensure project information is available and accessible to planning partners, like our metropolitan planning organizations, and to the general public. This involves the development of web-based applications, as shown in Exhibit ES-10, that outline the criteria for evaluating and prioritizing projects.
As a further step toward improving information requirements for performance programming, TxDOT is in the process of implementing its first electronic STIP – a tool that will enable a “real-time” financial evaluation and assessment of projects constructed or implemented against available revenues to improve resource allocation and streamline project delivery.
Implementation and Evaluation – How did we do?As new strategies and processes are implemented, TxDOT must continue to monitor system operations, measure performance, and evaluate project selection decisions. Annually, TxDOT will report progress toward meeting (or exceeding) established targets for TTP and MAP-21 goals to stakeholder and public. Substantial changes to planning requirements or available revenues may require TxDOT to revise the TTP and seek additional stakeholder and public input on adjustments to strategies, goals, and targets to ensure that the process by which TxDOT is prioritizing and investing in projects is transparent and inclusive (Exhibit ES-11).
Exhibit ES-11. Performance-Based Planning Process
Exhibit ES-10. Web-Based Project Evaluation and Information Systems
ES-9TEXAS TRANSPORTATION PLAN EXECUTIVE SUMMARY
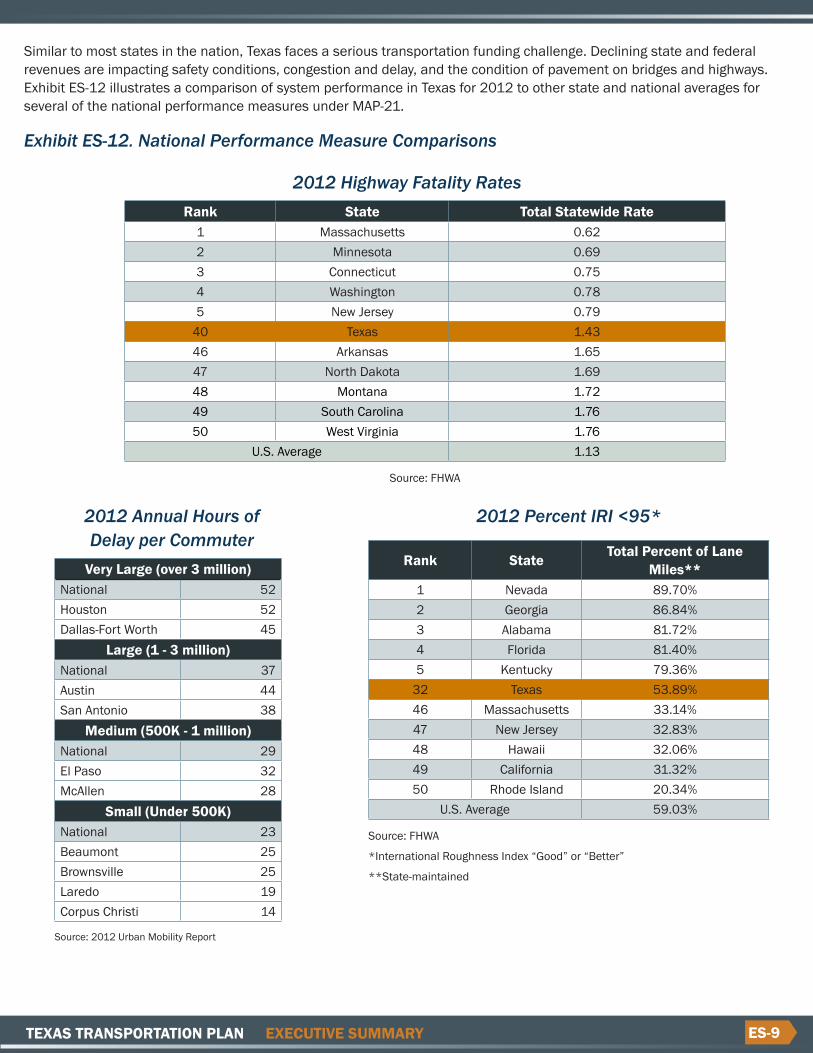
Similar to most states in the nation, Texas faces a serious transportation funding challenge. Declining state and federal revenues are impacting safety conditions, congestion and delay, and the condition of pavement on bridges and highways. Exhibit ES-12 illustrates a comparison of system performance in Texas for 2012 to other state and national averages for several of the national performance measures under MAP-21.
Exhibit ES-12. National Performance Measure Comparisons
2012 Highway Fatality RatesRank State Total Statewide Rate
1 Massachusetts 0.622 Minnesota 0.693 Connecticut 0.754 Washington 0.785 New Jersey 0.79
40 Texas 1.4346 Arkansas 1.6547 North Dakota 1.6948 Montana 1.7249 South Carolina 1.7650 West Virginia 1.76
U.S. Average 1.13
Source: FHWA
2012 Annual Hours of Delay per Commuter
Very Large (over 3 million)National 52Houston 52Dallas-Fort Worth 45
Large (1 - 3 million)National 37Austin 44San Antonio 38
Medium (500K - 1 million)National 29El Paso 32McAllen 28
Small (Under 500K)National 23Beaumont 25Brownsville 25Laredo 19Corpus Christi 14
Source: 2012 Urban Mobility Report
2012 Percent IRI <95*
Rank State Total Percent of Lane Miles**
1 Nevada 89.70%2 Georgia 86.84%3 Alabama 81.72%4 Florida 81.40%5 Kentucky 79.36%
32 Texas 53.89%46 Massachusetts 33.14%47 New Jersey 32.83%48 Hawaii 32.06%49 California 31.32%50 Rhode Island 20.34%
U.S. Average 59.03%
Source: FHWA
*International Roughness Index “Good” or “Better”
**State-maintained

ES-10TEXAS TRANSPORTATION PLAN EXECUTIVE SUMMARY
Conclusions Texas is at a turning point. Texas faces serious transportation funding challenges given the decline in both state and federal sources.
At current funding levels and without additional sustainable funding in the future, “good” conditions on pavements and bridges can only be maintained by shifting all highway expansion dollars to preventive maintenance and capital rehabilitation.
The $1.7 billion for highway infrastructure, recently approved by Texas voters under Proposition 1, will address some of the strategic capacity enhancement, connectivity, and maintenance needs for fiscal year 2015, but will not be sufficient to address growing needs into the future.
TxDOT estimates that $5 billion more per year (2014 dollars) in highway investment is needed to generally maintain the current level of congestion and condition of our highway infrastructure.
The transition of current practices to a more performance-based approach is an ongoing process that begins with the adoption of the TTP 2040 – TxDOT’s first performance-based, long-range, multimodal plan. As we implement this Plan, TxDOT will:
Advance asset management planning and predictive capabilities for all project types, both at the Division and District levels;
Make strategic capacity enhancements to reduce bottlenecks and improve travel times in key passenger and freight corridors;
Continue to work with elected officials to identify and develop sustainable funding sources; and Continue its partnerships with multimodal transportation providers to develop and implement provide new
technologies, demand management strategies, system operations and non-motorized transportation improvements to meet identified needs.