executive summary - the national...
TRANSCRIPT

EXECUTIVE SUMMARY
1.1 This study provides a preliminary evaluation of the 1995 Agricultural Tenancies Act which sought to: • encourage more letting of agricultural land; • increase the opportunities for new entrants; • promote economic efficiency in agricultural land use. The legislation was regarded primarily as a means of resolving a supply-side problem in the land market which was seen to be constraining the efficient use of agricultural land, reducing the opportunity for farmers to develop their businesses by renting additional land and making it more difficult for new entrants to gain a foothold in the industry. 2. Recognising that it is taking place early in the life of the new legislation, the objectives of the present study were:
i. to quantify and characterise the use of FBTs in England and Wales in the first 12 months of the new legislation;
ii. to identify any constraints on the further expansion of the use of FBTs in England and Wales and to suggest appropriate means for removing them; iii. to indicate current perceptions of the economic efficiency of land-use under FBTs; iv. to provide a baseline for the future evaluation of the economic efficiency of the new tenure arrangements. 3. The methodology for this project comprised six main components, viz. i. Desk review/synthesis of material from existing reports and other literature; ii. Reanalysis of existing data; iii. Discussions with a “Panel of Experts”; iv. Extension of the 1996 University of Plymouth/RICS Survey of Chartered
Surveyors in England and Wales to ensure adequate coverage of County Farms and FBTs in Wales. v. Telephone surveys of landowners and owner-occupiers, tenants and professional consultants/advisers (including chartered surveyors and solicitors); vi. 12 focus groups at 4 locations in England and Wales involving participants from each of the above groups.

4. A major objective of the 1995 Act was to increase the size of the let sector. On the basis of the results from the 1996 University of Plymouth/RICS Survey of Chartered Surveyors in England and Wales supplemented by our additional 1997 surveys, we estimate that, in England and Wales, up to about 5,000 FBTs were created in the first year of the Act, covering about 200,000 hectares. This represents a substantial amount of activity, involving almost 6 per cent of the land currently rented. Of particular importance is the fact that up to 25,000 hectares of this land was previously farmed “in-hand”. In the context of the relatively high levels of profitability from in-hand farming during this period this is a significant achievement, suggesting that the new legislation does have the potential to slow the rate of decrease of the let sector. We conclude that the 1995 Act does appear to have achieved its primary objective of bringing new land into the rented sector though it is too early to be certain that it will reverse the long-term decline in the proportion of rented land. 5. The amount of letting activity and the level of rents on FBTs suggest that in the present economic climate there is still excess demand for rented land and we would expect the growing amount of activity in the market for let land to continue for some time. However, our surveys did show a much greater uptake of FBTs in the East of England than elsewhere in England or in Wales. This is associated with the preponderance of arable farms among FBTs (accounting for 48 per cent of the total land let in England in the first year of the Act). 6. Neither the telephone surveys nor the focus groups identified any major constraints on the uptake of FBTs. Levels of awareness are generally high, particularly among landowners and their professional advisers. About a third of landowners responding to the telephone surveys said that they would let more land in the future. 7. Many of the FBTs let in the first year of the Act were small, often representing a marginal increase to the size of existing holdings. In England, 60 per cent and in Wales 49 per cent, were less than 25 hectares. Most FBTs comprised bare land, without farm buildings or a house but there were substantial differences between England and Wales in this respect. In England, 7 per cent of the holdings (covering 25 per cent of the FBT area) were “complete holdings” in the sense that they included farm buildings and a house; in Wales, the figures were 25 per cent and 66 per cent respectively. 8. The term of many of the FBTs was quite short with 55 per cent in England (30 per cent in Wales) being for two years or less. FBTs on land formerly let as AHA 1986 tenancies were certainly let for a much shorter term than under the previous tenure but the Act also appears to have had the effect of significantly lengthening (to a median of 2 years) land previously let in grazing licences and Gladstone v Bower arrangements.

9. While the FBTs let in the first year of the Act have provided some land for new entrants - perhaps 18,000 hectares in England and 2,500 hectares in Wales - we share the pessimism expressed in the focus groups about the Act’s ability to achieve the objective of enabling more new entrants to gain a foothold in the industry. The largest immediate impact of the Act has been to “free up” the market for “marginal extra acres” for existing farmers seeking to enlarge the farm, spread fixed costs and thus increase profitability. Our evidence suggests that County Farms still play an important, if dwindling, role in providing farming lets to new entrants. 10. FBT rents reflect the current excess demand for let land, particularly in England, with a median annual rent of £185 per hectare in England (£113 in Wales). There is no evidence of systematic variation in annual rents according to the length of term of the agreement where arable land is concerned but some systematic variation was found on lets associated with a livestock enterprise. 11. Analysis of the FBT agreements themselves shows that they are beginning to incorporate the flexibility encouraged by the 1995 Act. For example, 19 per cent of the English agreements for which we obtained detailed information had “specific requirements largely concerning environment conservation” while 47 per cent included reference to the use of an “Independent Expert” in the event of disputes rather than providing for arbitration. 12. While the levels of awareness of FBTs are high, the poorer levels of understanding of the new legislation give some cause for concern. Both the telephone surveys and the focus group meetings suggested that there are cases where either or both parties are unaware of some of the fundamental differences between FBTs and previous rental agreements.There may be a case for a statutory requirement to serve notice of an FBT on lines similar to that which was, until recently, required for an assured shorthold tenancy in the residential sector. 13. We suggest the main yardsticks against which the future success of the Act should be judged: 1. The size of the tenanted sector - the proportion of farmland that is rented rather than owned; the number of wholly or mainly tenanted farms. 2. The number (and area) of FBTs coming onto the market on land that was previously farmed in-hand rather than replacing an existing agreement. 3. The term of FBTs granted. 4. The extent to which FBTs are let to new entrants as well as to established farmers. 5. The extent to which FBTs are meeting the needs of the varying sectors of the

agricultural industry e.g. arable, dairy and livestock. 6. Trends in investment in farm land with a view to let. 7. Trends in investment in buildings and fixed equipment on farms that are (a)
owner-occupied (b) mainly rented (1986 AHA tenancies), and (c) mainly rented (FBTS).
8. The transactions costs associated with the letting and renting of land using FBTs. 9. The level of FBT rents.

CONTENTS
EXECUTIVE SUMMARY Page CHAPTER 1 BACKGROUND AND OBJECTIVES 1
CHAPTER 2 METHODOLOGY 11
CHAPTER 3 THE EXTENT AND NATURE OF THE UPTAKE OF FARM BUSINESS TENANCIES 21 CHAPTER 4 THE MARKET FOR FARM BUSINESS TENANCIES 59 CHAPTER 5 CONSTRAINTS ON THE UPTAKE OF FARM BUSINESS
TENANCIES 79 CHAPTER 6 MEASURING THE IMPACT OF FARM BUSINESS TENANCIES 97 CHAPTER 7 CONCLUSIONS AND IMPLICATIONS 111 APPENDICES Appendix 1 A comparison of the main features of the Agricultural Holdings Act
1986 and the Agricultural Tenancies Act 1995
Appendix 2 Farm Business Tenancies detailed provisions: Background notes Appendix 3 Postal Survey Questionnaire and Covering Letter Appendix 4 Telephone Survey Questionnaire and Interviewers’ Instructions Appendix 5 Investment In Buildings and Land Improvements: The Baseline Data Tests of Statistical Significance: A Note On a number of occasions in this report comparisons are made between sub-groups of respondents ( whether to our postal or telephone surveys or within the Farm Business Survey dataset). In these cases Student’s T ( for continuous variables ) or Chi2 ( for categorical data) have been calculated to test the statistical significance of the difference between the sub-groups. A ‘significant’ difference between distributions is taken to be one where there is a less than 5% probability of the difference arising by chance.

1
CHAPTER 1 BACKGROUND AND OBJECTIVES
Introduction
1.1 This study provides a preliminary evaluation of the 1995 Agricultural Tenancies Act
which sought to:
• encourage more letting of agricultural land;
• increase the opportunities for new entrants;
• promote economic efficiency in agricultural land use.
The legislation was regarded primarily as a means of resolving a supply-side problem in the
land market which was seen to be constraining the efficient use of agricultural land, reducing
the opportunity for farmers to develop their businesses by renting additional land and making it
more difficult for new entrants to gain a foothold in the industry. This chapter examines the
background to the legislation and outlines the main objectives of the present study which forms
the precursor to a full economic evaluation that is expected to follow in three or four years'
time.
The decline of the tenanted sector
1.2 Almost since the first Agricultural Holdings Act of 1875, commentators from all
sectors of the industry have been predicting the decline and eventual demise of the agricultural
tenanted sector. Indeed, the area of rented agricultural land in Britain fell from approximately
88 per cent in 1908 to approximately 37 per cent in 1995 (Kerr 1994). The fact of its survival,
albeit drastically reduced over the century, demonstrates its value as a tried and tested method
of combining capital investment and technical skills in a highly volatile sector.
1.3 Rigid and intrusive land tenure legislation is often identified as a major factor in this
decline, though as we suggest below, other socio-economic factors have also played a major
role. Legislative development through the century have concentrated on two main areas; tenants
rights and security of tenure. The 1875 Act and indeed the 1851 Landlord and Tenant Act
before it concentrated on the former at a time when there was much concern about the iniquities
of a system which afforded little or no protection or prospect of compensation to tenants who
had to rely instead on the voluntary initiatives of a philanthropic landlord. Indeed the
requirement for one year's notice to quit did not emerge until the 1883 Agricultural Holdings
Act which effectively marks the start of the statutory framework which has become so familiar

2
to recent generations of landlords and tenants alike and which distinguishes agriculture from
many other industries. A plethora of legislation was next consolidated in the Agricultural
Holdings Act of 1923 which completed the development of the statutory tenant right provisions
first enacted through the adoption of Lincolnshire custom into the 1875 Act.
1.4 Life-time security of tenure did not enter the statute book until the Agriculture Act 1947
rapidly consolidated into the Agricultural Holdings Act 1948, the longest lasting of all
agricultural holdings legislation thus far. This was extended by the Agriculture (Miscellaneous
Provisions) Act 1976 which introduced the possibility of two successions for close relatives.
Highly controversial at the time the Act was distinguished by its retrospective nature applying
to all existing tenancies. It is held both by advocates, but more particularly by critics, to be a
landmark piece of legislation which overnight changed the social as much as the economic
structure of the countryside.
1.5 The “three generation” tenancy persisted until the 1984 Agricultural Holdings Act
which provided for lifetime succession to pre-12th July 1984 tenancies but abolished the
succession provisions for all tenancies created after that date. It also introduced retirement
tenancies for smallholdings. In addition, it created Ministry-approved tenancies. This first
formal experiment in fixed term tenancies of longer than two years provided for lettings of
between two and five years which were excluded from any greater security by the approval,
which had to be expressly sought by both parties, of the Minister of Agriculture. Ministry
approval was only available on limited, prescribed grounds most particularly as a trial period,
as a temporary measure where the owner anticipated their heir returning to the holding in the
foreseeable future and for some specialist cropping. Initially very tightly controlled with a
presumption against repeat lettings, interpretation of the criteria for granting consent became
progressively more open with use. The 1984 legislation, consolidated in the Agricultural
Holdings Act 1986, represented a significant overhaul of the 1948 legislation with amendments
in other areas such as rent reviews. In the latter case the concepts of productive capacity and
related earning capacity confirming a statutory framework supporting the general level of
arbitrated or settled rents stemmed from much cross industry dialogue and perhaps laid some of
the foundations for the next major collaborative development - tenancy reform.

3
1.6 Analysis often reflects on the impact of the 1976 Act on the letting market. The pinnacle
of security, it is seen as the most intrusive restriction on the marketplace perhaps as much for
its impact as retrospective legislation as for its immediate practical effect. However, the
decline in the tenanted sector is not merely a function of legislative interference. Indeed, if it
were, one would expect the reduction in the size of the sector to have accelerated since the
consolidation of full security into the 1948 Act. In contrast as, Figure 1.1 illustrates, there has
been a steady decline inthe proportion of agricultural land in the tenanted sector throughout the
20th Century.
Figure 1.1 Proportion of agricultural land in the United Kingdom rented or mainly rented
1908 -1995
% la
nd r
ente
d
0
10
20
30
40
50
60
70
80
90
1900 '1
0
'20
'30
'40
'50
'60
'70
'80
'90
AHA 1948 AMPA 1976 AHA 1984 ATA 1995Key Legislation........
Source: Winter et al (1990); MAFF
1.7 But if the tenure legislation has played a part in the decline of the tenanted sector, other
factors have also been important. Indeed, a myriad of other influences have shaped decision-
making of both landlord and tenant during this century. For landlords, socio-economic factors
such as the decimation of a generation of landowners through two world wars, increased
returns from in-hand farming and differential taxation have all contributed to the process. For
tenants, dramatic increases in land values, the vacant possession premium and the consequent
attraction of buying out their landlord, technological advances in farming, the understandable

4
preference amongst banks to lend to property owners rather than tenants and pressure to
increase farm size have also been significant influences on the process.
1.8 This latter issue has had a marked effect both on the amount of land lost from the rented
sector and particularly on the number of holdings. Larger holdings are seen to benefit the
incumbents on both sides of the contract, hence the trend of farm amalgamations. In the
economic circumstances that have prevailed over much of the post-war period, a landlord
taking a farm back on a tenant's death or retirement and minded to relet will almost always
maximise revenue by fragmenting the holding. The potential capital receipts from selling the
farmhouse and buildings together with the associated savings on repairs and improvements are
added benefits. Indeed, anecdotal evidence suggests that the process has been accelerated in
dairy areas by the advent of milk quota and increased requirements for pollution control. The
need for funding to compensate the outgoer for the former and investment to meet the latter
increases the pressure on owners to sell or amalgamate rather than relet as a unit. In most cases
neighbouring farmers, whether owner-occupier or tenant are more than willing to take on extra
land and indeed within many estates are determined advocates of the need to expand their
businesses to maintain viability.
1.9 The desire to expand, coupled with the relative financial security of a larger, well-
established business, has seen even the most traditional private and institutional estates pursue
amalgamation policies in recent years. Thus whilst the proportion of land in the rented sector in
Great Britain has fallen from 88 per cent of the total farmed area in 1908 to 35 per cent in
1994, the number of holdings has fallen, again from 88 per cent of the total number of holdings
to 24 per cent over the same period. The average size of holdings in the rented sector has now
risen to 107 hectares whilst over the same period mainly owned holdings have increased to 64
hectares (MAFF 1968, MAFF 1995).
1.10 The combined pressure of land lost from the sector and increased holding size means
far fewer opportunities for new entrants. County smallholding estates, affected by all the
traditional industry pressures, exacerbated by ever more pressing demands on council
resources, have mirrored the sector overall in decline in area and holdings. Stagnation within
the estates and in the market beyond means they seldom now operate as the “first rung on the
farming ladder”. Research for the RICS in 1994 revealed the aggregate number of new entrants

5
falling to 2 per cent of the total number of holdings from a sample of 19 counties and 4,200
holdings. The same sample showed 41 per cent of tenants had farmed on their estate, usually on
the same farm, for more than 20 years (Warren et al 1995). Creating opportunities for new
entrants became one of the prime motives of reform; an early TFA paper was titled “New
Tenancies - New Blood”, and all sides of the industry and government identified with this
objective. Latterly, this dilemma has been heightened by the relaxation in capital set-aside
rules for Councils introduced following the 1995 Rural White Paper (DoE/MAFF 1995). This
has encouraged a majority of Local Authorities to review their landholding strategies and a
number appear to have opted for accelerated disposal programmes, undermining their role still
further.
1.11 Whilst the 1984 legislation removed the succession provisions for new tenancies it did
nothing to release land from existing tenancies. Furthermore by then landlords willing to allow
others to farm their land had adopted a number of devices to avoid the strictures of the 1976
Act. Their approach sat well with devices used to avoid the other often quoted disincentive to
letting, the differential taxation regime. Successive Labour and Conservative administrations
had surtaxed income from property and allowed greater relief from capital taxation for owner-
occupiers. This had seen the rise in the use of tax planning trusts, companies and partnerships
both amongst estate owners and farmers wishing to pass land down the generations. Land
owners exploited a loophole in the 1986 Act, utilising the judgement in Gladstone v Bower
1960, and created agreements with terms of between one and two years which did not revert to
annual tenancies with full security. These arrangements, together with share farming, came to
the fore, having benefits in avoiding both taxation and security of tenure.
1.12 Analysis of the CAAV Annual Tenanted Farms Survey showed a marked increase in the
use of short term arrangements from 1977 on (Winter et al 1990). The same study showed that
by 1990 “unconventional” tenancies amounted to 25 per cent of all tenanted agricultural land in
England and Wales, though the inclusion of grass keep, a traditional practice in some livestock
areas and more often than not involving very small areas of land, may overstate the loss to the
tenanted sector. More telling, perhaps, given the impact on new lettings the CAAV survey,
which deals with changeovers during the year, showed that by 1994 37 per cent, by area, of the
sample was let on short term tenancies.

6
Origins of the 1995 legislation
1.13 The continued decline in the tenanted sector and particularly in the supply of land
coming to the market prompted much debate within the industry. In his 1994 study for the RICS
Kerr reports a survey of CLA members in the late 1980's which suggested that 1.6 million
acres of land could be made available for new lettings given freedom of contract (Kerr 1994).
Interestingly the survey commented that the landlord and tenant system was hindered by “a
number of factors, amongst which agricultural holdings legislation is pre-eminent”. The TFA
had voiced support for an extension of the retirement tenancy, introduced for smallholdings in
the 1984 Act. Subsequently they developed proposals for a form of rural business lease, allied
to the approach for commercial property in the Landlord and Tenant Act 1954. The NFU has
traditionally cherished security of tenure and in the early days of the debate appeared the least
willing to consider reform. Indeed it was roundly criticised by the NFYFC for defending long
term tenancies and thus stifling the opportunities for new entrants. However in early 1990 the
“tenants side” (NFU, TFA, FUW) came together in a joint press release, with The Association
of County Councils. This set out five issues, the only concession to weakening security being an
optional retirement clause. The statement also recommended changes to the taxation regime to
remove the differential between landlords and owner-occupiers. Criticised at the time for
naivety for mixing the roles of two government departments where “concerted action is an
unrealistic expectation” (Winter et al 1990) this recommendation was accepted, at least in
part, by the changes in the 1995 Budget.
1.14 Faced with an industry almost in conflict over the issue the then Government had
initially called for some degree of agreement before legislation could be drafted. However in
1990 Baroness Trumpington argued in the House of Lords for a radical review of tenancy law
and stated the Ministry’s new position that action might be required even without agreement
within the industry. Thus the long process of reform began in earnest. MAFF issued a
consultation document in 1991 seeking proposals to provide an enduring framework for the
sector, encourage the letting of land and deregulate and simplify tenancies. Much debate ensued
amongst the main protagonists; NFU, CLA, TFA, FUW and NFYFC, assisted by the
professional organisations; RICS and CAAV. This culminated in the industry agreement in
1993 which cleared the way for the rapid progress of the bill through Parliament in 1994 and
1995.

7
1.15 The principle of reform was keenly supported by the professional organisations and as
part of this process the RICS produced a report in 1994 forecasting that 900,000 acres might be
released into the tenanted sector in England and Wales for lettings of longer than five years in
the period 1995 - 1997 (Kerr 1994). The report, based on a postal survey of Chartered
Surveyors, drew support for this estimate from the Scottish experience of limited partnerships.
This report has been criticised in some circles for its methodology. The unfortunate truth is that
this highly publicised and very substantial figure, four times the amount of land included in the
1994 CAAV Annual Tenanted Farms Survey, has been adopted by critics as a litmus test of
the success or otherwise of the legislation.
1.16 Interest in the bill was maintained throughout the parliamentary process by members of
the Tenancy Reform Industry Group (TRIG), comprising representatives from the NFU, CLA,
TFA, NFYFC, RICS and CAAV, who advised the Bill Team on technical issues. Indeed much
detailed negotiation was conducted during the passage of the bill with key provisions on
compensation being amended during the very last stages. The Agricultural Tenancies Act
received Royal Assent in May 1995 with Farm Business Tenancies starting from 1st September
19951. The introduction was supported by amendment to Inheritance Tax which provided for
100 per cent Agricultural Property Relief on all tenancies created after that date bringing the
tax treatment of these tenancies in line with owner-occupied land. In a foreword to the NFU
guidance notes Sir David Naish, the President, welcomed the legislation with a closing
reference to one of the key issues which had fuelled the legislation; “Together we can seize the
opportunities and help to create a brighter future for young people in farming”.
Objectives of the current project
1.17 The underlying objectives of the legislation (noted in para 1.1) imply the need for two
levels of economic evaluation of the 1995 Act. In the first place the evaluation needs to
establish whether the legislation has in fact increased the size of the let sector beyond what it
would otherwise have been and provided more opportunities for new entrants - and if not, why
not. Secondly, inasfar as the legislation has had these effects, the evaluation will need to
address the question of whether the resulting changes in land tenure patterns have in fact
increased the economic efficiency of land-use.
1 A summary of the main features of the 1995 Agricultural Tenancies Act, comparing them with the position under the 1986 Agricultural Holdings Act is included as Appendix 1.

8
1.18 The present evaluation is taking place very early in the life of the new legislation. In the
present project the first level of evaluation identified in the previous paragraph will be
particularly important since, among other things, it will identify any teething problems with the
new legislation which may be constraining the use of FBTs and expansion of the let sector.
Once identified and quantified, it may be possible to overcome some of these constraints in the
relatively short-term and within the existing legislation.
1.19 In terms of this first level of evaluation, we first sought to quantify and characterise the
adoption of FBTs in the first 12 months of the new legislation, providing information on:
• The area of land under FBTs and its characteristics (total area, distribution of units by
size, location, previous tenure etc.)
• The types (and motivation) of landowners letting land under FBTs. In this case we
sought to include both what might be termed the main “Professional Landlords” such as
the Crown, the Ministry of Defence, the Church, the National Trust, and the main landed
Estates (including the Oxbridge Colleges) as well as “Other Landowners” such as the
owner-occupier with no (immediate) farming successor or the diversifying farmer
seeking to reduce the size of the farming operation while retaining ownership of the
land.
• The types (and motivation) of tenants renting land under FBTs. Given the objectives of
the 1995 Act it was particularly important to distinguish the new entrant to farming from
the established farmer extending their business.
• The types of agreement. It was necessary to characterise and quantify the new
agreements in terms of key characteristics such as their duration, the treatment of
diversification enterprises, break clauses, arrangements for resolution of disputes and
so on.
1.20 We then sought to evaluate the constraints on the uptake of FBTs and to identify how
these might be removed. There are three main factors which may place temporary constraints
on the uptake of FBTs, viz:
• lack of awareness of the existence and purpose of FBTs;

9
• misunderstandings about the content, operation and purpose of FBTs;
• perceived problems with the current operation of FBTs.
Given the context and prime objectives of the 1995 Act (see paras 1.2-1.16) it could be argued
that the evaluation of these factors should concentrate solely on the supply side - looking at
landowners (both with and without FBTs) and those (such as land agents, consultants and
solicitors) who advise or act for them. However, we felt it was also important to gather
information from FBT tenants and other farmers who might take up FBTs in the future.
1.21 As regards the second level of evaluation, the primary aim of the present project has
been to establish the baseline for the proposed evaluation in three to four years time by
identifying the criteria which might be used. In addition to this, since the new legislation was
expected to reduce the average term of tenancies, possibly providing a disincentive among
tenants to invest in land-improvements, buildings and other fixed capital items, we also sought
to conduct a preliminary examination of the different investment patterns on owner-occupied as
against tenanted farms prior to the legislation.
1.22 While recognising that it is too early to attempt a full objective evaluation of the
efficiency of land-use under FBTs as compared with other forms of tenure2 we did seek to
explore the perceptions of the main “actors” closely involved with the new FBTs. These
included the tenants and landowners themselves as well as the land agents and consultants who
advise or act for them.
1.23 To summarise, the objectives of the present study were:
i. to quantify and characterise the use of FBTs in England and Wales in the first
12 months of the new legislation;
ii. to identify any constraints on the further expansion of the use of FBTs in
England and Wales and to suggest appropriate means for removing these
constraints;
iii. to indicate current perceptions of the economic efficiency of land-use under
FBTs as compared with other the forms of tenure currently or recently
prevailing in England and Wales;
2 For example, the type of evaluation previously carried out by Hill and Gasson (1984) comparing farm performance on Owner-occupied, Tenanted and Mixed Tenure farms.

10
iv. to provide a baseline for the future evaluation of the economic efficiency of the
new tenure arrangements.
Structure of the report
1.24 The next chapter describes the methodology employed in the study. Chapters 3 and 4
consider the extent and nature of the uptake of FBTs in the first year of the new legislation
while chapter 5 focuses on the constraints to this uptake. Chapter 6 examines current
perceptions on the economic efficiency of the new arrangements, suggests a number of criteria
by which this might be measured more objectively in the subsequent study and describes the
results of our analysis of the baseline data on investment. Chapter 7 contains the main
conclusions of our study and draws out a number of implications.

11
CHAPTER 2 METHODOLOGY
Introduction 2.1 The methodology for this project comprised six main components, viz. i. Desk review/synthesis of material from existing reports and other literature; ii. Reanalysis of secondary data (from the 1996 University of Plymouth/RICS Survey
of Chartered Surveyors in England and Wales - Whitehead 1996), the MAFF Annual Survey of Tenanted Land, and the MAFF Farm Business
Survey; iii. Discussions with a “Panel of Experts”; iv. Extension of the University of Plymouth/RICS Survey of Chartered Surveyors in
England and Wales to cover County Councils and all Chartered Surveyors in Wales; v. Telephone survey; vi. Focus Groups. 2.2 The inclusion of the first three components ensured that the subsequent primary data collection could concentrate on the necessary additional data. This was important not only in order to use the research project resources efficiently but because the recent attention given to FBTs may have given rise to “survey fatigue” among some of the groups from whom we wished to gather data. Our general approach in the collection of new data was therefore to build on the existing data in a number of ways. The reanalysis of existing data 2.3 The University of Plymouth/RICS study 1996 (Whitehead 1996) involved a survey of 500 Principal Rural Practice chartered surveyors drawn randomly from the RICS membership list. The sample comprised 25.6 per cent of chartered surveyors in this category. While the postal survey achieved a very good response rate (61.7 per cent) and gathered a good deal of relevant and useful information about the uptake of FBTs in the first year of the new legislation, we recognised its limitations. In the first place, the survey had deliberately excluded County Land Agents responsible for County Council smallholdings because they had formed the target for a recent previous survey by University of Plymouth (Warren et al 1995) and it was felt to be too soon to survey them again. Second, the survey had yielded relatively few FBTs in Wales (14 in all). 2.4 In order to provide adequate coverage for subsequent analysis it was necessary to replicate the 1996 survey among County Land Agents and to attempt to increase the coverage in Wales. In each case the questionnaire needed to refer to the same time-period as the original survey (1st September 1995 to 31st August 1996).

12
2.5 Even among the Principal Rural Practice chartered surveyors in England it was possible that the original survey had included some non-response bias and it was necessary to explore this before combining this data with that gathered in the replicate surveys. We therefore compared the sample of FBTs reported in the University of Plymouth/RICS survey with the results of the MAFF Annual Survey of Tenanted Land (ASTL) published in May 1997. As table 2.1 shows, the University of Plymouth/RICS survey exhibited a strong regional bias with considerable over-representation of the South-west. Following discussions with the Project Steering Group, it was decided to rely on the University of Plymouth/RICS survey for much of the basic factual information about the uptake of FBTs but to re-weight the survey results to match the geographic distribution from the ASTL survey. Table 2.1 shows the weighting factors used in the subsequent reanalysis of this data. The removal of the “South-west England” bias in this way was important since FBTs in this region tended to be rather smaller than those in many other parts of the country1. Table 2.1 Weighting factors
Government Office Region
University of Plymouth/ RICS
MAFF Annual Survey of Tenanted Land
Weighting factor
Number % Number %
North-east 33 4.5 38 6.8 1.51
North-west 43 5.8 44 7.9 1.36
Yorks/Humberside
74 10.0 44 7.9 0.79
East Midlands 103 13.9 91 16.3 1.17
West Midlands 60 8.1 63 11.3 1.40
South-west 203 27.5 79 14.1 0.52
Eastern 75 10.1 73 13.1 1.30
South-east 149 20.1 127 22.7 1.13
England 740 100.0 559 100.0
2.6 The other main source of secondary data used in this study was the MAFF Farm Business Survey (MAFF 1996). This was used to explore the relationship between farm tenure and annual investment prior to the 1995 Act reported in chapter 6. The FBS dataset contains information on farm investment in a variety of items (including buildings, machinery and farm improvements). Since it was possible that investment decisions might have been influenced by expectations about the coming tenure reform in the years immediately prior to the 1995 Act, it was decided to focus on investment patterns in 1990, the year in which the Government first announced its review of the
1 Indeed, the FBTs covered in the 1996 University of Plymouth/RICS survey tended to be rather smaller (41 ha) than those covered in other surveys conducted at the same time (CAAV 45 ha; CLA private landowners 48 ha; ASTL 56 ha) and this should be borne in mind when considering the findings reported in the following chapters.

13
legislation. In order to remove some of the annual variability in investment, information was obtained for an identical sample of 1,927 farms covered in the three years 1989, 1990 and 1991. These farms comprise a sample of the range of farm-sizes and enterprise types found in England and Wales. Using appropriate weighting factors it is possible to aggregate them up to provide estimates of national totals. However, since the main objective of this study was to examine and test for differences between different types of farm tenure (eg. those wholly owner-occupied as against those wholly tenanted) such weighting was not necessary for much of this analysis. The collection of primary data 2.7 Primary data was collected from four main sources - the replication of the 1996 University of Plymouth/RICS postal survey among all County Land Agents in England and Wales and its extension to all Principal Rural Practice Surveyors in Wales; a panel of experts; telephone surveys and a series of focus groups. The additional data was required not only to fill the gaps in the secondary data available, but to provide the full range of information required by the project brief - for example, to explore the levels awareness and understanding of the 1995 Act, to gather views on the perceived benefits and disadvantages of the new tenure arrangements, to identify perceived constraints on the uptake of FBTs and to explore some detailed areas of agreements not covered in the postal survey. The postal surveys 2.8 In order to gather information about “County Council Smallholdings” a replicate of the questionnaire used in the 1996 University of Plymouth/RICS survey was sent to all relevant Local Authorities in England an Wales (see Appendix 3). This was followed up with two reminders to non-respondents. A total of 38 counties were contacted in England and the 22 new County Borough Councils in Wales. In England, one county (Avon) has now ceased to exist; 33 of the remainder (i.e. 89 per cent) replied to our survey. Seventeen County Councils had issued a total of 120 FBTs in the first year of the new legislation. In Wales a response rate of 73 per cent was achieved. Six of the 16 councils had granted a total of 26 FBTs. Chapters 3 and 4 present the main findings from the analysis of the these 146 FBTs granted in the year following the 1995 Act. 2.9 A total of 73 questionnaires were sent to all those Principal Rural Practice Surveyors in Wales who had not been selected for the 1996 survey. Two were returned “gone away” and, after two reminders, 32 completed questionnaires were received, representing a response rate of 45 per cent. Seven respondents had been involved with issuing 23 FBTs in the year after the 1995 Act. The details of these FBTs were analysed together with those (14) returned in the 1996 survey to yield the results presented in chapters 3 and 4. The “Panel of Experts”

14
2.10 As well as providing some information in its own right (e.g. views on meaningful and measurable indicators to establish whether the policy objectives of the 1995 Act are being met), a primary role of the “Panel of Experts” was to help with the validation of the questionnaires used in the telephone surveys. Meeting on 25 April 1997 at Seale Hayne the Panel comprised: · Jenny Bashford, NFYFC, Stoneleigh · Mike Ellingham, NFU, Exeter · Oliver Harwood, CLA, London · Paul Joseland, Bruton Knowles, Chairman CAAV Land Committee, Wolverhampton · Peter Parris, Farmer, Taunton · Sir Philip Williams, Landowner, Dorchester 2.11 During the morning session an informed debate amongst the Panel contributed substantially to the draft telephone questionnaire which was subsequently submitted to MAFF for approval. The afternoon session was also most informative with all members contributing to a wide ranging discussion both of FBT s, the economic and legislative background against which they have been introduced and possible indicators by which the success of the legislation might be measured. 2.12 In addition to members of the panel meeting at Seale-Hayne, feedback was also sought from a number of corresponding members who were unable to attend the meeting but contributed to all elements of the debate.The corresponding members were: · George Dunn, TFA, Theale · John Pugsley, Farmer and Member of Prince s Council, Dulverton · Professor Christopher Rodgers, Centre for Law in Rural Areas, University of Wales, Aberystwyth · John Young, National Trust, Cirencester The Telephone Surveys 2.13 In collecting additional primary data for this study a telephone survey was used to ensure that the required numbers of responses was achieved and to enable spontaneous answers to questions on awareness of FBTs which would be more reliable than those from a postal survey. The questionnaire (see Appendix 4) was developed with the assistance of MAFF and the Panel of Experts with three main objectives: • to investigate the awareness of FBTs among those in the industry; • to establish whether the industry has an adequate understanding of the legislation; • to identify any perceived problems with or limitations of the new Act. 2.14 The questionnaire was first pre-tested and then piloted with approximately 50 respondents covering the full range of the survey population. Appropriate amendments were then made as a result of this.

15
2.15 For both the telephone surveys and the focus groups we sought to achieve an adequate coverage of the main “actors” involved (or potentially involved) in FBTs namely landowners, tenants and professional advisers. Among the landowners we tried to ensure coverage of owner-occupying farmers who might rent out some land on FBTs as well as what might be termed “Professional Landlords” such as the Crown, the Church Commissioners, the National Trust and the larger private landowners. Since one of the objectives of the study was to gather information on the constraints facing the uptake of FBTs it was important to include some respondents who were not presently involved in FBTs as well as some who were. In this context, it will be recognised that the categories “tenant” and “landowner” are not mutually exclusive since an owner occupying farmer may now, or at some stage in the future, rent (or lease) land under an FBT. 2.16 Table 2.2 (overleaf) shows our target samples, the sampling frame from which they were drawn and the final number of respondents to the telephone survey. 2.17 A number of points need to be made about the different samples. The “Professional Landlords” comprised four main groups, viz. • private landlords owning more than 10 hectares but less than 400 hectares; • private landlords owning between 400-2000 hectares; • private landlords owning more than 2000 hectares;
• non-private landlords including the Crown, the Church Commissioners, the Royal Duchies, the National Trust, the Financial Institutions, the Water Companies, the National Park Authorities, the County Farms Estates and the Oxford and Cambridge Colleges.
Names and addresses of the private landlords were sought from the Country Landowners Association. While the CLA were not prepared to release a list of their members they did agree to write to a randomly-selected sample in support of the research project and any members willing to take part in the survey were invited to return a pre-paid card with their contact details direct to the research team at the University of Plymouth. A total of 351 letters were sent out by the CLA, 120 from each of the first two categories listed above and all 111 members in the third category. In addition to this, the letter and card were sent to all Institutional CLA members. A reminder letter was sent by the CLA three weeks after the initial posting. Table 2.2 Telephone surveys - the sample
Category of respondent Target sample
Number of respondents
Sampling frame
“Professional landlords”
150
133
Country Landowners Association (CLA)
Owner-occupiers 150 MAFF (Census Branch)
16
317
Tenants 150 MAFF (Census Branch)
Rural Practice Chartered Surveyors
45 47 Royal Institution of Chartered Surveyors
Solicitors 45 42 Agricultural Law Association
Agricultural Consultants 45 48 British Institute of Agricultural Consultants
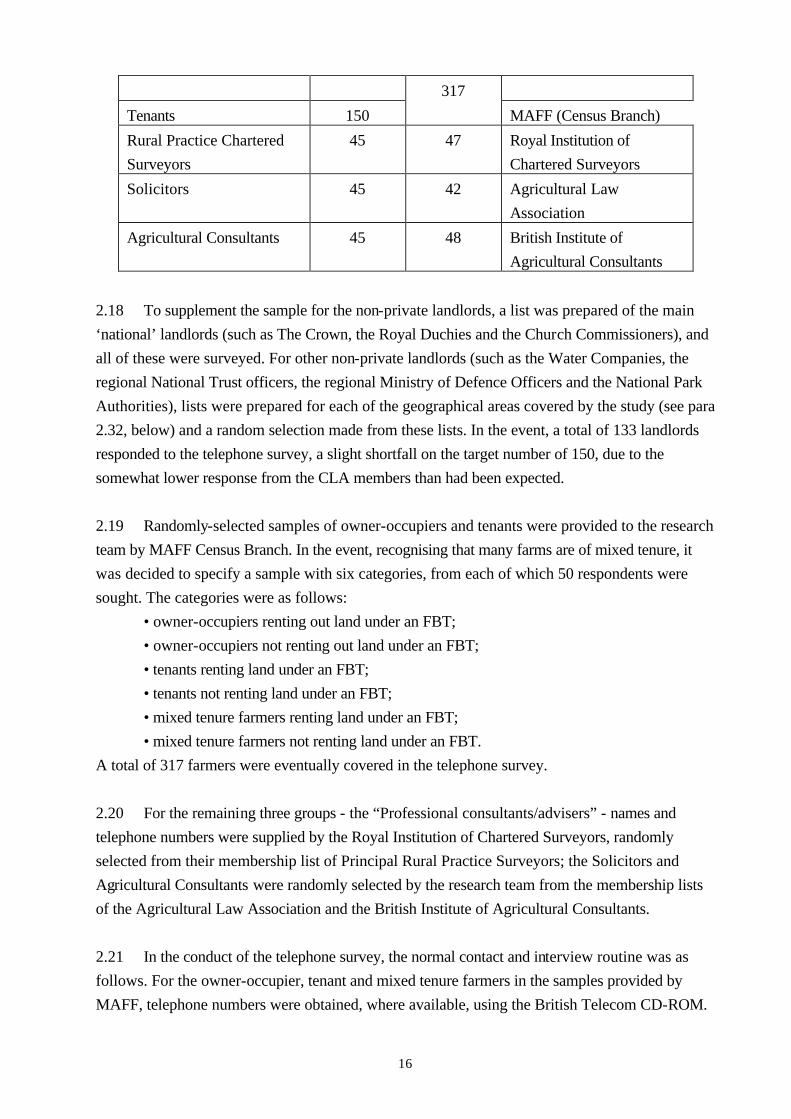
2.18 To supplement the sample for the non-private landlords, a list was prepared of the main ‘national’ landlords (such as The Crown, the Royal Duchies and the Church Commissioners), and all of these were surveyed. For other non-private landlords (such as the Water Companies, the regional National Trust officers, the regional Ministry of Defence Officers and the National Park Authorities), lists were prepared for each of the geographical areas covered by the study (see para 2.32, below) and a random selection made from these lists. In the event, a total of 133 landlords responded to the telephone survey, a slight shortfall on the target number of 150, due to the somewhat lower response from the CLA members than had been expected. 2.19 Randomly-selected samples of owner-occupiers and tenants were provided to the research team by MAFF Census Branch. In the event, recognising that many farms are of mixed tenure, it was decided to specify a sample with six categories, from each of which 50 respondents were sought. The categories were as follows: • owner-occupiers renting out land under an FBT; • owner-occupiers not renting out land under an FBT; • tenants renting land under an FBT; • tenants not renting land under an FBT; • mixed tenure farmers renting land under an FBT; • mixed tenure farmers not renting land under an FBT. A total of 317 farmers were eventually covered in the telephone survey. 2.20 For the remaining three groups - the “Professional consultants/advisers” - names and telephone numbers were supplied by the Royal Institution of Chartered Surveyors, randomly selected from their membership list of Principal Rural Practice Surveyors; the Solicitors and Agricultural Consultants were randomly selected by the research team from the membership lists of the Agricultural Law Association and the British Institute of Agricultural Consultants. 2.21 In the conduct of the telephone survey, the normal contact and interview routine was as follows. For the owner-occupier, tenant and mixed tenure farmers in the samples provided by MAFF, telephone numbers were obtained, where available, using the British Telecom CD-ROM.

17
Recognising the need for replacements, roughly twice the required number of names and addresses had been provided. Alternate numbers on the list were therefore phoned three times and if there was still no reply, the next number on the list was used. Refusals were noted as was interest in the Focus groups. It should also be noted that where the interviewer was not able to speak to the person on the list they were instructed to ask, “Are you one of the principal farmers or a partner working in the farming business ?”. The interviewer was instructed to proceed only if the answer to this question was “yes”. 2.22 For the landlords, the majority of names were obtained as a result of the postal request card sent with the assistance of the CLA in the manner described above. Except for those members who were clearly farming all their land in hand (and who therefore fell into the category of respondents for whom MAFF had already provided a sample), all the CLA members returning cards were contacted. Separate lists were also prepared of national landlords and non private landlords and all these were contacted where available. 2.23 For the “Professional consultants/advisers”, the same approach was used as that for the farmers with names selected at pre-specified intervals from the master-list and the immediately adjacent name taken as a replacement in the event of a refusal or failure to contact after three calls. 2.24 Table 2.3 shows the response rate details for the telephone survey. In the case of the landlords, we eventually interviewed all of the CLA members sending us contact details (who comprised 17% of those contacted on our behalf by the CLA). Table 2.3 The telephone survey: response rates
Failed to make contact
Interview refused Interview completed
Farmers 26% 16% 58%
Agents 17% 3% 80%
Consultants 25% 4% 71%
Solicitors 42% 10% 48%
2.25 In order to ensure consistency of approach to the questioning, a detailed instruction sheet was issued to each interviewer (see Appendix 4). This was particularly important in exploring the awareness, knowledge and understanding of the new tenure arrangements. The instruction sheet clearly indicated which questions required prompts and the appropriate method of prompting. The Focus Groups

18
2.26 The main purpose of the focus groups was to achieve greater depth of understanding of the perceived constraints on the uptake of FBTs and the perceived impact of the 1995 Act. The focus groups also provided the opportunity to explore “industry” views on the criteria for judging the relative economic efficiency of FBTs with a wider range of participants than those forming our Panel of Experts (para 2.10). 2.27 Focus groups were held on a national basis in four different locations - Exeter, Arundel, York and Builth Wells. At each venue three separate focus groups were held for tenants, landowners and advisers, respectively, each meeting lasting for approximately two hours. Altogether, 27 landlords/owner-occupiers, 18 tenants and 21 advisers attended the meetings. A written record of the discussion was kept and, with the consent of the participants, the meetings were tape recorded. 2.28 A facilitator from the research team opened the meetings by outlining the aims and objectives of the research and indicating some initial findings from the telephone survey. A number of areas were then highlighted for possible discussion. The facilitator then took a ‘back seat’ as the debate developed among the participants, intervening merely to clarify points, ensure that everyone around the table had an opportunity to express their point of view and move the discussion on so that sufficient ground was covered. 2.29 The original intention was for focus group participants to be drawn from the telephone survey (respondents were routinely asked whether they would be willing to take part in their local focus group meeting). In the event, it soon became apparent that this would not be a successful strategy as, first, the number of respondents interested in the focus groups was low and, second, those that indicated that they would be interested in attending the meeting did not always attend (despite being sent a letter of confirmation following the telephone survey). It was clear that this was a particularly busy time of the year for the landlords and advisers as well as the farmers, with first an election and then a Budget imminent. 2.30 In the case of the focus groups for the tenants and mixed tenure farmers, other farmers used in the pilot survey or from the MAFF lists were first contacted but with little success. It was therefore necessary in the case of all venues to contact the local offices of the NFU to seek assistance in providing names of those who could be contacted to attend. 2.31 As for the landlords, participants did come largely from those contacted in the telephone survey except for the South West and the Sussex groups where further lists had to be drawn up and used. All the “Professional consultants/advisers” attending the focus groups were drawn from the telephone survey or the pilot.

19
Geographical distribution of respondents 2.32 To some extent, the problems encountered in attracting participants to the focus groups had been anticipated and an early decision taken to base both the telephone interviews and the focus groups on clusters of counties surrounding the focus group venues. These venues are listed below with the relevant cluster of counties used for the telephone survey. The number in brackets indicates the total number of telephone survey respondents from each cluster. Cluster 1 Focus Group Location: Exeter Counties: Cornwall, Devon, Somerset and Dorset (98) Cluster 2 Focus Group Location: Arundel Counties: East Sussex, West Sussex and Hampshire (95) Cluster 3 Focus Group Location: York Counties: North Yorkshire (North Allerton), North Yorkshire (Beverley), South
Yorkshire, West Yorkshire and Lancashire (107) Cluster 4 Focus Group Location: Builth Wells Counties: All Welsh counties (99) 2.33 In order to ensure a reasonable spread of geographical coverage for the telephone survey two other clusters of counties were also selected, namely: Cluster 5 Counties: Leicestershire, Northamptonshire and Warwickshire (85) Cluster 6 Counties: Norfolk and Suffolk (83) 2.34 As already mentioned, in addition to the above, 20 national landlords were covered in the telephone survey, resulting in a final respondent number of 587. Conclusion 2.35 In designing and selecting the sample for the telephone surveys and focus groups the prime concern was to ensure adequate coverage of the main groups of “actors” concerned with farm tenure and FBTs. This necessitated the use of a variety of different sampling frames and sampling procedures. In contrast to the postal surveys the approach used means that it is not possible to “gross-up” the results in any formal way. However, the approach has enabled us to ascertain the knowledge, understanding and views of the 1995 Act among a wide range of opinion across the industry. Moreover, this has been done in a systematic fashion which makes it possible to compare the different sub-groups and to test these differences with a good degree of statistical rigour.

21
CHAPTER 3 THE EXTENT AND NATURE OF THE UPTAKE OF FARM BUSINESS TENANCIES
Introduction 3.1 This chapter draws on the various sources of primary and secondary data described in the previous chapter to assess the extent and nature of the uptake of FBTs. It covers three main topics, viz. • The number, size, location and farm-type of FBTs let in the first year since the Act; • The future intentions of present and potential landlords and tenants regarding FBTs; • The main characteristics of FBTs let in the first year since the Act.
One year on: The size of the "FBT sector" 3.2 Table 3.1 brings together the information from the reweighted data from the University of Plymouth/RICS sample survey of 1996, the “top-up” survey of Welsh Principal Rural Practice Surveyors and the census of County Councils in England and Wales (both conducted in 1997 but looking retrospectively to the first year of the new Act). It shows the “raw” results for the 926 FBTs in England and Wales on which we now have details and upon which the subsequent analysis in this report is based. It also indicates the sampling fraction and response rates. These yield two different estimates of the total coverage of FBTs in the year from September 1995. The more conservative Estimate A assumes that non-respondents to our surveys had no involvement with FBTs while Estimate B assumes that the non-respondents had exactly the same involvement with FBTs as those who did respond to the surveys1. 3.3 In considering which estimate comes closest to the actual uptake of FBTs a number of additional points need to be taken into account. In the first place our postal surveys took no account of land let with the advice of solicitors or in so-called “farmer-to-farmer lets” where chartered surveyors were not involved. Secondly, questionnaires were only sent to Principal Rural Practice Surveyors. Some FBTs may have been let with the assistance of chartered surveyors working in offices without a Principal Rural Practice Surveyor. On balance, we therefore judge that the actual uptake of FBTs in the first year of the 1995 Agricultural Tenancies Act is likely to have been closest to Estimate B, suggesting that about 5,000 FBTs were created, covering about 200,000 hectares. However, it should be noted that this estimate is significantly lower than the total of 294,900 hectares under FBTs recorded in England and Wales in the June 1996 Agricultural Census. The main reason for this difference is likely to be the fact that our own surveys deliberately excluded “FBTs used in conjunction with milk quota sales and other atypical 1 In presenting aggregate results from these surveys for England and Wales it has been necessary to combine data from surveys with differing sampling fractions and response rates. Throughout this report, where tables derived from these surveys refer to England and Wales, they show the “grossed up” results from the different surveys using the same procedure as that used to derive Estimate B.

22
FBTs used for other quota arrangements (eg sugar beet quota use)”, and “FBTs of less than 12 months granted as replacements for grazing licences other than where a periodic FBT is being used as a vehicle to create a longer-term letting” (see questionnaire at Appendix 3). It may also reflect some unfamiliarity with the new question in the June Census and the fact that some FBTs take the form of “farmer-to-farmer” lets or are let from offices without a Principal Rural Practice Surveyor. Table 3.1 Number and area of FBTs in England and Wales let in the period September 1995
to July/August 1996.
Country Source of estimate Estimate Sampling
fraction
Estimate A Response
Rate
Estimate B
England University of Plymouth/
RICS survey 1996
743 FBTs*
30,381 ha
26% 2,902 FBTs
118,676 ha
62% 4,708 FBTs
192,409 ha
England County Councils Survey
1997
120 FBTs
3,069 ha
100% 120 FBTs
3,069 ha
89% 134 FBTs
3,438 ha
England Total 863 FBTs 3,022 FBTs
121,745 ha
4,842 FBTs
195,847 ha
Wales Augmented University of
Plymouth/RICS survey
1996 and 1997
37 FBTs
2,086 ha
100% 37 FBTs
2,086 ha
45% 80 FBTs
4,561 ha
Wales Local Authorities survey
1997
26 FBTs
521 ha
100% 26 FBTs
521 ha
73% 36 FBTs
713 ha
Wales Total 63 FBTs 63 FBTs
2,607 ha
116 FBTs
5,275ha
England and
Wales
Total 926 FBTs 3,085 FBTs
124,352 ha
4,958 FBTs
201,122 ha
* the slight difference between this figure and the 740 observations noted in table 2.1 is caused by weighting procedure in which
fractional holdings are rounded up. 3.4 The table suggests that there was a substantial uptake of FBTs in the year after the 1995 Act. Even the very conservative Estimate A represents nearly 3.8 per cent of the total rented farmland area of England recorded in the June 1996 MAFF Census. However, it should be borne in mind that this period will have included a post-legislation “surge” among landowners who had held back on lettings in the run-up to the 1995 Act in order to see what it contained.

23
3.5 These estimates may be compared with the findings of the 1996 CAAV Tenanted Farm Survey (CAAV 1997) which referred to the period November 1995 to October 1996 and also covered England and Wales. It reported a total of 3,585 new FBTs covering 97,489 hectares (CAAV 1997: 1.1). Our own surveys broadly endorse this result, taking into account that the CAAV survey covers a slightly different time-period from our own. However, our own work suggests a rather larger average size of FBT - about 40 hectares compared with the 28 hectares reported by the CAAV (CAAV 1997: 6.2). Regional variation Table 3.2 Size of the “FBT Sector”: EU Regions (Estimate B)
Number of FBTs
Total land covered by FBTs (ha)
Mean size of FBTs
(ha)
Total rented area (ha)
FBT area as % total
rented area*
England: North 1,069 34,128 31.9 1,049,922 3.3
England: East 2,497 120,490 48.3 1,339,960 9.0
England: West 1,276 41,230 32.3 820,838 5.0
Wales 116 5,275 45.5 337,526 1.6
Total 4,958 201,122 40.6 3,548,245 5.7 * as reported in the June 1996 Agricultural Census (PSM statements) Table 3.3 Size of the “FBT Sector”: England: Government Office Regions (Estimate B) Number of
FBTs Total land covered by FBTs (ha)
Mean size of FBTs
(ha)
Total rented area (ha)
FBT area as % total
rented area*
North-East 317 6,260 19.8 288,160 2.2
North-West 371 11,935 32.2 338,208 3.5 Yorkshire and Humberside
381 15,932 41.8 423,554 3.8
East Midlands 788 35,600 45.2 465,238 7.7
West Midlands 564 23,031 40.9 281,526 8.2
Eastern 622 37,394 60.1 486,661 7.7
South-East 1,087 47,497 43.7 388,061 12.2
South-West 713 18,199 25.5 539,312 3.4
Total 4,842 195,847 40.5 3,210,719 6.1 * as reported in the June 1996 Agricultural Census (PSM statements) 3.6 The surveys showed some variation in the uptake of FBTs in different parts of the country. Tables 3.2 and 3.3 use the same procedure as described above to provide estimates of the amount

24
of land let under FBTs in the main regions of England and Wales in the first year after the 1995 Act. It will be seen that FBTs are much more prevalent in the East of England and the Midlands, where they also tend to be larger than elsewhere. While these results are broadly consistent with those from the June 1996 MAFF Agricultural Census which also shows that the proportion of land under FBTs is lowest in the North of England and in Wales, there is a difference where the West of England is concerned. The June Census suggests that FBTs here form a larger proportion of rented land than they do in the East of England. While our own analysis confirms that the uptake of FBTs has been relatively high in the West Midlands, the University of Plymouth/RICS survey suggests that it has been significantly lower in the South-West Government Office Region, leaving the East England EU region with the highest proportion of rented land under FBTs. It is possible that the inclusion of “milk quota” FBTs in the MAFF June Census (see para 3.3) accounts for this difference between the two sets of results and that this tends to inflate the number of FBTs reported in the June Census by farmers in the South-West of England. Table 3.4 Regional variation in the uptake of FBTs
Date FBT granted
Government Office Region
First 6 months
(%)
Later (%)
Total (%)
North-East 24.2 75.8 100.0
North-West 55.8 44.2 100.0
Yorkshire and Humberside
85.4 14.6 100.0
East Midlands 72.1 27.9 100.0
West Midlands 78.0 22.0 100.0
Eastern 66.5 33.5 100.0
South-East 71.3 28.7 100.0
South-West 76.5 23.5 100.0
Total England 69.1 30.9 100.0
Wales 67.5 32.5 100.0
Total England and Wales
69.1 30.9 100.0
3.7 Our surveys suggest that the rate of uptake varied between different parts of the country, perhaps reflecting different farming conditions, prevailing attitudes to, or knowledge and understanding of, FBTs (a point to which we return in Chapter 5 of this report). Table 3.4 shows the proportion of FBTs reported in our surveys from each of the Government Office Regions of

25
England and Wales. It distinguishes those created in the first 6 months after the legislation (up to and including March 1996) and those created in the following months. It appears that the North-east and North-west were rather later off the mark than the other regions (the differences being statistically significant at the 5% level). 3.8 Participants in the focus groups felt that farm location and the farming systems available was an undoubted factor in determining the extent and nature of the uptake of FBTs. Arable farmers in major arable areas clearly viewed FBTs as a significant advance in allowing flexible management structures and opportunities for expansion. The considerations of livestock farmers who are looking for greater continuity, housing close to the farmstead and perhaps greater investment in fixed equipment were not being so well served by the system. It was mooted that the current short-termism of FBTs was a significantly greater problem in livestock areas. Future prospects 3.9 We have commented on the size of the initial interest in FBTs, but what of the future? In the telephone surveys landowners were asked whether the introduction of FBTs was having any effect on the amount of land they expected to let in the future. Their responses are reported in table 3.5. Over half (59 per cent; 61 per cent in Wales) indicated that it was not - they expected to let the same amount of land in the future as they were at present. As this question was asked of owner-occupiers as well as landlords it is perhaps not surprising that 77 per cent of those who said that the amount of land let would remain ‘the same’, and gave a reason, said that all their land was let anyway, implying that this would be in existing tenancies for some time to come. The remaining respondents indicated that they were farming in-hand or were not in the business of letting land. 3.10 About a third of respondents (32 per cent; 29 per cent in Wales) said that they would let more land in the future and were encouraged by the ability to let land ‘safely’ i.e. with less security of tenure, the higher level of rents and the improved tax situation. 3.11 Only 8 per cent said that they would let less land, 40 per cent of whom said they would farm it in hand and 53 per cent who said they wished to sell the land when it became vacant. Table 3.5 Landowners’ intentions concerning the introduction of FBTs and the amount of land
that they will let in the future
England and Wales (N=188) %
England (N=157) %
Wales (N=31) %

26
More 32 32 29
Same 59 59 61
Less 8 8 6
Don’t Know 1 1 3
Source: Telephone Survey 3.12 The results indicate that although there is now probably greater motivation to let, the practical realities are clear and it will be some time, in many cases, before these intentions can be put into practice as so much land is currently tied up in existing 1986 Act tenancies. Table 3.6 Landowners’ intentions concerning investment in further agricultural land with a
view to letting it under a FBT
England and Wales
(N=186) %
England
(N=155) %
Wales
(N=31) %
Yes 40 39 45
Possibly 6 7 0
No 46 48 35
Not Applicable
8
6
19
Source: Telephone Survey 3.13 The telephone surveys suggest that there are landowners prepared to consider investing in further agricultural land for letting under FBTs. Table 3.6 shows that as many as 40 per cent of the landlords and owner-occupier farmers we contacted said that they would consider investing in more agricultural land for letting under an FBT. Of these, 16 per cent were owner-occupier farmers who were presently letting land out under FBTs, 26 per cent were large private landlords (owning more than 2,000 hectares) and 41 per cent were the non-private/Institutional landlords. 3.14 The tenant and mixed tenure farmers contacted in our survey were asked if they were presently seeking to expand their farming business by renting extra land under an FBT and if they would be seeking to expand their businesses in this way in the future . Their answers are reported in table 3.7. Most (80 per cent) of positive present intentions and 71 per cent of the positive future intentions came from tenants and mixed tenure farmers currently renting land in

27
under an FBT. This may indicate their greater familiarity with FBTs and/or a greater tendency for these respondents to be seeking to expand their business anyway. Table 3.7 Farmers’ intentions concerning expansion of their businesses by renting extra land
under a FBT
At present England
and Wales (N=146)
%
At present England
(N=122)
%
At present Wales
(N=24)
%
In the future
England and Wales (N=143)
%
In the future
England
(N=120) %
In the future Wales
(N=23)
%
Yes 34 34 29 61 64 43
Uncertain 8 10 0 17 18 17
No 58 56 71 22 18 39
Source: Telephone Survey
3.15 The reasons given for the ‘no’ or ‘uncertain’ responses regarding present expansion intentions largely centred around respondents having enough land to manage at present (32 per cent; 47 per cent in Wales) or the lack of opportunity/land available (26 per cent). Other respondents talked of lack of availability of funds (9 per cent), their age (12 per cent) and high rents (5 per cent). 3.16 The range of reasons given concerning future intentions was greater and 22 per cent noted that they would be interested if suitable land became available. Of the overall responses, 9 per cent said that they preferred to buy land and 16 per cent were uncertain about the future. 3.17 The results confirm the continuing high demand for tenanted land and the increased activity over the past two years or so. The lower figures for Wales are possibly due to the greater propensity for owner-occupation in Wales and the lower proportion of arable land in the Principality (a point to which we shall return later in this report).
The characteristics of FBTs 3.18 Unless otherwise stated, the data presented in the remainder of this chapter are drawn from the University of Plymouth/RICS survey, augmented by our supplementary census in Wales. Data for farms owned by County Councils or other Local Authorities are shown separately.

28
Size in hectares 3.19 Figure 3.1 and table 3.8 show the size distribution of FBTs in England and in Wales from the reweighted and supplemented University of Plymouth/RICS survey data. Clearly, many FBTs are very small indeed, and would not in themselves provide a viable holding. The findings suggest that most of the FBTs created in the first year of the operation of the 1995 Act provided marginal additions to existing holdings. This was confirmed by further analysis of the data which suggests that 91 per cent of these FBT tenants already farmed some other land and for over two-thirds of them the FBT involved an expansion of less than 25 per cent in the land they farmed. Figure 3.1a Size distribution of FBTs: England
Size in hectares
0
200
400
600
800
1000
1200
Les
s th
an 5
5<10
10<2
5
25<5
0
50<1
00
100
<200
200
or m
ore
Table 3.8a Size distribution of FBTs: England
Size group (ha) Number Proportion (%)
Cumulative %
<5 957 20.3 20.3
5<10 668 14.1 34.5
10<25 1,188 25.3 59.7

29
25<50 900 19.1 78.9
50<100 607 12.9 91.8
100<200 254 5.4 97.2
=200 133 2.8 100.0
Total 4,708 100.0

30
Figure 3.1b Size distribution of FBTs: Wales
Size in hectares
0
2
4
6
8
10
12
14
16
18
Les
s th
an 5
5<10
10<2
5
25<5
0
50<1
00
100
<200
200
or m
ore
Table 3.8b Size distribution of FBTs: Wales
Size group (ha) Number Proportion (%)
Cumulative %
<5 7 8.4 8.4
5<10 16 19.4 27.8
10<25 18 22.2 50.0
25<50 11 13.9 63.9
50<100 16 19.4 83.3
100<200 9 11.1 94.4
=200 4 5.6 100.0
Total 80 100.0

31
Figure 3.1c Size distribution of FBTs: England and Wales
Size in hectares
0
200
400
600
800
1000
1200
1400
Les
s th
an 5
5<10
10<2
5
25<5
0
50<1
00
100
<200
200
or m
ore
Table 3.8c Size distribution of FBTs: England & Wales
Size group (ha) Number Proportion (%)
Cumulative %
<5 964 20.1 20.1
5<10 684 14.3 34.4
10<25 1,206 25.2 59.6
25<50 912 19.0 78.6
50<100 623 13.0 91.6
100<200 263 5.5 97.1
=200 137 2.9 100.0
Total 4,788 100.0

32
3.20 Further analysis showed that FBTs tended to be larger in the Eastern Region (mean=48.5 ha; median=21.7 ha) compared with the North (32.2; 15.0 ha) or the West (33.0; 16.2 ha). However, as already reported, the small number of FBTs in Wales tended to be somewhat larger than this (mean=57.1 ha; median=24.9 ha). County Farms 3.21 The survey found that while the County Councils accounted for only a very small proportion of the FBT lettings in England (3 per cent) and an even smaller proportion of the area let (2 per cent) they were much more significant in Wales where they accounted for 31 per cent of the lettings and 14 per cent of the area let. This largely reflects the predominance of owner-occupation in Welsh farming. Table 3.9 Size distribution of FBTs: County Farms - England and Wales
Size group (ha) Number Proportion (%)
Cumulative %
England:
< 5 38 28.3 28.3
5<10 12 9.2 37.5
10<25 41 30.8 68.3
25<50 35 25.8 94.2
50<100 7 5.0 99.2
100<200 0 0.0 99.2
=200 1 0.8 100.0
Total 134 100.0
Wales:
<5 5 15.4 15.4
5<10 3 7.7 23.1
10<25 16 46.2 69.2
25<50 10 26.9 96.2
50<100 1 3.8 100.0
100<200
=200
Total 36 100.0

33
Figure 3.2a Size distribution of FBTs: County Farms - England
Size in hectares
0
5
10
15
20
25
30
35
40
45
Les
s th
an 5
5<10
10<2
5
25<5
0
50<1
00
100
<200
200
or m
ore
Figure 3.2b Size distribution of FBTs: County Farms - Wales
Size in hectares
0
2
4
6
8
10
12
14
16
Les
s th
an 5
5<10
10<2
5
25<5
0
50<1
00
100
<200
200
or m
ore

34
3.22 Figure 3.2 and table 3.9 show the size distribution of County Council FBTs. Once again, many of them are very small. Indeed, at a mean of 25.6 hectares in England and 20 hectares in Wales (median=16.6 and 19.3 respectively), they tend to be smaller than those reported by the Chartered Surveyors. However, further analysis showed, in this case, that they were much less likely to be contributing only to the marginal increase of existing holdings. While 70 per cent of the English tenants were already farming other land (50 per cent in Wales) the proportion of newcomers without any other land (30 per cent and 50 per cent in England and Wales respectively) was very much higher than the 9.2 per cent found in our survey of Chartered Surveyors. Moreover, for two-thirds of those already farming land the FBT at least doubled the amount of land they farmed. Such enlargements are of course consistent with the strategies followed by many County Land Agents in recent years. 3.23 Though the numbers are small, more detailed analysis showed that the County Council FBTs followed the same regional pattern at those reported in the University of Plymouth/RICS survey with FBTs in Eastern England being significantly larger than those elsewhere in the country. Types of FBT 3.24 Respondents to the postal surveys were asked to place the FBTs into one of three categories - “bare land”, “land and buildings” and “land/buildings/house”. Figure 3.3 and Table 3.10 show the distribution of the FBTs according to these three categories.

35
Figure 3.3a FBT Type: England
11%
7%
82%
Bare land Land/buildings Land/buildings/house
Table 3.10a FBT type England (N=7391)
Type
Number
Number
%
Total Area (ha)
Total Area
%
Mean size (ha)
Median size (ha)
% arable holdings
Bare land 3,809 81.3 (81.7)2
(77.2)3
94,719 49.3 (56.8)
24.9 (34.4)
13.9 42.4
Land and buildings
529 11.3 (9.8) (14.2)
49,883 26.0 (19.2)
94.2 (89.0)
48.6 36.0
Land/ buildings/ house
325 7.4 (8.5) (8.5)
47,537 24.7 (23.9)
137.7 (70.4)
78.5 21.5
1 in some cases respondents to the postal survey failed to answer particular questions; N refers to the total number of valid
answers upon which the table is based, in this case 739 (out of a total of 743).
2 numbers in brackets provide comparative data from the 1996 CAAV survey (CAAV 1997) which relates to England and
Wales. 3 numbers in bracketsprovide comparative data from the MAFF 1996 Annual Survey of Tenanted Land which also shows a
similar pattern.

36
Figure 3.3b FBT Type: Wales
20%
25%
55%
Bare land Land/buildings Land/buildings/house
Table 3.10b FBT type Wales (N=37)
Type
Number
Number
%
Total Area (ha)
Total area %
Mean
size (ha)
Median size (ha)
% arable holdings
Bare land 44 55.6
716 15.7 16.1 10.1 0.0
Land and buildings
16 19.4 814 17.8 52.4 30.4 0.0
Land /buildings /house
20 25.0 3,032 66.5 151.7 94.7 0.0

37
Figure 3.3b FBT Type: England and Wales
11%
8%
81%
Bare land Land/buildings Land/buildings/house
Table 3.10c FBT type England and Wales (N=776)
Type
Number
Number
%
Total Area (ha)
Total area %
Mean
size (ha)
Median size (ha)
% arable holdings
Bare land 3,853 80.9
95,435 48.5 24.8 13.8 41.9
Land and buildings
545 11.4 50,697 25.8 93.0 48.6 35.0
Land /buildings /house
365 7.7 50,568 25.7 138.5 90.3 20.2
3.25 It is clear that the vast majority of FBTs, covering a majority of the total area consist only of bare land. However, there are 54 holdings (9 in Wales) comprising 7 (25) per cent of FBTs and nearly 25 (67) per cent of the land which are potentially self-contained farm businesses comprising land buildings and farmhouse. The great majority of these were let by private landowners (as opposed to public utilities, institutions or the various parts of central government). County Farms

38
3.26 As Figure 3.4 shows, the picture is very different where farms let by the County Councils are concerned. The majority of the farms (50 per cent in England and 90 per cent in Wales) covering the great majority of the FBT land (83 per cent in England and 92 per cent in Wales) comprised a house as well as farm buildings and land. They did, however, tend to be considerably smaller than their counterparts from outside the Local Authority sector with a mean size of 42.8 hectares in England (24.1 in Wales) and a median of 27 hectares in England (21.1 in Wales). Figure 3.4a FBT Type: County Farms - England
7%
50%43%
Bare landLand/buildingsLand/buildings/house
Figure 3.4b FBT type: County Farms – Wales
0%
90%
10%
Bare landLand/buildingsLand/buildings/house
Type of enterprise

39
3.27 Table 3.10 (which again excludes the County Farms) shows that the majority of FBTs in England were livestock (38.5 per cent) or arable (40 per cent) while in Wales they were livestock (78 per cent) or mixed (19 per cent). Dairy farms were noticeable for their absence from FBTs. Table 3.11a Farm-type*: England (N=734)
Farm-type Number % Area (ha) %
Dairy 195 4.2 4,650 2.5
Livestock 1,790 38.5 42,227 22.6
Mixed 608 13.1 49,048 26.2
Arable 1,861 40.0 90,123 48.1
Horticulture 84 1.8 237 0.1
Other 112 2.4 916 0.5
* as categorised by respondents to the University of Plymouth/RICS survey Table 3.11b Farm-type: Wales (N=37)
Farm-type Number % Area (ha) %
Dairy 2 2.8 198 4.3
Livestock 62 77.8 3,036 66.6
Mixed 16 19.4 1,328 29.1
Table 3.11c Farm-type*: England and Wales (N=771)
Farm-type Number % Area (ha) %
Dairy 197 4.2 4,848 2.5
Livestock 1,853 39.2 45,262 23.6
Mixed 623 13.2 50,376 26.3
Arable 1,861 39.3 90,123 47.0
Horticulture 84 1.8 237 0.1
Other 112 2.4 916 0.5

40
3.28 Among the dairy and livestock FBTs, just over half the units in England (30 per cent in Wales) were previously let as grazing licences indicating that these are probably continuations of previous licences, granted for longer terms. In fact the mean length of term in these cases was 2 years 4 months (3 years 3 months in Wales). County farms 3.29 The FBTs let by the County Councils were again different from the others with respect to farm-type. As table 3.12 shows, a much higher proportion were dairy farms in both England and Wales. Table 3.12a Farm-type: County Farms - England (N=120)
Farm-type Number % Area (ha) %
Dairy 58 34.0 1,302 37.9
Livestock 36 21.1 289 8.4
Mixed 32 18.6 311 9.0
Arable 34 19.8 1,484 43.2
Horticulture 6 3.3 15 0.4
Other 6 3.3 38 1.1
Table 3.12b Farm-type: Wales - County Farms (N=26)
Farm-type Number % Area (ha) %
Dairy 10 26.9 253 35.4
Livestock 12 34.6 217 30.4
Mixed 14 38.5 244 34.2

41
Table 3.12c Farm-type: County Farms - England and Wales (N=146)
Farm-type Number % Area (ha) %
Dairy 48 35.8 1,555 37.5
Livestock 24 17.5 505 12.2
Mixed 18 13.3 554 13.3
Arable 34 25.0 1,484 35.8
Horticulture 6 4.2 14 0.3
Other 6 4.2 38 0.9
Characteristics of the FBT Agreements 3.30 Both the reanalysis of secondary data and the analysis of primary data (including that from the telephone surveys and the focus groups) threw some light on the characteristics of the FBTs let in the first year after September 1995. The following sections draw together the findings from these different analyses to present a “pen-portrait” of the agreements. Length of Term 3.31 Figure 3.5 and table 3.13 summarise the main findings of the postal survey, showing the length of term based on the 739 FBTs for which we have details in England and 36 in Wales. This confirms that many of the FBTs granted in this period were for relatively short periods of time. For example, in England 55 per cent were of two years or less while the comparable figure for Wales was 27.8 per cent2.
2 The mean length of FBTs in England as a whole estimated from The University of Plymouth/RICS survey (and including County Farms) was 3.6 years (Standard deviation = 4.1). This is comparable with the mean length of 4.1 years found in the 1996 CAAV Annual Teananted Farm Survey and 3.9 found in their 1995 two-month survey. It is somewhat shorter than the mean length of 4.5 years (standard deviation = 6.7) found in the 1996 MAFF Annual Survey of Tenanted Land. However, the difference may be explained by the somewhat higher proportion of bare land FBTs found in the University of Plymouth/RICS survey (see Table 3.10a)

42
Figure 3.5a Term of FBTs: England
Length of term (years)
0
200
400
600
800
1000
1200
< 1 1
>1<2
2
>2<5
5
>5<1
0 10 >10
Table 3.13a Term of FBTs: England (N=739)
Length of term Number Proportion (%)
Cumulative %
<1 year 294 6.3 6.3
1 year 849 18.1 24.4
>1<2 years 406 8.7 33.1
2 years 1,046 22.3 55.4
>2<5 years 825 17.6 73.0
5 years 774 16.5 89.5
>5<10 years 128 2.7 92.3
10 years 160 3.4 95.7
>10 years 202 4.3 100.0

43
Figure 3.5b Term of FBTs: Wales
Length of term (years)
0
5
10
15
20
25
< 1 1
>1<2
2
>2<5
5
>5<1
0 10 >10
Table 3.13b Term of FBTs: Wales (N=36)
Length of term Number Proportion (%)
Cumulative %
2 years 22 27.8 27.8
>2<5 years 16 19.4 47.2
5 years 22 27.8 75.0
>5<10 years 4 5.6 80.6
10 years 7 8.3 88.9
>10 years 9 11.1 100.0

44
Figure 3.5c Term of FBTs: England and Wales
Length of term (years)
0
200
400
600
800
1000
1200
< 1 1
>1<2
2
>2<5
5
>5<1
0 10 >10
Table 3.13c Term of FBTs: England and Wales (N=775)
Length of term Number Proportion (%)
Cumulative %
<1 year 294 6.2 6.2
1 year 849 17.8 24.0
>1<2 years 406 8.5 32.5
2 years 1,068 22.4 55.9
>2<5 years 840 17.6 72.6
5 years 796 16.7 89.3
>5<10 years 133 2.8 92.1
10 years 167 3.5 95.6
>10 years 210 4.4 100.0
3.32 Table 3.14 goes on to illustrate the considerable variation between different types of FBT by looking in more detail at the terms for different types of agreement, different types of farm and different types of preceding arrangement. This table (which is confined to English FBTs and is not grossed up) highlights the very wide variety of arrangements that have been made in the new agreements. It also illustrates how the Act has allowed the lengthening of term where bare land for arable use or grazing is concerned while shortening it for holdings previously let under an AHA 1986 Agreement.

45
Table 3.14 Variation in Term between FBTs let in England
Mean term Median term Shortest Longest
FBT type (N=735)*
Bare land 2 years 10 months
2 years 4 months 40 years
Land and buildings 4 years 3 months
3 years 6 months 20 years
Land/ buildings/ house 10 years 7 years 1 year 30 years
Farm-type (N=730)*
Dairy 5 years 2 months
2 years 11 months
10 months 25 years
Livestock 3 years 1 month
2 years 4 months 30 years
Mixed 5 years 9 months
3 years 3 months
8 months 40 years
Arable 3 years 1 month
2 years 4 months 30 years
Horticulture 3 years 9 month
2 years 1 year 9 years
Other 3 years 5 months
2 years 6 months 20 years
Previous use of land (N=732)*
Farmed “in hand” 4 years 6 months
2 years 4 months 20 years
Short-term agreement 3 years 2 years 6 months 40 years
AHA 1986 tenancy 6 years 5 months
3 years 6 months 30 years
Contract/ share farming
3 years 10 months
4 years 7 months
1 year 10 years
Grazing licence 2 years 4 months
2 years 4 months 10 years
Other 4 years 3 months
2 years 11 months 30 years
* the results contain some slight variation in the number of observations for which information on FBT type, farm-type or previous use of land was not provided

46
3.33 T-tests of the differences between the different types of situation showed some interesting results. Where the type of FBT was concerned the differences in mean term were all statistically significant at the 5% level. However, when variation according to farm-type was examined it was found that the mean terms of FBTs on “Dairy” and “Mixed” farms were statistically different (longer) than those for farms classified as “Arable” or “Livestock” but not significantly different from each other. Turning to the previous use of the land now in an FBT, the term for land previously farmed in hand and that farmed under an AHA 1986 tenancy was statistically different from all the other categories except land which had previously been the subject of a share or contract farming agreement. County Farms 3.34 Figure 3.6 and table 3.15 indicate the length of term of FBTs let by the County Councils. A number of points emerge. In the first place FBTs let by the County Councils are generally of longer term than those let in England and Wales as a whole. However, this tendency is largely associated with the fact that a higher proportion of these FBTs comprise land, buildings and a house; are livestock rather than arable farms; and follow on from an AHA 1986 Agreement - all characteristics which table 3.14 has shown are associated with longer term FBTs. Indeed, when the analysis was repeated, controlling for these factors, few substantial differences remained between the letting behaviour of County Councils and of other landowners where the term of the lease was concerned. Indeed, the average term of FBTs including a house as well as land and buildings was actually shorter among the County Council lets in England than it was among such FBTs let by other landlords (though the difference was not statistically significant at the 5% level). 3.35 The second point to note is that the County Councils are letting a significant proportion of their FBTs on a relatively short term. Thus 40 per cent of their FBTs in England were for less than 5 years. However, these did tend to be small (mean = 9 ha), largely representing marginal increments to the land of existing farmers (70 per cent was bare land only and over 95 per cent of the land went to existing farmers). In part these may represent additions to existing County Council smallholdings, continuing the long-established practice of increasing the size of such holdings; in part, they may be intended to keep the position of vacant possession flexible pending restructuring, development or sale opportunities as they arise. Indeed, subsequent analysis showed that nearly three-quarters of this land had previously been let on short-term agreements or grazing licences.
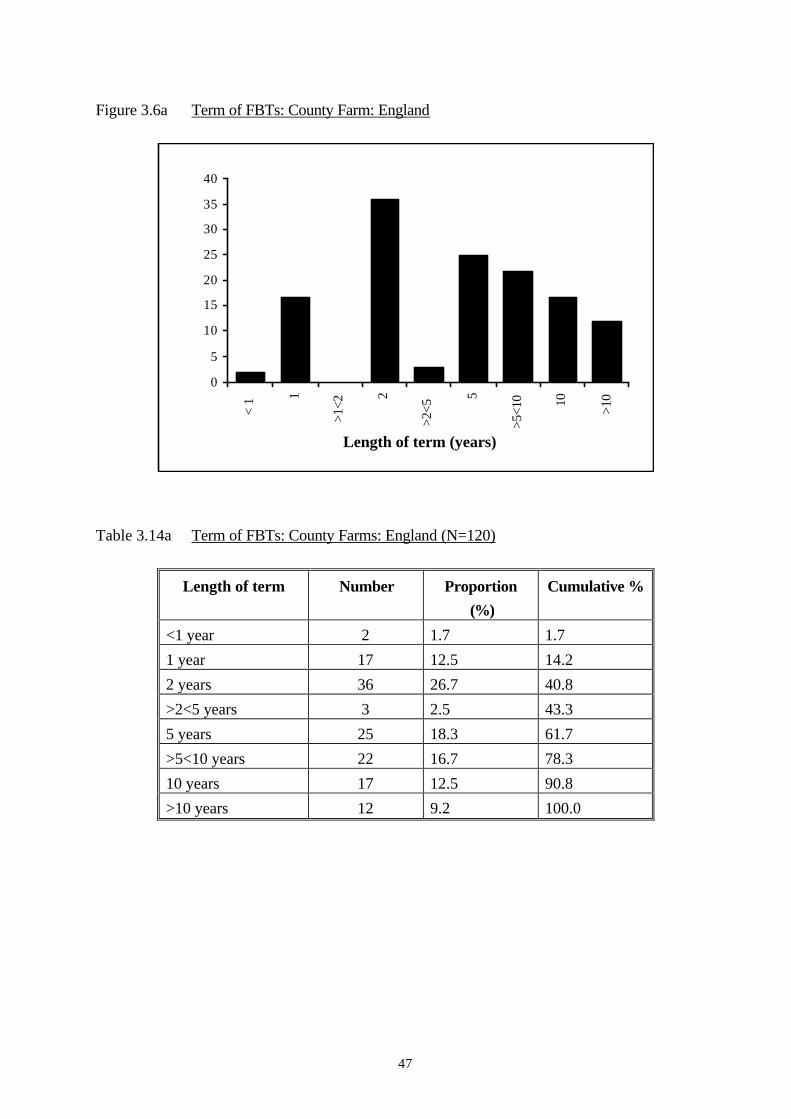
47
Figure 3.6a Term of FBTs: County Farm: England
Length of term (years)
0
5
10
15
20
25
30
35
40
< 1 1
>1<2
2
>2<5
5
>5<1
0 10 >10
Table 3.14a Term of FBTs: County Farms: England (N=120)
Length of term Number Proportion (%)
Cumulative %
<1 year 2 1.7 1.7
1 year 17 12.5 14.2
2 years 36 26.7 40.8
>2<5 years 3 2.5 43.3
5 years 25 18.3 61.7
>5<10 years 22 16.7 78.3
10 years 17 12.5 90.8
>10 years 12 9.2 100.0

48
Figure 3.6b Term of FBTs: County Farms: Wales
Length of term (years)
0
2
4
6
8
10
12
14
16
< 1 1
>1<2
2
>2<5
5
>5<1
0 10 >10
Table 3.14b Term of FBTs: Wales (N=25)
Length of term Number Proportion (%)
Cumulative %
>2<5 years 3 8.0 8.0
5 years 14 40.0 48.0
10 years 1 4.0 52.0
>10 years 16 48.0 100.0

49
Figure 3.6c Term of FBTs: England and Wales
Length of term (years)
0
5
10
15
20
25
30
35
40
< 1 1
>1<2
2
>2<5
5
>5<1
0 10 >10
Table 3.14c Term of FBTs: England and Wales (N=145)
Length of term Number Proportion (%)
Cumulative %
<1 year 2 1.3 1.3
1 year 17 10.0 11.3
2 years 36 21.3 32.5
>2<5 years 6 3.6 36.2
5 years 38 22.7 58.9
>5<10 years 22 13.3 72.2
10 years 18 10.8 82.9
>10 years 29 17.1 100.0
Break clauses 3.35 It is clear that with the predominance of the relatively short term being granted for FBTs, there is little need for break clauses, with only 18 per cent of the FBTs covered in our survey in England including such a clause (17 per cent in Wales). Where break clauses were used these were associated with the desire to retain flexibility for future development (15 per cent), to cater

50
for the tenant’s death or incapacity (8 per cent) or both (8 per cent) or to provide periodic opportunities to terminate the agreement (39 per cent). Of the latter, roughly a quarter were annual, half on a 3-yearly basis and the remaining quarter every 5 years.
FBT Agreement Details 3.36 An intended feature of FBT agreements is of course their variability. Not only the rent and term but a range of other clauses and conditions are all open to negotiation. In section 2 of our postal questionnaire, respondents were asked to provide further details of the agreements they had dealt with and this information throws some light on these issues. The results provided in this section of our report relate to FBT agreements in England and Wales outside the County Farms sector (i.e. those relating to 97 per cent of the FBTs let in the first year of the Act). In this case the findings are drawn from the University of Plymouth/RICS survey, re-weighted in the manner described in para 2.5 to avoid over-representation of agreements from the South-West of England. Respondents were asked to provide detailed information on three agreements which they had personally dealt with during the first year of the Act - “a short-term agreement that replaces what would have otherwise been a Gladstone v Bower agreement”, “an agreement for 2-5 years” and “a long-term agreement i.e. greater than 10 years”. This yielded a total of 204 agreements for analysis, divided as follows: • Short ‘Gladstone v Bower’ replacements 43 • 2-5 year agreements 130 • Greater than 10 years agreements 31 3.37 Over half (56 per cent) of the FBT agreements were based on the RICS model3, with 18 per cent based on in-house model agreements. Nearly three-quarters (74 per cent) were drafted by the Agents themselves with the balance mainly by solicitors (21 per cent). There was a great tendency for solicitors to be involved in drafting the longer term agreements.
Rent review provisions 3 The RICS have produced, along with their Guidance Notes on the Agricultural Tenancies Act 1995, three model FBT agreements to be used as a base for preparing individual agreements. At present these cover the: Fixed term FBT Fixed term FBT, 2 years or less, no dwelling house FBT from year to year. The RICS are currently revising these agreements and adding a periodic agreement of less than a year.The model agreements provide the appropriate level of flexibility by the use of schedules which can be adapted as agreed

51
3.38 37 per cent of rent review provisions were reported as being to open market levels, 26 per cent made express provision for no rent reviews and 33 per cent had no provision for rent reviews. A small number (2 per cent) provided for review by fixed increments at predetermined dates while a similar proportion provided for review by reference to an index. 3.39 As table 3.15 shows, just over half (53 per cent) of the FBTs that would have been Gladstone v Bower agreements before 1995 had no review provisions whereas 85 per cent of the long term agreements (10 years+) provided for review to open market levels, as might be expected. 3.40 As regards the rent review cycle, two-thirds (67 per cent) of the agreements made no provision for specific cycles. Of the total responses, 1 per cent provided expressly for a two-year cycle, 29 per cent for a three-year cycle and 3 per cent for a five-year cycle. Again, this is not surprising considering that the median term of the agreements was three years. 71 per cent of the longer-term agreements allowed for a review cycle of three years. Table 3.15 Provisions for rent review in sampled FBT agreements
Type of Agreement
Short ‘Gladstone v Bower’ replacements
2-5 year agreements
Greater than 10 year agreements
No provision 52.8 33.2 5.8
Provision for no rent reviews
26.5
30.0
Rent review to open market levels
20.7
31.8
84.3
Review based on index e.g. RPI
1.1
9.9
Fixed increment 3.9
Repair provisions 3.41 It is noticeable that the flexibility of the FBT and, no doubt, the shortage of tenancies, has resulted in more FBTs where the tenant is fully responsible for repair liabilities on the holding (45 per cent). Familiarity with the applications of SI 1473, The Agriculture (Maintenance, Repair and Insurance of Fixed Equipment) Regulations, as amended, under the 1986 Act had probably lead to 34 per cent of agreements having provisions in line with this ‘old faithful’. 4 per

52
cent of agreements provided for the landlord’s 100% repair responsibility with 12 per cent of the responses recording ‘not applicable’ or ‘bare land’. 3.42 Considering the different term agreements, there were similar results for the shorter agreements with 49 per cent and 46 per cent providing for tenants’ full repairing terms under the short-term agreements and the 2-5 year agreements respectively and 31 per cent and 33 per cent respectively favouring SI 1473. On the other hand, nearly half (46) per cent of the long term agreements had provisions along the lines of SI 1473. Provision for dilapidations 3.43 Of the 175 valid responses, nearly half (49 per cent) were using the RICS provisions; 8 per cent mentioned provisions referring to compensation based on a schedule of condition at the start of the tenancy; 15 per cent had included other specific provisions and 4 per cent provided expressly for no claim on termination of the tenancy. Again, in view of the high number of short-term agreements, 15 per cent recorded ‘no provision’ and as somewhat of a surprise, 7 per cent recorded “in accordance with the Act”. Table 3.16 Provisions for dilapidations in sampled FBT agreements
Type of Agreement
Short ‘Gladstone v
Bower’ replacements
2-5 year
agreements
Greater than 10
year agreements
No provision 19.9 12.9 0.0
As per RICS agreement
46.3
38.4
51.9
Schedule of condition
5.8
8.6
5.3
Other 28.0 40.1 42.8
3.44 As table 3.16 shows, all the longer-term FBTs had some form of provision, with just over
half (52 per cent) relying on the RICS model (see Appendix 2). Disputes 3.45 Among those agreements for which details were provided (92 per cent of the total), 9 per cent made no provision for the resolution of disputes, the parties relying on the provisions of the ATA 1995. It is, however, interesting to note that whilst 37 per cent of the agreements provided for arbitration on all disputes, 47 per cent included reference to an Independent Expert in the first

53
instance. This is another clear example of the use of the flexibility of the Act, in this case, for a potentially less costly means of dispute resolution. Table 3.17 Provisions for disputes resolution in sampled FBT agreements
Type of Agreement
Short ‘Gladstone v
Bower’ replacements
2-5 year
agreements
Greater than 10
year agreements
No provision 11.9 9.9 0.0
Arbitration for all disputes
27.1
38.4
45.6
Independent Expert in first instance
54.3
44.3
46.9
Other 6.7 7.4 7.5
3.46 As table 3.17 shows, more of the very short-term agreements (i.e. those “which would have been Gladstone v Bower agreements before the 1995 Act” provided for the use of an Independent Expert (54 per cent) compared with the longer-term agreements, where it was 44 per cent for agreements of 2-5 years and 47 per cent for agreements of ten or more years. Restrictions and management requirements 3.47 The special nature of agricultural holdings is clearly identified by the provisions concerning assignment and subletting. Three-quarters (76 per cent) of the agreements covered in our survey prohibited both assignment and subletting, with a further 21 per cent prohibiting assignment alone. Only 1 per cent prohibited neither assignment nor subletting. There was no difference between the different term agreements. 3.48 Of great significance, and somewhat surprising, is the result on business restrictions provided for in the agreements. Nearly all of the agreements (95 per cent) restricted the business on the holding to agricultural activities only. This may be a result of concern over the definition of the farm business tenancy and it would have been interesting to have noted the number of FBTs set up following compliance with the Notice conditions of the Act (see Appendix 2). 3.49 Nearly three-quarters (73 per cent) of the agreements were reported as having no specific management provisions. In all, 19 per cent included provisions largely concerning environmental conservation, and 9 per cent included other specific requirements. The latter ranged from cropping-only requirements and restrictions on ploughing permanent pasture, to allowance for

54
small areas of game cover and stocking restrictions on the drive to the house. There was a greater tendency for the long-term agreements to provide for specific management requirements (36 per cent of the total). The effective flexibility of FBTs is again apparent in this area of the agreements and the topic was explored further in both the focus groups and the telephone surveys. Contractual provisions covering environmental issues 3.50 In the focus groups, a range of experiences and views were expressed as regards the inclusion of environmental terms in FBT agreements. “It depends entirely where the landlord sits” was one common thread. The difficulty of putting meaningful environmental terms in short agreements was expressed and a number of participants indicated that, thus far, ”FBTs have had no good effect from an environmental point of view”. There was some debate over the practicality and enforcement of environmental terms within an FBT agreement; one suggestion being that environmental terms could be successfully incorporated when “related to a rent abatement”. 3.51 In stark contrast were participants from the conservation bodies and privatised utilities who reported that they were already making greater use of FBTs to achieve positive environmental aims. There was also experience of situations where “tenants are volunteering environmental enhancement.” 3.52 “New landlords” whose wealth was based on City money and who had now taken their ‘seats’ largely in the South-East were identified as one particular group keen to incorporate environmental terms in their agreements, although the validity of these terms was sometimes questioned. For example, it was reported that one tenant was required to agree to a term that outlawed any method of rabbit control. 3.53 The telephone survey investigated landlords’/owner occupiers’ intentions, as well as the clauses in existing agreements, concerning environmental issues, reported by tenants of FBTs. It therefore investigated not only the provisions covering the maintenance of the holding but also any clauses encouraging/requiring positive management in environmental terms. 3.54 The question to landlords and owner occupiers specifically asked for information on FBTs where there was an intention for the tenancy ‘to continue for five years or more’. In this way, we hoped to include shorter term tenancies where there was an intention to continue the tenancy on an annual basis. It was felt that these agreements would be more comparable with AHA 1986 tenancies and most relevant, giving the time for the provisions to have some recognisable effect on the environment. Nearly two-thirds (63 per cent) of the 191 landlords/owner occupiers who were asked this question had been involved in letting land on FBTs which they intended to continue for five years or more (77 per cent Wales). The balance was most probably due partly to the

55
proportion of owner occupiers amongst respondents but also because of the lower percentage of FBTs of five years and over reported in this and other studies. 3.55 The question to the tenant and mixed tenure farmers was directed towards the FBT agreement of the longest term in which they were involved. Of the 145 farmers asked this question, 59 per cent had been involved in renting land under an FBT (54 per cent Wales). The mean term of these ‘longest FBTs’ was only 6 years (median 4 years) and this should therefore be remembered when comparing these figures with the responses from the landowners/owner occupiers as environmental provisions are likely to be more frequent in longer term agreements. Table 3.18 Inclusion of Rules of Good Husbandry, reservations of timber to the landlord and
protection of water courses in FBTs: Responses from landlords and owner occupiers
Rules of good husbandry
Reservations of timber
Protection of water courses
Total Eng Wales Total Eng Wales Total Eng Wales
N 120 96 24 119 95 24 119 95 24
% % % % % % % % %
Yes 94 93 100 85 86 83 92 93 88
No 3 3 0 5 3 13 2 0 8 Don't know
3 4 0 3 4 0 2 3 0
NA 0 0 0 7 7 4 4 4 4
Source: Telephone Survey 3.56 It is clear from table 3.18 that the majority of FBT agreements contain clauses requiring
the tenant to farm in accordance with the Rules of Good Husbandry. In addition to this, where circumstances are appropriate, there are also clauses in these agreements reserving rights of timber to the landlord and protecting water courses.
3.19 Inclusion of Rules of Good Husbandry, reservations of timber to the landlord and
protection of water courses in FBTs: Responses from tenants and mixed-tenure farmers

56
Rules of good
husbandry Reservations of
timber Protection of water
courses
Total Eng Wales
Total Eng Wales
Total Eng Wales
N 86 73 13 86 73 13 86 73 13
% % % % % % % % %
Yes 93 93 92 66 64 77 69 70 62
No 2 3 0 9 10 8 14 14 15 Don't know
5 4 8 7 8 0 10 8 23
NA 0 0 0 17 18 15 7 8 0 Source: Telephone Survey 3.57 Although the percentages of ‘don’t knows’ was higher from the farmers (see table 3.19), the trend was very much the same as recorded in the above table, although there were apparently fewer clauses concerning the protection of water, possibly due to the shorter term of these FBTs as referred to already . Table 3.20 Obligations regarding the planting of hedges and woodland, extensification and the
control of stock numbers in FBTs: Responses from landlords and owner occupiers
Hedge planting Woodland planting Extensification Control of stock numbers
Other obligations
Total Eng Wales Total Eng Wales Total Eng Wales Total Eng Wales Total Eng Wales
N 119 95 24 119 95 24 119 95 24 118 94 24 102 83 19
% % % % % % % % % % % % % % %
Yes 31 32 29 13 14 13 24 23 29 29 28 33 60 62 53
No 61 61 63 79 78 83 66 68 59 63 65 54 36 36 37 Don't know
5 6 0 6 7 0 6 6 4 5 6 0 3 1 10
NA 3 1 8 2 1 4 4 3 8 3 1 13 1 1 0 Source: Telephone Survey 3.58 Turning to slightly more specific issues, it is perhaps encouraging to note from table 3.20 that in approximately 31 per cent of cases, landlords/owner occupiers indicated that there would be the intention to include obligations on the tenant to plant hedges. In 13 per cent of cases they indicated the intention to include obligations to plant some form of woodland on the FBT holding. Landlords also appear to be giving greater consideration to varied management of the holding by requiring extensive farming (24 per cent) or limiting stock numbers (29 per cent of cases).

57
3.59 It is also noticeable that the flexibility of agreement would be used to place ‘other’ obligations on the tenants with regard to enhancing the environment (60 per cent). Analysis of the latter provides a whole range of different responses from statements clearly indicating a positive approach to the use of such clauses which would vary according to the situation, to other more specific clauses dealing with the protection and preservation of archaeological sites, the protection and active management of existing hedges, restrictions over mowing dates and cutting regimes for hay meadows, restrictions over fertiliser application and the use of sprays, the management of conservation headlands and restrictions on caravans or tents on the holding. In a number of cases, respondents referred to agreement between the parties on an environmental programme for the holding. It is interesting also to note that a number of respondents referred to obligations placed on the tenant concerning the landlord’s sporting rights. 3.60 The farmers (see table 3.21) reported a lower incidence of these clauses which may be due to the shorter terms of these agreements (median four years) or, alternatively, represents some lack of detailed knowledge of the agreements in which they are involved. There does appear to be greater use of “other obligations” on the tenant with regard to enhancing the environment although the number of responses precludes any further analysis. Table 3.21 Obligations regarding the planting of hedges and woodland, extensification and the
control of stock numbers in FBTs: Tenants and mixed-tenure farmers Hedge planting Woodland planting Extensification Control of
stock numbers Other
obligations Total Eng Wales Total Eng Wales Total Eng Wales Total Eng Wales England
N 86 73 13 86 73 13 86 73 13 86 73 13 45 % % % % % % % % % % % % % Yes 5 4 8 3 1 8 2 3 0 2 3 0 27 No 94 95 92 95 97 92 93 93 92 93 91 100 67 Don't know
1 1 0 1 1 0 5 4 8 2 3 0 4
NA 0 0 0 1 1 0 0 0 0 2 3 0 2
Source: Telephone Survey Land under FBTs and conservation agreements 3.61 The landlords and owner occupiers reported that in such agreements with a term of 5 years or more, 54 per cent would not seek to affect the tenant's right to enter into a conservation agreement (58 per cent in Wales). However, 43 per cent (38 per cent Wales) reported that they would seek to restrict the tenant's right in order to retain control of the holding and have the farm managed in a specific way. They would achieve this either by requiring the landlord’s consent (80 per cent) or limiting the term, in other cases.

58
3.62 Turning to the responses from the tenant and mixed tenure farmers (see table 3.22), 68 per cent said that their tenancy agreement did not restrict their rights to enter into a conservation agreement (83 per cent Wales). Of the balance, 8 per cent (also 8 per cent in Wales) said that their agreement did have such a restriction requiring landlord’s consent and 12 per cent (8 per cent in Wales) said that the term of the tenancy restricted their rights in this regard. 3.63 The lower incidence of restrictions reported by the tenants may be explained by the following table which indicates that few of the holdings under FBTs included in this survey appear to be in designated areas and only five respondents indicated that the land under the FBT was entered into a conservation agreement under any of these schemes. This may in part be due to respondents’ lack of awareness of the exact boundaries of these designated areas. Table 3.22 Proportion of tenants and mixed-tenure farmers in FBTs falling within specified
designations ESA SSSI NVZ NSA C/side
Stwshp Tir
Cymen Total Eng Wales Total Eng Wales Total Eng Wales Total Eng Wales England Wales
N 86 73 13 86 73 13 86 73 13 86 73 13 73 13 % % % % % % % % % % % % % % Yes 7 7 8 5 4 8 2 3 0 2 3 0 7 8 No 92 92 92 92 93 85 92 92 92 92 92 92 92 92 Don't know
1 1 0 3 3 7 6 5 8 6 5 8 1 0
Source: Telephone Survey Diversification enterprises 3.64 The question of farm diversification was raised in the focus groups but was not picked up by them as presenting any problems in FBTs. Where parties had sought to involve a diversification enterprise, for example horse racing stables, in their agreements this had presented no particular difficulties.

59
CHAPTER 4 THE MARKET FOR FARM BUSINESS TENANCIES
Introduction 4.1 This chapter draws on the various sources of primary and secondary data described in chapter 2 to examine the characteristics of landowners and tenants currently involved in FBTs. It answers two main questions, viz. • Who is letting FBTs and where is the land coming from? • Who is renting FBTs and where is the land going to? Unless otherwise stated, the data presented in this chapter are drawn from the University of Plymouth/RICS survey, augmented by our supplementary census in Wales. Data for farms owned by County Councils or other Local Authorities are shown separately. Who is letting land as FBTs? 4.2 Table 4.1 shows that most of the land in FBTs in the first year of the new legislation was let by private landowners (73 per cent in England and 37 per cent in Wales) though in Wales, organisations with charitable status played a larger role. Table 4.1a Identity of FBT Landlords: England (N=737)
Number % Area %
Private 3,421 73.2 140,193 73.1 Utility companies
95 2.0 3,953 2.1
Central Govt 161 3.5 11,674 6.1
Traditional institutions
356 7.6 7,458 3.9
Financial institutions
85 1.8 12,210 6.4
Charities 363 7.8 6,962 3.6
Other 194 4.1 9,422 4.9

60
Table 4.1b Identity of FBT Landlords: Wales (N=37)
Number % Area %
Private 42 52.8 1,702 37.3 Utility companies
9 11.1 210 4.6
Central Govt 16 19.4 865 19.0
Charities 13 16.7 1,785 39.1
Table 4.1a Identity of FBT Landlords: England and Wales (N=774)
Number % Area %
Private 3,463 72.8 141,895 72.2 Utility companies
104 2.2 4,163 2.1
Central Govt 177 3.7 12,539 6.4 Traditional institutions
356 7.5 7,458 3.8
Financial institutions
85 1.8 12,210 6.2
Charities 377 7.9 8,747 4.5
Other 194 4.1 9,422 4.8
Where did the land come from? 4.2 Table 4.2 shows the previous occupation of the land granted into FBTs during the first year of the new legislation. Most striking is the fact that in England, two-thirds of the FBTs (60 per cent of the area) had previously been let on either short-term agreements or grazing licences. These formed a rather smaller proportion in Wales (roughly half the FBTs and only 23 per cent of the land).

61
Table 4.2a Previous occupation of the land currently let as FBT: England (N=737)
Previous occupation
Number % Area (ha) %
Farmed in-hand
503 10.8 22,817 11.9
Short-term agreements
1,949 41.7 97,120 50.6
AHA 1986 tenancy
629 13.5 29,991 15.6
Contract/ share farming
159 3.4 12,315 6.4
Grazing licence
1,201 25.7 18,224 9.5
Other 228 4.9 11,373 5.9
Table 4.2b Previous occupation of the land currently let as FBT: Wales (N=37)
Previous occupation
Number % Area (ha) %
Farmed in-hand
11 13.9 786 17.2
Short-term agreements
16 19.4 748 16.4
AHA 1986 tenancy
24 30.6 2,726 59.8
Grazing licence
24 30.6 276 6.1
Other 4 5.6 24 0.5

62
Table 4.2c Previous occupation of the land currently let as FBT: England and Wales (N=774)
Previous occupation
Number % Area (ha) %
Farmed in-hand
514 10.8 23,603 12.0
Short-term agreements
1,965 41.4 97,868 49.9
AHA 1986 tenancy
654 13.8 32,716 16.7
Contract/ share farming
159 3.3 12,315 6.3
Grazing licence
1,225 25.8 18,501 9.4
Other 232 4.9 11,398 5.8
4.3 The length of term of these agreements as FBTs averaged 2 years 9 months (mean)/2 years (median) in England and 3 years 10 months(mean)/3 years (median) in Wales. As mentioned in chapter 3 our conclusion is that the 1995 Act has had a significant effect in lengthening the term of some tenancies, particularly those on bare land let primarily for grazing or for arable production (see para 3.32). 4.4 In the case of 14 per cent of the FBTs in England (16 per cent of the area) the land was previously let under the 1986 Agricultural Holdings Act. In Wales, the proportion was much larger - 30 per cent of the FBTs and 60 per cent of the land. The new terms on these lettings as FBTs averaged 6 years 5 months (mean)/3 years (median) in England and 5 years 7 months (mean)/ 5 years median in Wales. It should be borne in mind that despite the fact that the Welsh component of the study involved a census rather than a sample survey, the number of FBTs covered in the Principality is very small. 4.5 Of particular interest, given the objectives of the 1995 legislation, are the 503 FBTs in England (11 in Wales) that granted land that was previously farmed in hand. These comprised 12 per cent of the land area let as FBTs in England and 17 per cent in Wales. This is the “new” land coming into the tenanted sector. Employing the assumptions behind Estimate B described in para 3.2, we estimate that this amounted to a total of 23,600 hectares in just over 500 FBTs in England and Wales, though this excludes land let by the County Councils, to which we turn later in this chapter.

63
4.6 It should be recognised that these figures measure the gross flow of land into the rented sector. Unfortunately no information was available from our own survey about flows out of the rented sector. However, the report on the CAAV’s 1996 Survey of Tenanted Farms suggests that over the period roughly contiguous with our own survey for every 500 hectares of new let there have been 200 hectares of land formerly rented that have now left the tenanted sector (CAAV 1997: 2.1). We conclude that the 1995 Act does appear to have achieved its primary objective of bringing new land into the rented sector though it as yet too early to establish whether it will halt the long-term decline in this sector shown in figure 1.1 . Indeed, the MAFF June Census of 1996 showed a further 3 per cent decline in the let sector between June 1995 and June 1996. 4.7 In addition to the land that moved into the rented sector from being farmed in-hand, a further 160 FBTs covering an area of approximately 12,000 hectares were granted on land previously farmed under a sharefarming or contract farming agreement. 4.8 Table 4.3 shows the types of FBT granted on land coming from these different sources. It is clear that FBTs following on from an AHA 1986 Tenancy are more likely to comprise a self-contained farm business with a house as well as farm buildings and land. Those following on from a short let or grazing licence are much more likely to comprise only bare land. Table 4.3a Types of FBT on land from different sources: England (N=734)
Present type of FBT Previous use of
land Bare land
(%) Land/buildings
(%) Land/buildings/
house (%)
Total (%)
Farmed in-hand 70.9 19.0 10.1 100.0 Short-term agreement
82.8 13.3 3.9 100.0
AHA 1986 tenancy
54.5 19.2 26.3 100.0
Contract/share farming
76.9 11.5 11.5 100.0
Grazing licence 97.4 2.1 0.5 100.0
Other 78.1 6.3 15.6 100.0
Table 4.3b Types of FBT on land from different sources: Wales (N=36)

64
Present type of FBT Previous use of
land Bare land
(%) Land/buildings
(%) Land/buildings/
house (%)
Total (%)
Farmed in-hand 20.0 40.0 40.0 100.0 Short-term agreement
28.6 57.1 14.3 100.0
AHA 1986 tenancy
36.4 9.1 54.5 100.0
Grazing licence 100.0 0.0 0.0 100.0
Other 100.0 0.0 0.0 100.0
Table 4.3c Types of FBT on land from different sources: England and Wales (N=770)
Present type of FBT Previous use of
land Bare land
(%) Land/buildings
(%) Land/buildings/
house (%)
Total (%)
Farmed in-hand 69.5 19.9 10.7 100.0 Short-term agreement
82.4 13.5 4.0 100.0
AHA 1986 tenancy
53.9 18.5 27.6 100.0
Contract/share farming
77.9 11.1 11.0 100.0
Grazing licence 97.7 2.0 0.3 100.0
Other 79.2 6.6 14.2 100.0
Who are the tenants of FBTs? 4.9 Figure 4.1 shows the identity of the tenants of the FBTs covered by the University of Plymouth/RICS survey. Almost two-thirds (64 per cent) in England and 42 per cent in Wales were the previous occupier of the land. This is consistent with our earlier suggestion that in many cases FBTs are replacing short-term lets and grazing licences granted to the same occupant, who is frequently an existing farmer seeking to make marginal adjustments to the area farmed (see paras 3.19 and 3.25). However, 7 per cent of the FBT units in England, covering 9 per cent of the area (and 34 per cent in Wales, covering 56 per cent of the area) were let to people that our respondents defined as “New Entrants”. Figure 4.1a Identity of FBT Tenants: England

65
28%
7%
65%Previous occupier
Other farmer
New entrant
Figure 4.1b Identity of FBT Tenants: Wales
25%
34%
41%
Previous occupier
Other farmer
New entrant

66
Figure 4.1c Identity of FBT Tenants: England and Wales
28%
8%
64%Previous occupier
Other farmer
New entrant
4.10 Again using the grossing-up procedures described in para 3.2 we calculated Estimate B. This suggests that during the first year of the 1995 Agricultural Tenancies Act 17,338 hectares of land were let as FBTs to 344 new entrants in England and an additional 2,550 hectares to 27 new entrants in Wales. 4.11 Subsequent analysis suggested that about a quarter (26 per cent) of the holdings let to the new entrants in England included a house as well as farm buildings and land; 61 per cent comprised bare land. In Wales the comparable figures were 42 per cent and 50 per cent respectively. County Farms 4.12 When considering new entrants it is also important to look at the situation on farms let by County Councils. Table 4.4 shows the previous use of land let as FBTs by the County Councils replying to our survey. The majority of the land in both England and Wales had formerly been let as 1986 AHA tenancies.

67
Table 4.4a Previous occupation of the land currently let as FBTs: County Farms - England (N=120)
Previous occupation
Number % Area (ha) %
Short-term agreements
40 30.0 415 12.1
AHA 1986 tenancy
80 59.2 2,022 58.8
Grazing licence
13 10.0 83 2.4
Other 1 0.8 917 26.7
Table 4.4b Previous occupation of the land currently let as FBTs: County Farms - Wales (N=25)
Previous occupation
Number % Area (ha) %
Short-term agreements
3 8.0 29 4.3
AHA 1986 tenancy
30 88.0 614 91.8
Grazing licence
1 4.0 26 3.9
Table 4.4c Previous occupation of the land currently let as FBTs: England and Wales (N=165)
Previous occupation
Number % Area (ha) %
Short-term agreements
43 25.5 444 10.8
AHA 1986 tenancy
110 65.0 2,637 64.2
Grazing licence
15 8.8 109 2.7
Other 1 0.7 917 22.3
4.13 Figure 4.2 goes on to show who was receiving the new land. Roughly one-third of the

68
FBT tenants were new entrants, accounting for 30 per cent of the land in England and 36 per cent in Wales. The vast majority of these FBTs (80 per cent in England; 100 per cent in Wales) included a house as well as farm buildings and land. Figure 4.2a Identity of FBT Tenants: County Farms – England
24%
34%
42%
Previous occupier
Other farmer
New entrant
Figure 4.2b Identity of FBT Tenants: County Farms – Wales
38%
31% 31%
Previous occupier
Other farmer
New entrant

69
Figure 4.2c Identity of FBT Tenants: County Farms - England and Wales
27%
34%39%
Previous occupier
Other farmer
New entrant
4.14 Table 4.5 draws together the results from the different surveys regarding FBTs granted to new entrants. It suggests that in the period covered by our surveys only about 6 per cent of the land let to new entrants in England came via the County Councils (9 per cent in Wales). Most of the remainder came from the private sector. However, a much higher proportion of the land let by County Councils comprised “complete” holdings with house, land and buildings. In all, the County Councils let 47 such holdings to new entrants and other landowners, 100. Table 4.5 Number and area of FBTs in England and Wales let to “New entrants” in the
period September 1995 to July/August 1996.
Country Estimate A Estimate B England: County Councils
41 FBTs 904 ha
46 FBTs 1,013 ha
England: Other
211 FBTs 10,691 ha
344 FBTs 17,338 ha
England: Total
252 FBTs 11,865 ha
390 FBTs 18,351 ha
Wales: Local Authorities
8 FBTs 187 ha
11 FBTs 257 ha
Wales: Other
12 FBTs 1,149 ha
27 FBTs 2,550 ha
Wales: Total
20 FBTs 1,336 ha
38 FBTs 2,807 ha
England and Wales
272 FBTs 13,201 ha
428 FBTs 21,158 ha
70
4.15 Clearly some new entrants are taking up FBTs but many of them do not fit the common stereotype of the young person acquiring a self-contained holding with a house as well as farm buildings and land.Our surveys suggest that 42 per cent are aged over 40 and only about one-third of the FBTs rented by new entrants comprise a house as well as land and buildings - for about half (54 per cent) the FBT comprises only bare land. This is not surprising given the other hurdles facing new entrants. As our previous work has shown (Errington et al 1987, Warren et al 1995) it is more often the financial requirements than the lack of a suitable holding which places the main impediment in the face of the new entrant to farming. Certainly, in the present situation of the industry in which strong demand is bidding up rents it is unlikely that the 1995 Act alone will have a significant immediate impact on the opportunities facing young people wishing to enter the industry. 4.16 This, certainly, was the view of our focus groups. When considering opportunities for the “new entrant” there was considerable pessimism with comments such as “they’ve not got a hope in hell” reflecting the difficulties faced by the younger farmer competing against expanding businesses and high rents. For those new entrants who had succeeded in gaining a tenancy there was much concern over the financial burdens they had committed themselves to in the “ hope of future opportunities”. There was also anxiety expressed that the pattern of letting emerging did not provide opportunities for the younger farmer on livestock farms where “there was a need to live close to the farm” if stock were going to be adequately looked after. The overall lack of opportunity was not held to be as the direct result of the introduction of FBTs but rather the prevailing economic circumstances which had led to the “squeezing out” of younger applicants in the tendering process. 4.17 From those at the focus groups who had involvement with County Farms and whose Management Committees had made a commitment to stick with their farming estates came a welcome recognition that FBTs provided the flexibility of term through which a progression into larger farms could be achieved. However, for this to be completely successful there had to be such opportunities available both within the County Farms structure and the letting sector as a whole. Age of FBT holders 4.18 Table 4.6 indicates the age of those FBT tenants for whom the Chartered Surveyors or County Land Agents were able to provide details. There is a clear tendency for those classified as “new entrants” to be younger than FBT tenants as a whole with 52 per cent in England and 75 per cent in Wales being aged 40 years or younger. The table also shows that

71
County Councils tend to let to somewhat younger tenants, with 88 per cent of “new entrant” FBTs being let to persons aged 40 years or younger. Table 4.6a Age of FBT tenants: England
New tenant is........ Age of tenant Previous
occupier (%) Other farmer
(%) New entrant
(%)
Total (%)
All except County Council-let FBTs (N=551):
Under 26 0.3 1.1 5.9 1.1
26-40 23.6 28.0 46.2 26.9
41-55 50.3 47.8 44.3 49.0
Over 55 20.1 14.6 1.0 16.8
Let to company 5.7 8.5 2.6 6.2
Total 100.0 100.0 100.0 100.0
County Council-let FBTs (N=106)
Under 26 0.0 0.0 4.9 1.9
25-40 28.9 81.5 82.9 63.2
41-55 44.7 11.1 12.2 23.6
Over 55 26.3 7.4 0.0 11.3
Let to company 0.0 0.0 0.0 0.0
Total 100.0 100.0 100.0 100.0

72
Table 4.6b Age of FBT tenants: Wales
New tenant is........ Age of tenant
Previous occupier (%)
Other farmer (%)
New entrant (%)
Total (%)
All except Local Authority-let FBTs (N=26):
Under 26 0.0 0.0 0.0 0.0
26-40 20.0 62.5 75.0 50.0
41-55 70.0 25.0 12.5 38.5
Over 55 10.0 12.5 12.5 11.5
Let to company 0.0 0.0 0.0 0.0
Total 100.0 100.0 100.0 100.0
Local Authority-let FBTs (N=26)
Under 26 0.0 0.0 0.0 0.0
25-40 62.5 70.0 87.5 73.1
41-55 37.5 30.0 12.5 26.9
Over 55 0.0 0.0 0.0 0.0
Let to company 0.0 0.0 0.0 0.0
Total 100.0 100.0 100.0 100.0

73
Table 4.6c Age of FBT tenants: England and Wales
New tenant is........ Age of tenant
Previous occupier (%)
Other farmer (%)
New entrant (%)
Total (%)
All except County Council/Local Authority-let FBTs (N=577):
Under 25 0.3 1.1 5.6 1.0
26-40 23.5 28.6 47.7 27.3
41-55 50.5 47.4 42.7 48.9
Over 55 20.0 14.6 1.6 16.8
Let to company 5.7 8.4 2.4 6.1
Total 100.0 100.0 100.0 100.0
County Council/Local Authority-let FBTs (N=132)
Under 25 0.0 0.0 3.9 1.5
25-40 35.8 77.9 83.8 65.5
41-55 43.3 17.0 12.3 24.4
Over 55 20.9 5.1 0.0 8.7
Let to company 0.0 0.0 0.0 0.0
Total 100.0 100.0 100.0 100.0
FBT Rents 4.19 A primary aim of the 1995 Act was to “free up” the market for let land, allowing freely-negotiated agreements to be established under the influence of market forces. One indicator of the impact of the Act will therefore be the level of rent charged for different agreements. This section of the report uses the responses to the postal survey to explore the variation in rents between different types of agreement on different types of farm. 4.20 Our estimate of the overall mean annual rent for the FBTs in England and Wales reported, based on grossed-up data from the augmented University of Plymouth/RICS survey of chartered surveyors and the survey of County Agents in England and Wales is £331 per ha. However, the standard deviation is £1,151 indicating the immense variability of FBT rents, reflecting not only the variation associated with location, soil type and farming potential but also the greater variation in the content of the agreements now made much more flexible by the 1995 Act. This is illustrated in Figure 4.3 which shows the frequency distribution of FBT rents per ha.

74
Figure 4.3 FBT rents in England and Wales
Rent per ha
0
5
10
15
20
25
30
35
40
45
Les
s th
an£1
00
£100
<£20
0
£200
<£30
0
£300
<£40
0
£400
<£50
0
£500
<£60
0
£600
<£70
0
£700
<£80
0
£800
<£90
0
£900
<£10
00£1
000
orm
ore
4.21 Where variability is so great, it is usually more helpful to consider the median rather than the mean. Our survey suggests a median annual rent of £183 per hectare in England and Wales. The median rent was lower in Wales (at £113 per hectare compared with £185 per hectare in England), probably reflecting the fact that most of the Welsh FBTs were on livestock farms. The median for FBTs let by County Councils/Local Authorities tended to be somewhat higher (at £222 per ha), reflecting the fact that a larger proportion of these FBTs included a house and farm buildings as well as the land1 . 4.22 Tables 4.7 to 4.10 report the levels of rent among the different categories of holding. In this case, the analysis is based on the grossed-up data for all FBTs in England and Wales (excluding those let by County Councils or other Local Authorities).
1 Once again, these findings are broadly comparable with those in the 1996 Annual Survey of Tenanted Land which estimated rents in England (£173/ha for FBTs with a term of at least 1 year; £292/ha for those with a term of less than one year) and Wales (£102/ha for FBTs with a term of at least 1 year; £230/ha for those with a term of less than one year). However, it should be noted that the variability involved in both sources of estimates is large.

75
Table 4.7 Variation in rents by FBT size
Size of FBT (ha)
N
Mean annual rent (£ per ha)
Standard deviation (£ per ha)
Median annual rent (£ per ha)
<10 ha 151 565 1,913 188
10 < 25 110 191 112 168
25 < 100 116 192 108 172
100 < 200 14 221 68 208
=200 9 192 77 189
4.23 The higher rents for larger farms (100 < 200 ha) could be explained by the likelihood of a greater arable element in the holding and the effect of arable area payments on rents; alternatively it may reflect the fact that a larger proportion of the smaller FBTs comprise bare land. However, the findings for the largest size-groups need to be treated with some caution because of the relatively small numbers of observations on which they are based. Table 4.8 Variation in rents by FBT type
Type of FBT
N
Mean annual rent (£ per ha)
Standard deviation (£ per ha)
Median annual rent (£ per ha)
Bare land 328 208 149 183
Land and buildings 38 1,310 3,581 184 Land, buildings and house
27 554 1,171 161
4.24 It is perhaps surprising to note the lower median rent for the complete holding.

76
Table 4.7 Variation in rents by FBT farm-type
Farm-type
N
Mean annual rent (£ per ha)
Standard deviation (£ per ha)
Median annual rent (£ per ha)
Dairy 16 168 110 97
Livestock 181 177 204 133
Mixed 46 179 126 139
Arable 128 257 120 247
Horticulture 9 491 430 309
Other 8 3,752 6,316 198
4.25 As might have been expected, the highest rents are for horticulture, with the second highest for arable holdings, perhaps indicating the effects of arable area payments and the buoyant grain market or the high rents farmers are willing to pay for the “marginal extra acres” mentioned in para 3.19. Table 4.8 Variation in rents by FBT term
Term of FBT
N
Mean annual rent (£ per ha)
Standard deviation (£ per ha)
Median annual rent (£ per ha)
<1 year 43 630 2,848 110
1 year 121 305 608 183
>1<2 years 18 141 99 115
2 years 47 233 193 207
>2<5 years 43 206 133 185
5 years 80 275 280 219
>5<10 years 16 1,378 3,596 209
10 years 15 224 178 163
>10 years 16 162 61 146
4.26 It is noticeable that there is no clear relationship between the level of rent and the term of the FBT agreement. 4.27 Clearly, the size, agreement-type, farm-type and term of the agreements reported in our survey all influence the level of the rent. Recognising that farm-type and agreement-type are

77
likely to have the greatest influence it is possible to explore the impact of term for some categories of farm. The largest group of FBTs for which we have rental information relate to arable farms (N=128). Most of these agreements (N=112) refer to bare land. Table 4.9 gives some indication of the variation in rent by term of agreement. This table suggests that there is, as yet, no systematic variation in FBT rents by their length of term where arable lets are concerned. Table 4.9 FBTs for bare land on arable farms: Variation in rents by term
Term of FBT
N
Mean annual rent (£ per ha)
Standard deviation (£ per ha)
Median annual rent (£ per ha)
<1 year 1 .. .. ..
1 year 54 280 140 268
>1<2 years 2 .. .. ..
2 years 12 239 52 247
>2<5 years 14 232 112 209
5 years 19 249 68 248
<5<10 years 6 .. .. ..
10 years 2 .. .. ..
>10 years 2 .. .. ..
.. insufficient observations for meaningful analysis 4.28 Table 4.10 shows the results of similar analysis for the 167 bare-land FBTs on livestock farms for which we have rental information. The table suggests that in this case there is systematic variation in FBT rents, with a clear premium being paid for greater security of tenure. However, because of the very large variability in rents the only differences in the mean values that are statistically significant at less than the 5% level are those between FBTs of 1 year or less and those of 5 years.

78
Table 4.10 FBTs for bare land on livestock farms: Variation in rents by term
Term of FBT
N
Mean annual rent (£ per ha)
Standard deviation (£ per ha)
Median annual rent (£ per ha)
<1 year 39 117 69 102
1 year 35 134 104 121
>1<2 years 9 .. .. ..
2 years 24 159 69 183
>2<5 years 16 167 92 148
5 years 33 187 78 174
>5<10 years 4 .. .. ..
10 years 4 .. .. ..
>10 years 3 .. .. ..
.. insufficient observations for meaningful analysis

79
CHAPTER 5 CONSTRAINTS ON THE UPTAKE OF FARM BUSINESS TENANCIES
Introduction 5.1 This chapter draws mainly on the telephone surveys and focus groups to identify constraints on the uptake of FBTs. As explained in chapter 1 we initially conceived of constraints originating from three main types of factor, namely: • lack of awareness of the existence and purpose of FBTs; • misunderstandings about the content, operation and purpose of FBTs; • perceived problems with the current operation of FBTs. In presenting our findings we start by considering each of these factors in turn. Levels of awareness The context of the 1995 Act 5.2 In the face of the decline in the size of the let sector, one of the main objectives of the Agricultural Tenancies Act 1995 was “to make more land available for rent” which would “enable existing tenants to expand their businesses and increase the opportunities for new entrants”. To what extent are the main ‘actors’ in the agricultural sector aware of the background leading to the introduction of the legislation? Figure 5.1 Respondents' estimates of the size of the tenanted sector
0 5 10 15 20 25 30 35
0-10%
11-20%
21-30%
31-40%
41-50%
51-60%
61-70%
71-80%
% respondents
England
Wales
England & Wales

80
5.3 Respondents to the telephone survey were asked to indicate their estimate of the size of the agricultural tenanted sector as a proportion of the total agricultural land in England and Wales and to note how this had changed since 1950. One-third (33 per cent) of those who responded to this question did not know or were not prepared to guess. This indicates a relatively low level of awareness, generally, although those that did provide an estimate were reasonably accurate (see figure 5.1). From the 325 who did supply an estimate, the mean was 36 per cent (Wales 34 per cent) and the median 35 per cent (35 per cent Wales), though the replies ranged from 10 per cent to 75 per cent tenanted. In all, 59 per cent of the replies fell within the range 21 - 40 per cent. A higher proportion of the Welsh respondents (46 per cent) replied ‘don’t know’ and only 53 per cent of those who responded provided estimates within the 21 - 40 per cent range. 5.4 Whilst some were reluctant to provide an estimate for the relative size of the tenanted sector, a greater proportion of respondents (76 per cent) were prepared to offer an opinion on the changes in the size of the sector since 1950. Of these, 87 per cent (85 per cent Wales) identified that the present day size of the sector was less or much less compared with 1950 demonstrating clear awareness of the pressures on the tenanted sector over the last forty to fifty years (see figure 5.2). Figure 5.2 Perceived changes in the tenanted sector 1950-97 5.5 Finally, respondents' views were gathered on the importance of the tenanted sector. They were asked: “Do you think that it is important that there is a substantial tenanted sector in modern agriculture?”. Figure 5.3 shows their replies. It is quite clear that these respondents strongly endorse the need for a substantial tenanted sector in modern agriculture in England and Wales with 82 per cent (81 per cent in Wales) marking either 4 or 5 (“important” or “very
0 10 20 30 40 50 60
Much Lower
Lower
Same
Higher
Much Higher
% respondents
England
Wales
England & Wales
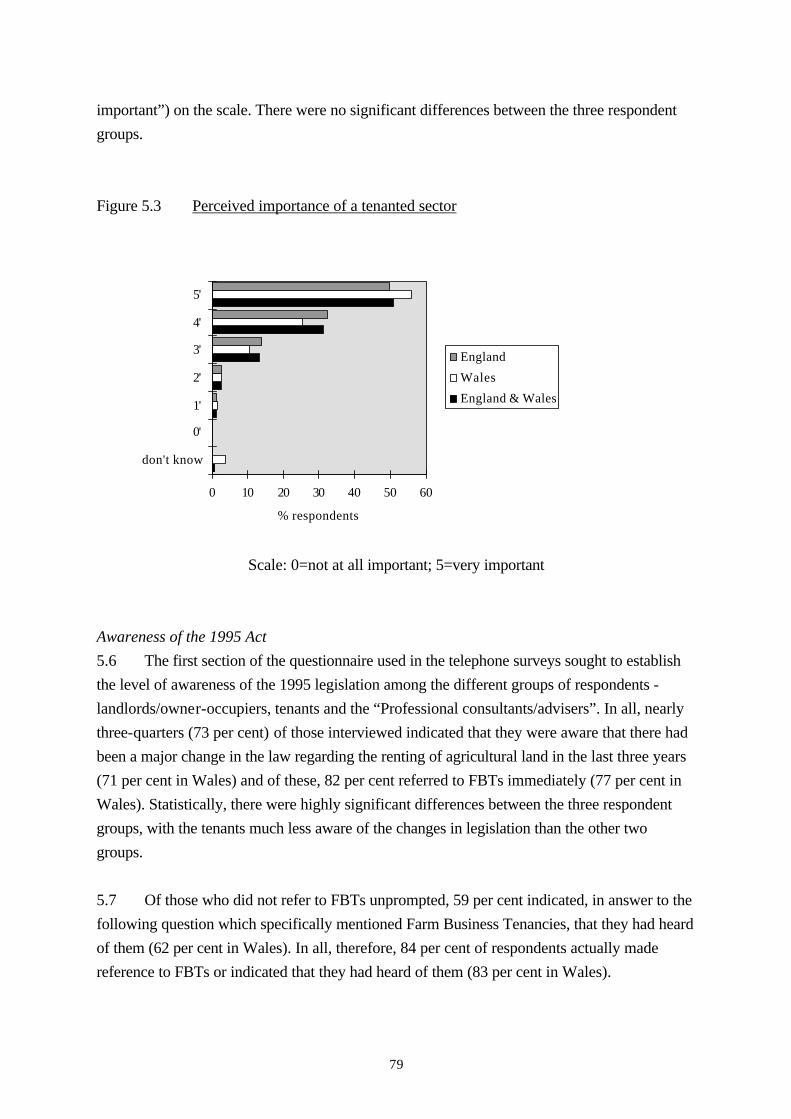
79
important”) on the scale. There were no significant differences between the three respondent groups. Figure 5.3 Perceived importance of a tenanted sector
Scale: 0=not at all important; 5=very important Awareness of the 1995 Act 5.6 The first section of the questionnaire used in the telephone surveys sought to establish the level of awareness of the 1995 legislation among the different groups of respondents - landlords/owner-occupiers, tenants and the “Professional consultants/advisers”. In all, nearly three-quarters (73 per cent) of those interviewed indicated that they were aware that there had been a major change in the law regarding the renting of agricultural land in the last three years (71 per cent in Wales) and of these, 82 per cent referred to FBTs immediately (77 per cent in Wales). Statistically, there were highly significant differences between the three respondent groups, with the tenants much less aware of the changes in legislation than the other two groups. 5.7 Of those who did not refer to FBTs unprompted, 59 per cent indicated, in answer to the following question which specifically mentioned Farm Business Tenancies, that they had heard of them (62 per cent in Wales). In all, therefore, 84 per cent of respondents actually made reference to FBTs or indicated that they had heard of them (83 per cent in Wales).
0 10 20 30 40 50 60
don't know
0'
1'
2'
3'
4'
5'
% respondents
England
Wales
England & Wales

82
5.8 In view of all the discussion, debate and publicity surrounding the new legislation, it is perhaps surprising that the proportion who had not heard of FBTs was as large as 17 per cent. As already mentioned the lack of awareness was greatest among the tenants, 24 per cent of whom had not heard of FBTs while it was 16 per cent among the landlords/owner occupiers and 7 per cent among the advisers (who, it will be remembered, included a variety of agricultural consultants some of whom will have had little to do with land tenure arrangements). Sources of information 5.9 As far as key sources of information was concerned, when asked “Where did you get most of your information about FBTs?” respondents had difficulty in limiting themselves to one key source despite our interviewer’s encouragement for them to do so. Initial analysis of the separate sources shown in figure 5.4 indicates that the farming press was the most important single source (cited by 22 per cent of the respondents) with land agents’, the RICS and solicitors’ journals also featuring prominently. When taken together, the trade and professional journals are seen to be the most important source of information about the new legislation, mentioned by 56 per cent of the respondents (62 per cent in Wales). Taken together, the trade and professional briefings were apparently as important (21 per cent; 18 per cent Wales) as the farming press (22 per cent; 19 per cent Wales). It is also noticeable that the NFU Journal (presumably the FUW in Wales) and other sources including the Act itself, in-house briefings, the TFA , the CAAV and word of mouth (ie. at market) feature more prominently in Wales. Figure 5.4 Sources of information about the 1995 Act
RICS Brief
Other Brief

79
5.10 With journals and briefings for the different organisations / groups taken together, it is clear that , after the farming press, the RICS, land agents and solicitors are key providers of information. As table 5.1 shows, taking into account both their journals and briefings the professional bodies clearly played a major role in making the industry aware of the new legislation. Table 5.1 Sources of information about FBTs

84
Number of responses
Eng & Wales
England & Wales
%
England
%
Wales
%?
Farming Press 158 21.5 21.9 19.3
RICS 117 15.9 16.1 15.1
Land Agents 110 14.9 16.3 8.4
Solicitors 85 11.6 11.9 10.1
CLA 61 8.3 8.4 7.6
NFU / FUW 53 7.2 6.2 12.6
MAFF 10 1.4 1.5 0.8
Accountants 6 0.8 0.8 0.8
Other 134 18.3 16.9 25.2
Source: Telephone Survey
5.11 Table 5.2 contains the results of our analysis of articles appearing in the two journals of the farming press with the largest distributions in England and Wales - Farmers’ Weekly and Farming News. It shows that there was indeed a great deal of information made available to the farming community both before and following the introduction of FBTs. In our analysis we allocated each article mentioning FBTs to one of three categories according to the depth of their coverage. “Grade 3” refers to the mere mention of FBTs; articles were allocated to “grade 2” if they mentioned the characteristics of FBTs while articles classified as “grade 1” dealt with the detailed operation of FBTs. Table 5.2 The breadth and depth of press coverage of FBTs
FARMERS’ WEEKLY FARMING NEWS
Column
Inches
1 April
-June
1995
2 July
-Sept
1995
3
Oct
-Dec
1995
4
Jan
-Mar
1996
Total
%
1 April
-June
1995
2
July
-Sept
1995
3
Oct
-Dec
1995
4
Jan
-Mar
1996
Total
%
grade 1 71 71 0 115 257 60 21 74 28 5 128 34
grade 2 18 27 5 33 83 19 40 48 32 6 126 34
grade 3 15 19 43 14 91 21 19 29 33 40 121 32
Total 104 117 48 162 431 80 151 93 51 375
% 24 27 11 38 100 21 40 25 14 100
5.12 Our findings suggest that the new legislation attracted a good deal of publicity and that, for the most part, lack of awareness of the existence of FBTs is unlikely to have placed a constraint on their uptake. This conclusion was endorsed by the views expressed by the focus

79
groups which were asked to consider “whether the pre-Act publicity and availability of training was adequate?”. 5.13 Among those attending the focus groups there was a general consensus that the pre-Act publicity and technical information made available by the various “roadshows” was unprecedented in terms of new agricultural legislation; “Anyone who wanted to know had the opportunity”. There was even a suggestion of ‘overkill’ in that what was originally portrayed as a straight-forward and flexible form of agreement, was being hijacked by lawyers and legal technicalities before the process had had a chance to establish itself. This theme was picked up again later when contributors from both the professional and farming ranks lamented the emergence of “telephone directory” length leases. Levels of understanding 5.14 Through the telephone interviews we sought to ascertain the levels of understanding of the new legislation by asking a number of questions about the most important differences between FBTs and traditional tenancies. When asked to give the three most important differences between FBTs and traditional tenancies, 90 per cent of the respondents were able to suggest one difference, 80 per cent provided two and only 59 per cent were able to suggest three differences. This suggests that despite the widespread and continuing publicity referred to above there is still some lack of detailed understanding of the legislation. 5.15 Identifying differences, high proportions of respondents (79 per cent; 77 per cent in Wales) spoke in general terms of “flexibility”, “higher rents”, “flexible term”, “no succession” or “no security of tenure” (see figure 5.5). A much lower proportion referred to detailed issues such as disputes resolution, open market rents, the new compensation provisions for tenants improvements or the lack of dilapidation provisions in the act. This also suggests, perhaps, that the level of detailed understanding amongst respondents generally is not great. Figure 5.5 Perceived differences between FBTs and traditional tenancies
Rent Review
IHT Relief
Commercial Agreement
Compensation
Other
England

86
5.16 By and large, the findings of the focus groups support this conclusion that the depth of understanding of the new tenure arrangements is not great, particularly (though not exclusively) among those who have not yet had any direct experience of them. The focus groups were asked to consider “whether the message concerning FBTs reached all relevant parts of the Agricultural Industry?”. 5.17 Among the landlords/owner occupiers it was suggested that, in spite of the information on offer, there was still a considerable audience who, because they had given little thought to the matter, were as yet unaware of the flexibility in managing land that FBTs might bring, or of the consequences of an FBT agreement. For example, it was suggested that the owner occupier “does not have the motivation to know” in spite of the fact that they may well be missing new opportunities. 5.18 The example was given of the owner occupier who has reached retirement age and does not want to move completely off the farm but at the same time does not want to create a situation where the land could not be farmed to an appropriate standard, or might not be available should it be required at relatively short notice. A sensible arrangement could now be achieved using FBTs. The farmhouse and a small portion of land could be retained by the retiring farmer. The rest of the farm could be managed commercially, without resort to artificial agreements and over a time-scale acceptable to both parties. The retiring farmer would receive a regular income in the form of rent, safe in the knowledge that the agreement would not jeopardize any future plans he/she might have made. 5.19 Among the tenants, it was suggested that the major element in a new tenant’s mind when approaching a tenancy was the securing of extra land and not the nature or the term of the agreement. As one participant put it: “still tenants do not understand the effect of the FBT and

79
that there will be no security”. It was suggested that not all tenants and prospective tenants fully appreciated that if they agreed a rent for a specified term then that agreement would commit them for the “duration”. 5.20 Among the advisers, lawyers and consultants attending the focus groups there was a general appreciation of the “commercial reality” that FBTs brought to the leasing of agricultural land, though the occasional participant at one of the other focus groups (whether tenant or landowner) identified a reluctance on the part of some professionals to become involved: “We couldn’t get our solicitor through it”. Attitudes to FBTs 5.21 All respondents were first asked to indicate the main advantages and disadvantages of FBTs for tenants and landlords separately. A summary of their replies is contained in figures 5.6 to 5.9. Figure 5.6 FBTs - perceived advantages for the landlord 5.22 It is clear that respondents identified flexibility, freedom of contract and the ability to establish a fixed term as important for both parties, particularly the landlords (73 per cent of responses; 80 per cent in Wales). The current high level of rents for FBTs and the favourable inheritance tax advantages also featured prominently as perceived advantages for landlords.
0 10 20 30 40 50 60
Fixed Term
Encouraged toLet
Higher Rents
Tax Relief
Freedom ofContract
Flexibility
Other
% respondents
England
Wales
England & Wales

88
Figure 5.7 FBTs - perceived advantages for the tenant 5.23 As far as tenants were concerned, a high percentage of respondents felt that tenants benefitted from an increase in the number of opportunities to rent land (46 per cent; 47 per cent Wales) with an additional 18 per cent (22 per cent Wales) mentioning flexibility, greater clarity of the contract and the ability to negotiate the contract to suit their particular requirements. Respondents also considered benefits from the longer terms offered for FBTs (compared with grazing agreements and Gladstone v Bower agreements of the past) as well as the opportunities for tenants to be granted trial periods with known term lengths. In addition to this, a small number referred to the greater scope for diversifying the farming business and the advantages, generally, of fixed rents. Only 8 per cent of respondents (4 per cent Wales) felt that there were no advantages to tenants from FBTs. Figure 5.8 FBTs - perceived disadvantages for the landlord
0 10 20 30 40 50
Flexibility
More Land
More Secure
Fixed Term
None
For expansion
Other
% respondents
England
Wales
England & Wales
More Paperwork
Less Invest by Tenant
Compensation
None
Tax Schedule
Other
England
Wales
England & Wales

79
5.24 Turning now to the disadvantages, 32 per cent of the respondents (36 per cent Wales) felt that there were no disadvantages for the landlord in FBTs. Those that did see disadvantages highlighted the likely “short termism” in the behaviour of the tenant on short FBTs leading to lower levels of investment in the property by the tenants, bad husbandry and the run down of the property. Allied to this, respondents drew attention to the need for closer monitoring by the landlord as well as the expense and extra paperwork resulting from short FBTs and the higher turnover of tenants. Amongst the other concerns expressed by the respondents, the open-ended nature of the compensation provisions for tenants’ improvements and the tax treatment of FBTs were of greatest importance. Figure 5.9 FBTs - perceived disadvantages for the tenant 5.25 As far as the perceived disadvantages for the tenants were concerned 60 per cent of respondents (also 60 per cent in Wales) commented on the much reduced security of tenure/lack of succession rights i.e. “short terms” and “less/no security”. Within the focus groups, the tenants expressed particular concern and worries over the relationship between existing 1986 Act tenancy agreements and FBTs, tenants being naturally anxious to ensure their
0 5 10 15 20 25 30 35 40 45 50
Less/No Security
High Rents
Short Terms
Rent/Term Fixed
Tenant will not Invest
More Obligations
Different Agreements
Not for New Entrants
Other
% respondents
England
Wales
England & Wales

90
existing protection remained in circumstances where they added adjoining land to their tenancy by way of an FBT. 5.26 Returning to the disadvantages of the new tenure arrangements for the tenant as expressed in the telephone interviews, a further 18 per cent of respondents (10 per cent in Wales) spoke of the high rents currently being experienced. The other responses were fairly well spread across issues such as fixed rents for the term, problems from the range of different agreements being used and, in some cases, concern over greater obligations placed on the tenant under FBTs. Three per cent of the respondents (5 per cent in Wales) mentioned that FBTs were not in fact helping new entrants. The view from the Focus Groups 5.27 Participants in the focus groups felt that landlords had been quick to see the potential short-term benefits of the FBT system. The general perception as to take-up was that the majority of new agreements were-short term agreements on bare land being granted to established farmers - “bigger farmers getting bigger”, a view largely endorsed by the findings from our postal surveys described in chapter 3. These farmers were able to tender high rents, and willing to do so in the light of the external factors affecting agriculture in the mid 1990’s. A number of FBTs were being created as grazing licences or Gladstone v Bower agreements fell for renewal. It was an interesting reflection on the new legislation that as such agreements were renewed as FBTs, they were beginning to reflect the farming needs of the tenant and were not simply restricted to the terms of the old licence agreement. So, as regards grazing licences, instances were related of such agreements becoming enlarged from the traditional 364 day agreement to, for example, as long as two-year or four and a half year tenancies, a view again endorsed by the findings of the postal surveys reported in chapters 3 and 4 of this report. 5.28 There was little doubt that the majority of landlords who were faced with the opportunity of letting land had been quick to take advantage of the short-term commercial advantages offered by FBTs. In particular, the legislation had provided the opportunity to secure exceptionally high rents of “up to £180 per acre” for land, while farm houses were let separately under assured shorthold tenancy agreements thus taking advantage of a strong residential letting market. This second factor was affected by location, there being a particularly strong incentive to let on a residential basis in the south of England. In this case the “traditional pattern of holdings” which was already in decline would continue to be lost - “FBTs have just made it easier”. 5.29 However, a minority of participants in the focus groups held the view that the ability to maintain open market rents under FBTs had encouraged the reaggregation of the farmhouse and

79
the land into complete holdings. It was argued that there was now a new era of letting emerging that would respond to existing “economic forces”. For those who had investigated FBTs they understood “a new commercial reality was abroad”. 5.30 The exception to the above rule was the traditional landlords who viewed it as part of their overall strategy, if not their duty, to let land on a long term basis to provide both continuity and security for their tenants. Those who spoke on behalf of this type of landlord suggested that the change in legislation had been of little immediate consequence, as this particular breed of landlord had not been overly concerned at the protection given to the tenant under the 1986 legislation or even that of 1976, and whatever regime was in place would continue to let on a long-term basis. Encouragement of the greater use of FBTs 5.31 Respondents to the telephone survey were asked to indicate two changes in the current arrangements which would encourage them to either let more land or rent in more land depending on their current situation. Of the 461 respondents asked this question, 55 per cent were only able to suggest one change or said ‘none’. Only 15 per cent were able, or felt it necessary, to give a second suggestion. It should also be noted that of a total of 321 responses, 18 per cent referred to the state of the farming industry as a key determinant of the use of FBTs. This was a broader interpretation of the phrase ‘current arrangements’ than was intended and the remaining 262 responses have therefore been analysed separately according to the three different groups of respondents. It should, perhaps be noted that this question came at the end of, to some, a fairly demanding or time-consuming questionnaire and this may partly be responsible for the shortage of suggestions provided. Landlords and owner occupiers 5.32 Just over a quarter of the responses (27 per cent) came from this group. About a fifth (21 per cent; 10 per cent in Wales) indicated that there was no need to make any changes to the current arrangements. For the others, the main suggestions centred around changes to the taxation regime (25 per cent; 10 per cent in Wales) and changes to the ‘open ended’ provisions for the compensation of tenant’s improvements (15 per cent; 30 per cent in Wales). 5.33 A smaller group (8 per cent) suggested that higher rents would encourage them to let more land under FBTs whilst 7 per cent felt that there was a definite need for assurance that there would be no retrospective changes to the legislation. Other suggestions, made by what will be appreciated as a small proportion of the group, included the availability of incentives to let to new entrants, the simplification of forfeiture law and statutory guidance on repairs.

92
Tenants and mixed tenure farmers 5.34 Over one-third of the responses (38 per cent) came from this group. In this case, only 9 per cent (8 per cent in Wales) indicated that there was no need for changes to the current arrangements. Among the rest there was strong feeling that greater security/longer terms (37 per cent; 31 per cent in Wales) and lower rents (23 per cent; 31 per cent in Wales) would encourage them to rent more land on FBTs. A further 12 per cent felt the need for more opportunities to rent land (8 per cent in Wales) and 5 per cent suggested there should be a simplified rent review formula. The advisers 5.35 Just over one-third (35 per cent) of responses came from this group. Only 4 per cent (0 per cent Wales) indicated that there was no need for change. The largest proportion (30 per cent) of respondents mentioned the need for changes to the tax regime (21 per cent in Wales), whilst 13 per cent (7 per cent in Wales) felt that there was need for the simplification of the rent review provisions and the re-adoption of the ‘old rent formula’. There was concern here over the apparent decoupling of rents from farming incomes. 5.36 A similar proportion (12 per cent) referred to the need generally for longer terms (14 per cent in Wales) and, again, 7 per cent referred to changes to the provisions for compensation of tenant’s improvements in the Act. Incentives to let land to new entrants and the need for a standard agreement were also mentioned by a small number of respondents as desirable improvements to the current arrangements. 5.37 Following this “open” question, respondents were asked to indicate on a scale of 0 (not at all important) to 5 (very important) their views on four possible changes which have been suggested could improve the use of FBTs. Their responses are shown in figures 5.10 to 5.13. Figure 5.10 Perceived importance of a more favourable tax regime to increasing the use of
FBTs
don't know
0'
1'
2'
3'
4'
5'
England
Wales
England &Wales

79
Scale 0=not at all important; 5=very important 5.38 It is clear, from the above figure, that the vast majority of respondents felt that a more favourable tax regime would improve the use of FBTs. Over three-quarters (78 per cent; 71 per cent in Wales) responded with a 3, 4 or 5. This response might have been expected but it does confirm that there are still perceived fiscal constraints on letting land. There were no significant differences between the three respondent groups in their responses to this question. Figure 5.11 Perceived importance of the introduction of a minimum length of term to
increasing the use of FBTs
Scale 0=not at all important; 5=very important 5.39 In complete contrast to the proposal of changes to the tax regime, respondents considered a minimum length of term to be of much less importance in encouraging the use of FBTs. Only 47 per cent chose scores 3,4 and 5 (53 per cent in Wales) and over 25 per cent chose 0, indicating this to be a positive disincentive. Not surprisingly, there were highly significant differences between the three groups here. The tenants were much more in favour of the suggestion of a minimum length of term than were the landlords/owner occupiers and advisers.
0 10 20 30
don't know
0'
1'
2'
3'
4'
5'
% respondents
England
Wales
England & Wales

94
5.40 Discussions in the focus groups also threw some light on this issue. There was a clear reluctance indicated on the part of Landlords to negotiate longer agreements, where the lack of certainty as to matters such as how compensation would unfold was causing concern to all parties. A major local Landlord indicated that he would only let on an annual basis until his concern over compensation provisions had been resolved. There does appear to be a real issue here concerning Compensation for Improvements. Landlords reported in the focus groups that, whereas under the AHA 1986 they were able to give conditional consents, they could no longer do this, which introduced some uncertainty where there had been certainty in the past. This uncertainty has been heightened by the perception of additional complication with non tangible improvements. As a result, one or two of the landlords considered that one of the ways of limiting this uncertainty was to tie up the tenancy agreement such that if the question of consent for improvements was referred to arbitration the agreement would be of maximum assistance to the landlord. This may, therefore be restricting the flexible use of the FBT. Figure 5.12 Perceived importance of the introduction of a rent formula similar to that for
traditional (1986 Act) tenancies to increasing the use of FBTs
Scale 0=not at all important; 5=very important 5.41 Figure 5.12 shows the reaction to the importance of the introduction of a rent formula. In common with the response above, only 45 per cent (41 per cent in Wales) selected scores 3,4 and 5 and again over 25 per cent selected score 0 indicating much less enthusiasm for such a change. Again, there were highly significant differences here between the three groups, with the tenants very much more in favour of a rent formula than the other two groups. However, in the focus groups a view was expressed jointly by both landlords and tenants that they would consider it an advantage to be able to invoke the 1986 rent formula if they so wished.
0 5 10 15 20 25 30
don't know
0'
1'
2'
3'
4'
5'
% respondents
England
Wales
England & Wales

79
5.42 Figure 5.13 shows the responses to the question of how important statutory fallback positions would be in encouraging the use of FBTs. Following the responses to the previous two suggested changes, respondents were very evenly split with 46 per cent selecting scores 3,4 and 5 (48 per cent Wales) and 47 per cent in the lower grades (37 per cent Wales). There were highly significant differences between the three respondent groups with the tenants much more positive than the landlords/owner occupiers and advisers. Figure 5.13 Perceived importance of the introduction of more statutory fall back provisions
to increasing the use of FBTs
Scale 0=not at all important; 5=very important
0 5 10 15 20 25
don't know
0'
1'
2'
3'
4'
5'
% respondents
England
Wales
England & Wales

96

97
CHAPTER 6 MEASURING THE IMPACT OF FARM BUSINESS TENANCIES
Introduction 6.1 This chapter draws mainly on the telephone survey and focus groups as well as the analysis of data from the annual Farm Business Survey. It provides a preliminary analysis of the impact of the 1995 Act in terms of its pre-specified aims and its impact on the economic efficiency of agricultural land-use. We regard the assessment of whether the Act has achieved its pre-specified aims as a validation issue while the broader question of whether the Act has increased the economic efficiency of land-use constitutes its evaluation. Neither the process of validation nor that of evaluation is simple since it is important to attempt to distinguish the effect of the 1995 Act from the effect of other factors (such as the level of product prices) prevailing over the same time-period. 6.2 In considering the economic evaluation of the impact of the Act, it is important at the outset to recognise the relevance of a number of different perspectives. While noting that the present project had very limited objectives in terms of the formal measurement of the economic impact of the 1995 Act, some of the fundamental principles behind the measurement of economic efficiency need to be recognised. 6.3 Economic efficiency is primarily concerned with the use made of scarce resources, particularly land, labour and capital in producing outputs which derive their value from the human utility generated by their consumption. If the same amount of resources could be used in an alternative manner and generate a greater amount of human utility then their use is in this sense inefficient. 6.4 One perspective for evaluating economic efficiency focuses on the individuals who own the resources, perhaps the landlord who owns the land or the tenant who provides the capital and labour which enables that land to generate outputs. The efficiency with which the resources are used will be measured primarily in terms of the profits generated by the respective activities of these individuals in letting land and in farming it. Where external constraints are placed on the actions of either or both parties, the effect may be to change the distribution of the profits between them. But it may also reduce the total level of profit from their joint activity by introducing rigidities into the market so that potential tenants (who could generate a higher marginal return from additional land and would be willing to rent it on a short-term basis) are unable to do so because of the landowner’s reluctance to let it on the long-term basis prescribed by law. In measuring the impact of a change in legislation which reduces or eliminates this rigidity in the market, the economist will tend to focus on this latter

98
question i.e. whether there has been a change in the combined profits of the joint activities of letting and renting the land. 6.5 However, it is important to recognise another perspective when considering the question of economic efficiency. This takes into account the interests of a much wider group, and seeks to measure the net benefit to Society of the change in resource use that results from increasing the flexibility of the land market. There are at least two key differences between the economic evaluation from this wider perspective and the evaluation described in the previous paragraphs. 6.6 In the first place, more attention will be paid to the impact of the new arrangements on the non-traded products of the resulting economic activity. There may, for example, be a change in the environmental goods (or bads) produced by the different pattern of resource use that results from the increased flexibility in the operation of the market for rented land. Secondly, inasfar as considerations of equity enter into the utility functions of the individuals that comprise the wider Society, more attention may be paid to the distribution of the increased (reduced) economic surplus between different individuals and groups in Society (including of course, between the landlord and the tenant). 6.7 A final issue is the time-scale over which the resulting changes in efficiency are evaluated, for there may be a significant difference in the short, medium and long-term impact of the change with landowners, tenants and Society all applying different discount rates to the values of both the traded and the non-traded products generated by the land in the future. For example, if land is regarded as a non-renewable resource, the “sustainability” of land-use practices encouraged by the new tenure arrangements will become a relevant issue. 6.8 While the above discussion provides the basis of a theoretical framework for the longer-term economic evaluation of the 1995 Act, it should be recognised that the present study concentrated on the perspectives of the landlord, the tenants and their advisers. We first gathered information on their views of whether the Act was achieving its aims (i.e. the validation issue) and what its likely economic impact would be. We then explored the criteria by which they believe its success (or otherwise) should be judged. Finally, we drew together baseline data on one issue which is likely to be central to the future economic evaluation of the Act, namely its effect on investment in buildings, improvements and fixed equipment on tenanted farms. Using data from the annual Farm Business Survey we explored the differences between levels of investment on wholly tenanted farms and wholly owner-occupied farms prior to the 1995 legislation. At the same time we asked both the landlords/owner occupiers and the tenants contacted in our telephone survey about their future investment intentions.
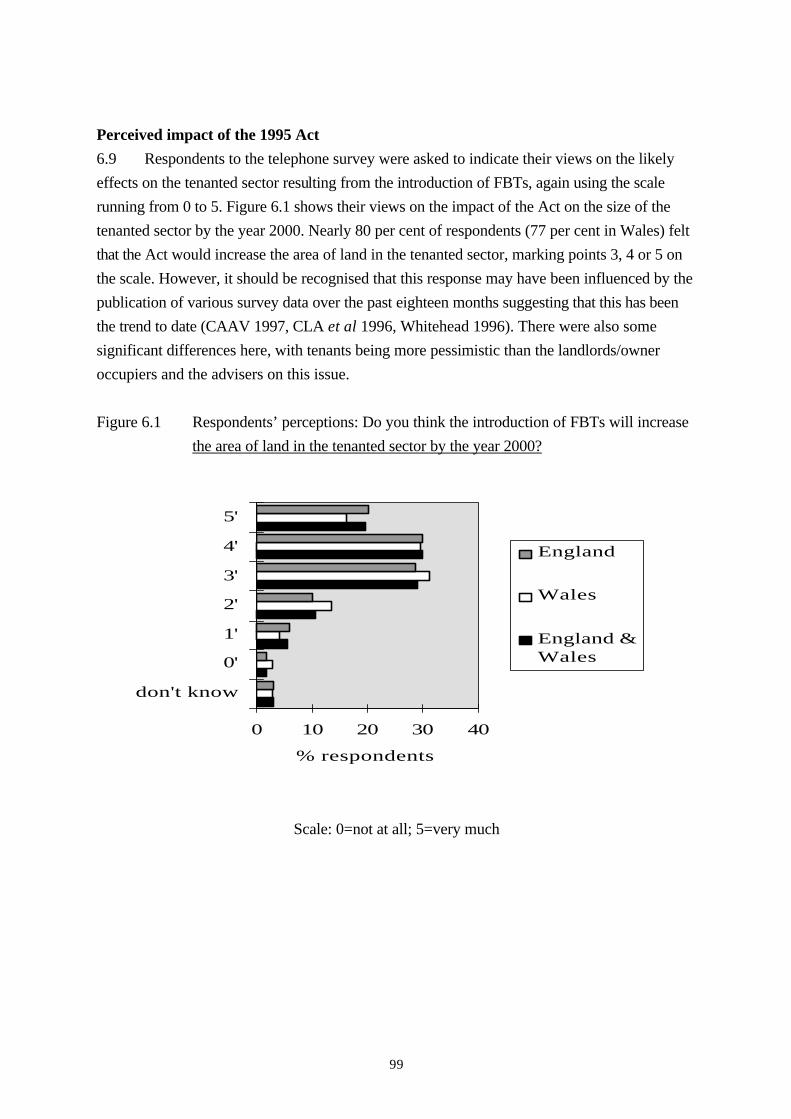
99
Perceived impact of the 1995 Act 6.9 Respondents to the telephone survey were asked to indicate their views on the likely effects on the tenanted sector resulting from the introduction of FBTs, again using the scale running from 0 to 5. Figure 6.1 shows their views on the impact of the Act on the size of the tenanted sector by the year 2000. Nearly 80 per cent of respondents (77 per cent in Wales) felt that the Act would increase the area of land in the tenanted sector, marking points 3, 4 or 5 on the scale. However, it should be recognised that this response may have been influenced by the publication of various survey data over the past eighteen months suggesting that this has been the trend to date (CAAV 1997, CLA et al 1996, Whitehead 1996). There were also some significant differences here, with tenants being more pessimistic than the landlords/owner occupiers and the advisers on this issue. Figure 6.1 Respondents’ perceptions: Do you think the introduction of FBTs will increase
the area of land in the tenanted sector by the year 2000?
Scale: 0=not at all; 5=very much
0 10 20 30 40
don't know
0'
1'
2'
3'
4'
5'
% respondents
England
Wales
England &Wales

100
Figure 6.2 Respondents’ perceptions: Do you think the introduction of FBTs will create new opportunities for new entrants into farming by the year 2000?
Scale: 0=not at all; 5=very much
6.10 The response concerning new entrants (see figure 6.2) was a great deal less positive than the response to the previous question. Only 52 per cent (50 per cent in Wales) allocated a score of 3,4 or 5. There were no significant differences between the three respondent groups. Figure 6.3 Respondents’ perceptions: How do you think the introduction of FBTs will
affect the rural environment?
Scale: 0=very harmful; 5=very beneficial 6.11 Just over two-thirds of the respondents (68 per cent; 66 per cent in Wales) marked grades 3,4 or 5 clearly indicating the view that the introduction of FBTs would not have a harmful impact on the rural environment. It should be noted, however, that 49 per cent of
0 10 20 30
don't know
0'
1'
2'
3'
4'
5'
% respondents
England
Wales
England &Wales
0 10 20 30 40 50 60
don't know
0'
1'
2'
3'
4'
5'
% respondents
England
Wales
England & Wales

101
responses (45 per cent in Wales) were only scored grade 3 indicating some level of uncertainty about this. There were again no significant differences between the three respondent groups. 6.12 Participants in the focus groups were more pessimistic. The move towards shorter agreements and higher rents was causing concern as to how tenants might approach the management of the land. Under such pressure it was suggested that “degradation of the land” might occur, as the overriding consideration would be the ability to pay the rent rather than manage the land for the long term benefit of the tenant. This process, it was suggested, had been visible, prior to FBTs, in the way in which Gladstone v Bower agreements had been managed. Figure 6.4 Respondents’ perceptions:What effect do you consider that the introduction of
FBTs will have on Landlords’ long-term investment in their farms?
Scale: 0=much less investment; 5=much greater investment
6.13 The respondents, as a group, reacted positively to the suggestion that the introduction of FBTs might lead to greater long-term investment by landlords, with 70 per cent (62 per cent in Wales) marking grades 3,4 or 5. In common with the rural environment issue, however, the response is very much towards the centre of the range indicating, again, a fair degree of uncertainty. There were no significant differences between the three respondent groups. 6.14 Respondents were asked the reasons for their view. Among those who felt that landlords’ investment would increase, the largest proportion (19 per cent; 16 per cent in Wales) said it was because of the encouragement provided by the current high level of rents. The ability for the landlord to control when possession was regained also featured highly for those who felt that investment would greater (16 per cent; 15 per cent in Wales). However, 13 per cent of respondents (12 per cent in Wales) indicated ‘no change’ to landlords’ long term investment in their farms.
0 10 20 30 40 50
don't know
0'
1'
2'
3'
4'
5'
% respondents
England
Wales
England & Wales

102
6.15 The lack of any need for landlords to invest, with current high demand and high rents, the view that landlords would ‘make the tenant’ carry out any investment and the short-term nature of the agreements were noted as reasons from those who felt that landlords' investments would be less in the future. 6.16 Clearly, the possible diverging responses to the currently high rental levels, as well as other factors such as the flexibility of the contract, the compensation provisions of the Act and the shorter term of FBTs, all complicate the issue of investment by landlords. Figure 6.5 Respondents’ perceptions:What effect do you consider that the introduction of
FBTs will have on tenants’ long-term investment in their farms?
Scale: 0=much less investment; 5=much greater investment 6.17 In contrast with the response concerning landlords’ investment, only 42 per cent of respondents (49 per cent in Wales) marked grades 3,4 or 5 when asked about the impact of the introduction of FBTs on tenants’ investment in their farms. There were no significant differences between the three respondent groups. 6.18 When asked for reasons, 69 per cent of the respondents (64 per cent in Wales) referred to the relationship between the tenant’s investment and term length with 42 per cent (36 per cent in Wales) indicating that investment would be less because of shorter terms and reduced security. Of the other responses, the varying requirements of the agreement, the compensation provisions of the Act and the need for investment to remain competitive were highlighted as of importance.
0 5 10 15 20 25 30 35
don't know
0'
1'
2'
3'
4'
5'
% respondents
England
Wales
England & Wales

103
6.19 Overall, the response is most likely a reaction to the shorter term of FBTs being granted as well as the level of rents and some degree of uncertainty over future incomes in agriculture. This view was endorsed by the focus groups. Short term agreements, a characteristic of present FBTs, would, it was suggested, be a major limiting factor in a tenant’s decision to invest, “Tenants aren’t going to invest in short term agreements”. 6.20 Some participants in the focus groups suggested that the new breed of FBT tenant farmer, the person extending their holding from an existing base, would make any investment in the ‘home farm’ rather than the land let on a new FBT. Tenants’ actual investment intentions 6.21 Subsequent questions addressed to tenants currently renting FBTs asked them directly about their investment intentions on the FBT land: “Over the next 2-3 years, do you plan to construct any buildings on or make any improvements in the land under the FBT?” Of the 86 farmers who were involved in renting in land under a FBT, 35 per cent said they were planning to make improvements to the buildings or the land held under the FBT (31 per cent in Wales). It was noticeable that 63 per cent of those indicating an intention to invest concerned tenancies of 5 years and under. When asked to provide details, it was found that 23 per cent involved liming, 15 per cent involved fencing, 13 per cent building and the remainder were split between drainage, concreting, reseeding and conservation works. Criteria for judging the economic efficiency of FBTs 6.22 Each focus group was asked what they considered would be an appropriate method for measuring the economic efficiency of FBTs. This proved a hard task for each group irrespective of the perspective they brought to the general discussion with many mentioning the complex intimate relationships between economic factors and the difficulty in specifically isolating the effects of FBTs. The ideas that emerged are as follows: 1. Number of FBTs coming onto the market representing completely new land rather than replacing an existing agreement. 2. Confidence in the use of FBTs. 3. Ability of FBTs to respond to market needs while providing a secure farming base. 4. Ability to create FBTs with a minimum of bureaucratic process. 5. Ability of FBTs to maintain sustainable farming practices. 6. Ability of FBTs to meet the needs of the industry as a whole - established farmers and new entrants. 7. Ability of FBTs to meet the needs of the varying sectors of the agricultural industry e.g.

104
arable, dairy and livestock. 8. Ability to deal successfully with aspects of diversification. 9. Ability to deal effectively and efficiently with disputes as they arise. While it is clear that some of these factors will be very difficult to measure it is interesting to note the perceptions of those involved in various aspects of the operation of the 1995 Act. Investment on farms 6.23 One of the most significant unresolved questions about FBTs concerns their impact on investment within the agricultural sector. A principal economic argument advanced in favour of longer-term security of tenure has been that, whatever compensation arrangements are made, tenants are unlikely to invest in buildings, improvements and fixed equipment when satisfactory returns accrue only over a period longer than the term of their rental agreement. Shorter term agreements, it is argued, reduce planning and investment horizons which in turn reduce the level of productive investment in agriculture. From the point of view of the landlord encouraged by a tenant to make a long-term investment in specialist buildings or fixed equipment, a similar argument may apply, particularly in periods of uncertainty over the profitability of particular farm enterprises. Longer-term agreements provide the opportunity for the landlord to recoup his investment through the farm rent; in a weak letting market incoming tenants replacing an outgoing tenant for whom the investment was made may be unwilling to pay a rent which incorporates the full value of specialist buildings or fixed equipment. 6.24 The presumption of this argument is that rates of investment on owner-occupied and rented farms will begin to diverge further, following the 1995 Act. One objective of the present project was therefore to measure levels of investment prior to the Act so that the differential between investment levels on rented and owner-occupied farms could be compared both before, and some years after the Act. The fact that this analysis focuses on the differential between investment rates is crucial. Many factors affect investment levels in farming, not least the varying returns to that investment resulting from changing levels of price support and the real cost of capital. Thus, many different factors might lead to lower (or indeed higher) rates of investment on FBT farms1. 6.25 As explained in chapter 2, the year 1990 was chosen for this baseline analysis as it is possible that subsequent investment decisions were influenced by expectations regarding forthcoming changes in tenurial arrangements. Data was obtained from the Farm Business Survey (see para 2.6, above) on annual investment in the following items: 1 It will be recognised that this argument is clearest where it relates to farms that are wholly owner-occupied as against those that are wholly tenanted. Where buildings and fixed equipment are concerned, a variant of the argument would relate to the location of investment within a mixed-tenure farm. It is more likely to be located on the owner-occupied land when the rented land is on a shorter-term let

105
• Livestock buildings (10 years or more) • Crop buildings (10 years or more) • Other buildings (10 years or more) • Mole drainage • Tile drainage • Other improvements, works and services • Machinery • Glasshouses • Permanent crops Information is also available about the sources of funding for each of these investments. In the case of the first six items, a distinction is made between that coming from tenants, from occupiers and from grants. Landlord investment is also included but that tends to be a relatively small amount. Table 6.1 Farms in the FBS sample: proportion of land rented
Proportion of land rented
% of observations
None 44.2
>0<25% 14.2
25<75% 13.5
75<100% 8.4
All 19.7
6.26 Our analysis compared investments per hectare of Utilised Agricultural Area (UAA) on different types of farm within the unweighted sample. In each case the farms are divided into categories according to tenure. Table 6.1 shows the distribution of farms according to the proportion of land rented. 6.27 A comparison was made in the total investment in the different categories between different types of farm. However, because there might be correlation between type of tenure and farm size and type which would distort the analysis, a preliminary examination of each robust farm-type first established whether this was the case. In the event, the difference between the mean UAA of the farms for all robust farm-types apart from LFA Livestock was not statistically significant at the 5% level and a direct comparison was therefore made between investment patterns on those farms that were wholly rented and those that were wholly owner-occupied. Where the LFA Livestock farms were concerned, the initial examination

106
showed that those that were wholly rented were significantly larger (mean = 223 ha) compared with those with no rented land (mean = 165 ha). It was therefore judged inappropriate to make the comparisons on the basis of the whole sample. Farms in the mid-range 50 > 200 ha were first selected. These comprised 62 per cent of the wholly rented farms and 63 per cent of those without any rented land. The difference in the mean size of the farms in these two sub-samples was not statistically significant. We then proceeded to make the usual comparisons of investment patterns. Results 6.28 Tables 6.2 and 6.3 illustrate the nature of this analysis, showing the results for cereals and dairy farms. (The full results are to be found in Appendix 5.) In the case of the cereals farms, the preliminary examination of the data showed that there was no need to control for farm-size since the size distribution of those with land all rented (mean = 187.8 ha) and those with no rented land (mean = 175.8 ha) was not significantly different at the 5% level. In the case of the dairy farms the mean areas were again not statistically different (72.3 ha vs 74.5 ha). Table 6.2 A comparison of annual investments 1989/91: Cereals Farms
Tenure Type
Wholly owner-occupied (N=362)
Wholly rented (N=185)
Mean £/ha
Std Dev £/ha
Mean £/ha
Std Dev £/ha
T-test*
Livestock buildings 3.23 22.05 0.68 4.84 n.s.
Crop buildings 1.44 14.24 0.44 3.05 n.s.
Other buildings 11.29 45.61 4.69 42.09 n.s.
Mole drainage 0.27 5.07 0.00 - n.s.

107
Tile drainage 1.37 11.20 0.11 1.46 n.s.
Other improvements 4.08 30.29 0.46 3.12 n.s. All buildings & improvements
21.68 62.23 6.37 42.41 **
Machinery 99.56 138.49 80.62 94.42 n.s. *In this and the following tables, t-test results for the comparison of means are shown to be not significantly different (n.s.) at less than the 5% level; significantly different at less than the 5% level (*); significantly different at less than the 1% level.
Table 6.3 A comparison of annual investments 1989/91: Dairy Farms
Wholly owner-occupied (N=562)
Wholly rented (N=251)
T-test
Mean £/ha
Std Dev £/ha
Mean £/ha
Std Dev £/ha
Livestock buildings 45.55 192.28 18.52 56.96 *
Crop buildings 5.52 46.72 3.91 38.41 n.s.
Other buildings 24.81 175.85 9.64 45.56 n.s.
Mole drainage 1.63 13.38 0.00 - n.s.
Tile drainage 2.38 17.95 0.39 3.31 n.s.
Other improvements 44.33 147.38 15.80 52.55 **
All buildings & improvements
124.23 436.94 48.25 101.06 **
Machinery 146.26 152.83 138.05 164.48 n.s.
6.29 Taking all the results into account (including those for the robust farm-types shown in Appendix 5) our analysis showed that there are few differences in the detailed investment patterns of wholly tenanted and wholly owner-occupied farms that are statistically significant at the 5% level or below. However, in the case of all types of farm, machinery investments are very similar and the total investment in buildings and improvements is significantly different. Table 6.4 Tenanted and owner-occupied farms 1989/91: A comparison of investment patterns

108
Machinery investment All buildings and improvements
Farm Type Wholly owner-
occupied
Wholly rented
Wholly owner-
occupied
Wholly rented
Cereals 100 80.9 100 29.4
General cropping 100 96.4 100 30.3
Dairy 100 94.4 100 38.8
LFA cattle & sheep 100 93.0 100 54.2
Lowland cattle & sheep 100 44.7* 100 49.7
Mixed 100 100.5 100 64.1
* this figure is distorted by the presence of three outliers registering £3K, £6K and £7K investment per hectare; when they are removed from the calculation of the mean, the index for this sub-group of farms is 78.7 6.30 As table 6.4 shows, investment in machinery is very similar and, given the large variability between farms is, as previous tables have shown, not significantly different between tenanted and non-tenanted farms. However, investment in buildings and other improvements tends to be very much lower on wholly tenanted farms, varying from less than a third where cropping farms are concerned to nearly two-thirds for mixed farms. The key feature to examine in assessing the longer-term impact of the 1995 Act is whether these differentials increase. Conclusion 6.31 With reference to figure 6.1 it is apparent from the telephone survey that a high percentage of respondents were optimistic about the effect of the introduction of FBTs on the overall size of the tenanted sector. The analysis of investment in buildings and improvements on tenanted and owner occupied farms in 1989/91 (Table 6.4) clearly indicates that investment is substantially lower for all rented farms when compared with non rented farms. One might hypothesize, therefore, that the increase in the size of the tenanted sector as a result of the introduction of FBTs will result in a reduction in investment in buildings and improvements in farming overall. 6.32 Turning back to FBTs under the ATA1995, it seems clear from the telephone survey that respondents were more optimistic about improvements in the level of landlord’s investment as a result of the introduction of FBTs than they were about the level of tenant’s investment. It is unlikely that tenants will invest where their agreement is short term and it is noticeable that only 22% of tenants when asked about their intention to make improvements to buildings or land, and responding positively, had tenancy agreements of 5 years and under. These would most probably also include annual tenancies where the tenants perceive a much

109
longer tenancy than the initial term. The added pressures of high rents will also reduce the probability of investment by tenants on FBT holdings. 6.33 Pre 1995, landlords may have been constrained by shortage of capital (cash) and the poor return on investment from, and a natural disinclination to invest in, such improvements. Post 1995 the situation for investors is not a great deal better with probably no increase in return on capital resulting from higher rents because of increases in land values. One could suggest, further, that the continuing high demand for tenancies and the more flexible agreements will lead to a reduction in landlord’s investment in improvements with FBTs in the future. The character and objectives of the landlord will remain a key determining factor.

110

111
CHAPTER 7 CONCLUSIONS AND IMPLICATIONS
Introduction 7.1 This preliminary evaluation of the 1995 Agricultural Tenancies Act has largely focused on the first year of its operation. It has sought to determine whether it has achieved its primary aims and to establish a baseline for the future evaluation of the medium/longer term economic impact of the Act. This chapter draws together the main conclusions of our study and highlights a number of implications. In terms of measuring the impact of a major piece of legislation which was planned to have a substantial effect on the agricultural sector, it is important to recognise that we are still in the very early days and the particular circumstances of this first year may have influenced the picture emerging. Increased flexibility 7.2 It is clear that the Act has increased the flexibility of rental agreements themselves, particularly with regard to the term of the let. Though agreements on land in England that had formerly been let under AHA 1986 Tenancies included some that were over 20 years, the mean length for those agreements was 6 years and five months, and the median 3 years. On the other hand, the more flexible arrangements appear to have lengthened the term of lettings on land that was formerly in short-term agreements such as Gladstone v Bower and Grazing Licences. In England, for example, we found that FBTs following on from the former had a mean term of 3 years and those following on from the latter had a mean term of 2 years and four months. The median in both cases was two years. 7.3 The Act has also increased the flexibility of the operation of the market for let land by increasing the options open to landowners and tenants. For some landowners, particularly in those parts of the country where the demand for residential lets in the countryside is strong, the new arrangements provide the opportunity to let some or all of their land in an FBT while placing the farmhouse in the residential market. For others, this same facility enables them to retire to their farmhouse while letting the land in a manner which leaves it in their own control. 7.4 Flexibility has also allowed owners to introduce specific conditions within the agreement. For example, our survey of the detail of over 200 agreements showed that 19 per cent had “specific requirements largely concerning environment conservation”, with the proportion rising to 30 per cent on longer-term agreements (of 10 years or more). Another example of the greater flexibility of the agreements relates to the method for settling disputes. While just over one-third (37 per cent) provided for arbitration on all disputes, 47 per cent included reference to an “Independent Expert” in the first instance.

112
The size of the let sector 7.5 Another major objective of the 1995 Act was to increase the size of the let sector by bringing in land that had formerly been farmed in-hand. Excluding FBTs used in conjunction with milk quota sales or other quota arrangements, we estimate that, in England and Wales, about 5,000 FBTs were created in the first year of the Act, covering about 200,000 hectares. This represents a substantial amount of activity, involving almost 6 per cent of the land currently rented. Of particular importance is the fact that up to 25,000 hectares of this land was previously farmed “in-hand”. In the context of the relatively high levels of profitability from in-hand farming during this period this is a significant achievement, suggesting that the new legislation does have the potential to slow the rate of decrease of the let sector. We conclude that the 1995 Act does appear to have achieved its primary objective of bringing new land into the rented sector though it as yet too early to establish whether it will reverse the long-term decline in this sector. 7.6 The amount of letting activity and the level of rents on FBTs suggest that in the present economic climate there is still excess demand for rented land and we would expect the growing amount of activity in the market for FBTs to continue for some time. The future increase in FBTs 7.7 The views of landlords and owner-occupiers covered both in the telephone survey and the focus groups support this view. While some have adopted a cautious “wait and see” approach, many are expecting to increase the amount of land they let. For example, in their responses to the telephone survey, 32 per cent of the landowners/owner occupiers in England (29 per cent in Wales) said that they intended to increase the amount of land they let in the future while 40 per cent (45 per cent in Wales) said that they intended to invest in more land with a view to letting it under FBTs. 7.8 It is, however, important to recognise that the new legislation will take a very long time to have its full effect because the vast majority of let land is still held under AHA 1986 agreements and it will be many years before it becomes available for letting under the new arrangements. 7.9 We have not identified any major constraints on the uptake of FBTs. Levels of awareness are generally high (particularly among landowners and their professional advisers). This has much to do with the very large amount of publicity given by the farming press and the professional organisations to the discussion, the eventual passage and the implementation of the legislation. In terms of the agreements themselves we were surprised that the concern about lack

113
of clarity over compensation provisions which we found among some focus group members was not encountered more frequently in our telephone interviews; likewise the potential problem of “farm diversification” did not emerge as an issue in either the focus groups or during the telephone survey despite the fact that our detailed analysis of a sample of existing agreements reported in chapter 4 showed that 95 per cent of the agreements restricted the business on the FBT to agricultural activities only. 7.10 Recognising that the main constraint is still on the supply side, the views of the landowners/owner occupiers expressed in the telephone survey are of particular interest. When asked what changes would encourage them to let more land, one-fifth said there were none. Among the remainder, the largest proportion mentioned tax changes. Understanding the Act 7.11 While the levels of awareness of FBTs are high, the market is strong and there are few obvious constraints on the further expansion of FBTs, the poorer levels of understanding of the new legislation give some cause for concern, particularly where a lack of understanding extends to those who have already entered into FBTs. Both the telephone surveys and the focus group meetings suggest that there are cases where either or both parties are unaware of some of the fundamental differences between FBTs and previous rental agreements e.g. the fact that the rent is agreed and, in the absence of break clauses and where there is express provision in the agreement for no rent reviews, the tenant will be required to pay the rent whether in profitable occupation or not. (Our detailed analysis of existing agreements showed that 26 per cent made express provision for no rent reviews, though many of these FBTs were of course for quite short terms.) In these circumstances there may be a case for a statutory requirement to serve notice of an FBT on lines similar to that which was, until recently, required for an assured shorthold tenancy in the residential sector. The notice would highlight the key features of FBTs. 7.12 We consider that the provision for an additional statutory notice should be reconsidered. Anecdotal evidence suggests that the present notice condition is complied with in a high proportion of cases and this would therefore be an extension of current good practice. We offer a suggestion that in cases of agreements where there is no such notice served, i.e. for oral agreements, where the initial term is more than two years, the tenant could serve twelve months notice to quit, the tenancy terminating on the anniversary of the term date. New entrants 7.13 The majority of the FBTs let in the first year of the Act were of bare land only; the majority were quite small (less than 25 hectares); the majority were of arable or mixed arable and livestock type; the vast majority of tenants were established farmers. Perhaps the largest

114
immediate impact of the Act has been to “free up” the market for what might be termed “the marginal acres” - those extra acres rented in order to enlarge the farm, spread some of the farm’s fixed costs and thus increase profitability. In this respect the Act has had most impact on arable or mixed farms in the east of England. 7.14 While the FBTs let in the first year of the Act have provided some land for new entrants - perhaps 18,000 hectares in England and 2,500 hectares in Wales - we share the pessimism expressed in the focus groups about the Act’s ability to achieve the objective of enabling more new entrants to gain a foothold in the industry. Though the availability of land is clearly important and our postal survey again underlines the role of the County Farms in this respect, the lack of financial resources is the bigger obstacle. The market for let land is at present very strong and highly competitive. As a result, rents are high. At the same time, most private landlords tend to let to established farmers and most bank managers tend to lend to established businesses who are more likely to meet the criteria for lending adopted by the major banks. While the increased flexibility of the market for let land should increase the amount of land available for rent and provide the opportunity for landowners to protect their position by entering what are effectively “probationary” agreements with new entrants, the 1995 Act in itself is unlikely to improve the opportunities for new entrants in the foreseeable future. Criteria for judging the success of the 1995 Act 7.15 We recognise the difficulties of isolating the effects of the 1995 Act from other factors that affect the industry, such as the reform of the Common Agricultural Policy. It is nevertheless vital that the medium and longer-term impact of the Act is carefully monitored over the coming years. We suggest that the main yardsticks by which the success of the Act should be judged are: 1. The size of the tenanted sector - the proportion of farmland that is rented rather than owned; the number of wholly or mainly tenanted farms. 2. The number (and area) of FBTs coming onto the market on land that was previously farmed in-hand rather than replacing an existing agreement. 3. The term of FBTs granted. 4. The extent to which FBTs are let to new entrants as well as to established farmers. 5. The extent to which FBTs are meeting the needs of the varying sectors of the agricultural industry e.g. arable, dairy and livestock. 6. Trends in investment in farm land with a view to let. 7. Trends in investment in buildings and fixed equipment on farms that are (a)
owner-occupied (b) mainly rented (1986 AHA tenancies), and (c) mainly rented (FBTs).
8. The transactions costs1 associated with the letting and renting of land using FBTs.
1 One advantage of the new arrangements is that they are likely to lead both landowners and tenants to a more critical evaluation of the economic costs and benefits of their rental agreements. As such, the

115
9. The level of FBT rents. 7.16 MAFF has traditionally monitored many of these key indicators and either by the use of existing data or relatively minor adjustments to existing censuses and surveys it should be possible to monitor them over the coming years. The move towards the more flexible agreements embodied in FBTs does make the task of monitoring meaningful farmland rents more difficult. In many respects the AHA 1986 Agreement was a ‘standard package’ for which price information (i.e. the rent), including its regional variation, could be provided in a meaningful way. Plainly, the essence of FBTs is that they are non-standard. In order to provide useful information, MAFF might consider providing information on a matrix of rents as shown in table 7.1. Our findings on the relationship between current rent and term of agreement suggest that it would also be useful to present information on rents categorised by three lengths of term, namely one year or less; greater than one but less than five years; five years or more. Table 7.1 A possible typology of FBTs for monitoring indicative rents
Robust Farm-type
FBT Type Cereals Dairy Cattle and Sheep
LFA Cattle and
Sheep Lowland Bare land Land + farm buildings
Land + farm buildings + house
Endpiece 7.17 This project has sought to gather information on the outcomes of the 1995 Agricultural Tenancies Act from a wide range of sources and from a wide variety of participants within the industry will become more “professionalised”, the participants will become more conscious of the economic implications of their decisions with beneficial effects on the efficiency with which agricultural land is used. However, the additional time and effort that this decision-making process requires highlights the “transactions costs” involved in negotiating and enforcing individually-tailored agreements. These costs need to be taken into account when evaluating the net economic impact of the new legislation.

116
industry. In the course of the project we have gathered the impression that many of those involved, whether tenants or potential tenants, landlords or potential landlords, or the professionals who advise them, recognise that it will take time for the full implications of the new legislation to emerge. As the report on the focus group meetings concluded:
“The discussions in the focus groups suggested that, in general, the landowners and tenants had fewer anxieties than their legal advisers. Areas of possible difficulty and conflict had been identified and all participants were awaiting the march of time to see if they would in fact materialise and if so how they might be resolved.”

117
************************** Focus group: Other devices designed to avoid the 1986 legislation were also being reconsidered in the light of FBTs, although Contract Farming, in particular, was seen as retaining a relevant role in spite of the new tenancy legislation. Conclusion:
A general caution towards FBTs was expressed in terms of the complexity of the agreement and brevity of the term, although the impression was that the larger landowners and the younger tenants had adopted the most positive and innovative attitude towards FBTs. ********************************* May be that particular types of letting have greatest economic advantages, especially when viewed in terms of national interest rather than simply landlords or tenants (though there are issues of fairness and equity here); hence implies involvement of government to turn balance of advantage for particular types of situation. e.g for new entrant - analysis of problem would not lead to resolution through reform of land tenure system - direct support via County Councils or incentives; financial encouragements; quota pool etc. ****************************************************** Its about use of resources - land, labour (i.e. time) and capital Economic efficiency from whose viewpoint? Tenant - must include investment; short-termism; transactions costs Landowner - must include investment; short-termism; transactions costs Society - must include distributional effects; winners and losers; net effect on welfare if benefits are loaded towards particular localities; types of farm (eg arable vs livestock); types of farmer (established vs new entrant; larger vs smaller) - must include environemental impacts esp if Agri-environment schemes increase and UK is major potential beneficiary
118
• next criteria. • New land - increase let sector (but we have no net figures); or slow decline in let sector. • New entrants - numbers - but whom? Farmer lets to son? (age? - but farm may be controlled by child even though father answers Q) • Bureaucratic burden/transactions costs - negotiation and enforcement ****************************** Focus groups Constraints on the uptake of FBTs: The Advisers Approach
Those advising on FBTs, especially lawyers had, it appeared, approached the matter with quite a considerable degree of caution. While the words and phrases such as ‘flexible agreement’ and ‘agreements tailored to your own needs’ indicated to the layman a system free of artificial legislative constraints, to the lawyer it represented unforeseen pitfalls created by individual factual situations; references to dusty common law principles and possible reliance on complex procedures such as forfeiture. As a result tenancy agreements had become overly complex with one principle that was adhered to being stated as “ if in doubt put it in.” ********************************* • Performance of farms: OO, 1984/76 AHA, FBTs. But FBT parts of mixed tenure or even rented farms??? Need data to identify. ?FBS, but numbers; June census to identify sample for study. Distinguish marginal increase/bare land vs land/buildings vs land/buildings and house. (But how many true wholly tenanted farms are there?). Consider Mixed tenure group cf Ruth and Berkeley.

References
CAAV (1997) Annual tenanted farms survey, Coleford, Glos: CAAV. CLA, Williams N and Stubbs M (1996) CLA Farm Business Tenancy Surveys 1996, London: Country Landowners Association. DoE/MAFF (1995) Rural England Cmnd 3016, London: HMSO. Errington A J, Giles A K and Oakley P (1987) Getting Started in Farming, The University of Reading Farm Management Unit Study No.15 Hill B and Gasson R M (1984) Farm Tenure and Performance Wye: Wye College School of Rural Economics. Kerr J (1994) Farm Business Tenancies: New farms and land 1995-97, London: RICS. MAFF (1968) A century of agricultural statistics, London: HMSO MAFF (1995) June Census PSM Statements, York: MAFF. MAFF (1996) Farm incomes in the United Kingdom 1994/95, London: HMSO. Warren M F, Whitehead I R G, Felton T J and Brunt P R (1995) County farms past, present and future, The University of Plymouth: Department of Land-use and Rural Management. Whitehead I (1996) Farm Business Tenancy survey 1996, London: RICS. Winter M, Richardson C, Short C, and Watkins C (1990) Agricultural land tenure in England and Wales, London: RICS.

APPENDIX 1
A COMPARISON OF THE MAIN FEATURES OF THE AGRICULTURAL HOLDINGS ACT 1986 AND THE AGRICULTURAL TENANCIES ACT 1995
AGRICULTURAL HOLDINGS ACT 1986
AGRICULTURAL TENANCIES ACT 1995
Term Fixed terms only available with
Ministerial consent on terms of 2-5 years. Retirement tenancies
only applicable to County Council Smallholdings.
Unspecified terms or terms over 2 years automatically convert to secure tenancies only determined on death of
tenant or, in limited specified cases by Notice To Quit.
Parties free to agree any length of tenancy determinable either at term date or past term date by 12 month
incontestable Notice To Quit.
Break Clauses Unenforceable under the 1986
Act. Enforceable under the 1995 Act.
Succession Statutory provision for
succession on tenancies commencing prior to 12 July
1984 available on death or retirement of tenant to eligible,
experienced close relatives subject to viability of the
holding.
No statutory succession.
Rent Reviews Parties free to seek reviews at 3
yearly intervals. Review under statutory code, having regard to comparable lettings, productive and related earning capacity and
disregarding scarcity, not to open market value.
Parties free to agree no reviews, review to fixed amount or formulaic review within strict limits. Where no
provision made in agreement statutory default reference to review to open market value at three yearly
intervals subject to notice.
Repairs Parties free to agree terms, default to S.I. 1473 where
agreement silent.
Parties free to agree terms, no default where agreement silent.
User Statutory definition of
agricultural holding. Letting may convert to Landlord & Tenant Act 1954 agreement where change of use from
agriculture.
Following compliance wi th Notice provision at commencement prevents conversion to Landlord & Tenant Act
agreement through change of use.
Continued overleaf...... Compensation to Compensation for Tenants’ Compensation for Tenants’

2
Tenant
Improvements undertaken with Landlord’s consent. Parties free
to agree conditions including writing down compensation
over time.
Compensation on unconditional consent based on increase in the
value of the holding.
No obligation on Landlord to compensate for work done
without permission.
Statutory code for tenant right and short term improvements.
Compensation for milk quota
for eligible tenants under Agriculture Act 1986.
Improvements undertaken with Landlord’s consent. No freedom for
parties to agree conditions.
Mandatory statutory compensation based on increase in the value of the
holding.
No obligation for Landlord to compensate for work done without
permission.
Compensation for intangible improvements, e.g. grant of planning
permission subject to Landlord’s consent.
No statutory code for tenant right
and short term improvements.
Compensation for milk quota under Section 20 ATA 1995 based on
increase in the value of the holding.
Dilapidations Statutory code establishing
basis of dilapidations in default of provision in agreement.
No statutory provisions.
Possession for non
payment of rent Provision for incontestable
Notice To Quit. No statutory provision.
Disputes Reference to Arbitration under
the AHA 1986 or Agricultural Lands Tribunal.
Parties free to agree basis of dispute resolution. In default reference to Independent Expert or Arbitration
under the Arbitration Acts.

APPENDIX 2
FARM BUSINESS TENANCIES DETAILED PROVISIONS BACKGROUND NOTES
The Notice Conditions A2.1 Section 1 of the Act provides that a tenancy is “a farm business tenancy” if “it meets the business conditions of the Act together with either the agriculture condition or the notice conditions”. The business conditions ( Section 1. 2) require that throughout the term all or part of the land comprised in the tenancy is farmed for the purposes of a business or trade. The agriculture condition (Section 1. 3) requires that taking account of factors including the terms of the tenancy, land use, relevant commercial activities and “any other relevant circumstances” the character of the tenancy is “primarily or wholly agricultural”. A2.2 The business and agriculture conditions are clearly recognisable as principles enshrined in earlier legislation (Section 1 Agricultural Holdings Act 1986). However the introduction of the notice condition as an alternative to the agriculture condition is a departure designed expressly to allow subsequent diversification without the tenancy being converted into a letting under the Landlord and Tenant Act 1954. A2.3 The notice conditions are set out in Section 1.4 of the 1995 Act. The notices must be served by both landlord and tenant prior to the earlier of the commencement of the tenancy or the completion of the agreement. Notices must identify the land to be comprised in the tenancy and include a statement that the person giving the notice intends that the tenancy is to be and remain a farm business tenancy. A2.4 The exchange of notices in this form will prevent the letting being converted into a Landlord and Tenant Act tenancy in the case of significant diversification. The tenancy must be primarily or wholly agricultural at commencement but diversification into non-agricultural use during the term will not breach the notice condition providing part of the land is always farmed for the purposes of a business or trade. Thus, in contrast to the situation under the Agricultural Holdings Act 1986, a tenancy, protected by the notice condition, will remain an agricultural tenancy, specifically a farm business tenancy, despite the use being predominantly non agricultural.

Dilapidations A2.5 The RICS provisions for dilapidations were used in nearly half of the agreements analysed in detail. The dilapidations clause in the RICS precedents provides: “On the termination of this Agreement the Landlord will be entitled to receive compensation for any breach by the Tenant of any of his obligations contained in this Agreement the amount of such compensation being determined in accordance with the common law relating to damages for breach of covenant.” A2.6 Contrary to the position with Agricultural Holdings Act (1986) agreements the absence of a statutory code for repairing liabilities, comparable to S.I. 1473, means a landlord wishing to preserve the opportunity to claim dilapidations in respect of repairs must write both a specific dilapidations clause and clauses covering liabilities into any agreement.

Appendix 3 Postal Survey Questionnaire and Covering Letter

Direct Line Tel No 0 1 626 325674 12 May 1997 Dear Member ECONOMIC EVALUATION OF THE AGRICULTURAL TENANCIES ACT 1995 The Farm Business Tenancy (FBT) has been in use since 1st September 1995. As part of the government's long standing practice of evaluating how new legislation is working, the University of Plymouth has been commissioned by MAFF/Welsh Office to undertake an independent preliminary evaluation of the Agricultural Tenancies Act 1995. As part of this study, we are extending the FBT survey, originally carried out in the summer of 1996 for the RICS, to include Wales and we are therefore sending the enclosed questionnaire to all Principal Rural Practice Chartered Surveyors in Wales. We hope that you will spare the time to complete the enclosed forms. The questionnaire is divided into two sections, the first asking for general information concerning all the FBTs that you have personally dealt with, which were granted during the period 1st September 1995 - 31st August 1996 and section two which looks in more detail at the terms of individual agreements which have been used in different circumstances. Please be assured that all the information provided will be treated in absolute confidence and used solely for the purposes of this research project. No individual respondents will be identified in our report to MAFF/Welsh Office. After completion please return the questionnaire by Monday 9th June 1997 using the postage paid slip enclosed to I.R.G. Whitehead, Seale-Hayne Faculty of Agriculture, Food and Land Use, University of Plymouth, Newton Abbot, Devon TQ 12 6NQ (Fax 0 1626-325657). If you have not dealt with any FBTs in that period, please tick the box at the bottom of page 1 and return the questionnaire. This is an important study and your co-operation in providing the information will be invaluable in ensuring a true picture is formed. Thank you for your assistance. Yours sincerely I R G Whitehead Enc.

1 April 1997 Dear Member ECONOMIC EVALUATION OF THE AGRICULTURAL TENANCIES ACT 1995 The Farm Business Tenancy (FBT) has been in use since 1st September 1995. As part of the government's long standing practice of evaluating how new legislation is working, the University of Plymouth has been commissioned by MAFF/Welsh Office to undertake an independent preliminary evaluation of the Agricultural Tenancies Act 1995. As part of this study, we are extending the FBT survey, originally carried out in the summer of 1996 for the RICS, to include all the County Farms Estates and we are therefore sending the enclosed questionnaire to all County Land Agents asking for their assistance. We hope that you will spare the time to complete the enclosed forms. The questionnaire is divided into two sections, the first asking for general information concerning all the FBTs that have been granted on the Estate between 1st September 1995 - 3 1st August 1996 and section two which looks in more detail at the terms of individual agreements which have been used in different circumstances. Please be assured that all the information provided will be treated in absolute confidence and used solely for the purposes of this research project. No individual respondents will be identified in our report to MAFF/Welsh Office. After completion please return the questionnaire by Friday 25th April 1997 using the postage paid slip enclosed to I.R.G. Whitehead, Seale-Hayne Faculty of Agriculture, Food and Land Use, University of Plymouth, Newton Abbot, Devon TQ12 6NQ (Fax 01626-325657). If the Estate had not granted any FBTs in that period please tick the box at the bottom of page 1 and return the questionnaire. This is an important study and your co-operation in providing the information will be invaluable in ensuring a true picture is formed. Thank you for your assistance. Yours sincerely I R G Whitehead Enc

Farm Business Tenancy Survey
As part of the MAFF/Welsh Office project ‘Economic Evaluation of the Agricultural Tenancies Act 1995’
Section 1.
Please record on the following pages details of the Farm Business Tenancies dealt with by you personally in Englkand & Wales between 1st September 1995 and 31st August 1996 (one FBT for each column) but excluding: 1) FBTs used in conjunction with milk quota sales and other atypical FBTs used for other quota arrangements (eg. sugar beet quota use). 2) FBTs of less than 12 months granted as replacements for grazing licences other than where a periodic FBT is being used as a vehicle to create a longer term letting. Please tick one box only for questions 3, 4 and 5 in this section. In Question 6 where there are amalgamated holdings under the FBT please indicate the appropriate acreage to each category. Name of compiler (Block letters please). Organisation Signature Date Total area of land managed personally by you (acres) Please tick, as appropriate We have not dealt with any FBTs in the relevant period Please detail any reasons why FBTs have not been used or other forms of arrangement preferred.

Section 1 (If you require extra space, please photocopy this form and continue as a separate sheet. Agreement No. Were you acting for landlord or tenant?
1.Area (acres) 2. County 3. Holding type Bare land Land & buildings Land/bldgs/house 4. Farm type Dairy Livestock Mixed Arable Horticulture Other 5. Owner of holding Private Utility companies Central Government County councils Financial Institution Traditional institutions (inc. Crown Estate & Royal Duchies)
Charities (inc. NT & RSPB)
Other 6.Previous occupation of the holding
Previously farmed in-hand (excluding share farming and contract farming)
Let on short agreements Previously AHA 1986 tenancy
Previously farmed under share farming or contract farming
Grazing licence Other please specify 7. Tenant’s Age 8. Is this letting to a previous occupier (PO), other farmer (OF) or new entrant (NE)
9. Other land farmed by the tenant (acres)
10. Date FBT granted 11.Term (Years) 12. Break clauses used (if so when)
13. Rent (£/acre) 14. Does the FBT include landlords milk quota?
15. If not, what is the extra charge for milk quota use? (total)

Farm Business Tenancy Survey
Section 2 This section is designed te give further information on only three of the FBTs that you have personally dealt with during the period in question to indicate variations in the agreements used for different purposes. Part 1 A short term agreement that replaces what would have otherwise been a Gladstone v Bower agreement Part 2 An agreement for 2-5 years Part 3 A long term agreement i.e. greater than 10 years Part 1. Please complete this sheet for one of the agreements that you have dealt with
which is:
A short term agreement that replaces what would otherwise have been a Gladstone v Bower agreement
Please indicate the number of the FBT that you are referring to from the table in Section 1
ο
1. Model FBT agreement on which the agreement is based. Please tick one box
• RICS agreement ο • CLA agreement ο • NFU agreement ο • other (please specify).................................................................
2. Who drafted the agreement?
• Yourself ο • Clients solicitor ο • other (please specify) ......................................................
3. Rent (per acre, per annum) .......................................................
Previous rent where let (per acre, per annum) .......................................................
4. Provision for rent reviews in the agreement.
• no provision in the agreement ο • no rent reviews ο • rent reviewed to open market lever ο • rent reviewed by fixed increments ο Please specify........................................... • rent reviews based on index ο Please specify...........................................
• if appropriate, what is the rent review cycle (years)................................
5. Repair clauses.
• Landlord responsible for all repairs ο • Landlord and tenant responsibilities similar to those of SI 1473(model
clauses) as amended ο • Tenant responsible for all repairs ο • Other variation.. ο
Please specify in brief........................................... ................................................................................................................................................

6. Assignment and sub-letting.
• assignment prohibited ο • subletting prohibited ο • both prohibited ο • neither prohibited with landlord's consent ο • both permitted ο
7. Restrictions on business activities provided for in the agreement.
• agricultural activities only ο • agricultural and some limited diversification activities ο Please specify........................................ • no restrictions ο • other ο
Please specify................................................................... 8. Specific management requirements provided for in the agreement.
• specific requirements largely concerning environment conservation ο • other management requirements ο Please specify....................................................................... • no specific requirements ο
9. Landlord's dilapidations.
- please outline the provisions in the agreement for the landlord's claim for
dilapidations on termination of the tenancy. ....................................................................................................................................................................................................................................................................................
10. Milk Quota.
- please outline the provisions in the agreement .................................................................................................................................................................................................................................................................................... 11. Disputes procedure.
* Please outline the provisions in the agreement for the resolution of disputes not governed directly by the ATA1995.
• no provision in the agreement ο
• arbitration for all disputes ο
• independent expert to be appointed ο
• other ο Please specify....................................................................................
12. What factors determined the length (years) of the agreement?
.......................................................................................................................................................
............................................................................................................................

Part 2 Please complete this sheet for one of the agreements that you have dealt with which is:
An agreement for 2 - 5 years,
Please indicate the number of the FBT that you are referring to from the table in Section 1
ο
1. Model FBT agreement on which the agreement is based. Please tick one box
• RICS agreement ο • CLA agreement ο • NFU agreement ο • other (please specify).................................................................
2. Who drafted the agreement?
• Yourself ο • Clients solicitor ο • other (please specify) ......................................................
3. Rent (per acre, per annum) .......................................................
Previous rent where let (per acre, per annum) .......................................................
4. Provision for rent reviews in the agreement.
• no provision in the agreement ο • no rent reviews ο • rent reviewed to open market lever ο • rent reviewed by fixed increments ο Please specify........................................... • rent reviews based on index ο Please specify...........................................
• if appropriate, what is the rent review cycle (years)................................
5. Repair clauses.
• Landlord responsible for all repairs ο • Landlord and tenant responsibilities similar to those of SI 1473(model
clauses) as amended ο • Tenant responsible for all repairs ο • Other variation.. ο
Please specify in brief........................................... ................................................................................................................................................

6. Assignment and sub-letting.
• assignment prohibited ο • subletting prohibited ο • both prohibited ο • neither prohibited with landlord's consent ο • both permitted ο
7. Restrictions on business activities provided for in the agreement.
• agricultural activities only ο • agricultural and some limited diversification activities ο Please specify........................................ • no restrictions ο • other ο
Please specify................................................................... 8. Specific management requirements provided for in the agreement.
• specific requirements largely concerning environment conservation ο • other management requirements ο Please specify....................................................................... • no specific requirements ο
9. Landlord's dilapidations.
- please outline the provisions in the agreement for the landlord's claim for
dilapidations on termination of the tenancy. ....................................................................................................................................................................................................................................................................................
10. Milk Quota.
- please outline the provisions in the agreement .................................................................................................................................................................................................................................................................................... 11. Disputes procedure.
* Please outline the provisions in the agreement for the resolution of disputes not governed directly by the ATA1995.
• no provision in the agreement ο
• arbitration for all disputes ο
• independent expert to be appointed ο
• other ο Please specify....................................................................................
12. What factors determined the length (years) of the agreement?
.......................................................................................................................................................
............................................................................................................................

Part 3 Please complete this sheet for one of the agreements that you have dealt with
which is: A long term agreement i.e. longer than 10 years.
Please indicate the number of the FBT that you are referring to from the table in Section 1
ο
1. Model FBT agreement on which the agreement is based. Please tick one box
• RICS agreement ο • CLA agreement ο • NFU agreement ο • other (please specify).................................................................
2. Who drafted the agreement?
• Yourself ο • Clients solicitor ο • other (please specify) ......................................................
3. Rent (per acre, per annum) .......................................................
Previous rent where let (per acre, per annum) .......................................................
4. Provision for rent reviews in the agreement.
• no provision in the agreement ο • no rent reviews ο • rent reviewed to open market lever ο • rent reviewed by fixed increments ο Please specify........................................... • rent reviews based on index ο Please specify...........................................
• if appropriate, what is the rent review cycle (years)................................
5. Repair clauses.
• Landlord responsible for all repairs ο • Landlord and tenant responsibilities similar to those of SI 1473(model
clauses) as amended ο • Tenant responsible for all repairs ο • Other variation.. ο
Please specify in brief........................................... ................................................................................................................................................

6. Assignment and sub-letting.
• assignment prohibited ο • subletting prohibited ο • both prohibited ο • neither prohibited with landlord's consent ο • both permitted ο
7. Restrictions on business activities provided for in the agreement.
• agricultural activities only ο • agricultural and some limited diversification activities ο Please specify........................................ • no restrictions ο • other ο
Please specify...................................................................
8. Specific management requirements provided for in the agreement.
• specific requirements largely concerning environment conservation ο • other management requirements ο Please specify....................................................................... • no specific requirements ο
9. Landlord's dilapidations.
- please outline the provisions in the agreement for the landlord's claim for
dilapidations on termination of the tenancy. ....................................................................................................................................................................................................................................................................................
10. Milk Quota.
- please outline the provisions in the agreement .................................................................................................................................................................................................................................................................................... 11. Disputes procedure.
* Please outline the provisions in the agreement for the resolution of disputes not governed directly by the ATA1995.
• no provision in the agreement ο
• arbitration for all disputes ο
• independent expert to be appointed ο
• other ο Please specify....................................................................................
12. What factors determined the length (years) of the agreement?
.......................................................................................................................................................
............................................................................................................................

Appendix 4 Telephone Survey Questionnaire and Interviewers’ Instructions

MAFF/WOAD Economic Evaluation of the Agricultural Tenancies Act 1995 TELEPHONE SURVEY INSTRUCTIONS TO ACCOMPANY THE TELEPHONE QUESTIONNAIRE
• Introduction 'Good morning / afternoon / evening. I'm from the Scale Hayne Faculty, University of Plymouth'. Check speaking to the person required, (see special filter question if ringing farmers) If not available find out when would be a good time to ring back if convenient for them and for the telephone surveyor. Mark sheet to show person contacted. Move on to next number. 'We are carrying out a national research project into agricultural tenancies. Would you mind answering a few questions to help us with this important research? All the information you provide will be treated in the strictest confidence'
• SECTION I ( Awareness)
Complete the answers using the Filter as indicated.
Question 2: if the answer is 'no', tick that box and close the interview as follows: 'Thankyou very much for your time'.
Question 3: emphasize the word 'most' and read the possible answers. Tick one box re. major answer and one further box to specify, as necessary.
Question 4: wait for response for first part and then read out alternatives for second part
• SECTION 2 ( Understanding)
Preamble: 'We want to find out how much people know about the detail of these Farm Business Tenancies - so this is the quiz part of our survey'. Question 5: This question requires some prompting, in two stages; first ask the question and then record the answer by ticking the relevant boxes. Do not read out the suggestions. Then say 'aarh aarh' as the first prompt and record the response; then say 'are there any other differences that you know of ?' If more than three differences me ntioned ask respondent which three they think are the most important.
Questions 6 & 7: note respondents answers
• SECTION 3 (Attitudes)
Preamble: The next four questions deal with your attitudes to Farm Business Tenancies and I shall ask you to give your answer as a grade from 0 to 5. If you don't know the answer to the question please just say " don't know".
Read question 8 and then say 0 = not at all and 5 = very important
Questions 9 and 10, say 0=not at all 5=very much
Question II, say 0= very harmful and 5 = very beneficial
Questions 12 and 13, say 0= much less investment and 5 = much greater investment

IF NOT LANDLORD OR FARMER, GO TO QUESTION 16
• SECTION 4 (Detail on Agreements)
Question 14 parts (a) to (h): to Landlords, private and public and MAFF sample 1&2.
Question 14(b)-(d): If answer to 14a is YES, please go through the list and tick the box for each item if the answer is 'yes' 'no' or 'don't know', as appropriate.
Ask if there are any other such obligations Question 14(c) and record these. Ask for specifics in Question 14d, as appropriate. Questions 14(e) record answer Question 14(f): Ask the question as an open question and record the response. Use the dual prompt as before, if necessary, to draw out respondents ie first ask the question and then record the answer. Then say 'aarh aarh' as the first prompt and record the response; then say 'is there anything else ?' and record the response. Question 14(g): Circle the relevant number on the scale as before. Questions 14(h) record answer Question 15 parts (a) to (m): to Farmers; tenants and mixed tenure farmers (MAFF Sample 3, 4, 5 & 6). Use the filter as shown for Question 15a. Question 15(c)-(h): Please go through the list and tick the box for each item if the answer is 'yes' 'no' or 'don't know', as appropriate. Ask if there are any other such obligations in Question I5d and record any specifics, as necessary, in Question 15e and 15g. Questions 15(i)-(k): tick box and note comments Question 15(1): Ask the question as an open question and record the response. Use the dual prompt as before to draw out respondents ie first ask the question and then record the answer. Then say 'aarh aarh' as the first prompt and record the response; then say 'is there anything else ?' and record the response. Question 15(m): Circle the relevant number on the scale as before. Questions 16 and 17: to LAND-AGENTS, CONSULTANTS & SOLICITORS ONLY Question 16: Ask the question as an open question and record the response. Use the dual prompt as before to draw out respondents ie first ask the question and then record the answer Then say 'aarh aarh' as the first prompt and record the response; then say 'is there anything else ?' and record the response. Questions 16 and 17: to LAND-AGENTS, CONSULTANTS & SOLICITORS ONLY Question 16: Ask the question as an open question and record the response. Use the dual prompt as before to draw out respondents ie first ask the question and then record the answer Then say 'aarh aarh' as the first prompt and record the response; then say 'is there anything else ?' and record the response. Question 17: Circle the relevant number on the scale as before. QUESTIONS 18 TO ALL RESPONDENTS Question 18: record answer

CLOSING THE INTERVIEW: • Respondents from non focus group areas : Close Interview: "Thank you very much for your time and interest which is much appreciated' • Respondents from focus group areas as follows:
1 Devon , Cornwall, Somerset and Dorset - Devon Hotel, Matford, Exeter 2 East Sussex, West Sussex, Hampshire - Arundel Resort Hotel, Arundel 3 North Yorkshire (North Allerton), North Yorkshire (Beverley), South and West Yorkshire and Lancashire - Jarvis Fairfield Manor Hotel, Skelton, York 4 Wales - Royal Welsh Showground, Builth Wells, Powys Preamble: 'We are organising a number of meetings in your area on......(read appropriate date and venue for that respondent i.e. Landlord/Owner Occupier, Tenant or Professional from Focus Group Summary attached) to enable us to develop a clearer understanding of some of the issues mentioned in the telephone survey. These meetings will be of around a dozen people and we are holding separate meetings for landowners, tenants and professional advisers. Would you be prepared to help us by attending such a meeting? Participants will be randomly selected from those interested and we shall be contacting you again shortly.' IF 'No': Close interview: 'Thank you very much for your time and interest which is much appreciated.'
IF 'Yes': PLEASE REMEMBER TO ASK FOR AND RECORD THE RESPONDENT'S ADDRESS. (Landlords/CLA members only). ( MAFF sample of owner occupiers, mixed and tenants includes addresses so no need to ask for them. We also have addresses for solicitors, consultants and land agents / surveyors.) 'Could you please give me your address so that we can contact you with the details of the Focus group meeting ?' Write an 'F' clearly on the top right hand corner of the 1st page of the questionnaire (to indicate this interest). Close Interview: 'Thank you very much for your time and interest which is much appreciated. We will be in touch shortly with further details of the Focus Groups.
If there any queries about the publishing of the report, this should be with MAFF early in the autumn. If there any queries about the availability of a summary of the findings, these will be available. Please record an 'R' on the top right hand corner of the front page of the questionnaire if this is mentioned and a copy requested.

Code Number: Interviewer: - Date: -
TELEPHONE SURVEY (30/4/97 draft)
NB INTERVIEWER INSTRUCTIONS ON ATTACHED INSTRUCTION SHEET AND IN BOLD CAPITAL LETTERS BELOW
FILTER QUESTION INSTRUCTIONS IN bold lower case
Section 1 - (Awareness)
1 Are you aware of any major changes in the law regarding the renting of agricultural land in the last 3 years?
YES c NO c go to 2 If YES, what are they? No reference to FBT's go to 2 Reference to FBT's go to 3 · Have you heard of the Farm Business Tenancies introduced in 1995?
YES c go to 3 NO c close interview (see
instructions)
3 Where did you get most of your information about FBT'S? Was it
Farming press c MAFF c
Trade or professional journal c please specify:-
Solicitors c Accountants c Land agents c
NFU c CLA c RICS c
Other c Specify......................................................... Trade or professional briefing c please specify:
Solicitors c Accountants c
Land agents c NFU c CLA c RICS c Other c Specify............................................................
4 What would be your estimate of the size of the agricultural tenanted sector in
England and Wales as a proportion of the total agricultural land?
in 1997........................................% Don't know c
How do you think this figure compares with the situation in 1950 ? Much lower c Lower c Same c Higher c Much higher c

Section 2 - (Understanding) 5 What do you think are the three most important differences between FBT's and
traditional tenancies?:- Greater flexibility/freedom of contract c Higher rents c Flexible term c
No security of tenure c No succession c
No dilapidations provision in Act c Flexibility with non agricultural activities c Open market rents c Flexible rent review options c Differing repair liabilities c Disputes resolved by Independent Experts c
Other(specify)…………………………………………… ……………………………………………… ………………………………………………
6 What do you think are the main advantages of FBTs firstly from the point of view of
landlords and secondly from the point of view of tenants?
(a) Landlord………………………………………………………….
(b) Tenant……………………………………………………………
7 What do you think are the main disadvantages of FBTs firstly from the point of view
of landlords and secondly from the point of view of tenants?
(a) Landlord………………………………………………………….
(b) Tenant……………………………………………………………
Section 3 - (Attitudes) 8 Do you think that it is important that there is a substantial tenanted sector in modem
agriculture?
Not at all Very important 0 1 2 3 4 5 Don't know c
9 Do you think that the introduction of FBT's will increase the area of land in the
tenanted sector by the year 2000?
Not at all Very much 0 1 2 3 4 5 Don't know c
10 Do you think that the introduction of FBT's will create inew opportunities for new
entrants into farming by the year 2000?
Not at all Very much 0 1 2 3 4 5 Don't know c

11 How do you think that the introduction of FBT's will affect the rural environment ?
Very harmful Very beneficial 0 1 2 3 4 5 Don't know c
12 What effect do you consider that the introduction of FBT's will have on Landlords' long
term investment in their farms? Much less investment Much greater investment
0 1 2 3 4 5
Why is this?……………………………………………………………………… 13 What effect do you consider that the introduction of FBTs will have on Tenants' long
term investment in their farms?
Much less investment Much greater investment 0 1 2 3 4 5
Why is this?………………………………………………………………………
IF NOT A LANDLORD OR FARMER GO TO QUESTION 16 Section 4 - (Detail on Agreements) To landlords, private and public and MAFF Samples 1 & 2 (Owner occupiers) 14a Are you or your organisation involved in letting any land on FBT agreements which
you intend to continue for 5 years or more?
YES c go to question 14b NO c go to question 14e
14b In such agreements would . you or your organisation seek to include any of the
following clauses? YES NO Don't know
(a) an obligation on the tenant to farm in c c c accordance with the Rules of Good Husbandry (b) a reservation of timber in favour c c c N/A c of the Landlord (c) obligations on the tenant to c c c N/A c protect watercourses 14c Again, in such agreements would you or your organisation seek to include any
obligation on the Tenant to enhance the environment? YES NO
Such as hedge planting c c Don't know c woodland planting c c Don't know c extensification c c Don't know c stock number ceilings c c Don't know c
Are there any other such obligations that you would seek to include ?
.........................................................

14d Again, in such agreements would you or your organisation seek to affect, in any way, the Tenant's right to enter into a conservation agreement either through clauses in the agreement or through the length of term of the agreement?
Don't know c No c Yes c
If YES please specify how........................................................................................
If YES please specify why this is.............................................................................. 14e How do you think that the introduction of FBTs will affect the amount of land that you
will let in the future?
More c Less c The same c
Why is that?..................................................................................................................
14f What two changes in the current arrangements would encourage you to let more land
under FBT'S? 1....................................................................................................................................
2....................................................................................................................................
14g Here are four changes that have been suggested; please indicate on a scale of 0 to 5 how important you consider these to be in encouraging greater use of FBT's. 0 equals not at all, 5 equals very important.
1. More favourable tax regime
0 1 2 3 4 5 Don't know c Not at all Very important
2. A minimum length of term 0 1 2 3 4 5 Don't know c Not at all Very important
3. A rent formula similar to that for traditional (1986 Act) tenancies 0 1 2 3 4 5 Don't know c Not at all Very important
4. More statutory fall back provisions 0 1 2 3 4 5 Don't know Not at all Very important 14h Would you consider investing in further agricultural land with a view to letting it under
a FBT?
.................................................................................................

To farmers - MAFF Samples 3,4,5 & 6 (Tenant & Mixed Tenure)
15a Have you been involved in renting in any land under a FBT? YES c go to question 15b NO c go to question 15j
The following questions refer to the FBT with the longest term if you are involved in more than one of them
15b What is the term of the longest FBT that you have?.......................................................
15c Does that tenancy agreement include any of the following?
YES NO Don’t know (a) an obligation on the tenant to farm in c c c accordance with the Rules of Good Husbandry (b) a reservation of timber in favour c c c N/A c of the Landlord (c) obligations on the tenant to c c c N/A c protect watercourses
15d Does that tenancy agreement include any obligation on the Tenant to enhance the environment?
YES NO Such as hedge planting c c Don't know c woodland planting c c Don't know c extensification c c Don't know c stock number ceilings c c Don't know c
Are there any other such obligations?.............................................................................. 15e Does that tenancy agreement restrict, in any way, your right to enter into a
conservation agreement either through clauses in the agreement or through the term of the agreement?
Don't know c No c
Yes c (please specify why).................................. 15f Is the land included in that FBT in an area affected by any of the following
designations? YES NO Environmentally Sensitive Areas c c Don't know c Site of Special Scientific Interest c c Don't know c Nitrate Vulnerable Zone c c Don't know c Nitrate Sensitive Area c c Don't know c If NO go to question 15h 15g If YES - Is the land under that FBT entered into any conservation agreement under
any of these schemes? NO c YES c
If YES - which of the schemes?...................................................................................... 15h Is the land under that FBT included in a Countryside Stewardship or Tir Cymen
Agreement? NO c
YES c

15i Over the next 2-3 years, do you plan to construct any buildings on or make any
improvements in the land under the FBT? NO c YES c If YES, please describe briefly...................................................................................... ............................................................................................................................................. 15j Are you seeking to expand your farm business by renting extra land under a FBT at present? YES c NO c UNCERTAIN c If NO or UNCERTAIN why is that?................................................................................. ............................................................................................................................................ 15k Would you seek to expand your farm business by renting extra land under a FBT in the future? YES c NO c UNCERTAIN c If NO or UNCERTAIN why is that?.................................................................................. ........................................................................................................................................... 151 What two changes in the current arrangements would encourage you to rent more land under FBT'S? 1....................................................................................................................................... 2....................................................................................................................................... 15m Here are four changes that have been suggested; please indicate on a scale of 0 to 5 how important you consider these to be in encouraging greater use of FBT'S. 0 equals not at all, 5 equals very important. 1. More favourable tax regime 0 1 2 3 4 5 Don't know c Not at all Very important
2. A minimum length of term 0 1 2 3 4 5 Don't know c Not at all Very important
3. A rent formula similar to that for traditional (1986 Act) tenancies 0 1 2 3 4 5 Don't know c Not at all Very important
4. More statutory fall back provisions 0 1 2 3 4 5 Don't know c Not at all Very important

To Land-Agents, Consultants and Solicitors only 16 What two changes in the current arrangements do you think would encourage greater use
of FBTs in En-land and Wales?
1………………………………………………………………………………
2………………………………………………………………………………
……………………………………………………………………………………… 17 Here are four changes that have been suggested please indicate on a scale of 0 to 5 how
important you consider these to be in encouraging greater use of FBT'S. 0 equals not at all, 5 equals very important.
1. More favourable tax regime
0 1 2 3 4 5 Don't know c Not at all Very important
2. A minimum length of term 0 1 2 3 4 5 Don't know c Not at all Very important
3. A rent formula similar to that for traditional (1986 Act) tenancies 0 1 2 3 4 5 Don't know c Not at all Very important
4. More statutory fall back provisions 0 1 2 3 4 5 Don't know c Not at all Very important To all respondents 18 Do you have any other comments concerning FBT'S?
............................................................................................................................................
............................................................................................................................................ 19 Focus Groups - see preamble
YES c
NO c
Name………………………………………………. Address………………………………………………
.............................................................……. .......................................................... ..........................................................

APPENDIX 5
INVESTMENT IN BUILDINGS AND LAND IMPROVEMENTS: THE BASELINE DATA
Table A3.1 A comparison of annual investments 1989/91: Cereals Farms
Wholly owner-occupied
(N=362) Wholly rented
(N=185)
T-test* Mean
£/ha Std Dev
£/ha Mean £/ha
Std Dev £/ha
Livestock buildings 3.23 22.05 0.68 4.84 n.s. Crop buildings 1.44 14.24 0.44 3.05 n.s. Other buildings 11.29 45.61 4.69 42.09 n.s. Mole drainage 0.27 5.07 0.00 - n.s. Tile drainage 1.37 11.20 0.11 1.46 n.s. Other improvements 4.08 30.29 0.46 3.12 n.s. All buildings & improvements
21.68 62.23 6.37 42.41 **
Machinery 99.56 138.49 80.62 94.42 n.s. *In this and the following tables, t-test results for the comparison of means are shown to be not significantly different (n.s.) at less than the 5% level; significantly different at less than the 5% level (*); significantly different at less than the 1% level. Table A3.2 A comparison of annual investments 1989/91: Dairy Farms Wholly owner-occupied
(N=562) Wholly rented
(N=251)
T-test Mean
£/ha Std Dev
£/ha Mean £/ha
Std Dev £/ha
Livestock buildings 45.55 192.28 18.52 56.96 * Crop buildings 5.52 46.72 3.91 38.41 n.s. Other buildings 24.81 175.85 9.64 45.56 n.s. Mole drainage 1.63 13.38 0.00 - n.s. Tile drainage 2.38 17.95 0.39 3.31 n.s. Other improvements 44.33 147.38 15.80 52.55 ** All buildings & improvements
124.23 436.94 48.25 101.06 **
Machinery 146.26 152.83 138.05 164.48 n.s.

Table A3.3 A comparison of annual investments 1989/91: Lowland cattle and sheep farms Wholly owner-occupied
(N=269) Wholly rented
(N=126)
T-test Mean
£/ha Std Dev
£/ha Mean £/ha
Std Dev £/ha
Livestock buildings 12.79 70.27 4.21 37.02 n.s. Crop buildings 0.81 5.51 1.50 12.91 n.s. Other buildings 18.10 68.87 5.98 51.30 n.s. Mole drainage 0.12 1.33 0.00 - n.s. Tile drainage 0.87 6.92 0.18 1.61 n.s. Other improvements 5.89 16.48 7.30 24.99 n.s. All buildings & improvement
38.57 96.85 19.16 92.63 **
Machinery 137.33 583.52 62.74 77.97 n.s. Table A3.4 A comparison of annual investments 1989/91: General Cropping Farms Wholly owner-occupied
(N=159) Wholly rented
(N=108)
T-test Mean
£/ha Std Dev
£/ha Mean £/ha
Std Dev £/ha
Livestock buildings 6.03 26.71 0.62 3.52 * Crop buildings 3.01 20.77 2.75 12.08 n.s. Other buildings 10.94 37.84 2.95 13.34 * Mole drainage 0.00 - 0.57 3.74 *. Tile drainage 1.13 5.84 0.57 3.66 n.s. Other improvements 5.67 18.95 0.64 3.45 ** All buildings & improvements
26.78 52.56 8.10 20.27 **
Machinery 129.89 136.03 125.21 112.54 n.s.

Table A3.5 A comparison of annual investments 1989/91: Mixed Farms Wholly owner-occupied
(N=255) Wholly rented
(N=168)
T-test Mean
£/ha Std Dev
£/ha Mean £/ha
Std Dev £/ha
Livestock buildings 19.57 102.86 16.08 81.42 n.s. Crop buildings 1.27 7.91 1.81 10.17 n.s. Other buildings 11.36 47.12 4.69 32.60 n.s. Mole drainage 0.00 - 0.17 2.21 n.s. Tile drainage 1.19 7.09 0.40 4.29 n.s. Other improvements 8.74 27.39 3.20 14.83 * All buildings & improvements
41.13 116.16 26.36 97.58 n.s.
Machinery 83.26 93.67 83.69 101.39 n.s. Table A3.6 A comparison of annual investments 1989/91: LFA Livestock Farms Wholly owner-occupied
(N=378) Wholly rented
(N=159)
T-test Mean
£/ha Std Dev
£/ha Mean £/ha
Std Dev £/ha
Livestock buildings 9.09 32.97 4.86 22.41 n.s. Crop buildings 1.26 17.89 0.19 1.43 n.s. Other buildings 4.04 18.96 1.36 12.19 n.s. Mole drainage 1.12 12.71 0.76 6.61 n.s. Tile drainage 1.56 11.34 1.21 11.76 n.s. Other improvements 15.50 38.99 9.29 21.97 n.s. All buildings & improvements
32.56 61.64 17.66 37.82 **
Machinery 47.70 61.07 44.34 67.39 n.s.