executive summary - new yangon city development company ltd
TRANSCRIPT

Final Report
Traffic and Transport Study
New Yangon City
Main Report
Executive Summary
July 2019


Final Report – Executive Summary
Traffic and Transport Study for the Development of New Yangon City’s Master Plan
CONTENTS
Background, Strategies and Objectives .............................................................................................................................. 1
Strategy 1 - Integrated Land Use ........................................................................................................................................ 3
Strategy 2- High-Quality Public Transportation .................................................................................................................. 3
Strategy 3- Road Network Hierarchy and Design ............................................................................................................... 8
Strategy 4 - Regional Connectivity ................................................................................................................................... 15
Strategy 5 – Safe and High-Quality Pedestrian and Bicycle Facilities ................................................................................ 17
Strategy 6 – Shared Mobility Choices ............................................................................................................................... 18
Strategy 7 – Transportation Demand Management (TDM) .............................................................................................. 19
Strategy 8 – Goods Movement ........................................................................................................................................ 22
Travel Demand Forecasts ................................................................................................................................................. 23
Traffic Impact Assessment for NYC Phase 1 Master Plan.................................................................................................. 24
Traffic Impact Assessment of Target Intersections ........................................................................................................... 27

Final Report – Executive Summary Traffic and Transport Study for the
Development of New Yangon City’s Master Plan
1 | P a g e
Background, Strategies and Objectives
The metropolitan area of Yangon, the economic center of Myanmar, has been attracting domestic as well as international investment and growing rapidly with a population that is expected to increase to over 10 million before 2040. To accommodate such growing population, issues of employment opportunity, quality housing provision and infrastructure need to be properly addressed.
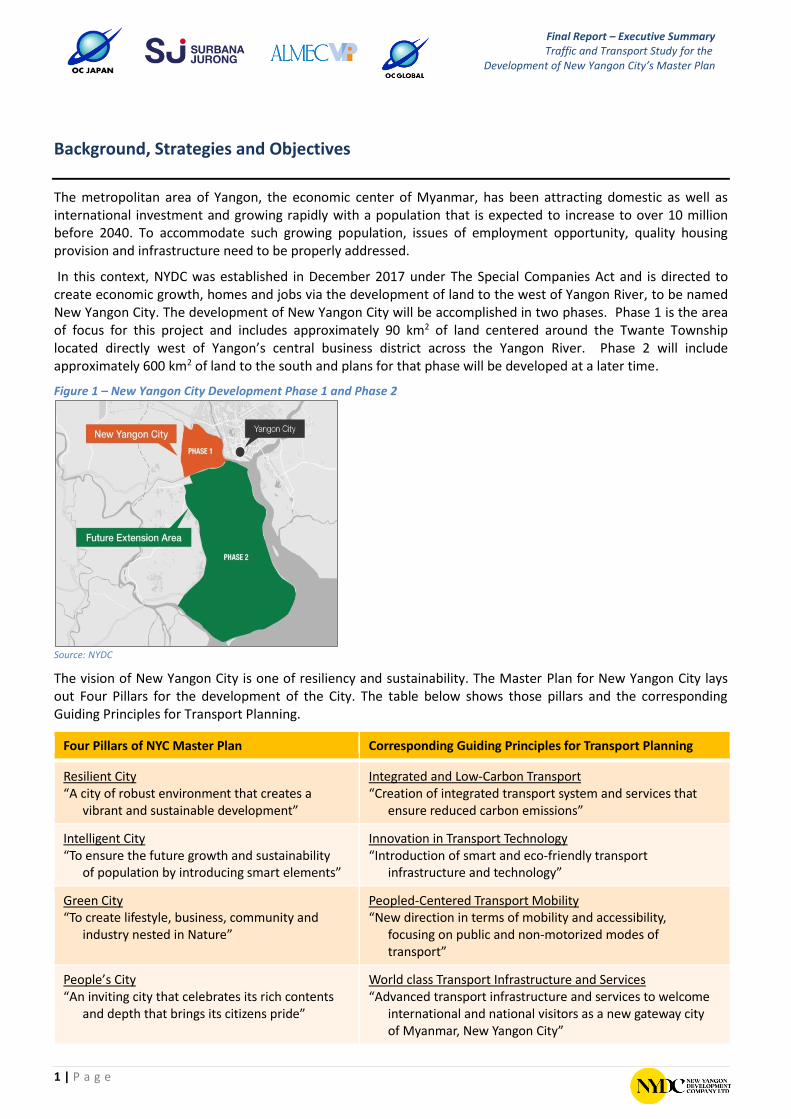
In this context, NYDC was established in December 2017 under The Special Companies Act and is directed to create economic growth, homes and jobs via the development of land to the west of Yangon River, to be named New Yangon City. The development of New Yangon City will be accomplished in two phases. Phase 1 is the area of focus for this project and includes approximately 90 km2 of land centered around the Twante Township located directly west of Yangon’s central business district across the Yangon River. Phase 2 will include approximately 600 km2 of land to the south and plans for that phase will be developed at a later time.
Figure 1 – New Yangon City Development Phase 1 and Phase 2
Source: NYDC
The vision of New Yangon City is one of resiliency and sustainability. The Master Plan for New Yangon City lays out Four Pillars for the development of the City. The table below shows those pillars and the corresponding Guiding Principles for Transport Planning.
Four Pillars of NYC Master Plan Corresponding Guiding Principles for Transport Planning
Resilient City “A city of robust environment that creates a
vibrant and sustainable development”
Integrated and Low-Carbon Transport “Creation of integrated transport system and services that
ensure reduced carbon emissions”
Intelligent City “To ensure the future growth and sustainability
of population by introducing smart elements”
Innovation in Transport Technology “Introduction of smart and eco-friendly transport
infrastructure and technology”
Green City “To create lifestyle, business, community and
industry nested in Nature”
Peopled-Centered Transport Mobility “New direction in terms of mobility and accessibility,
focusing on public and non-motorized modes of transport”
People’s City “An inviting city that celebrates its rich contents
and depth that brings its citizens pride”
World class Transport Infrastructure and Services “Advanced transport infrastructure and services to welcome
international and national visitors as a new gateway city of Myanmar, New Yangon City”
Final Report – Executive Summary Traffic and Transport Study for the
Development of New Yangon City’s Master Plan
2 | P a g e
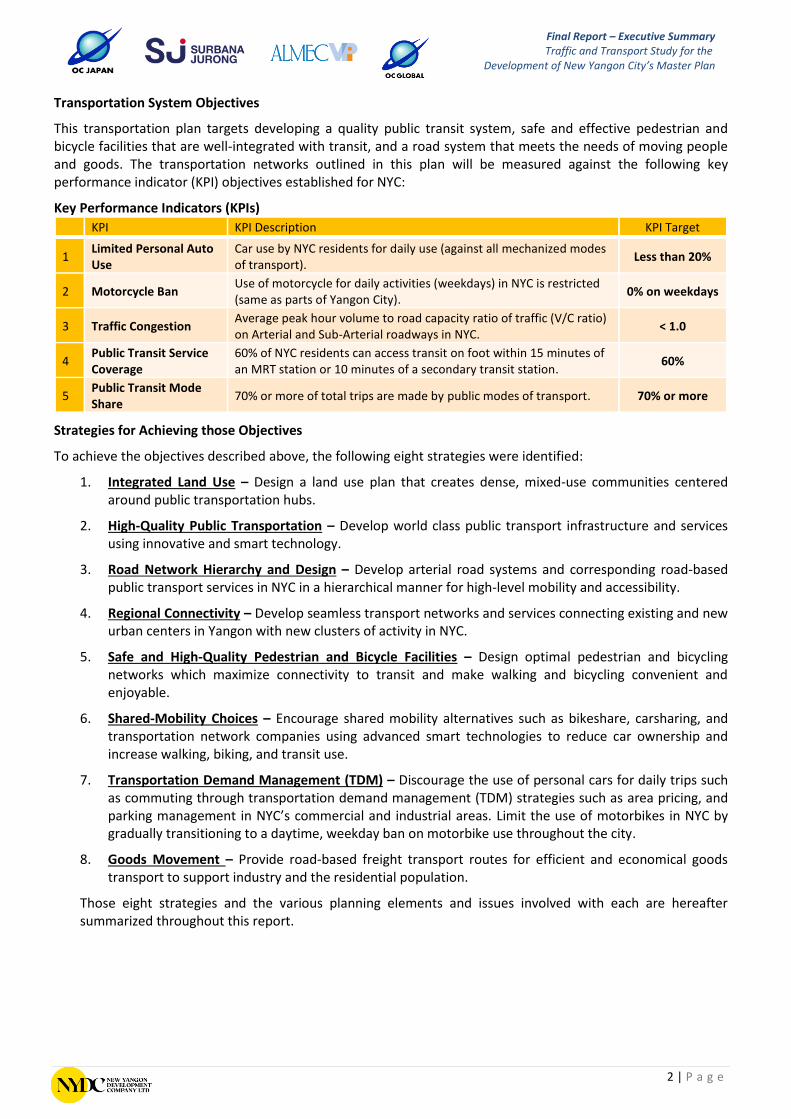
Transportation System Objectives
This transportation plan targets developing a quality public transit system, safe and effective pedestrian and bicycle facilities that are well-integrated with transit, and a road system that meets the needs of moving people and goods. The transportation networks outlined in this plan will be measured against the following key performance indicator (KPI) objectives established for NYC:
Key Performance Indicators (KPIs) KPI KPI Description KPI Target
1 Limited Personal Auto Use
Car use by NYC residents for daily use (against all mechanized modes of transport).
Less than 20%
2 Motorcycle Ban Use of motorcycle for daily activities (weekdays) in NYC is restricted (same as parts of Yangon City).
0% on weekdays
3 Traffic Congestion Average peak hour volume to road capacity ratio of traffic (V/C ratio) on Arterial and Sub-Arterial roadways in NYC.
< 1.0
4 Public Transit Service Coverage
60% of NYC residents can access transit on foot within 15 minutes of an MRT station or 10 minutes of a secondary transit station.
60%
5 Public Transit Mode Share
70% or more of total trips are made by public modes of transport. 70% or more
Strategies for Achieving those Objectives
To achieve the objectives described above, the following eight strategies were identified:
1. Integrated Land Use – Design a land use plan that creates dense, mixed-use communities centered around public transportation hubs.
2. High-Quality Public Transportation – Develop world class public transport infrastructure and services using innovative and smart technology.
3. Road Network Hierarchy and Design – Develop arterial road systems and corresponding road-based public transport services in NYC in a hierarchical manner for high-level mobility and accessibility.
4. Regional Connectivity – Develop seamless transport networks and services connecting existing and new urban centers in Yangon with new clusters of activity in NYC.
5. Safe and High-Quality Pedestrian and Bicycle Facilities – Design optimal pedestrian and bicycling networks which maximize connectivity to transit and make walking and bicycling convenient and enjoyable.
6. Shared-Mobility Choices – Encourage shared mobility alternatives such as bikeshare, carsharing, and transportation network companies using advanced smart technologies to reduce car ownership and increase walking, biking, and transit use.
7. Transportation Demand Management (TDM) – Discourage the use of personal cars for daily trips such as commuting through transportation demand management (TDM) strategies such as area pricing, and parking management in NYC’s commercial and industrial areas. Limit the use of motorbikes in NYC by gradually transitioning to a daytime, weekday ban on motorbike use throughout the city.
8. Goods Movement – Provide road-based freight transport routes for efficient and economical goods transport to support industry and the residential population.
Those eight strategies and the various planning elements and issues involved with each are hereafter summarized throughout this report.

Final Report – Executive Summary Traffic and Transport Study for the
Development of New Yangon City’s Master Plan
3 | P a g e
Strategy 1 - Integrated Land Use
Design a land use plan that creates dense, mixed-use communities centered around public transportation hubs.
Land use refers to various development factors such as density, mix of activities, physical design, and the quality of the built environment. Land use characteristics affect travel behavior by affecting the distances that need to be traveled between destinations, and the relative efficiency of different modes. Transport strategies can influence land use patterns directly or indirectly through impacts on travel behavior.
Transit-Oriented Development (TOD)
TOD refers to land uses, typically residential and commercial centers, designed to maximize access by transit and non-motorized transportation. A typical TOD has a rail or bus station at its center, surrounded by relatively high-density development within one to two kilometers. TOD is a central organizing principle of the New Yangon City Master Plan.
High-quality transit supports the development of high-density urban centers that provide accessibility and agglomeration benefits – efficiencies that result when many activities are physically close together – while automobile-oriented development results in lower densities as cars are space intensive, requiring large amounts of land for roads and parking.
Strategy 2- High-Quality Public Transportation
Develop world class public transport infrastructure and services using innovative and smart technology.
The development of a three-tiered public transportation network is recommended for New Yangon City consisting of the following:
• A ‘Primary’ transit network with two mass rapid transit (MRT) lines,
• A ‘Secondary’ transit network of five bus rapid transit (BRT) lines, and
• A ‘Tertiary’ public transit system of conventional YBS bus routes, supplemented by limited express bus lines serving the city.
Primary Transit System: 2 MRT Lines
This study recommends that the primary public transit system for New Yangon City should consist of two mass transit lines:
• A North-South running line connecting to the future East-West Urban Mass Rapid Transit (E/W UMRT) Line, also known as the UMRT Line 2, and
• An East-West running mass transit line crossing the Yangon River to the east and connecting to the Yangon Circular Rail and the UMRT N/S Line (UMRT Line 1). The East-West line would be an extension of the conceptual UMRT Line 3.
The two NYC MRT lines are shown in below as green lines within the context of the planned regional mass transit network.

Final Report – Executive Summary Traffic and Transport Study for the
Development of New Yangon City’s Master Plan
4 | P a g e
Source: Study Team
Secondary Public Transit Network
A secondary public transit network consisting of the five surface BRT lines operating in dedicated bus lanes on selected NYC streets is recommended as shown in the following image.
Figure 2 – Recommended MRT and Secondary Transit Lines
Source: Study Team

Final Report – Executive Summary Traffic and Transport Study for the
Development of New Yangon City’s Master Plan
5 | P a g e
It is recommended to preliminarily develop each of the secondary transit lines as bus routes operating in dedicated lanes separated from traffic, before upgrading the lines to full BRT with elevated platform-level boarding, prioritized signalization at intersections and off-board fare collection. At some point in the future, depending on ridership demand and funding availability, it may become possible or necessary to upgrade these BRT lines to light rail transit (LRT) with longer station platforms.
Transit Coverage
To assess the performance of the Primary and Secondary transit systems with respect to transit service coverage performance (KPI #4), the coverage areas of each of the MRT and BRT stations were calculated, with consideration that people are willing to walk up to 15 minutes (approximately 1,200m) to an MRT station and 10 minutes (approximately 800m) to a BRT station. Figure 3 below shows the respective walk sheds of each of the MRT and BRT stations individually (left), along with the total transit coverage area (right).
Figure 3- Walk sheds (left) and total coverage area (left) for NYC MRT and BRT transit stations
Source: Study Team
Table 1 – NYC Transit Coverage Area and Ratios Coverage
Area (km2) Coverage Ratio
(% of NYC)
MRT Stations 38.40 43.5%
BRT Stations 51.88 58.8%
Overlap (19.29) --
Total 70.99 80.4% Source: Study Team
Table 1 above shows that there is a total of 38.4km2 of land in NYC within 1,200m of a planned MRT station, and another 51.88 km2 of land within 800m of a planned BRT station. Eliminating the overlapping portions gives a total of 70.99km2 of land in NYC within the walk shed of a transit station. With NYC Phase I comprising a total of 88.3 km2 of land, this represents a transit coverage ratio of 80.4%. Since population densities do tend to be higher nearer transit stations and lower in areas far from stations, it is reasonable to assume that as much as 80-90% of NYC’s population may live within the transit coverage areas.

Final Report – Executive Summary Traffic and Transport Study for the
Development of New Yangon City’s Master Plan
6 | P a g e
Bus Services
It is recommended to work with the Yangon Regional Transport Authority to identify key bus routes on connections between NYC and surrounding areas, as well as on surface streets within NYC for expansion of Yangon Bus Service (YBS). Some key considerations in developing a surface bus network in NYC are the following:
• Create connections between existing residential areas (including any other urban development projects to the west of ORR) and employment areas.
• Loop service routes within the residential / commercial areas could be applicable.
• Develop a major Bus Transit Hub to facilitate efficient and convenient intermodal transit connections within the City between regular bus routes, BRT lines, major roadways and bicycle facilities.
The figure below on the left shows a conceptual representation of what the short-term bus system could look like with the recommended location of the bus transit hub and a network of routes facilitating regional travel and connecting NYC residential, employment and commercial centers.
It is also recommended to develop three Limited Express Bus lines during the first few years of the project to accommodate the commuter passenger demand between NYC’s job center and Yangon before the MRT lines can be developed. The following three express bus routes are recommended as shown in the image below to the right.
Transit HUB/Access Guidelines
In general, to maximize long-term transit ridership and minimize costs, station access modes should be prioritized according to the following hierarchy: walking, transit (connecting buses), bicycles, ‘kiss-and-ride’ drop-offs (such as by taxis or transportation network companies), and finally park-and-ride facilities where necessary, with prioritization for car-poolers over drivers traveling alone.
Ridership and Station Access Modalities
Based on the analysis of population and job density and general conditions in the project area, the following average ridership and station access modalities are anticipated for NYC:

Final Report – Executive Summary Traffic and Transport Study for the
Development of New Yangon City’s Master Plan
7 | P a g e
Table 2 – Estimated Daily Passenger Volumes by Station Type and Access Mode
Access Mode MRT Stations BRT Stations
Walk 14,000 70% 3,000 60%
Bus 3,200 16% 800 16%
Bike 2,000 10% 750 15%
Kiss and Ride 600 3% 400 8%
Park-and-Ride 200 1% 50 1%
Total 20,000 100% 5,000 100%
Recommended Multi-Modal Facilities for NYC
Based on the anticipated ridership and access mode percentages shown above, the following facilities are recommended for NYC:
Table 3 – Intermodal Facility Recommendations for NYC
Access Mode MRT Stations BRT Stations
Walk High-quality footpaths surrounding station access points with appropriate facilities (ramps, escalators, elevators) to provide barrier-free access for users of all abilities.
Bus Dedicated bus transfer stops on MRT-aligning streets and adjacent cross streets.
Dedicated bus transfer stops on adjacent cross streets.
Bicycle Dedicated space for up to 2,000 bicycles (~4,000m2) within 300m of stations. 2-4 Bikeshare stations within 200m of stations.
Dedicated space for up to 750 bicycles (~1,500m2) within 300m of stations. 1-2 Bikeshare stations within 200m of stations.
Kiss-and-Ride Dedicated off-street kiss-and-ride drop off facilities within 100m of stations.
Designated curb space on adjacent streets for kiss-and-ride drop offs.
Park-and-Ride Space for approximately 2,000 cars at strategic station locations.
Space for approximately 1,500 cars at strategic station locations.

Final Report – Executive Summary Traffic and Transport Study for the
Development of New Yangon City’s Master Plan
8 | P a g e
Strategy 3- Road Network Hierarchy and Design
Develop arterial road systems and corresponding road-based public transport services in NYC in a hierarchical manner for high-level mobility and accessibility.
In order to facilitate high-level mobility and connectivity for road-based public transport, freight, and private vehicles, a hierarchy of five roadway classifications was identified for New Yangon City:
1. Expressway – Roadways designed for high speed (100kph) with access control. Within the context of this plan, the Expressway is the planned Outer Ring Road which is slated to make up the western boundary of NYC.
2. Arterials – Defined as roadways designed for mobility across regions or states, focused on mobility, generally with six vehicle lanes and with a design speed of 80 kph.
3. Sub-Arterials – Defined as streets which focus on mobility generally with four vehicle lanes within regions with a design speed of 70 kph.
4. Collector Streets – Defined as streets focused on accessibility, they typically have 4 vehicle lanes and a design speed of 60 kph.
5. Local Streets – Defined as streets which focus is on accessibility, they typically have 2 vehicles lanes and are designed for a speed of 50 kph.
The image below shows the recommended layout of the top four roadway classifications within New Yangon City.
Source: Study Team

Final Report – Executive Summary – Traffic and Transport Study for the Development of New Yangon City’s Master Plan
9 | P a g e
In addition to the major roadway classifications shown above, a number of sub-classifications or roadway ‘types’ were identified to meet the transportation demands of various roadways in NYC. In total, six “types” were identified: A, B, C, D, D+, and E. Types A and B apply to Arterials, Sub-Arterials, and Collector Street classifications, Type C applies only to Arterials and Sub-Arterials, and Types D, D+, and E each apply only to a single Arterial roadway where special design conditions were required. The maps below show the layout of the roadway types for Arterial, Sub-Arterial, and Collector Streets, respectively.
The following section lists the dimensions and displays three dimensional images of each of the recommended street designs within the city.

Final Report – Executive Summary Traffic and Transport Study for the
Development of New Yangon City’s Master Plan
10 | P a g e
Arterial Type A: Standard Arterials – 48.0m ROW (80kph Design Speed) Dimensions Phase II Design
Arterial Type B: Arterials with BRT – 50.0m ROW (80kph Design Speed) Dimensions Phase II Design
Arterial Type C: Arterials with MRT Line in Median – 48.0m ROW (80kph Design Speed) Dimensions Phase II Design

Final Report – Executive Summary Traffic and Transport Study for the
Development of New Yangon City’s Master Plan
11 | P a g e
Arterial Type D: 8-Lane Arterial – 53.0m ROW (80kph Design Speed) Dimensions Design
Arterial Type D+: 8-Lane Arterial with 20m Civic Space in Center Median – 64.0m ROW (80kph Design Speed) Dimensions Design
Arterial Type E: R2 Arterial – 100.0m ROW (80kph Design Speed) Dimensions Design

Final Report – Executive Summary Traffic and Transport Study for the
Development of New Yangon City’s Master Plan
12 | P a g e
43.5m
Sub-Arterial Type A: Standard Sub-Arterials – 41.5m ROW (70kph Design Speed) Dimensions Design
Sub-Arterial Type B: Sub-Arterials with BRT – 43.5m ROW (70kph Design Speed) Dimensions Design
Sub-Arterial Type C: Sub-Arterials with MRT in Median – 41.5m ROW (70kph Design Speed) Dimensions Design

Final Report – Executive Summary Traffic and Transport Study for the
Development of New Yangon City’s Master Plan
13 | P a g e
Collector Type A: Standard Collector – 35.0m ROW (60kph Design Speed) Dimensions Design
Collector Type B: Collectors with BRT – 35.0m ROW (60kph Design Speed) Dimensions Design
Collector Type C: Collector – 20.0m ROW (60kph Design Speed) Dimensions Design

Final Report – Executive Summary Traffic and Transport Study for the
Development of New Yangon City’s Master Plan
14 | P a g e
Local Streets: 18.0m ROW (50kph Design Speed) Dimensions Design
Local Streets: 12.0m ROW (50kph Design Speed) Dimensions Design
Local Streets: 10.0m ROW (50kph Design Speed) Dimensions Design

Final Report – Executive Summary Traffic and Transport Study for the
Development of New Yangon City’s Master Plan
15 | P a g e
Strategy 4 - Regional Connectivity Develop seamless transport networks and services connecting existing and new urban centers in Yangon with new clusters of activity in NYC.
The results of the transportation model suggest that to meet future travel demand between NYC and surrounding areas, a total of 12 connections across the three bodies of water may be necessary. This includes four connections across the Pan Hlaing River to the north, three connections across the Yangon River to the east, and five connections across the Twante Canal to the south.
Figure 4 below shows the location, number and type of connection in terms of the number and direction of vehicle lanes as well as the two connections which are also slated to accommodate MRT lines.
Figure 4 – Location of Existing and Potential Bridges or Tunnels and Gateways
Source: AECOM and OCJV Study Teams

Final Report – Executive Summary – Traffic and Transport Study for the Development of New Yangon City’s Master Plan
16 | P a g e
Timing of Connection Development
The table below shows the number of vehicle lanes and the recommended phasing timelines for the development of each of the connections between New Yangon City and other parts of the Yangon Region.
2022
2023
2024
2025
2026
2027
2028
2029
2030
2031
2032
2033
2034
2035
2036
2037
2038
2039
2040
2041
2042
2043
2044
2045
2046
2047
2048
2049
2050
Short-Term High Priority Medium-Term Priority Long-Term Potential
Eas
t Bridge 01 6 6 6 6 6 6 6 6 6 6 6 6 6 6 6 6 6 6 6 6 6 6 6 6 6 6 6 6 6
Connection 03 (MRT) 0 0 0 0 0 0 0 0 4 4 4 4 4 4 4 4 4 4 4 4 4 4 4 4 4 4 4 4 4
Connection 04 0 0 0 0 0 0 0 0 0 0 0 0 0 0 0 0 0 0 0 0 0 0 0 6 6 6 6 6 6
So
uth
Bridge 05 0 0 0 6 6 6 6 6 6 6 6 6 6 6 6 6 6 6 6 6 6 6 6 6 6 6 6 6 6
Bridge 07 0 0 0 0 0 0 0 0 0 0 0 0 0 0 0 0 0 0 0 0 0 0 0 6 6 6 6 6 6
Bridge 08 0 0 0 0 0 0 0 0 0 0 0 0 0 0 0 0 0 0 0 0 0 0 4 4 4 4 4 4 4
Bridge 09 0 0 0 0 0 0 0 0 0 0 0 0 0 0 0 0 0 0 0 0 0 0 6 6 6 6 6 6 6
Bridge 12 2 2 2 2 2 2 2 2 2 2 12 12 12 12 12 12 12 12 12 12 12 12 12 12 12 12 12 12 12
No
rth
Bridge 02 4 4 4 4 4 4 4 4 4 4 4 4 4 12 12 12 12 12 12 12 12 12 12 12 12 12 12 12 12
Bridge 06 0 0 0 6 6 6 6 6 6 6 6 6 6 6 6 6 6 6 6 6 6 6 6 6 6 6 6 6 6
Bridge 10 0 0 0 0 0 0 0 0 0 0 0 0 0 0 0 0 0 0 0 0 0 0 0 4 4 4 4 4 4
Bridge 11 (MRT) 0 0 0 0 0 0 0 0 6 6 6 6 6 6 6 6 6 6 6 6 6 6 6 6 6 6 6 6 6

Final Report – Executive Summary Traffic and Transport Study for the
Development of New Yangon City’s Master Plan
17 | P a g e
Strategy 5 – Safe and High-Quality Pedestrian and Bicycle Facilities
Design optimal pedestrian and bicycling networks which maximize connectivity to transit and make walking and bicycling convenient and enjoyable.
The primary recommendation for bicycling infrastructure in NYC is to adopt a policy of installing Protected Bike Lanes on all Arterial, Sub-Arterial, and Collector streets from the outset of the city’s development.
Figure 5 - Four Examples of Protected Bike Lanes: Top Left shows a lane separated from traffic using plastic bollards and green paint, Top Right shows separation achieved using plastic speed bumps, Bottom Left shows separation achieved using traditional concrete curbing, and Bottom Right shows a bike lane separated using planter boxes.
The results of this approach would be an extensive, well-connected, and safe bicycling network for New Yangon City which should result in a high rate of bicycling and reduced demand for driving. This policy approach would be relatively inexpensive and would result in NYC being one of the most bike-friendly cities in the world.
Greenway Multi-Use Paths
The land use plan presented by AECOM includes a significant amount of green space along waterways throughout NYC. In addition to the network of protected bike lanes described above, it is recommended to develop a system of multi-use paths throughout those green spaces for the purpose of recreation and as supplemental pedestrian and bicycle infrastructure. These types of multi-purpose pedestrian and bicycle paths are a popular and important amenity in many world class cities around the world.

Final Report – Executive Summary Traffic and Transport Study for the
Development of New Yangon City’s Master Plan
18 | P a g e
Strategy 6 – Shared Mobility Choices
Encourage shared mobility alternatives such as bikeshare, carsharing, and transportation network companies using advanced smart technologies to reduce car ownership and increase walking, biking, and transit.
For decades the only way to enjoy the mobility advantages of automobiles was either by owning your own car or by taking expensive taxis. However, in recent years new technologies have paved the way for new transportation options that have made ‘access instead of ownership’ for vehicles an impactful trend.
There are three primary categories of shared mobility existing today, all of which have just gained wide-spread popularity over the past 1-2 decades: carsharing, transportation network companies (TNCs), and bikeshare.
Bikeshare programs are a type of public transportation which provides 24-hour self-service access to a shared fleet of bicycles. Bikeshare systems can be docked (with stations) or dockless, and utilize a variety of different technologies. Due to the many transportation benefits, relatively low costs, and rapid deployment time of bikeshare systems, it is recommended to develop a public bikeshare system in NYC.
In addition to the bikeshare system, residential and commercial properties in NYC will be encouraged to provide dedicated space for carsharing and TNCs and other future shared technologies such as autonomous mobility provides, sometimes call Transport-as-a-Service (TaaS).

Final Report – Executive Summary Traffic and Transport Study for the
Development of New Yangon City’s Master Plan
19 | P a g e
Strategy 7 – Transportation Demand Management (TDM)
Discourage the use of personal cars for daily trips such as commuting through transportation demand management (TDM) strategies such as area pricing, and parking management in the NYC’s commercial and industrial areas. Limit the use of motorbikes in NYC by gradually transitioning to a daytime, weekday ban on motorbike use throughout the city.
Transportation Demand Management, known as TDM, are policies or programs that work to reduce demand for transportation. TDM policies either reduce the number of trips people need to take, the distances people travel for trips they take, or get people to switch to modes of transportation which use less space on limited public rights of way (ROW).
This study makes a number of TDM policy recommendations such as those for high-quality pedestrian and bicycling facilities, high-quality public transportation, and bikeshare provision. Parking management and parking pricing have been identified as key additional TDM policy approaches for achieving sustainable transportation in New Yangon City.
Parking Management
One of the most effective policies for reducing transportation demand and traffic congestion is strict parking management, and specifically, by limiting and applying market prices on the supply of parking.
On-Street Parking
All on-street parking in NYC should be metered (paid), and the pricing should be dynamic with the target of achieving approximately 70% occupancy during commercial business hours. Dynamically priced parking that achieves 70% occupancy maximizes revenue while also ensuring sufficient parking vacancy to make finding parking both easy and reliable for drivers.1 This also has the benefit of minimizing the number of vehicles circling blocks searching open stalls and the resulting impacts on traffic congestion.
Residential and Commerical Properties
In addition to the on-street parking management, the following off-street carpark requirements are recommended for NYC.
Land Use Category* Standard Minimum Carpark Requirements Minimum 2-Wheeler Parking
Requirements Minimum Service Vehicle
Parking Requirements
Residential
Market Rate Housing 1 space per 200m2 GFA 1 space per unit
Affordable Housing 1 space per 40 units 1 space per unit
Commercial
Office 1 space per 200m2 GFA 1 space per 100m2 GFA One space for garbage truck at each collection point
Retail 1 space per 100m2 GFA 1 space per 100m2 GFA 1 space per 8,000m2 GFA for loading/unloading
Food & Beverage 1 space per 50m2 GFA +20% 1 space per 100m2 GFA Space to be allocated for one service vehicle
Hotel 1 space per 200m2 GFA +20% 1 space per 100m2 GFA 1 space per 8,000m2 GFA for loading/unloading
Factory
Light Industry 1 space per 300m2 industrial GFA 1 space per 200m2 admin/corporate GFA
1 space per 100m2 usable GFA 1 space per 3,000m2 GFA for loading/unloading
Heavy Industry 1 space per 1,000m2 industrial GFA 1 space per 200m2 admin/corporate GFA
1 space per 500m2 usable GFA 1 space per 3,000m2 GFA for loading/unloading
Ports and Logistics 1 space per 5,000m2 of land area 1 space per 200m2 admin/corporate GFA
1 space per 500m2 land area
Notes: *Requirements for other usage subject to review and approval by the authority on case-to-case basis. GFA = Gross Floor Area
1 Shoup, Donald and Pierce, Gregory. “Getting the Prices Right: An Evaluation of Pricing Parking by Demand in San Francisco.” Journal of American Planning Association, Volume 79, Number 1, Winter 2013.

Final Report – Executive Summary Traffic and Transport Study for the
Development of New Yangon City’s Master Plan
20 | P a g e
In order to encourage travel by walking, biking and public transportation, it is recommended to allow for reduced carpark requirements in special designated zones as shown below in Table 4 and Figure 6.
Table 4 – Carpark Reduction Special Zones – Descriptions and Rates
Special Zone Description Reduction Rate
Zone 1 NYC Commercial Center as designated in Master Plan 50%
Zone 2 Areas within 400m radius of an MRT or BRT Station 30%
Figure 6 – Designated Carpark Reduction Special Zones
Source: AECOM
Motorbike policy
The use of motorbikes in NYC should be limited for reasons of safety, traffic disruption, noise and air pollution, and negative impacts on public transit ridership. A two-pronged strategy for limiting motorbike use is proposed for NYC.
The first strategy is a carrot approach: provide high-quality, safe, inexpensive alternative modes of transportation in the form of quality public transit, and a safe, well-connected bicycle lane network.
The second strategy is a stick approach: to slowly increase restrictions on motorbike use over time. First, from the outset of NYC’s development, it is proposed that motorbikes should not be allowed to be used on the R2 Arterial road (limiting anyone crossing Bridge 1 into NYC from the eastern direction by motorbike), and on protected bicycle lanes.
Secondly, by 2030 motorbikes should not be allowed to be used on Arterial roadways within NYC during weekday, daytime hours. Finally, it is recommended that after 2040 motorbikes should not be permitted to be used on any Arterial or Sub-Arterial streets during daytime, weekday hours.

Final Report – Executive Summary Traffic and Transport Study for the
Development of New Yangon City’s Master Plan
21 | P a g e
Figure 7 – Motorcycle Banned Roads inside and outside NYC from 2040*
*Motorcycle banned roads shown are based on the roadway networks developed for the transportation model used for the project and do not exactly correspond to the more refined network design developed for the plan. Additionally, no attempt was made to evaluate motorcycle bans to areas outside of NYC beyond the streets in Yangon where they are already banned.

Final Report – Executive Summary Traffic and Transport Study for the
Development of New Yangon City’s Master Plan
22 | P a g e
Strategy 8 – Goods Movement
Provide road-based freight transport routes for efficient and economical goods transport to support industry and the residential population.
In the short term, industrial freight can be moved using the R2 Arterial road and Bridge 1, along with the private toll road owned by Asia World Ports to Yangon Ports. Also, freight that needs to be moved between NYC and Thilawa ports in the short term will be able to use the established freight route that moves around to the north and east of Yangon’s CBD as shown in to the left below.
In the long term, however, to minimize traffic congestion on internal roadways, it is recommended to divert heavy industrial freight to the Thilawa Port area via the ORR by instituting a large truck ban on internal arterials after the ORR connection between NYC and Thilawa has been completed, which is assumed to be after 2030. Recommended heavy truck banned roads for NYC are shown within the regional context below to the right.

Final Report – Executive Summary Traffic and Transport Study for the
Development of New Yangon City’s Master Plan
23 | P a g e
Travel Demand Forecasts
The transportation modelling approach for this project was based on the use of a transport database which was established for the Project for Comprehensive Urban Transport Plan of the Greater Yangon (YUTRA, 2014) and updated during the Comprehensive Study of the Urban Transport Development program in Greater Yangon (YUTRA-Update, on-going). The transportation model for the project utilizes a socio-economic framework with various population and job data divided among a number of traffic analysis zones (TAZs).
The transportation model was used to project the number of trips between origin and destination pairs both within NYC and between NYC and neighboring communities, as shown in the table and figure below.
No. of OD Pairs for NYC Site
2025 2030 2050
No (000)
Share (%)
No (000)
Share (%)
No (000)
Share (%)
Within NYC site 1,669 61% 2,481 55% 2,788 46%
Other Twante Area 109 4% 345 8% 508 8%
Dala 33 1% 69 2% 170 3%
Inner Urban 198 7% 299 7% 320 5%
Hlaingthayar (inner) 135 5% 234 5% 392 6%
15-30 km from NYC (West) 214 8% 341 8% 413 7%
15-30 km from NYC (East) 159 6% 273 6% 393 6%
Hlaingthayar (Outer) 20 1% 35 1% 82 1%
30 km – from NYC (West) 57 2% 101 2% 167 3%
30 km – from NYC (East) 55 2% 103 2% 241 4%
Thanlyin, Thilawa 98 4% 193 4% 584 10%
Total 2,747 100% 4,474 100% 6,057 100%
2025 2030 2050
The transportation model was also used to project the share of different modes of transportation used by residents and workers traveling between the origin and destination pairs, as shown in the table below.
OD Pairs for NYC Site 2025 2030 2050
(000) (%) (000) (%) (000) (%)
Motorcycle 618 22% 1,082 24% 125 2%
Private Car 289 11% 570 13% 1,036 17%
Taxi 220 8% 354 8% 326 5%
Public Transport 1,621 59% 2,468 55% 4,571 75%
Total 2,747 100% 4,474 100% 6,057 100%

Final Report – Executive Summary Traffic and Transport Study for the
Development of New Yangon City’s Master Plan
24 | P a g e
Traffic Impact Assessment for NYC Phase 1 Master Plan
In order to evaluate the traffic impacts of New Yangon City, a number of key traffic impact assessment (TIA) indicators were identified. The transportation model was then used to calculate each of the indicators for 2025, 2030, and 2050, based on the forecasted socio-economic framework and planned transport networks. These indicators have been defined as the TIA outputs for this study and are described below as follows:
• Person km: the sum of residents’ annual travel distance.
• Person hr: the sum of residents’ annual travel time.
• PCU km: the sum of annual vehicle travel distance.
• PCU hr: the sum of annual vehicle travel time per day.
• Ave. V/C Ratio: Average volume-to-capacity ratios for all roads in the target area.
• Ave. Travel Speed (km/h): Person - km / Person - hr
In order to perform the TIA analysis, the following two network scenarios were developed and tested:
• Do-Committed Network: this case was prepared reflecting road and bridge projects to be completed under the NYC Stage I by 2025. While Bridge 06 is not committed as part of the Stage 1 projects, it is anticipated that it will be needed by 2025 and therefore was included in this analysis case.
• Do-MP Network: this case included the completion of all roads and bridges in the NYC project master plan and was prepared to (1) visualize the traffic situation if all transport projects are implemented as planned; and to (2) identify priority projects and phasing timelines for construction.
The main findings from the analysis of the various network cases are as follows:
• In 2025, only the ‘Do-Committed’ case was tested. The initial model run results showed severe congestion and that the road network would be insufficient to accommodate travel demand. However, with the addition of Bridge 06, together with various adjustments to the network, the model was run a further several times. With these updates, it was shown that the network would be able to satisfy the projected demand and enable smooth traffic flow. Bridge 06 was then included as part of the ‘Do-Committed’ network for subsequent analysis for study purposes.
• For 2030, both the ‘Do-committed’ and ‘Do-MP’ network cases were tested. The results show that the full development of the ‘Do-MP’ network would achieve excellent network performance, in terms of V/C ratio and average travel speeds. However, it is understood that it will not be possible to implement all of the Do-MP network projects by that time. The results found that the ‘Do-Committed’ network would not be able to satisfy the traffic demand in 2030 and that additional roads and bridges would be required by that year.
• For 2050, only the ‘Do-MP’ network case was tested. The result confirmed sufficient road network capacity within NYC to satisfy KPI #3 to maintain V/C of below 1.0. This was achieved by upgrading one major Arterial from 6 to 8 lanes and adding two additional 4-lane Sub-Arterials along the N-S industrial & commercial corridor. These network changes are reflected in this report and in AECOM’s final master plan.
It should be noted that some bridges in the east and north still show high V/C ratio, but this is due to insufficient capacity of existing Yangon road networks. Traffic demand increase in Yangon will exceed the capacity of the road network even after all the network developments proposed in YUTRA 2035 plan are completed. As the analysis in the following section shows, the same is true, and is in fact even worse, in the case that the NYC project is not developed. In order to further investigate the appropriate 2050 network in existing Yangon, it will be necessary to update the work of YUTRA by extending the infrastructure planning horizon from 2035 to 2050.
Comparing Traffic Impacts with and without the NYC Project
To further evaluate the traffic impacts of NYC, the transportation model was used to evaluate a third case, as described below:
Final Report – Executive Summary Traffic and Transport Study for the
Development of New Yangon City’s Master Plan
25 | P a g e
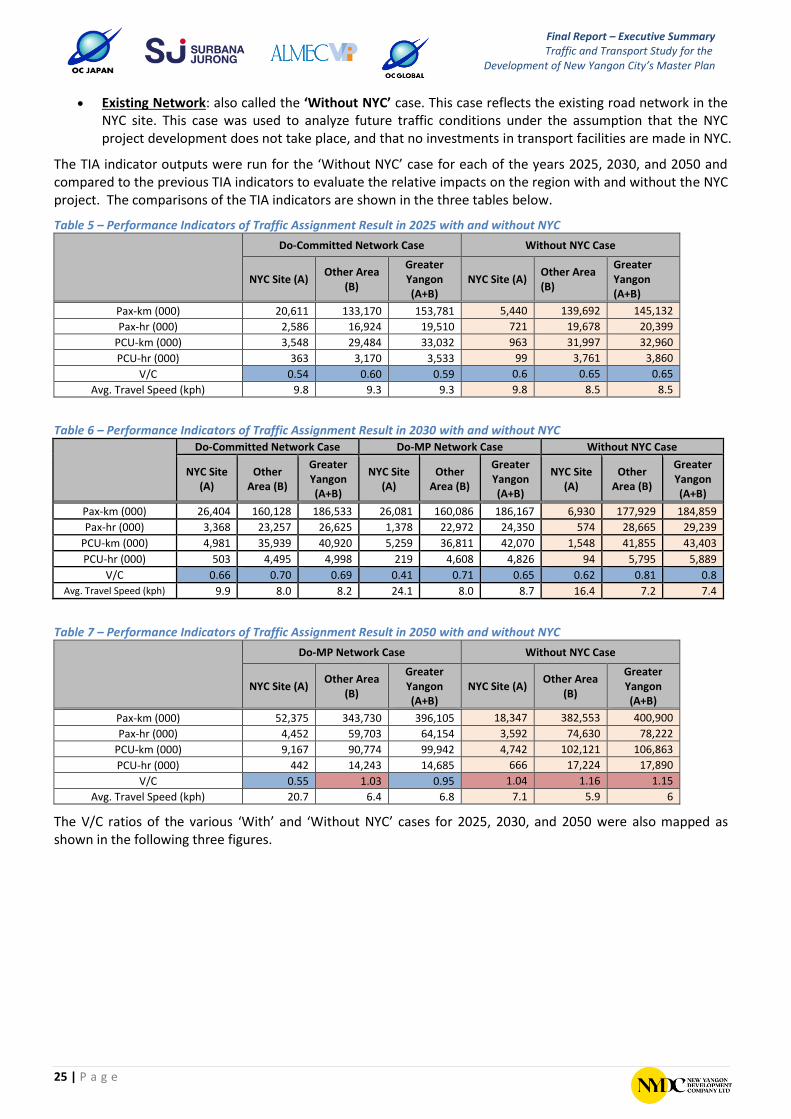
• Existing Network: also called the ‘Without NYC’ case. This case reflects the existing road network in the NYC site. This case was used to analyze future traffic conditions under the assumption that the NYC project development does not take place, and that no investments in transport facilities are made in NYC.
The TIA indicator outputs were run for the ‘Without NYC’ case for each of the years 2025, 2030, and 2050 and compared to the previous TIA indicators to evaluate the relative impacts on the region with and without the NYC project. The comparisons of the TIA indicators are shown in the three tables below.
Table 5 – Performance Indicators of Traffic Assignment Result in 2025 with and without NYC
Do-Committed Network Case Without NYC Case
NYC Site (A) Other Area
(B)
Greater Yangon (A+B)
NYC Site (A) Other Area (B)
Greater Yangon (A+B)
Pax-km (000) 20,611 133,170 153,781 5,440 139,692 145,132 Pax-hr (000) 2,586 16,924 19,510 721 19,678 20,399
PCU-km (000) 3,548 29,484 33,032 963 31,997 32,960 PCU-hr (000) 363 3,170 3,533 99 3,761 3,860
V/C 0.54 0.60 0.59 0.6 0.65 0.65 Avg. Travel Speed (kph) 9.8 9.3 9.3 9.8 8.5 8.5
Table 6 – Performance Indicators of Traffic Assignment Result in 2030 with and without NYC
Do-Committed Network Case Do-MP Network Case Without NYC Case
NYC Site (A)
Other Area (B)
Greater Yangon (A+B)
NYC Site (A)
Other Area (B)
Greater Yangon (A+B)
NYC Site (A)
Other Area (B)
Greater Yangon (A+B)
Pax-km (000) 26,404 160,128 186,533 26,081 160,086 186,167 6,930 177,929 184,859
Pax-hr (000) 3,368 23,257 26,625 1,378 22,972 24,350 574 28,665 29,239
PCU-km (000) 4,981 35,939 40,920 5,259 36,811 42,070 1,548 41,855 43,403
PCU-hr (000) 503 4,495 4,998 219 4,608 4,826 94 5,795 5,889
V/C 0.66 0.70 0.69 0.41 0.71 0.65 0.62 0.81 0.8
Avg. Travel Speed (kph) 9.9 8.0 8.2 24.1 8.0 8.7 16.4 7.2 7.4
Table 7 – Performance Indicators of Traffic Assignment Result in 2050 with and without NYC
Do-MP Network Case Without NYC Case
NYC Site (A) Other Area
(B)
Greater Yangon (A+B)
NYC Site (A) Other Area
(B)
Greater Yangon (A+B)
Pax-km (000) 52,375 343,730 396,105 18,347 382,553 400,900
Pax-hr (000) 4,452 59,703 64,154 3,592 74,630 78,222
PCU-km (000) 9,167 90,774 99,942 4,742 102,121 106,863
PCU-hr (000) 442 14,243 14,685 666 17,224 17,890
V/C 0.55 1.03 0.95 1.04 1.16 1.15
Avg. Travel Speed (kph) 20.7 6.4 6.8 7.1 5.9 6
The V/C ratios of the various ‘With’ and ‘Without NYC’ cases for 2025, 2030, and 2050 were also mapped as shown in the following three figures.

Final Report – Executive Summary – Traffic and Transport Study for the Development of New Yangon City’s Master Plan
26 | P a g e
2025 2030 2050
With NYC
(Do-Committed) With NYC
(Do-Committed) With NYC (Do-MP)
Without NYC
(Existing) Without NYC
(Existing) Without NYC
(Existing)
The comparison of the ‘Do-MP’ and ‘Without NYC’ cases shows a significant difference in the network performance for the Greater Yangon region. The results show that the
NYC development, with sufficient infrastructure (as designated in the ‘Do-MP’ case), would contribute to the improvement of the network performance of the Greater
Yangon region.

Final Report – Executive Summary Traffic and Transport Study for the
Development of New Yangon City’s Master Plan
27 | P a g e
Traffic Impact Assessment of Target Intersections
A traffic impact assessment was conducted for 7 locations across the area. It has 6 signalized junctions and a roundabout. The below Figure 8 and Table 8 shown the locations and the details of the junctions. The analysis years are base year (2018) and the future 2025.
Figure 8 – Traffic impact assessment locations
Table 8 – Intersection details
NO Type Location Intersection
Inventory
B1 Intersection Intersection between Pathein Road – Hlaing River Road 4 legs
B2 Intersection Intersection between Yangon Pathein Road – Ka Naung Min Thar Gyi Road 4 legs
B3 Intersection Intersection between Kyee Mying Daing Road & Hanthawaddy Road 3 legs
B5 Intersection Intersection between Bagayar Street & Kyee Myin Daing Kannnar Road 3legs
B7 Intersection Intersection between Ahlone Road & Kyee Myin Daing Kannnar Road 3 legs
B8 Roundabout Hanthawaddy Roundabout 4 legs
B9 Intersection Intersection between Bagaya Road & Pyay Road 4 legs
Preliminary Conclusions
The base year 2018 analysis shows satisfactory levels of service with the existing conditions. Only the roundabout intersection in the study operates at a non-good level of service and needs improvement. Both the ‘with-NYC’ and ‘without-NYC’ development cases in the year 2025 generate high traffic volumes during peak hours. The signalized and roundabout junctions will not be able to handle traffic demand. Only the B5 and B7 intersections on the study are operating at nearly full capacity. As a result, major improvements are required. The levels of service at the junctions are concluded as shown below for base year (2018), 2025 without development, and with the develop in 2025.

Final Report – Executive Summary Traffic and Transport Study for the
Development of New Yangon City’s Master Plan
28 | P a g e
Table 9 – Junctions delays by Scenario
Junctions
Base Year 2018 Without Development With Development
Intersection Delay
(sec/veh)
Intersection LOS
Intersection Delay
(sec/veh)
Intersection LOS
Intersection Delay
(sec/veh)
Intersection LOS
B1 23.6 C 273.5 F 251.7 F
B2 36.1 D 416.1 F 557.4 F
B3 61.8 E 374.5 F 388.4 F
B5 26.4 C 12.9 B 20 B
B7 28.5 C 25.2 C 54.8 D
B8 185.9 F 287.7 F 272.4 F
B9 64.6 E 43.9 D 57.7 E
Mitigation Measures at Target Intersections
The following strategies are recommendations as mitigation measures to improve congestion conditions at the six target intersections in the micro-simulation above, namely B1, B2, B3, B5, B7 and B9.
Infrastructure Improvements to Enhance Driver Behavior
1. Proper Pavement Markings
2. Median/Moveable Concrete Barriers
3. Bus Bay Installations
Intersection Improvements to Ease Traffic Congestion
1. Optimization of Traffic Signals
2. Intersection Layout Improvements
i. Installation of lane markings such as centerlines, lane edges, and stop lines;
ii. Provision of left-turn auxiliary lanes, where applicable;
iii. Channelization of right-turn lanes, where applicable;
iv. Provision of islands between regular traffic lanes and channelized turn lanes, where applicable;
v. Use of New Jersey-type concrete barriers, where necessary; and
vi. Provision of pedestrian crossings, as much as possible.
Table 10 below gives a summary of the improvements recommended at target intersections. It should be noted that there are a few road and/or intersection improvement projects planned for the existing Yangon. The intersections studied in this chapter could be included in the scopes of future YCDC infrastructure improvement plans and therefore coordination and discussion with the agency is recommended.
Table 10 - Summary of Mitigation Measures at Target Intersections