executive summary - dukespace
TRANSCRIPT

0

1
Executive Summary Specialized Bicycle Components, the third largest bicycle brand in the United States,
partnered with the Nicholas School for the Environment (NSOE) at Duke University to better
understand the environmental impact of bicycle manufacturing, determine where the bicycle
industry might best focus its future improvements, and determine the current state of interest for
sustainably made bikes. This research was conducted between May of 2013 and May of 2014.
As indicated through the limited amount of published environmental programs, the bicycle
industry has done little to address its impact. The outdoor industry, however, transparently
communicates the environmental and social work it’s doing. The Outdoor Industry Association
(OIA) has been dedicated to lessening the environmental impact of the outdoor industry’s
manufacturing processes for several years through brand collaboration in the Sustainability Working
Groups (SWG). While the Bicycle Product Suppliers Association (BPSA) is a member of the OIA, it
has not participated in any of the OIA SWG endeavors (Outdoor Industry Association, 2013).
Specialized did, however, join the OIA with the specific intent to encourage the creation of
sustainability metrics appropriate for the bicycle industry (Bainbridge, 2014d). Perhaps the outdoor
industry is ahead of the bicycle industry in addressing sustainability due to a lack of negative
attention from environmental advocacy organizations. Recently there has been some indication that
the bicycle industry has started to become interested in supply chain sustainability through the 2009
release of the Trek Eco Design bicycle line, the start of U.S. carbon recycling programs, and a recent
panel discussion on sustainability at the Bicycle Leadership Conference (Bicycle Retailer and
Industry News, 2012; Huang, 2009; Staff, 2013).
The goal of this report was to quantitatively analyze the sustainability of processes used to
manufacture Specialized’s bicycles and to qualitatively determine the current state of interest for
sustainably made bikes. A life cycle assessment (LCA) was performed to quantify the impact of a
Specialized Roubaix 56cm frameset, a Specialized Allez 56cm frameset, a DT Swiss R24 Spline
wheelset, and a SRAM PC 1071 bicycle chain. The OIA Equipment Index was piloted to assess
Specialized as a brand and the two framesets considered. Finally, a consumer survey and a media
analysis were conducted to evaluate progress within the industry and hypothesize consumer
perceptions. The results of the LCA show that carbon fiber composite consumes significant amounts of
water, aluminum bicycle manufacturing uses significant amounts of energy, and chain manufacturing
produces significant amounts of recyclable waste. The index results slightly favor the aluminum
bicycle frame, but do not robustly indicate the specific impacts unique to each product.
Qualitatively, the team found that consumers are willing to pay more for sustainable bikes and the
media perceives bicycles and the industry favorably, but focuses on bicycle use over production.
One recurrent theme of this project was the bicycle industry’s privacy concerns as evidenced
by the team’s data collection. This limited access to data partially explains the lack of sustainability
progress made in the industry thus far. The team recommends that both Specialized and the industry
engage with their supply chains to encourage greater transparency and increase collaboration among
bicycle brands and suppliers. The OIA has had success with this cooperative approach as it
facilitates companies to learn from each other and ensures that work is not duplicated. Since little
work has been done to measure and address the sustainability of the bicycle supply chain there is a
substantial opportunity for improvements and much more to learn. The team is hopeful that this
research will catalyze a conversation within the industry that will eventually lead to a more efficient
supply chain.

2
Acknowledgements
We are extremely grateful to Bryant Bainbridge at Specialized Bicycle Components for his
support, expertise, and dedication to this project. He spent countless hours responding to our
questions and his support went beyond that of a client to one of a professional mentor. We would
also like to sincerely thank our faculty advisor, Dr. Deb Gallagher, for her guidance throughout the
project.

3
List of Key Acronyms
ANZTEC The Agreement between New Zealand and the separate customs territory of Taiwan, Penghu, Kinmen, and Matsu on Economic Cooperation
ASI Advanced Sports International BB Bottom Bracket BLC Bicycle Leadership Conference BOD Biological Oxygen Demand BOM Bill of Materials BPSA Bicycle Product Suppliers Association BRaIN Bicycle Retailer and Industry News CIESIN Center for Earth Information Science Information Network CML Center of Environmental Science of Leiden University CNC Computer Numerical Control ECFA Economic Cooperation Framework Agreement EMPA The Swiss Materials Science & Technology Center ESI Environmental Sustainability Index GWP Global Warming Potential IEEE Institute for Electrical and Electronics Engineers ISO International Standards Organization LCA Life Cycle Assessment LCI Life Cycle Inventory MIT Massachusetts Institute of Technology MSDS Material Safety Data Sheet MSI Materials Sustainability Index MP Master’s Project MPG Miles Per Gallon MY Model Year NIST National Institute of Standards and Technology NSOE Nicholas School for the Environment OIA Outdoor Industry Association PFC Process Flow Chart PVC Polyvinyl chloride RSL Restricted Substances List SAC Sustainable Apparel Coalition SSRI Social Science Research Institute SWG Sustainability Working Group U.S. LCI United States Life Cycle Inventory Database VOC Volatile Organic Compounds WFSGI World Federation of the Sporting Goods Industry WTP Willingness to Pay YCELP Yale Center for Environmental Law and Policy

4
Table of Contents
I. INTRODUCTION ............................................................................................................................................. 5
A. PROJECT OVERVIEW ................................................................................................................................................................... 5
B. THE CLIENT.................................................................................................................................................................................. 5
C. THE OBJECTIVE ........................................................................................................................................................................... 6
II. BACKGROUND ................................................................................................................................................ 7
A. THE CURRENT STATE OF SUSTAINABILITY IN THE BICYCLE INDUSTRY ............................................................................ 7
B. EXISTING LIFE CYCLE ASSESSMENTS OF BICYCLES .............................................................................................................10
C. THE USE OF INDICES TO DETERMINE OPPORTUNITIES FOR SUSTAINABILITY IMPROVEMENTS .................................11
D. THE POLITICAL NATURE OF BICYCLE MANUFACTURING .................................................................................................13
III. METHODS ..................................................................................................................................................... 13
A. LIFE CYCLE ASSESSMENT .........................................................................................................................................................13
B. OUTDOOR INDUSTRY ASSOCIATION EQUIPMENT INDEX ..................................................................................................17
C. MEDIA PERCEPTION ANALYSIS ...............................................................................................................................................17
D. CONSUMER SURVEY ..................................................................................................................................................................18
IV. RESULTS AND DISCUSSION ...................................................................................................................... 18
A. BARRIERS TO DATA COLLECTION ..........................................................................................................................................18
B. LIFE CYCLE ASSESSMENT RESULTS.........................................................................................................................................19
C. OIA EQUIPMENT INDEX ..........................................................................................................................................................24
D. MEDIA PERCEPTIONS OF THE BICYCLE INDUSTRY .............................................................................................................28
E. CONSUMER SURVEY ..................................................................................................................................................................33
F. THE BICYCLE INDUSTRY’S OPPORTUNITY FOR IMPROVEMENT .........................................................................................39
V. FINAL RECOMMENDATIONS ................................................................................................................... 39
A. FINAL RECOMMENDATIONS FOR THE CLIENT .....................................................................................................................39
B. FINAL RECOMMENDATIONS FOR THE INDUSTRY.................................................................................................................41
C. SCOPE FOR FURTHER RESEARCH ............................................................................................................................................44
VI. CONCLUSIONS ............................................................................................................................................ 45
VII. WORKS CITED ............................................................................................................................................ 46
VIII. APPENDICES ............................................................................................................................................. 58
APPENDIX 1: THE RESEARCH TEAM ...........................................................................................................................................58
APPENDIX 2: SUMMARY OF LIFE CYCLE ASSESSMENT RESULTS .............................................................................................59
APPENDIX 3: FULL LIST OF LIFE CYCLE ASSESSMENT ASSUMPTIONS ...................................................................................61
APPENDIX 4: FULL INDEX ASSESSMENT .....................................................................................................................................84
APPENDIX 5: ARTICLES USED IN MEDIA ANALYSIS .................................................................................................................92
APPENDIX 6: SURVEY INSTRUMENT ......................................................................................................................................... 157
APPENDIX 7: ADDITIONAL SURVEY FIGURES ........................................................................................................................ 165
APPENDIX 8: STATA OUTPUT .................................................................................................................................................. 174

5
I. Introduction
A. Project Overview
Specialized Bicycle Components partnered with the Nicholas School of the Environment
(NSOE) at Duke University to better understand the environmental impacts of bicycle
manufacturing, determine where the bicycle industry might best focus its future improvements, and
identify barriers to environmental initiatives within the industry. A three-person graduate student
team completed this project through the Nicholas School Master’s Project (MP) program.
B. The Client
The bicycle industry saw U.S. sales of six billion dollars in 2012 (National Bicycle Dealers
Association, 2012). These sales are overwhelmingly dominated by imported bicycles where, in 2011,
99 percent of bicycles sold were made in China and Taiwan (93% China and 6% Taiwan). This trend
has been constant for many years and without changes in tariffs, the market will likely stay this way
(National Bicycle Dealers Association, 2012). Specialized Bicycle Components holds approximately
nine percent of the United States market share which makes it the third largest brand after Giant and
Trek (National Bicycle Dealers Association, 2012). Specialized’s goal is “to be constantly pushing the
envelope with innovative, high-performance, higher-price-point bicycles and equipment” (Bryant).
The company designs high-end mountain, road, fitness, electric, BMX, dirt jump, and kids bicycle
frames and designs a wide range of bicycle equipment such as tires, saddles, bags, tools, helmets,
lights and wheels (Specialized Bicycle Components, 2014). While Specialized has offices in Taiwan
and China, it does not own its manufacturing facilities (Bainbridge, 2014c).
Bryant Bainbridge, the research team’s contact at Specialized, is the company’s full time
Sustainability Strategist (Bainbridge, 2014a). Bainbridge has many years of experience working in the
product development field. He first worked as a conservation biologist after college and due to his
passion for the then new sport of mountain biking, he began a career in product development. He
has since worked for Specialized as Director of Research and Development, General Manager of
Research & Development for Converse, Director of Product Development for Nike, Inc.’s
Women’s Division and later worked as the Director of Considered Product Resources where he
contributed heavily to the Nike Considered Index, a tool that helps product designers make
environmentally-conscious decisions in the areas of materials, waste, chemistry, and innovation
(Nike, Inc., 2014).
Since becoming Specialized’s Sustainability Strategist in 2009, Bainbridge has promoted the
adoption of several environmental and social strategies, which have made Specialized one of the
most sustainable brands in the industry. Specialized’s work in this area is focused in six areas: policy,
people, metrics, materials, packaging, and collaboration (Bainbridge, 2014d). Specifically, Specialized
continually strives to:
Draft and communicate policies that promote sustainable production
Empower its factories to meet labor policies and regularly audits its factories to celebrate
achievements and identify further opportunities for improvement
Create and use metrics that enable progress to be measured

6
Landscape the materials and packaging it uses, eliminate the impactful materials, and
focus usage on the least impactful materials
Engage with other brands and suppliers interested in collaborating in order to minimize
overall industry impacts (Bainbridge, 2014d)
C. The Objective
Bicycles are commonly considered a tool for environmental solutions. Increasing ridership
reduces fossil fuel consumption, eases traffic congestion, and improves public health by reducing
risks associated with obesity (Bikes Belong; Hall, 2012). While these impacts are undeniably
important to create a more sustainable society, they fail to bring up an important question: are
bicycles produced sustainably? If they are not, increasingly strict environmental regulations on
substances in manufacturing, waste water discharge, and solid waste disposal, along with the rising
cost of energy may cause supply chain disruption through non-compliant suppliers being shut down
and the cost of shipping rising. The companies that prosper will be ones that proactively work with
their suppliers to ensure these risks are mitigated.
The goal of this report was to quantitatively analyze the sustainability of manufacturing
processes used to produce Specialized’s bicycles and to qualitatively determine the current state of
interest for sustainably made bikes. The research team understands environmental sustainability to
have two levels. The low level of sustainability is simply compliance with all environmental laws,
while the high level of sustainability involves exceeding legal requirements through environmental
leadership and innovation. With these differences in mind, the team assessed where Specialized is
along this “sustainability spectrum” and hypothesized how this compares to the general bicycle
industry.
In the first part of the project, two quantitative analyses compared the environmental
impacts associated with manufacturing select bicycle components. The first quantitative analysis was
a series of life cycle assessments (LCAs). The two leading bicycle frame materials – aluminum and
carbon fiber – were analyzed as well as a selection of bicycle components. The second quantitative
analysis used a pilot version of the Outdoor Industry Association’s (OIA) Equipment Index to
assess Specialized as a brand and the two frames considered. The results of these two quantitative
analyses informed one another and together comprehensively highlighted opportunities to reduce
bike manufacturing’s environmental impact.
These quantitative analyses were complimented by two qualitative analyses to understand the
current state of interest for sustainably made bikes. First, an in depth analysis of articles in major
periodicals helped interpret the public perception of bicycles and bicycle manufacturing over the
past ten years. Second, a survey of the Duke University community assessed bicycle consumer
behavior and gauged consumer demand for sustainably manufactured bicycles. The objectives of the
project were to:
Determine the environmental impact of manufacturing an aluminum bicycle frame, a carbon
fiber composite bicycle frame, and a selection of bicycle components
Identify where significant changes can be made in the manufacturing process and in the
supply chain to reduce the overall environmental impact of manufacturing these parts
7
Identify current perceptions of bicycles and the bicycle industry as expressed in the popular
press
Measure current bicycle consumer behavior and willingness-to-pay for sustainably
manufactured bicycles
The team believes that the evidence derived from the survey results, combined with results
from the quantitative analysis, present several opportunities for the bicycle industry to improve its
environmental impact from manufacturing. Additionally, the team hopes that the results from the
media analysis lend an explanation to the progress made thus far in sustainably made bicycles.
II. Background
A. The Current State of Sustainability in the Bicycle Industry
Currently, only four leading bicycle brands mention their sustainability or corporate social
responsibility efforts online: Trek Bicycles; Specialized Bicycle Components; the Accell Group, a
European bicycle company that owns Ghost, Raleigh, and Diamondback brands; and Dorel
Industries, a publicly traded Canadian company that owns Cannondale, Schwinn, Mongoose, and
GT brands (Accell Group, 2013; Dorel; Specialized, 2013; Trek, 2014).
As indicated through the limited amount of published environmental initiatives, the bicycle
industry has done little to address its environmental impact. The outdoor industry, however,
transparently communicates its sustainability work. The Outdoor Industry Association (OIA), an
industry coalition dedicated to growing the outdoor industry, has been lessening the environmental
impact of the outdoor industry’s manufacturing processes for several years. In 2007, the OIA started
the Sustainability Working Group (SWG) which brings together competitors within the OIA to
collaborate on minimizing the impacts of their supply chain (Outdoor Industry Association, 2013).
In 2010 the OIA SWG introduced the Eco-Index, a qualitative tool that assesses a company’s
suppliers (Bardelline, 2010). Since the introduction of the Eco-Index, the SWG has grown to
approximately 450 member brands and has brought awareness to several environmental and social
challenges within the industry (Sustainability Working Group, 2014). The success of the group is
partly due to the high level of collaboration between member companies. For example, The North
Face recently completed research on the goose down in their supply chain. While tracing the
material, The North Face developed a standard for responsibly sourced down with the help of an
accredited third-party certification body, Control Union. Upon the standard’s completion, The
North Face gifted it and their research findings to the entire industry at the 2014 winter SWG
meetings (Mott, 2014). This gesture is indicative of the collaboration and transparency that exists
among competitors in the SWG, which has contributed to the outdoor industry’s success by
minimizing the duplication of work for brands and suppliers and consequently reducing the
industry’s environmental impact.

8
The Bicycle Product Suppliers
Association (BPSA) became a
member of the OIA recently;
however, only Specialized and SRAM,
a major bicycle components brand,
have participated in the OIA SWG
endeavors (Bicycle Product Suppliers
Association). While the OIA is not the
bicycle industry’s coalition, Specialized
briefly joined it for several years in
order to support and benefit from its
work (Bainbridge, 2014d).
It is possible that the outdoor
industry is ahead of the bicycle
industry in addressing sustainability
due to a lack of negative attention
from environmental and social
advocacy organizations. Many
outdoor industry companies sell
clothing and textile manufacturing has
been scrutinized for poor labor and
environmental practices. Nike, a
member of the OIA, was attacked by
advocates over child labor issues in
the late 1990s (Boggan, 2001). This
attack prompted Nike to invest in
better social procedures.
Environmentally, Greenpeace’s Detox
campaign has linked iconic clothing
brands with suppliers that are contaminating water with toxic chemicals (Greenpeace, 2014a). Nike
was one of the many brands exposed, but its ongoing work in sustainability minimized the negative
attention brought to the brand. Today, Nike is a prime example of a company that is at the high end
of the sustainability spectrum, and yet it is still susceptible to negative press.
The bicycle industry has not received much, if any, negative attention from environmental
organizations. In fact, these organizations tend to promote the bicycle industry by focusing on
increasing ridership. Interestingly, environmental non-profits propose bicycling as a means to
decrease pollution, but bicycle advocacy non-profits have found that leveraging environmental
benefits is not effectively persuasive at increasing ridership (Doty, 2013). Bikes Belong, the League
of American Bicyclists, and the Alliance for Walking and Biking, three influential bicycle non-profits,
have missions to increase the amount of commuting cyclists in the country and to increase the
amount of “complete streets” that can safely accommodate pedestrians, cyclists, motorists, and
The research team is thankful for the time, advice, and
insights* shared by these experts throughout this research
project:
Roland Bieri, DT Swiss
Eric Bjorling, Trek Bicycles
JT Burke, Breezer Bikes
Eric Bybee, Trek Bicycles
Mark DiNucci, DiNucci Cycles
Alex Doty, Bicycle Coalition of Greater Philadelphia
Alexandra Fortunato, SRAM Portugal
Jay Golden, Duke University
Jon Goulet, Specialized Bicycle Components
Nikki Hodgson, Outdoor Industry Association
Kate Jakubus, SRAM
Dr. Randy Kramer, Duke University
Dave LoSchiavo, Durham Cycles
Eóin McDonnell, Duke University
Jacob McGahey, Industry Nine
Patrick McGuire, Duke University
Seth Nesselhuf, Quality Bicycle Products
Shanna Powell, Industry Nine
Neethi Rajagopalan, Duke University
Sunny Tsai, Specialized Taiwan
Erik van der Hout, Accell Group Wolf VormWalde, Specialized Bicycle Components
Martin Walthert, DT Swiss
Eric Wilmanns, Brown & Wilmanns Environmental
*The views and opinions reflected in this paper do not necessarily represent
the views and opinions of the experts listed. Image Source: cyclingtips.com.au
Image source: Cycling Tips
9
public transit (Smart Growth America, 2010). While these non-profits do mention environmental
benefits of cycling on their websites, it is clearly not their main prerogative. They primarily focus on
increasing safety for riders, a significant barrier for interested cyclists. With environmental non-
profits highlighting bicycle’s as an environmentally friendly mode of transportation and bicycle non-
profits working to make cycling convenient and safe, few consumers are left to question the full
impact of bicycles. Perhaps this lack of consumer questioning explains the bike industry’s ignorance
of opportunities available to reduce its environmental impact.
Recently, there has been some indication that the bicycle industry has started to become
interested in supply chain sustainability. In 2009, Trek introduced two bicycles to a new Eco Design
line. The Belleville and the Atwood bicycles minimized overall life cycle impacts through the use of
Okala design principles (Huang, 2009). Okala is a set of guidelines that product and industrial
designers use to help inform their choices with regard to the environment (Okala Practitioner, 2014).
Through the use of Okala, Trek found that painting was highly impactful due to volatile organic
compound (VOC) emissions and therefore chose to powder coat these bicycles (Bjorling & Bybee,
2013). Additionally, they found that bicycle tires’ short lives largely contributed to the overall bicycle
impact and began sourcing sustainably grown rubber. Perhaps what got the most attention from
these bikes were the unique handlebar grips and saddles, which were designed to be easily
deconstructed and recycled. The team spoke with two Trek employees involved in the Eco Design
project and they explained that while the bicycles are no longer produced, lessons learned through
the project led to manufacturing changes throughout Trek’s entire product line. For example, Trek
now offers a take-back program for its used tubes and sources some of its rubber from a sustainably
managed rubber tree farm (Bjorling & Bybee, 2013).
On Earth Day in 2011, Bicycle Retailer and Industry News (BRaIN) published an article
highlighting new carbon fiber waste recycling programs at Trek, Specialized, and Advanced Sports
International (ASI), owner of Fuji, SE Racing, Kestrel, and Breezer brands (Bicycle Retailer and
Industry News, 2012). Furthermore, in late 2012 the BPSA announced its new partnership with the
OIA to look into sustainable production techniques (Wiebe, 2012). A panel discussion on
incorporating sustainability into a bicycle’s full life cycle was held at the Bicycle Leadership
Conference (BLC) in April of 2013 and the thesis client, Bryant Bainbridge, sat on the panel (Staff,
2013). Robb Shurr of Walden Hyde, a Boulder based consulting company, also sat on the panel.
Walden Hyde conducted research specifically for this panel through an online survey which looks at
cyclists’ interest in sustainability and includes qualifying questions to denote how the reader
categorizes himself (e.g. racer, casual, commuter, etc.), if the reader believes a bicycle is a “green”
product, and if the reader considers the environmental and social impacts of bicycles and bicycle
products before making purchases (Staff, 2013; Walden, 2013a). Walden Hyde surveyed 1,000
people across 48 states, 80 percent of whom believe bicycles are a sustainable product and 62
percent surveyed said they would pay more for a sustainably made bicycle (Walden, 2013b). While
there is some indication that the industry is beginning to consider the environmental impact of
making bicycles, there is significant opportunity to do more.

10
B. Existing Life Cycle Assessments of Bicycles
Four existing life cycle assessments of bicycles were reviewed. Three of these LCAs
compared bicycles to other modes of transportation. The Swiss Materials Science & Technology
center (EMPA) presented an LCA study that compares a conventional bicycle to an electric bicycle,
a gas scooter, an electric scooter, a gas car, and an electric car. This LCA was presented at the 2011
Eurobike trade show in Friedrichshafen, Germany (Duce, 2011). The results of this assessment
show that conventional bicycles have the least environmental impact. This result is predictable, and
it does not tell the reader if bicycle manufacturing can be more efficient.
A master’s student at Massachusetts Institute of Technology (MIT) completed an LCA
comparing walking to bicycling and a variety of other transportation modes. The conclusion states
that bicycling, walking, and using an electric bike (ebike) requires approximately the same energy
inputs (Dave, 2010). However, this report does not cite the assumptions made to determine the
energy inputs of manufacturing bicycles. A third LCA compares bicycles to ebikes, scooters, and
electric scooters (Leuenberger & Frischknecht, 2010). The researcher extrapolated the energy input
to manufacture bicycles by scaling down available car manufacturing data. Since this does not
include available information on environmental management techniques used in the industries, this
extrapolation is likely to be inaccurate (Leuenberger & Frischknecht, 2010).
The fourth LCA reviewed was commissioned by the Accell Group in 2012 (Accell Group,
2012). The Accell Group hired Ernst & Young who completed LCAs on four different bicycles: a
fully-equipped city bicycle,1 a carbon road bicycle, a steel children’s bicycle, and an electric bicycle.
Ernst & Young used the ecoinvent database and the SimaPro software application to complete the
analysis (Hout, 2014). The results are normalized to ecopoints2 using the ReCiPe methodology and
converted to the number of kilometers one must replace driving with bicycle riding to offset the
production of each bicycle (Accell Group, 2012). Interestingly, the bicycles with more components
(i.e. the fully-equipped city bicycle) have the highest impact. The carbon bicycle is found to have the
lowest impact, due to the fact that this type of bicycle has very few additional components and
accessories. The carbon material itself has a higher impact then aluminum or steel, but the
researchers attribute the low weight of the material to the relatively low environmental impact. The
researchers note that the uncertainty in the environmental impact data concerning carbon is
relatively high and needs further research (Hout, 2014).
The reports reviewed fail to recognize three key points. First, commuting is not the primary
reason people cycle. According to a survey from 2003, 41% of people cycled for their health, 37%
cycled for recreation, and only 5% cycled for commuting (bicyclinginfo.org). Fortunately, bicycle
commuting has been growing (Figure 1). The League of American Bicyclists (League) reported that
communities with comprehensive bicycle infrastructure, named Bicycle Friendly Communities by
the League, nearly doubled their commuters between 2000 and 2010. On average, the number of
bicycle commuters rose approximately 39% during this decade (League, 2013).
1 A fully-equipped city bicycle is one that is sold with fenders, a bicycle rack, a chain guard and lights. 2 An “ecopoint” is a unit used in comparative LCAs. All environmental impacts are normalized into ecopoints. In the Accell Group’s analysis, 1,000 ecopoints are equivalent to the environmental impact caused by one European in one year (Accell Group, 2012).

11
Figure 1. The growth of U.S. bicycle commuting between 2000 and 2010 (The League of American Bicyclists, 2013).
Secondly, the LCAs, with the exception of the Accell Group’s LCA, focus on influencing the
consumer and not the manufacturer. Therefore, manufacturers benefit from these results since the
reader recognizes the low impact of using bicycles and not the potential manufacturing
inefficiencies. Thirdly, most of the LCAs do not consider the environmental impact of a carbon
fiber bicycle frame. Carbon fiber bicycles are used by racers and many recreational riders, and
manufacturing carbon fiber bicycle frames can give off up to 20 times more greenhouse gas
emissions than steel, a common bicycle frame material (Halper, 2011).
In order to accurately assess the environmental impact of bicycle manufacturing, an LCA
must fully compare the two leading frame materials – aluminum and carbon fiber. In addition, the
LCA must be targeted to manufacturers instead of consumers. With the potential exception of the
Accell Group’s study, none of the LCAs reviewed use data directly from actual suppliers. Using
actual data more accurately determines the manufacturing impact, thereby allowing bicycle brands to
accurately determine the opportunities available in their own supply chain.
C. The Use of Indices to Determine Opportunities for Sustainability Improvements
Despite the popularity of the term “sustainability”, there are many questions as to how it
should be measured. What spatial or temporal scales should be considered? Should economic and
social considerations be included? Are certain aspects more important than others, and how should
this be taken into account? Numerous organizations have attempted to answer these questions
through the development of their own tools to measure sustainability including indices, benchmarks,
audits, accounting, and others. The use of indices has proven to be quite popular and successful in
measuring all different aspects of human development. An index is comprised of a series of
indicators or metrics that together, represent the overall goal, such as economic health, sustainability,

12
and others. Because developers have different priorities, and therefore different indicators, indices
can be specifically tailored to different scales and types of organizations. One of the first indices was
the Human Development Index, developed by the United Nations in 1990, which combines several
different indicators for social and economic development into a single statistic. Another well-known
index is the Environmental Sustainability Index (ESI), developed in response to the Millennium
Development Goals, by the Yale Center for Environmental Law and Policy (YCELP) and the
Center for Earth Information Science Information Network (CIESIN) at Columbia University in
2000. The ESI was the first index that quantitatively measured sustainability and environmental
indicators. The same developers also created the Environmental Performance Index, which ranks
countries based on environmental features such as air quality, water resources, carbon emissions,
and more (Yale University, 2014).
These indices have proven very influential and useful for measuring sustainability on a
broad, nationwide, scale. However, using the results from these indices to drive change can be
difficult because identifying specific areas for improvement is hard to do on such a broad scale. As a
result, some specific companies have begun developing more targeted measurement tools to answer
questions about the sustainability of their own supply chains and manufacturing processes. In 2009,
Wal-Mart became one of the first private companies to use a sustainability survey for their supply
chain (Fast Company, 2010).
The Outdoor Industry Association’s Equipment Index
The Outdoor Industry Association is an example of an organization that developed an index
specifically for their industry. The OIA’s Eco-Index was developed with specific outdoor industry
challenges in mind. When a more quantitative tool was needed, the OIA collaborated with the
Sustainable Apparel Coalition (SAC) and Nike to create the Higg Index. The index, introduced in
2012, takes qualitative aspects of the OIA Eco-Index coupled with the quantitative rankings in
Nike’s Materials Sustainability Index (MSI) to provide a standardized framework for companies to
evaluate and compare the environmental and social impacts of manufacturing apparel and footwear
(Sustainable Apparel Coalition, 2012).
The Higg Index requires information on suppliers’ environmental management systems such
as hazardous material protocols, waste and water management techniques, and energy usage. Based
on the information provided, the index determines a product score as well as an overall brand score
(Sustainable Apparel Coalition, 2012).
Different from an LCA, the Higg Index can assess opportunities for policy, management,
material, manufacturing, and process related improvements within the supply chain. While LCAs
provide important information they do not provide context to the problem. The Higg Index,
however, influences change by clearly defining what additional steps should be taken to achieve a
more sustainable supply chain.
Recently, both SRAM and Specialized have heavily contributed to the OIA’s latest project,
the Equipment Index, which is specific to outdoor gear. This index is being designed to rate all
outdoor equipment including bicycles, snowshoes, surfboards, and the like. It is meant to be a

13
streamlined process and easy to complete for even the smallest of equipment companies, in order to
promote sustainability at all stages of company development (Bainbridge, 2013).
D. The Political Nature of Bicycle Manufacturing
There are several political forces that directly impact the bicycle market, most notably trade
restrictions such as tariffs on imports and anti-dumping duties.3 Recently there have been several
international policies that have had a noticeable impact on the bicycle industry: the Economic
Cooperation Framework Agreement (ECFA), the Agreement between New Zealand and the
Separate Customs Territory of Taiwan, Penghu, Kinmen, and Matsu on Economic Cooperation
(ANZTEC), and anti-dumping regulations in the United States, European Union, and Brazil.
China and Taiwan signed the ECFA in 2012 with the goal of reducing trade barriers
between them through the elimination of tariffs. The ECFA decreased tariffs on bicycles and bike
parts gradually from 12 percent in 2010 to five percent in 2011 and finally eliminated them in 2012
(Bike Europe, 2011). ANZTEC was put into effect in December of 2013, which removed all tariffs
on bicycles and subsequently resulted in a 45 percent increase in exports of bicycles to New Zealand
(Bicycle Industry and Retailer News, 2014). The removals of trade barriers and tariffs, such as
ANZTEC and ECFA have a vast impact on the bicycle industry as they directly increase demand for
bicycles and bike parts.
Anti-dumping laws in the United States, European Union, and Brazil have also had a notable
impact on the bicycle market. In 2012 Brazil introduced an anti-dumping law aimed at tires from
Vietnam, which had represented 18 percent of the tire market share in Brazil (Bike Europe, 2014).
In the United States and the European Union anti-dumping laws exist which impose a duty on
imported bicycles or bicycle parts.4 In the EU the anti-dumping tax is in the form of a 48.5 percent
duty on all bikes and bike parts imported from China, Indonesia, Malaysia, Sri Lanka, and Tunisia,
with exceptions of a few companies (Bike Europe, 2013). In the U.S. the anti-dumping tax is a less
than 15 percent tariff on imported bicycles5 (United States International Trade Commission, 2013).
III. Methods
A. Life Cycle Assessment
The LCAs in this study reviewed two bicycle frames and several bicycle components.
Specifically, they compared two bike frame materials: aluminum and carbon fiber. The goal of the
LCA portion of the study was to identify the most impactful processes and materials in bicycle
manufacturing. The LCA’s scope covered the material extraction, manufacturing and distributing
phases of the life cycle. The distribution considered did not include shipments from the
manufacturer to the point of sale. The scope did not include packaging materials, the consumer use
3 “Dumping” is exporting a product at a price point lower than normally seen in the company’s home country (World Trade Organization, 2014). 4 Council Regulation No. 703/96 EEC. 1997 O.J. L 016 regulates anti-dumping in Europe
5 The U.S. anti-dumping tariff does not apply to bicycles produced in Australia, Bahrain, Canada, Chile, Colombia, Africa, the Caribbean, Israel, Jordan, Morocco, Mexico, Oman, the Dominican Republic, Panama, Peru, and Singapore.
14
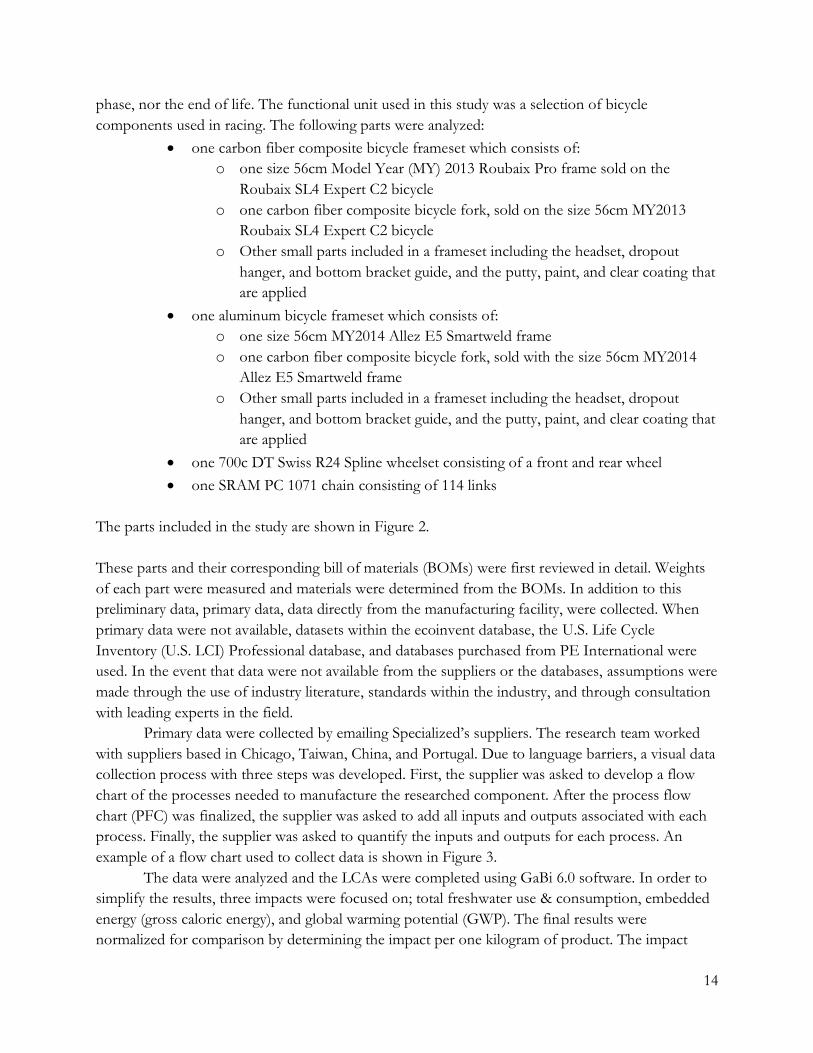
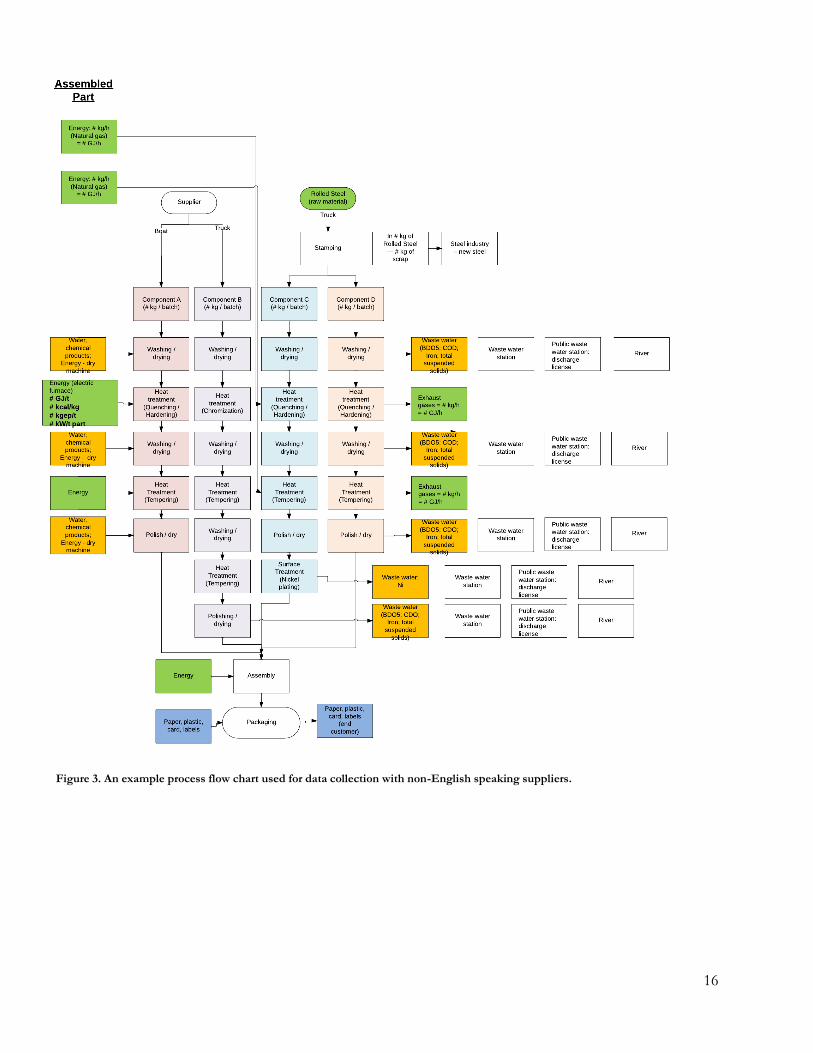
phase, nor the end of life. The functional unit used in this study was a selection of bicycle
components used in racing. The following parts were analyzed:
one carbon fiber composite bicycle frameset which consists of:
o one size 56cm Model Year (MY) 2013 Roubaix Pro frame sold on the
Roubaix SL4 Expert C2 bicycle
o one carbon fiber composite bicycle fork, sold on the size 56cm MY2013
Roubaix SL4 Expert C2 bicycle
o Other small parts included in a frameset including the headset, dropout
hanger, and bottom bracket guide, and the putty, paint, and clear coating that
are applied
one aluminum bicycle frameset which consists of:
o one size 56cm MY2014 Allez E5 Smartweld frame
o one carbon fiber composite bicycle fork, sold with the size 56cm MY2014
Allez E5 Smartweld frame
o Other small parts included in a frameset including the headset, dropout
hanger, and bottom bracket guide, and the putty, paint, and clear coating that
are applied
one 700c DT Swiss R24 Spline wheelset consisting of a front and rear wheel
one SRAM PC 1071 chain consisting of 114 links
The parts included in the study are shown in Figure 2.
These parts and their corresponding bill of materials (BOMs) were first reviewed in detail. Weights
of each part were measured and materials were determined from the BOMs. In addition to this
preliminary data, primary data, data directly from the manufacturing facility, were collected. When
primary data were not available, datasets within the ecoinvent database, the U.S. Life Cycle
Inventory (U.S. LCI) Professional database, and databases purchased from PE International were
used. In the event that data were not available from the suppliers or the databases, assumptions were
made through the use of industry literature, standards within the industry, and through consultation
with leading experts in the field.
Primary data were collected by emailing Specialized’s suppliers. The research team worked
with suppliers based in Chicago, Taiwan, China, and Portugal. Due to language barriers, a visual data
collection process with three steps was developed. First, the supplier was asked to develop a flow
chart of the processes needed to manufacture the researched component. After the process flow
chart (PFC) was finalized, the supplier was asked to add all inputs and outputs associated with each
process. Finally, the supplier was asked to quantify the inputs and outputs for each process. An
example of a flow chart used to collect data is shown in Figure 3.
The data were analyzed and the LCAs were completed using GaBi 6.0 software. In order to
simplify the results, three impacts were focused on; total freshwater use & consumption, embedded
energy (gross caloric energy), and global warming potential (GWP). The final results were
normalized for comparison by determining the impact per one kilogram of product. The impact

15
assessment methodology used for calculating GWP was the Center of Environmental Science of
Leiden University’s 2001 methodology (CML2001-Apr. 2013).
Figure 2. Bicycle parts in life cycle assessment study. Seat posts pictured were not considered.
16
Figure 3. An example process flow chart used for data collection with non-English speaking suppliers.

17
B. Outdoor Industry Association Equipment Index
The team used a pilot version of the OIA’s Equipment Index to assess Specialized’s brand
and two bicycle frames. The objectives of the study were:
To determine its effectiveness in identifying the most impactful parts of the bicycle supply
chain
To gauge if the index fulfills its goals of being accessible and straightforward
To provide valuable information to Specialized about the sustainability of two of their
products as well as the overall brand as determined by the Index
To reveal any inconsistencies or potential areas of improvement in the draft index
Information to complete the index was acquired through email and phone consultation with
the client contact, Bryant Bainbridge, as well as through email correspondence with other experts at
Specialized. The team was also supplied with Specialized’s policy, supplier agreement, quality
assurance, and product testing documents. Additionally, some information, such as product weights,
was supplied via data collected from overseas suppliers.
The Equipment Index assessment was completed in an online module, which is currently in
draft form and will be revised prior to its release based on feedback from pilot tests. Each section is
designed with simple indicator questions that provide a robust insight into each aspect of the brand
and supply chain’s sustainability level. To complete the module, each indicator was interpreted as
broadly as possible. For example, the End of Life section asks whether the brand has a recycling
program for its products. Specialized does not have a recycling program for their complete line of
products, but they do offer a take back program to recycle carbon frames from any manufacturer;
therefore Specialized satisfies this metric.
C. Media Perception Analysis
An analysis of popular press articles gauged the perceptions of bicycles and the bicycle
industry. Articles published in The Washington Post between January of 2005 and March of 2014, in
The Economist from January 2006- April 2014, and in The New York Times from January 2004 to
March 2014 were reviewed. The Lexus Nexus database and each publication’s individual search
engine were used to search for articles containing the terms “bicycle industry”, “bicycle
manufacturing”, “bike”, and “bicycle.” Only the articles truly pertaining to bicycles or the bicycle
industry were considered. Articles not directly related to the bicycle industry, such as obituaries and
book reviews, were omitted from the analysis. The publications reviewed do not include BRaIN,
Bicycling Magazine, and similar bicycle-themed periodicals in order to highlight the perceptions of the
general public and not bicycle industry enthusiasts.
Each relevant article was read and reviewed to determine if it had a positive, negative, or
ambiguous slant. For each major publication, the number of articles with each slant was counted and
recorded. Articles pertaining specifically to the bicycle industry were reviewed further and recorded
in their own table. After tabulating the slant of each publication, the overall perceptions of the
bicycle industry were hypothesized.

18
D. Consumer Survey
A survey gauged consumer demand for sustainably produced bicycles. The questions were
developed using skills learned in the course Social Science Surveys taught by Randall Kramer at
Duke University, as well as with assistance from the Social Science Research Institute (SSRI) at
Duke. The survey was administered in January and February of 2014 and sampled the Duke Campus
community, including faculty, staff, and students. The results were collected using Qualtrics Survey
software and analyzed using Microsoft Excel and STATA, a data analysis and statistical software
program.
IV. Results and Discussion
A. Barriers to Data Collection
Data collection is notoriously difficult for LCAs since it requires measuring all inputs and
outputs of each life cycle step. This is time consuming even when the data collection process is
streamlined. This study had an added challenge while collecting data since many bicycle suppliers
and brands are extremely concerned with protecting their proprietary information. Since Specialized
does not own any manufacturing facilities, all data had to be collected through its suppliers.
Bainbridge prepared the suppliers by explaining the benefits to all parties involved. Bainbridge
contacted 19 suppliers and the initial responses were resistant or simply non-existent due to privacy
and time management concerns (Bainbridge, 2014b). The data requested, even the PFCs, are not
something bicycle manufacturers commonly keep on hand. A Specialized employee based in Taiwan
explained to Bainbridge that even compiling a PFC is a difficult request to meet. She said “Normally
[sic] factory doesn’t have the documents you might request in [sic] hand. They assume the questions
or documents you are going to ask [sic] will require lots [sic] man power to arrange or either [sic]
some special know how or even they have not known well themselves [sic]” (Confidential
Informant). Another supplier replied to Bainbridge’s request to participate in the study by simply
saying “We are too busy now, we can not do this university study this year. The best timing to do it
is July next year” (Confidential Informant). While the majority of the responses received were
extremely polite, they did not choose to participate in the research. It is possible that some brands
were unwilling to invest time in this data collection because they did not understand the potential
value in this work. The data collection could have been seen as a distraction from making product
rather than an opportunity to understand potential improvements in process, waste, or energy
management, which may in turn result in significant savings. Of the 19 suppliers Bainbridge contacted, only four agreed to supply data. Some of these
suppliers were exceptionally excited to be part of the project. For example, DT Swiss’s Vice
President of Research and Development, Martin Walthert, jumped at the opportunity to participate
in the study explaining that DT Swiss “…know[s its] processes but so far never looked at them from
this perspective. No question, the perspective is a very interesting one, but being a smaller company
[than Specialized,] DT Swiss has to make sure that we stay focused to make sure that we can serve
our customers the way they expect it – or even better…” (Walthert, 2013). Additionally, SRAM’s
chain manufacturer in Portugal was excited to participate since it is already concerned with
19
minimizing its environmental impact. In fact, the plant is certified by the International Standards
Organization’s (ISO) 14001 program, which provides frameworks for companies in any sector to
build effective environmental management systems (International Standards Organization, 2014;
Jakubas, 2013).
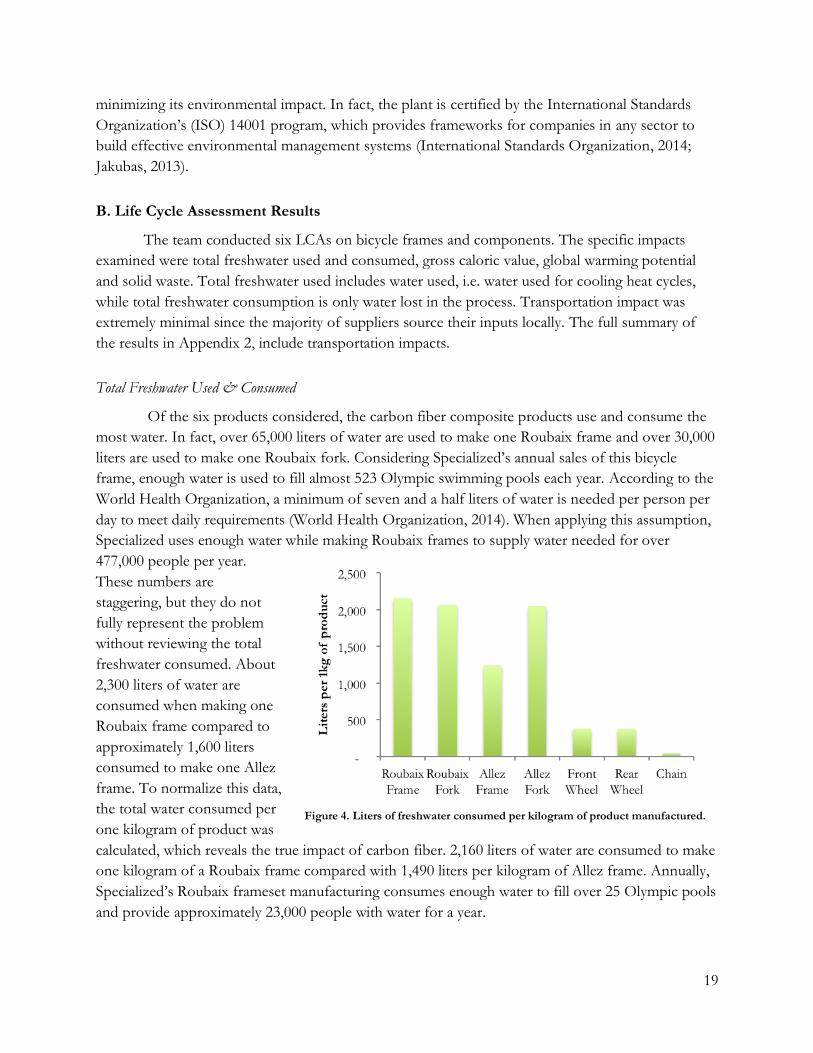
B. Life Cycle Assessment Results
The team conducted six LCAs on bicycle frames and components. The specific impacts
examined were total freshwater used and consumed, gross caloric value, global warming potential
and solid waste. Total freshwater used includes water used, i.e. water used for cooling heat cycles,
while total freshwater consumption is only water lost in the process. Transportation impact was
extremely minimal since the majority of suppliers source their inputs locally. The full summary of
the results in Appendix 2, include transportation impacts.
Total Freshwater Used & Consumed
Of the six products considered, the carbon fiber composite products use and consume the
most water. In fact, over 65,000 liters of water are used to make one Roubaix frame and over 30,000
liters are used to make one Roubaix fork. Considering Specialized’s annual sales of this bicycle
frame, enough water is used to fill almost 523 Olympic swimming pools each year. According to the
World Health Organization, a minimum of seven and a half liters of water is needed per person per
day to meet daily requirements (World Health Organization, 2014). When applying this assumption,
Specialized uses enough water while making Roubaix frames to supply water needed for over
477,000 people per year.
These numbers are
staggering, but they do not
fully represent the problem
without reviewing the total
freshwater consumed. About
2,300 liters of water are
consumed when making one
Roubaix frame compared to
approximately 1,600 liters
consumed to make one Allez
frame. To normalize this data,
the total water consumed per
one kilogram of product was
calculated, which reveals the true impact of carbon fiber. 2,160 liters of water are consumed to make
one kilogram of a Roubaix frame compared with 1,490 liters per kilogram of Allez frame. Annually,
Specialized’s Roubaix frameset manufacturing consumes enough water to fill over 25 Olympic pools
and provide approximately 23,000 people with water for a year.
Figure 4. Liters of freshwater consumed per kilogram of product manufactured.

20
The carbon Allez fork was found to use more water than the carbon Roubaix fork since it is
a lower end product and therefore uses more carbon fiber composite. The normalized freshwater
consumption for each product is compared in Figure 4. Interpreting this high water use is regionally dependent. Specialized’s second tier pre-
impregnated carbon fiber composite suppliers are based in Japan and Taiwan and these two regions’
water risks were reviewed using the World Resources Institute Aqueduct program (World Resources
Institute, 2014). The Aqueduct water risk maps for chemical manufacturers in Japan and Taiwan are
shown in Figure 5 and 6 (Bloomberg, 2014). Fortunately, both countries are in low and low to
medium risk zones, however this should not deter companies from reducing their water
consumption. Identifying the source of water consumption in the carbon fiber manufacturing process was
beyond the scope of this
research. However, it
does not occur directly
within bicycle
manufacturing and
instead appears further
upstream during raw fiber
production.
Embedded Energy
The embedded
energy of each product
was calculated by
determining the gross
caloric value in kilowatt-
hours. Gross caloric value
Figure 5. World Resources Institute Aqueduct program map
indicating water risk in Japan (World Resources Institute,
2014)
Figure 6. World Resources Institute Aqueduct
program map indicating water risk in Taiwan
(World Resources Institute, 2014).
Figure 7. Embedded energy in gross caloric value (kWh) per one kilogram
of product manufactured.

21
is defined as the amount of energy embodied in a material when combusted including any energy
associated with water vapor that is fully condensed (Special Chem, 2014). The gross caloric value
was calculated for the entire cradle to gate life cycle; all the energy required is included in this impact. Of the six products considered, manufacturing the Allez frame was the most energy
intensive, using almost 2,380 kilowatt-hours. Over 58.7 gigawatt-hours are used per year to produce
all the Allez framesets sold in a year, which is enough power to supply New York City for
approximately 128 hours. The Allez frame’s most energy intensive process is artificially aging the aluminum frame to
achieve specific metallurgy properties (DiNucci, 2013). This requires the frame to be heat treated at
400°F for ten hours. The impacts of each product were compared by reviewing the gross caloric value per one
kilogram of product produced (Figure 7).
Global Warming Potential
The GWP was
calculated for the six
products considered using
the CML2001-April 2013
methodology for GWP
over 100 years. The GWP
correlates closely to the
embedded energy
calculations and therefore
the Allez frame has the
highest GWP of the six
products considered. One
Allez frame produces
over 250 kilograms of
carbon dioxide
equivalents. Considering
the number of Allez
framesets sold per year, over 6.4 million kilograms of carbon dioxide equivalent are produced every
year. This annual impact is equivalent to driving a 2013 Ford Explorer6 over 15 million miles
(TerraPass, 2014). Again, this is likely due to the energy intensive process of artificially aging the aluminum
frame. The impacts were compared by reviewing the GWP per one kilogram of product produced
(Figure 8).
6 A 2013 Ford Explorer FWD (A6) gets 20 miles per gallon in the city and 28 miles per gallon on the highway. It produces approximately 0.84 pounds of carbon dioxide equivalents per mile driven (TerraPass, 2014).
Figure 8. Global warming potential in kilograms of carbon dioxide equivalents per
one kilogram of product produced.

22
Solid Waste
The amount of solid waste for each product was calculated. These calculations are based
purely on the primary data received from suppliers and do not include waste associated with
processes calculated by ecoinvent or other databases. These numbers only represent solid waste and
do not include water, exhaust, or paint waste. The Roubaix frame produces the most waste, 1.01 kilograms of solid waste for one frame,
however, the bicycle chain produced the most waste per one kilogram of product produced: 3.69
kilograms of waste are produced for each kilogram of chain produced (Figure 10). It should be
noted that the manufacturer reviewed in this study recycles their excess steel while the waste
produced by manufacturing a Roubaix frame includes items such as sandpaper, latex bladders, and
carbon fiber waste, which are not easily recycled. This extremely high amount of waste produced during chain manufacturing is a result of
stamping steel for the inner and outer plates. Assuming that a chain is sold with each Roubaix and
Allez frame, almost 40 metric tons of steel would be wasted every year. This is the equivalent in
weight to 48.5 Smart cars.7 Additionally, approximately 25 Smart cars of waste are produced for
manufacturing Roubaix frames every year (Smart USA, 2014). The Allez frame produces the least amount of waste noting the efficiency of aluminum tube
manufacturing and welding compared to carbon fiber composite manufacturing. To review the LCA results in more depth, please refer to Appendix 2.
Paint
Okala’s design principles noted the impacts associated with paint and therefore Trek powder
coated its Eco Design bikes. However, in this study the painting impacts were minimal compared to
other manufacturing processes. It should be noted that the human toxicity and eutrophication
7 One Smart Pure Coupe weighs 820 kilograms (Smart USA, 2014).
Figure 9. Solid waste in kilograms per one kilogram of product produced.
23
potential were not reviewed in this study and the complete impacts of painting therefore may not be
measured. Alternatively, the Okala principles weight impacts using the National Institute of
Standards and Technology’s (NIST) weighting values (White, 2007). The research team did not
weight its impact results, so this could also explain these LCAs’ lack of impact from painting.
Limitations of the Study
As is with any LCA, there were limitations to this study. Primarily, many assumptions,
proxies, and extrapolations were made throughout the course of the study. These are included in
detail in Appendix 3. Since the data collection was done via email, the team could not monitor the data collection
process. Therefore, there may be variations in data collection techniques used and estimations that
were not noted as such. Additionally, incorrect translations may have inadvertently affected the
results of the study since several of the individuals collecting data do not speak English as their
primary language.
Understanding the Impacts
The LCA results can be put into perspective by comparing the impacts of these products to
other consumer products. Since the Allez and Roubaix are racing bicycles and are not primarily used
for commuting, their impacts were not compared to that of a car or other transportation mode.
While a pair of jeans is not a product that can replace a bicycle, they are both consumer products
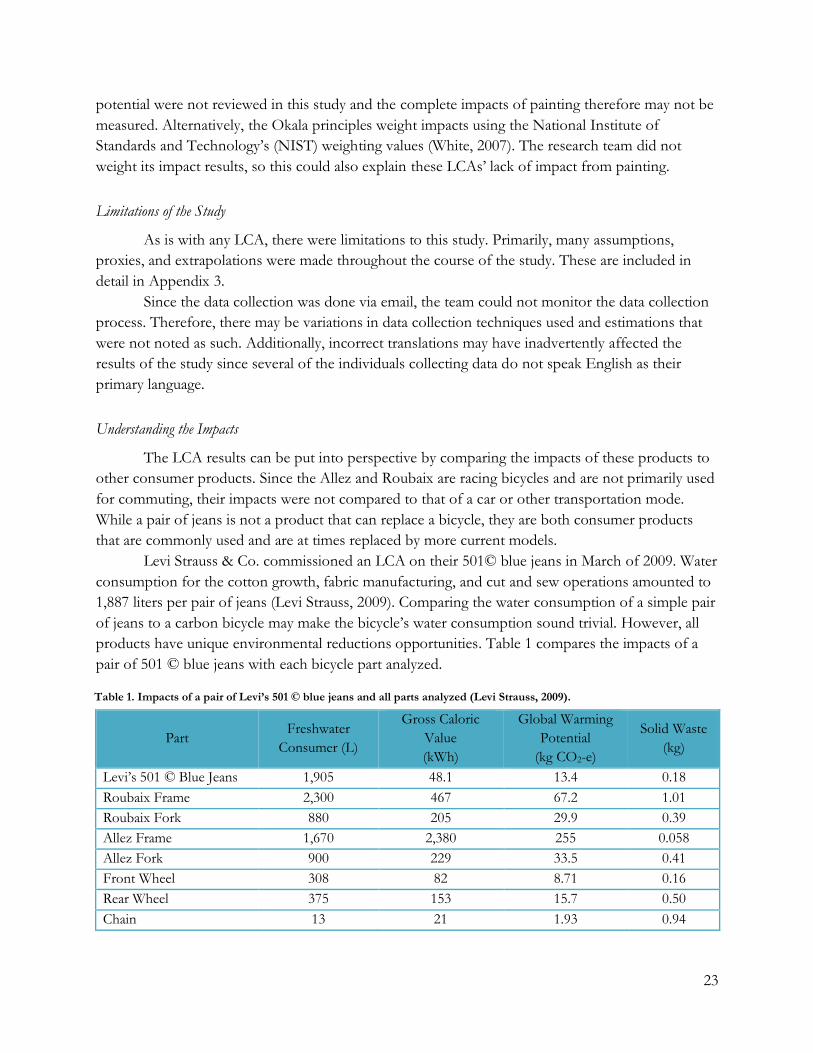
that are commonly used and are at times replaced by more current models. Levi Strauss & Co. commissioned an LCA on their 501© blue jeans in March of 2009. Water
consumption for the cotton growth, fabric manufacturing, and cut and sew operations amounted to
1,887 liters per pair of jeans (Levi Strauss, 2009). Comparing the water consumption of a simple pair
of jeans to a carbon bicycle may make the bicycle’s water consumption sound trivial. However, all
products have unique environmental reductions opportunities. Table 1 compares the impacts of a
pair of 501 © blue jeans with each bicycle part analyzed.
Part Freshwater
Consumer (L)
Gross Caloric
Value (kWh)
Global Warming
Potential (kg CO2-e)
Solid Waste
(kg)
Levi’s 501 © Blue Jeans 1,905 48.1 13.4 0.18 Roubaix Frame 2,300 467 67.2 1.01 Roubaix Fork 880 205 29.9 0.39 Allez Frame 1,670 2,380 255 0.058 Allez Fork 900 229 33.5 0.41 Front Wheel 308 82 8.71 0.16 Rear Wheel 375 153 15.7 0.50 Chain 13 21 1.93 0.94
Table 1. Impacts of a pair of Levi’s 501 © blue jeans and all parts analyzed (Levi Strauss, 2009).

24
Interestingly, these findings are notably different from the Accell Group’s LCA performed in
2012. Specifically, the carbon fiber bicycle was found to be the least impactful in their study, while
this research highlights its significant water consumption (Accell Group, 2012). Unlike the Accell
Group, the team chose to use the PE International’s life cycle inventory data for producing carbon
fibers since the ecoinvent database did not have robust carbon fiber manufacturing data.
Alternatively, the Accell Group’s results are normalized to ecopoints and therefore do not indicate
the specific amount of water consumed.
C. OIA Equipment Index
As described previously, the OIA Equipment Index is a tool for companies to assess how
sustainable they are, from specific materials used to the brand’s overarching policies. In this way, the
Equipment Index differs from an LCA through its broader, more qualitative approach that attempts
to measure progress towards sustainability. The complete Equipment Index, with indicators for each
section and corresponding scores, can be found in Appendix 4.
Specialized Brand Module
Given the information above and additional information collected from the client and
experts at Specialized, the Brand Module of the Equipment Index was completed for Specialized.
The module consists of seven sections: General, Materials, Packaging, Manufacturing,
Transportation, Product Care & Repair Service, and End of Life. Each section is equally weighted
(14.3%), although the module allows users to change the weights if desired. Specialized Bikes
received a score of 43.3 out of 100 possible points, and the breakdown for each section is shown in
Table 2. Taking a closer look at specific indicators
provides insight into the usefulness of this tool as
well as opportunities for improvement within
Specialized Bikes. First, the Index’s General section
examines the work done and the brand’s internal
goals, such as whether or not there is an updated
list of suppliers and if direct assistance is
provided to suppliers to reduce impacts from
materials, manufacturing, and packaging.
Specialized has established some policies to
promote sustainability internally. It has a
philosophy that encourages the creation and communication of policies to promote sustainability
within the supply chain through ensuring compliance with labor and sustainability policies,
establishing metrics to measure progress and identify areas for improvement, eliminating the worst
materials and prioritizing the best, and collaborating with partners (Bainbridge, 2014d). Specialized
has also created an audit and scorecard system that assists suppliers in identifying opportunities for
improvements in waste, water, air management, environmental compliance, and worker health and
safety. This audit tool and other policies have been shared with the World Federation of the
Table 2. Brand Index Scores
Section Actual
Points Possible
Points Score
General 22 100 3.2 Materials 58 100 8.3 Packaging 58.2 105 8.3 Manufacturing 12 110 1.7 Transportation 0 100 0 Product Care &
Repair Service 75 100 10.7
End of Life 63 100 9
Total Score 43.3

25
Sporting Goods Industry (WFSGI) Bicycle Labor Pilot Group, of which Specialized is a leading
member (Bainbridge, 2014d). However, the wording of the OIA Equipment Index indicators does
not capture much of this significant work done by Specialized, which received only 22 out of 100
points in this section. The Index’s Materials section focuses on the brand’s Restricted Substance List (RSL), its
stringency, and its verification process. Specialized has a very comprehensive RSL and a documented
verification process, resulting in a high score for these indicators. Additionally, it has inventoried all
product materials and has banned polyvinyl chloride (PVC) from its products. Specialized is
continuing to work towards sustainability by optimizing material use and type, with a goal of
increasing yields, or decreasing waste, in footwear and apparel by an increasing percentage each year
(Bainbridge, 2014d). The section also examines the brand’s chemical impact reduction. Specialized’s
work to understand the materials it uses and eliminate the most impactful materials begins to
address its chemical impacts, but due to the specificity of the indicators, Specialized received no
points for chemical impact reduction resulting in a score of 58 out of 100 points in the materials
section. The company also scored moderately well in the Index’s Packaging section. As part of its
sustainability program, Specialized landscaped its packaging materials by product and implemented a
Packaging RSL, which includes a ban on PVC (Bainbridge, 2014d). Specialized also developed
Packaging Design Guidelines to reduce material use and waste and prioritize sustainable packaging,
which includes the use of printing methods that lower wastes, water-based inks and easily recyclable
materials. Specialized is completing a systematic redesign of all its packaging and thus far has
improved packaging for its saddles, footwear, and helmets. The redesign project will include a
redesign of its bicycle-specific packaging, such as bike boxes (Bainbridge, 2014d). The Index’s
module on packaging requires users to enter materials and packaging options for products to
develop a packaging scenario. Because this report is focused on sustainability specific to bicycles a
relatively low score was achieved for this indicator. The Index section on manufacturing focuses on environmental practices that occur within
the supply chain, such as whether the brand either measures or requires suppliers to gauge
manufacturing efficiency, water usage, or solvent usage. While Specialized has implemented
programs (i.e. the audit tool) to measure and improve its environmental impacts and provide
assistance to suppliers, it has not set any mandatory reporting requirements. It has also not
implemented any bike-specific policies to reduce manufacturing impacts. The Index’s Transportation section is focused on reducing emissions from transporting
products through optimizing modal type, distances traveled, and the weights and volumes of
shipping containers and packages. While reducing packaging weight does reduce transportation
impacts, Specialized has not done any work specific to this indicator and therefore received zero
points for this section. Lastly, Specialized scored well in the Product Care & Repair Service and the End of Life
sections. This is due to the fact that most of the indicators in these sections are standard practices in
the bike industry such as durability testing and product care information availability. Additionally,
the company recycles all of its returns and defectives, and is one of a few brands with a carbon fiber

26
recycling program. Specialized recycles its wasted carbon fiber in the U.S. as well as waste from
other brands such as Santa Cruz and Ibis. The Equipment Index has proven to be a useful tool to assess a brand’s sustainability.
However, the Index does not thoroughly reflect all the work Specialized has accomplished. Through
consultation with the client and others at Specialized, the team was able to easily complete the
module. As a brand, Specialized has made some progress in becoming a more environmentally-
friendly company, and has invested significantly in the creation of tools, such as the Equipment
Index, that will allow bicycle companies to evaluate and improve their environmental footprints.
However, as both the Index assessment and the LCA results show, there are many opportunities for
improvement. Specific recommendations based on the Index results can be found in the Final
Recommendations section of this report.
Roubaix and Allez Product Modules
The Product Module consists of six sections: Materials, Packaging, Manufacturing,
Transportation, Product Care & Repair Service, and End of Life. With the exception of the
Materials section, the scores for the Roubaix and Allez bicycle framesets are identical. Like many
bicycle companies, Specialized has internal divisions for apparel, footwear, bicycles, and others,
which each have their own specific programs and policies that apply to that particular type of
product. Both carbon fiber and aluminum bicycles fall into the same general category for bicycles;
therefore any indicator measurement for
a carbon fiber frameset will be the same
for an aluminum frameset, which
explains the repetition in the index
scoring for these products. The only disparity in the scores is
in the Materials section, which scores the
product based on what materials it is
composed of. Within the online module,
users build a Bill of Materials (BOM),
which the Index defines as a list of the
raw materials that make up a product.8
Each material is associated with a Nike MSI score based on several factors, such as the water use,
energy consumption, and other environmental impacts related to its production (Nike
Responsibility). Carbon fiber’s MSI score is 14.89, while aluminum scores 21.53. The Nike MSI
database does not include any types of putty, paint, or clear coat, so epoxy resin (with a score of
21.54) was used as a proxy for these materials. The module weights the MSI scores according to
their percentage of the total product weight. The Roubaix received a score of 33.6 points and the
8 For the purposes of this analysis, only the fork, frame, and putty, paint and clear coat were used to calculate the
materials score. These materials account for over 92% of the total frameset weight. Other small parts were not included because each part does not contribute a large enough percentage to the total frameset weight for the module to register a score change.
Table 3. Product Scores
Section Roubaix
Points Allez Points
Possible
Points Materials 33.6 38.1 100 Packaging 100 100 100 Manufacturing 10 10 100 Transportation 100 100 100 Product Care &
Repair Service 100 100 100
End of Life 70 70 100
Final Score 69.0 69.7

27
Allez scored slightly higher with 38.1. The difference is due to the larger amount of carbon used in
the Roubaix frameset, which has a higher environmental impact than aluminum.
Overall, the Roubaix frameset scored 69 out of 100 points, and the Allez frameset scored
69.7 out of 100 points. This module was relatively simpler to complete than the brand module, as
there are fewer indicators in each section and many are less ambiguous than the brand module
indicators. For example, both the transportation and packaging sections consist of a single indicator.
However, it should be noted that comprehensive packaging impacts are captured in a separate
packaging specific module that was not evaluated in this study. Additionally, like the brand module,
many of the measurements for the Product Care & Repair Service and End-of-Life sections are
standard practice in the bicycling industry, resulting in high scores in these sections.
Issues and Recommendations
The simplicity of the Equipment Index makes it accessible, easy to complete, and easy to
track the progress of a brand or product over time. Reviewing the LCA results alongside the Index’s
reveal the differences in how each tool measures environmental impacts. For example, the final
Index scores for the Roubaix (69.0) and the Allez (69.7) are not extremely different, but the LCAs
highlight the Roubaix’s high water consumption and the Allez’s high energy. The Index attempts to
look at all the impacts including a brand’s policies and decisions, the impacts in the manufacturing
facility, impacts associated with the product, packaging, transportation, as well as impacts associated
with social responsibility. The Index then normalizes all of these impacts into one final score. LCAs,
on the other hand, specify and quantify various impacts, including water consumption, energy use,
and others. Because the Index covers a broader scope than the LCA but does not robustly quantify
specific impacts like an LCA the final Index score diminishes the aspects that apply purely to the
product. In order to facilitate comparison between these methods, the LCAs could be normalized to
one unit, such as ecopoints. As discussed, however, these tools measure environmental impacts very
differently, and normalizing would require weighting each environmental impact, thereby distracting
from the actual manufacturing impacts.
The team discovered other issues within the Index, many of which have since been
addressed by Specialized and the OIA. For example, both products received the same score in the
manufacturing section despite clear differences in their manufacturing processes. While both
products scored in the lower third of the scale, there is no differentiation on how products are
processed and the waste associated with production. The findings of this research informed the OIA
and an additional indicator has been added that asks users to calculate the materials efficiency by
providing a real measurement of waste produced during the manufacturing of each product. These
findings have also led to additions in both the brand and product modules to include impacts from
heat treating which will capture elements of finished products beyond their material make up
(Bainbridge, 2014d). These new additions will result in more separation in the product scores based
on their true impacts. An additional concern is the interpretation of each indicator, which is ambiguous in the
current version of the index. The Equipment Index is unique in that the brands it is meant to assess
usually have a wide range of products, each with their own programs and policies; some may be

28
much more environmentally-friendly or advanced than others. For example, Specialized has done a
great deal of work on bicycle saddle, footwear, and helmet packaging, but has not yet begun work on
bicycle packaging. Thus, the packaging indicators could score higher than the average product
deserves. In order to remediate this issue, the directions for the tool could instruct companies to
assess their brand and products on a product category level, resulting in different scores for each
type of product. A final concern is that the Index rewards points for very advanced policies and programs
that many small and new companies may not have the resources or experience to implement. While
some indicators do include options for different levels of achievement, many of the higher scoring
ones do not. This could discourage certain companies from completing the assessment. In order to
ensure that the Index is as widely accessible and applicable as possible, some of the indicators should
have additional options that reward companies for incremental improvements.
D. Media Perceptions of the Bicycle Industry
The team analyzed perceptions of the bicycle industry and bicycles in four major periodicals:
The Washington Post, The Economist, and The New York Times. The overall perception of bicycles was
deemed to be positive, as they are highlighted as an alternative form of transportation to
automobiles, a method of exercise, and as a fashion statement. The full text of articles pertaining to
the industry are included in Appendix 5.
The Washington Post
Between January 2005 and March of 2014 The Washington Post published 678 articles that
contain the words “bicycle,” “bicycle industry” or “bicycle manufacturing.” Several of these articles
are criminal reports of stolen bicycles in the Washington D.C. metro area or articles where bicycles
or the industry are not the primary focus (430). Thirty-one articles discuss issues pertaining to
cycling such as exercising and commuting, issuing of helmet laws, adding bike lanes, and cycling
focused environmental activism (Table 4). The D.C. bike share program9 is highlighted in several of
the articles in The Washington Post, especially logistical issues with the bike share (Chavez, 2013).
Helmets and bicycles were also a popular topic in The Washington Post, especially after a Maryland
state law requiring helmets to be worn for all cyclists under 16 was passed (Halsey, 2013a). The rise
of bicycle commuting among adults and children in D.C. was also a topic written about favorably
and often within The Washington Post (Halsey, 2013b). Out of the 678 articles published, only 11 articles directly discuss the bicycle industry (Table
5). The foci of these articles include the movement of bicycle manufacturing abroad, the bankruptcy
of the Alta Bicycle Share company10 and trends in bicycle consumption in the D.C. metropolitan
9 Bicycle share programs offer publicly available bicycles to local residents and tourists for a small fee on an hourly or daily basis. Special bicycles, bicycle racks and credit card stations help prevent thefts (Bicycling, 2014). 10 Alta Bicycle Share is a company that designs, executes, and manages bicycles shares. Alta was the bicycle share company used in D.C., New York City, Chicago, Boston, and other major cities (Alta, 2014).

29
area (Lazo, 2014). During the 2012 Presidential election, Mitt Romney’s involvement in Bain
Capital11 was highlighted by the Obama campaign and several articles discussed Bain’s responsibility
Table 4: Bicycle Related Articles in The Washington Post
Topic Positive
Slant
Negative
Slant Ambiguous Summary
Biking for
Exercise 3 0 0
Biking as a means to prevent and treat obesity; cycling
as a form of exercise
Helmet Laws 2 3 1
Questioning if bicycle helmet laws save lives (Halsey,
2013a); Maryland law requiring bicycle helmets for
children under 16
Bike Lanes 4 0 1 D.C. plans to include more bike lanes (Sullivan, 2014)
Bike
Commuting 5 1 0
Bicycle commuters passion (Halsey, 2014); students
commuting to school via bicycle (McLaughlin, 2013);
commuting from the suburbs to D.C. (Bernstein,
2012)
Environmental
Activism 3 0 0
The Climate Ride in D.C.
Bike Share 8 2 0
Logistical issues with the D.C. bike share (Chavez,
2013); DC bike share versus NYC bike share (Badger,
2014); Bike share and helmets (Berman, 2012)
TOTAL 25 6 2
Table 5: Bicycle Industry Articles in The Washington Post
Topic Positive
Slant
Negative
Slant Ambiguous Summary
Moving
manufacturing
from the U.S.
abroad
1 5 0
The general trend of the bicycle industry moving
manufacturing abroad; the Obama campaign
highlighting Bain capital and Mitt Romney’s
outsourcing of U.S. jobs (Hamburger, 2012)
Changes in
the Perception
of Bicycles
2 0 0
The bicycle as a toy or piece of sports equipment;
bicycle as a trendy mode of transportation; popularity
of fixed-geared bicycles among bike messengers in
D.C. and urbanites
Bankruptcy of
Alta 0 1 0
Alta filing for bankruptcy (Lazo, 2014)
Manufacturing
bikes in
America
2 0 0
Wal-Mart encouraging Kent Bicycles to move some
of their manufacturing back to the U.S. (Depillis,
2014)
TOTAL 5 6 0
11 Bain Capital is a large private, alternative asset management firm (Bain Capital, 2014).

30
in outsourcing U.S. jobs, including U.S. bicycling manufacturing jobs through Bain’s facilitation of
the 1998 sale of GT Bicycle Inc. to Schwinn (Hamburger, 2012). Two articles in The Washington Post
describe the very recent move of bicycle manufacturing companies, such as Kent bicycles, back to
the U.S. (Depillis, 2014).
The major bicycle topics in The Washington Post are bike sharing and lanes, helmet laws, and
bicycle commuting. Most of the articles in The Washington Post relating to the bicycle industry are
focused on its move of manufacturing to China and Taiwan and the subsequent impact this has had
on the U.S. economy. The general tone of articles pertaining to the industry in The Washington Post is
slightly negative as 54% of these articles were negatively slanted and 46% positively slanted.
The Economist
The Economist published 155 articles pertaining to bicycles in the past eight years, the majority
of which focus on bike share programs, electric bicycles (e-bikes), and bicycle transportation (Table
6). The general perceptions of bicycles in these articles are positive suggesting the bicycle is
undergoing a renaissance, especially in European cities as bike shares grow in popularity and
commuting continues to be popular.
The most popular theme in The Economist pertains to bicycles as a form of transportation (ten
articles), especially in urban areas. Several articles highlight how cycling has increased in popularity as
a result of new cyclist-friendly safety regulations (M.S., 2013). These articles also describe city
programs designed to encourage more cycling. One example highlights a traffic lane in Brazil that is
closed on Sundays to accommodate bicycle travel (H.J., 2010). Nine articles describe bike share
programs in both Europe and the United States. The general consensus of these articles supports
the idea that bike shares and biking in general foster healthier populations and vastly improve quality
of life for participating citizens (S.N., 2013). A few of these articles also describe problems with
biking in London, i.e. safety concerns and the unfavorable road conditions (“The Wheel Problem”,
2013).
Table 6: Bicycle Related Articles in The Economist
Topic Positive
Slant
Negative
Slant Ambiguous Summary
Bicycles as an
alternative
means of
transportation
4 2 4
Altercations between motorists and cyclists; cyclists
in cities is an indication of being civilized (S.N.,
2013); why are some cities better for cycling than
others?; programs encouraging cycling (H.J., 2010)
Electric
bicycles 6 3 1
Demand for e-bikes is growing; Growing need for
e-bike regulations in China
Bike Share 7 2 0
London as an unpleasant city for cycling; healthier
populations with improved quality of life (S.N.,
2013)
TOTAL 17 7 5

31
Electric bicycles are also a popular topic in The Economist. These articles suggest that the
demand for e-bikes is increasing and the industry is increasing production. Furthermore, several
articles discuss the need for regulations on e-bikes particularly in China where unregulated e-bikes
have been attributed to an increase in casualties and accidents.
The Economist published only six articles since 2006 on the bicycle industry or bicycle
manufacturing (Table 7). Many of these articles have been positively slanted describing a change in
manufacturing or industry, such as the production of a cardboard bicycle or the movement of
manufacturing to Africa or China. Only one article has a negative slant describing the shift of
manufacturing abroad and the impact this has had on local economies that used to produce bicycles
(Ababa, 2014).
There have been two articles in The Economist, which describe the African bicycle industry in
depth. One article describes the potential for major bicycle manufacturers to move products and/or
production to Africa (Ababa, 2014). A second article describes the movement of cycling in Africa
from traditional bike aid, such as shipping used bicycles from the U.S. to Africa, to recent initiatives
to build and sell bamboo bikes in Africa (“On your bike,” 2008). These articles suggest that
manufacturing in Asia could move to Africa as the costs of doing business there declines. As African
demand for bicycles grows, bringing bicycle manufacturing there will help meet this need for both
production and means of transportation.
One article describes the rising costs of doing business in China, specifically increasing
transportation costs (“High Seas, high prices; Business in China,” 2008). The article interviews a
Strategic Sports co-founder who says he will most likely keep production in China instead of moving
it to Europe or North America because of the differences in labor costs (“High Seas, high prices;
Business in China,” 2008). Another article highlights how some manufacturers in England have
stayed in business featuring an owner of a bicycle-parts company who attributes the mechanized
production of bicycles as one of the key reasons he is able to keep production in England.
An article in The Economist describes the development of Giant Manufacturing, highlighting
the strategic decision to employ Taiwanese labor to produce bicycles (“On your bike,” 2008). This
article further describes how bicycles solve some of the major modern society problems: rising fuel
prices, pollution, and obesity, and thus concludes that it is not surprising that sales have increased
since 2007 (“On your bike,” 2008).
Table 7: Bicycle Industry Articles in The Economist
Topic Positive
Slant
Negative
Slant Ambiguous Summary
Manufacturing 5 1 0
Manufacturing bicycles in Africa;
increased demand for bicycles; Hope
Technology refuses to move
manufacturing abroad (“On Your Bike:
Transportation In Africa,” 2008)
The perceptions of bicycles and the bicycle industry in The Economist are overwhelmingly
positive (63%) focusing on the consumer use phase of the life cycle: bike sharing, electric bicycles,

32
and bicycles as an alternative means of transportation. With regard to the rest of the life cycle, The
Economist describes how the industry could move production to Africa in order to meet increased
demand in this region and to utilize the competitive advantage in terms of labor (Ababa, 2014). A
few articles describe how the movement of general manufacturing and bicycle manufacturing to Asia
has impacted local economies in Europe and the United States.
The New York Times
The New York Times published 1,400 articles including the key words “bicycle industry”
between 2004 to March 2014. The majority of these articles focused on bicycle safety, bike lanes,
electric bicycles, and bike sharing, as highlighted in Table 8. Articles describing bicycle commuting
and bicycles as an alternative means of transportation were written about positively. Several of these
bicycle commuting focused articles describe how office buildings are complying with bicycle access
laws in New York City.12 Several articles were published highlighting how dangerous urban cycling
is, citing an increase in alcohol and bike related deaths (Lee, 2009), and a law requiring commercial
bicycle delivery riders to wear a helmet (Rivera, 2007).
Table 8: Bicycle Related Articles in The New York Times
Topic Positive
Slant
Negative
Slant Ambiguous Summary
Electric Bicycles 3 3 3
Growth in the e-bike industry; e-bikes for
deliveries in NYC (Kilgannon & Singer, 2011);
India’s power grid being unable to sustain e-bikes
and e-vehicles
Bicycle Culture 3 0 0 Cycling fashion (Harmanci, 2011)
Bicycle Safety 1 11 5
Safety of bicyclists on the road; social and legal
climate surrounding cyclists safety; urban cycling;
alcohol and bike deaths; laws requiring bicycle
riding delivery people to wear helmets (Rivera,
2007)
Bicycle Thievery 0 1 2 Stolen bicycles and bike racks
Bicycle
commuting/
bicycles as
alternative
transportation
7 1 1
The aftermath of bicycle access laws in NYC;
bicycle parking in NYC office buildings (Stellin,
2007); schools encouraging students to commute
by bike
Bike Lanes 4 4 2 Majority of NYers polled support increased
bicycle lanes (Grynbaum & Connelly, 2012)
Bike Sharing 3 1 2 Describing NYC’s Citi Bike share program;
problems with the bike share
TOTAL 21 21 15
12 Bicycle access laws are regulations that require nearby parking for bicycle commuters

33
The New York Times robustly captures both sides of the argument on increasing bike lanes in
NYC, as represented by the equal number of articles positively and negatively describing bike lanes.
Several articles describe the increased demand for electric bicycles and the challenges associated with
increased use of e-bikes and e-vehicles in developing countries.
The majority of articles pertaining to the bicycle industry in The New York Times in the past
decade are focused on the manufacture of high-end bicycles both by high-end fashion designers
such as Fendi and by the bicycle manufacturers (“You Paid How Much for That Bike?,” 2009) . The
New York Times also described the movement of bicycle manufacture abroad from the United States
to take advantage of cheaper labor, but also the recent trend of some manufacturers to bring some
parts of the production process back to the United States.
Table 9: Bicycle Industry Related Articles in The New York Times
Topic Positive
Slant
Negative
Slant Ambiguous Summary
Bike Sales 0 1 0 The global recession is impacting the sales
of bicycles (Grossman, 2010)
Custom Made,
High End, and
Niche Bicycles
4 0 1
High-end fashion designers selling bicycles
(Fendi, Cynthia Rowley, etc.) (Rawsthorn,
2010; Williams, 2009)
Improvements in
Manufacturing 1 0 0
Improvements in wheel technology
(Bilton, 2013)
Purchasing a
“beater bike” to
deter theft
1 0 0
Recycle-a-Bicycle and other programs
aimed at providing low-cost bicycles to
urban dwellers to prevent bicycle theft
Moving
Manufacturing
Abroad
0 0 2
Super-Sized Cycles; Wal-Mart supporting
bicycle production in the U.S. (Huetteman
& Harris, 2014)
TOTAL 6 1 3
Many of the articles found in this popular press analysis focus on the positive portrayal of
bicycles in the use phase and ignore any analysis of the environmental impacts in manufacturing
(with the notable exception of labor). As discussed in this research, privacy concerns within the
bicycle industry limit publicity of initiatives throughout its supply chain. Furthermore, environmental
organizations such as Greenpeace have focused on the bicycles an alternative to fossil-fuel powered
vehicles instead of investigating their manufacturing impacts (Greenpeace, 2014b).
E. Consumer Survey
The survey was administered in January 2014. It was emailed to over 1,500 faculty and staff,
as well as 50 student listservs. In total, 434 respondents started the survey and 377 completed it. The
findings are summarized in the following categories: (i) respondent demographics, (ii) bike
ownership and behavior, (iii) shopping behavior, and (iv) willingness-to-pay for “sustainable” bikes.

34
The full survey instrument, additional descriptive statistics, and STATA output can be found in
Appendices 6, 7, and 8.
Demographics
The survey was emailed to faculty,
staff, and students at Duke University,
using email addresses from department
websites and student listserv distributions.
Approximately 24 percent of respondents
were students, 28 percent were staff, 40
percent were faculty, and seven percent
identified themselves as “other” or were
“not affiliated with Duke” (Figure 10). Of
the total Duke Campus population, 56
percent are students, 32 percent are staff,
and 12 percent are faculty (Figure 11) (Duke University, 2012). There are also a large number of
medical employees, who are not included in this breakdown because the survey only focused on the
Duke Academic Campus community. Forty-eight percent of respondents were female, 51
percent were male, and one percent preferred not to
identify their gender. While the age distribution of
respondents was fairly evenly distributed (Figure 12), the
education background and annual household income were
strongly skewed. Over three-quarters of respondents have
completed a post-graduate degree, and 41 percent have an
annual household income of over $100,000. These results
were expected based on the survey population. Most
typical university faculty positions require post-graduate
degrees, and typical staff positions, such as research
Figure 11. Duke University population Figure 10. Survey respondents’ affiliation with Duke
University
Figure 12. Age distribution of respondents
Figure 13. Type of bike owned

35
assistants, IT support, program
coordinators, and others, generally
require advanced degrees as well. These
types of employment also typically have
above average salaries, which helps to
explain the atypical findings in this
research.
Bike Ownership Characteristics and Behavior
The survey was targeted at bike
owners, so the first question asked
respondents if they own or have ever owned a bike. Approximately 91 percent of respondents own
or have owned a bicycle. Figure 13 shows the types of bikes that respondents own. Seventy-eight
percent of these bikes were purchased new, and 22 percent were used. Respondents were then asked
to select a price range for their bike, ranging from
less than $100 to over $5,000. The majority of bikes
cost between $100 and $300, as shown in Figure 14.
Respondents were also asked about their reasons
for owning and riding a bike. Most respondents ride
for fun, though a large share also use bikes to
commute and as a fitness or weight loss tool (Figure
15). These responses support the findings from the
Walden Hyde survey, which found that about half
of their respondents owned road bikes and ride for
various reasons, most often citing health and fun. Of the 377 total responses, ten percent have
never owned or purchased a bicycle. Qualtrics skip-
logic was employed to ask this subset why they have
never owned a bike and what factors might make them more likely to purchase a bicycle. Thirty-
eight percent of non-bike owners cited using other forms of transportation as the primary reason
they do not own a bike, twenty-one percent said they live in an area that is unsafe or inconvenient
for biking, and twenty-one percent also said they exercise in other ways and therefore do not need a
bike. When asked what would make them more likely to buy a bike, fifty percent said living in more
bike-friendly area was a key factor. None of the respondents said that a sustainable bicycle
manufacturing process would make them more interested in buying a bike.
Sustainable Shopping Behavior
A section of the survey asked respondents about their typical shopping behavior. These
questions were designed to be included in a sustainability score, which will be discussed in more
detail below. Thirty-five percent of respondents said they shop for “green” products either most of
Figure 15. Reasons for riding bicycles
Figure 14. Amount paid for bicycles by respondents

36
the time or all of the time (Figure 16). Nearly 60 percent reported that they would consider buying
less from companies who manufactured their products unsustainably, and 50 percent would
consider buying more from companies engaged in sustainable manufacturing processes. These
results provide evidence that consumers are interested in sustainability, regardless of whether prices
are comparable.
Willingness-to-pay for Sustainable Bikes
The central question of the survey was to determine if there is consumer demand for
sustainably manufactured bicycles. It asked respondents their willingness-to-pay (WTP):
Suppose you were going to buy a new bicycle. Your favorite bicycle company sells a bike for $400. If that company
began selling the same bike made in a sustainable way, how much would you be willing to pay for the sustainable
bicycle? a) I would pay less than $400 b) I would pay $400 c) I would way $420 (5% more) d) I would pay $440 (10% more) e) I would pay $480 (20% more) f) I would pay $600 (50% more)
As described above, Qualtrics display logic was used to tailor the WTP question based on
how
much
each
respondent paid for his or her bike. The question listed above was displayed for respondents who
selected the $300 to $500 range. Responses for each answer category were summed across different
price ranges, and are shown in Figure 16. Over 75 percent of respondents said they would pay at
least five percent more for a sustainably produced bike, and 57 percent would pay at least ten
percent more. This provides strong evidence that there is a market for sustainable bikes. These
findings also support the results from the Walden Hyde survey, which found that 62% of
Figure 16. Willingness-to-pay for a “green bicycle.”

37
respondents would “pay more for a bike that was made with sustainable manufacturing and labor
practices” (Walden Hyde, 2013b). Additionally, the team determined if consumers with certain characteristics are willing to pay
more for a sustainably made bicycle. As discussed above, a sustainability score was constructed to
measure the intensity of sustainable behavior in respondents. The responses to four questions were
summed to create this score. The questions used and corresponding answers are listed in Table 10.
Table 10. The Sustainability Score Structure
The maximum possible sustainability score is four points, and the results have a mean score
of 1.59 (Figure 17). This score provides a useful tool to determine the relationship between an
individual’s sustainable behavior
and their stated WTP for
sustainably manufactured bicycles.
The response variable, WTP, is
ordinal, meaning there is a clear
order to the response categories.
The explanatory variable is the
sustainability score, which has four
levels. A chi-squared test indicates
that these two variables are
dependent (p=0.000). Additional
chi-squared test results found that
the age and gender of a respondent
and the amount originally paid for a
bike also have statistically significant relationships with the WTP variable (age: p=0.009, gender:
p=0.000, original price paid: p=0.030). Chi-squared tests, however, do not show directionality, only
Survey Question Answer What are the most important factors when buying a
bike, components, or bike accessories? Please drag
and drop the following factors in the order of most
important (1) to least important (7).
Respondents who ranked “Environmental-
friendliness” as first, second, or third received one
point
How often do you buy "green", organic, or sustainably
produced products? Respondents who chose “All of the time” or “Most
of the time” received one point If it came to your attention that a company was
producing its products in a sustainable way, how
would you react?
Respondents who chose “I would consider buying
more from the company” were given one point
If it came to your attention that a company was
producing its products in an unsustainable way, how
would you react?
Respondents who chose “I would consider buying
less from the company” were given one point
Figure 17. Distribution of sustainability score

38
that there is dependence between the variables.13 Therefore, the team constructed a regression model
to describe the overall relationship between these variables. Ordered logistic regressions are used
when the response variable is ordinal. WTP is the response variable, and sustainability score, age,
gender, and amount paid for original bike are the explanatory variables. However, tests showed that
the model violates the proportional odds assumption14; therefore a multinomial logistic regression
model was used. The results from this test indicate that the model as a whole is statistically
significantly better than a model with no predictors (p=0.000). Multinomial regressions model the
log odds of a response variable outcome as a linear combination of the explanatory variables. In
other words, the model tests a one-unit increase in the explanatory variable for one level of the
response variable relative to a “base” level. The research team specified the base level to be level
three WTP, which represents a willingness to pay a five percent increase in price for a sustainably
manfactured bicycle. The model results indicate that for level two WTP (willing to pay an amount
equal to the original price) relative to the base level, the z-test statistic for the explanatory variable
sustainability score (-0.881/0.190) is -4.63 with an associated p-value of 0.000. With an alpha level of
0.05, the team rejects the null hypothesis and conclude that for level two WTP relative to the base
level, the regression coefficient for sustainability score is statistically different from zero, holding all
else constant. In other words, a one-unit increase in sustainability score is associated with a 0.881
decrease in the relative log odds of being in level two WTP versus the base level. The team also
concludes that for levels five and six WTP (willing to pay 20% and 50% more than the original bike
price, respectively) relative to the base level, the regression coefficients for sustainability score are
also statistically different from zero, with p-values of 0.001 for both, holding all else constant. A
one-unit increase in sustainability score is associated with a 0.565 increase in the relative log odds of
being in the level five WTP versus a level three WTP, and a one-unit increase in score is also
associated with a 1.119 increase in the relative log odds of being in level six WTP versus a level three
WTP. These results indicate that individuals with higher sustainability scores are statistically
associated with higher WTP, and vice versa, holding all else constant. This intuitively makes sense:
individuals that engage in more sustainable behavior will be willing to pay more for a sustainably
produced bicycle.
The model also found that for levels four and six WTP relative to the base level, the
regression coefficients for age are also statistically different from zero, with p-values of 0.033 and
0.005, respectively, holding all else constant. This indicates that older individuals are more likely to
be willing to pay more for sustainable bicycles. Finally, the model also found significant results for
the original price paid which indicates that individuals who paid more for their bike are less likely to
pay more for sustainable bicycles. This is likely explained by the additional costs that increasing the
percentage paid for sustainable bikes adds to the price. For example, a 20 percent increase on a 100
13 Chi-squared tests determine if a relationship exists between two categorical variables, but do not indicate directionality of the relationship. 14 The proportional odds assumption states that the coefficients describing the relationship between each category of the response variable are the same. In this case, an “omodel” test was used to determine if the model met the proportional odds assumption. The results were significant (p=0.000), indicating that the model does not meet these assumptions and a different test should be used.

39
dollar bike only totals 120 dollars, while a 20 percent increase on a 4,000 dollar bike means an
additional 800 dollars, or 4,800 dollars total.
The survey and model results indicate that the survey sample is willing to pay more for
sustainably produced bicycles. While the campus community surveyed is not representative of the
entire bicycle consumer population, the high percentage of bicycle owners, commuters, racers, and
casual riders provides valuable information for bicycle companies. Consumers might maintain
certain priorities, such as performance, weight, or appearance, over sustainability, but when given
the choice between two products that are identical in every other way, this research suggests that
consumers will choose the sustainably produced product.
F. The Bicycle Industry’s Opportunity for Improvement
Specialized has been dedicated to improving its environmental and social impacts since 2009,
and there is no doubt that this work has decreased the company’s overall impacts. However, the
LCA and Equipment Index assessment of Specialized’s bicycle products and brand indicate that
there are significant opportunities to improve its position on the overall “sustainability spectrum.”
To the best of the team’s knowledge, Specialized and its vendors comply with all environmental laws
in their geographical area, but the LCA completed in this study uncovered environmental impacts
inherently in current bicycle manufacturing practices. Additionally, the OIA Equipment Index
assessment did not highlight the work Specialized is currently doing to minimize its environmental
impacts. The team found very few publicly available reports on other bicycle brand’s environmental
work. While this does not necessarily imply that other brands are not working to minimize their
environmental impacts, there is little data indicating otherwise. Therefore, it is likely that the bicycle
industry is unfortunately not addressing the sustainability of its supply chain and is theoretically very
low on the “sustainability spectrum” with ample room for improvement. There are, of course,
exceptions to this, but the majority of bicycles sold in the U.S. are made in China and Taiwan and
are susceptible to manufacturing processes similar to those analyzed in this research.
V. Final Recommendations
A. Final Recommendations for the Client
The results of this project identify several areas where Specialized can work to further
decrease its environmental impact. It can continue to be environmental leaders in the bicycle
industry by focusing its efforts to three specific areas: industry collaboration, supply chain
engagement, and impact reduction.
Industry Collaboration
Specialized is leading the industry by systematically reaching out to its competitors and
suppliers in order to collaborate on minimizing the industry’s environmental and social impacts.
Specifically, Specialized worked with the OIA to develop the Equipment Index and strived to rally
interest from other bicycle brands to ensure that the index thoroughly addresses bicycle

40
manufacturing. Despite reaching out to several major bicycle brands, only SRAM joined Specialized
to participate in the tool development (Bainbridge, 2014d). Their participation in the index
development identified a need for a streamlined, easier to use index, which resulted in a simplified
version of the tool called the Rapid Design Module (Bainbridge, 2014d). Additionally, Specialized
was instrumental in organizing a presentation at the 2013 Bicycle Leadership Council (BLC) meeting
on the OIA’s sustainability work (Bainbridge, 2014d). This presentation in conjunction with
Specialized’s encouragement jumpstarted some interest to measure impacts in the industry
(Bainbridge, 2014d). Apart from this conceptual collaboration, Specialized accepts carbon fiber
waste from other bicycle brands including Santa Cruz and Ibis for recycling in the U.S. (Bainbridge,
2014d).
As evidenced through the work it is already doing, Specialized is clearly aware of the many
benefits associated with collaboration. In order to maintain this level of environmental leadership, it
is recommended that Specialized continue to reach out to other bicycle brands and similar
industries, such as the outdoor industry, to learn from previously completed and ongoing projects.
Specifically, it is recommended that Specialized continue to make use of existing networks such as
BLC, BPSA, BRaIN, bicycle trade shows, and the WFSGI. Marketing the work being done by
Specialized through these networks will invite other brands to think about their own impacts. Since
Specialized is a leading bicycle brand in the world, other brands will likely strive to compete with
Specialized’s sustainability work. When marketing Specialized’s sustainability work, it is important to
foster a sense of collaboration by clearly indicating what work Specialized is willing to share and
what recommendations Specialized has for a company just starting to think about its environmental
impact. Alternatively, the results of this research can be disseminated throughout the industry
without the bias of a specific brand name. By highlighting Duke’s research over Specialized’s
participation, other bicycle brands may be encouraged to review their supply chains. Different
companies are triggered in different ways and it is therefore recommended that Specialized continue
to vary its approach to collaborating with other brands.
Supply Chain Engagement
Specialized began engaging with its supply chain by taking a global tour of its primary
suppliers. The tour introduced Specialized’s policies and programs and strategically sought the
suppliers’ cooperation and participation on future sustainability practices (Bainbridge, 2014d).
While Specialized’s suppliers are actively engaged in the sustainability discussion, the data
collection done for this research highlighted a lack of transparency and trust between industry
suppliers and brands. In order to increase transparency and trust, education is needed. Suppliers
need to understand why transparency is important and how it will benefit them. For instance,
suppliers benefit from tracking environmental legislation to prevent supply chain disruption. By then
transparently communicating their policies, processes, and general habits with their customers,
suppliers will foster healthy, stable business relationships. Suppliers can also improve customer
service and quality by better understanding their customers’ objectives and articulating their
limitations. It is therefore recommended that Specialized work closely with its supply chain – beyond
traditional design and forecast work – to fully understand the work being done in Taiwan and China

41
and educate its suppliers on the mutual benefits associated with transparency and collaboration.
Without the support of the supply chain, the current state of environmental impact cannot be
accurately measured and opportunities for improvement cannot be identified.
Impact Reduction
As indicated in previous sections, Specialized has worked with its suppliers to decrease its
impacts by creating an audit system and scorecard that evaluates suppliers on their environmental
impacts and identifies opportunities for improvement. Additionally, Specialized’s introduction of an
RSL reduces environmental impacts by eliminating the use of environmentally harmful materials.
Specialized’s thorough review of its products’ packaging saved approximately 39,000 kilograms of
paperboard by just redesigning its shoeboxes (Bainbridge, 2014d). These material savings translate
into substantial cost savings.
While this work has been instrumental in reducing Specialized’s overall impact, this project uncovered additional opportunities for impact reduction in its bicycle manufacturing. It is recommended that Specialized:
Engage with its pre-impregnated carbon fiber composite suppliers to identify water saving
opportunities
Engage with its aluminum frame supplier to identify energy saving opportunities during
artificial aging
Engage with its chain manufacturer to identify waste saving opportunities during the
stamping phase and ensure that all its chain manufacturers recycle its wasted steel
Engage with its carbon frame and fork manufacturers to identify waste saving opportunities
such as replacing sandpaper with ScotchBrite
When working with suppliers to understand these impacts and identify potential opportunities, it is
also recommended that Specialized set internal goals to benchmark their impact reduction over time.
By reducing the energy and water used and waste created in Specialized’s supply chain, product costs
may decrease for both its suppliers and Specialized.
Completing these recommendations will continue to move Specialized up the “sustainability
spectrum” and ensure that it will not be rudely awakened by the introduction of environmentally
focused laws.
B. Final Recommendations for the Industry
As indicated by a review of company websites, Specialized is one of a few bicycle companies
to show environmental leadership through an examination of its manufacturing processes, indicating
that the rest of the industry is further behind. The team recommends that the industry focus on the
following areas to reduce overall environmental impacts of bicycle production.
42
Increase Collaboration
As discussed earlier, there is currently very little collaboration between bicycle companies.
This high level of privacy has stunted environmental progress within the industry. While it is
understandable that bicycle companies want to protect the proprietary aspects of their production
processes, many manufacturing processes are standard practices within the industry. Since
environmental impact data and best management practices do not always reveal differences in
engineering practice and design, it is unlikely that any competitive advantage would be lost.
Furthermore, by collaborating to create industry practices at a brand level, suppliers will not be
overwhelmed with meeting multiple, slightly different environmental policies.
In order to increase collaboration, the team recommends that the bicycling industry utilize
the BPSA to create a sharing platform. The team recommends that the industry, as represented by
the BPSA and in collaboration with the OIA, establish a sustainability task force or committee with
representatives from all major bicycle companies to collaborate on new initiatives and share ideas.
Part of this collaboration should include an annual report on the status of sustainability in the
bicycling industry, including a ranking of all major bicycle companies and their progress on reducing
environmental impacts.15 Additionally, the BPSA and leaders in the industry should establish an
online document library that bicycle companies can gain access to. This library should contain
documents about the most impactful areas of the manufacturing process, best management practices
for reducing these impacts, lessons learned and case studies of successes, “how-to” instructions for
bicycle companies interested in initiating a new sustainability program, and other relevant
publications and information.
Supply Chain Engagement
It is difficult to understand the environmental impacts of manufacturing bicycles and track
progress without establishing a baseline of current practices through supply chain engagement. It is
recommended that bicycle companies work with their suppliers to record current practices, measure
current impacts, establish clear policies and programs, set goals that are above and beyond current
regulations, and then measure and track changes and improvements. By doing so, bicycle companies
foster authenticity and create a strong, trusting relationship between brand and suppliers. This type
of relationship can lead to brands and suppliers decreasing the use of raw materials, which will in
turn decrease costs. It is important that the entire industry take these steps so environmental impacts
can be fully understood and areas for improvement can be identified.
Since it is difficult to balance the privacy concerns within the industry and thoroughly
address environmental impacts, there is an entrepreneurial opportunity for a company to certify
bicycle manufacturers based on their environmental and labor practices. The company would have
to protect suppliers through non-disclosure agreements and clearly explain its certification process.
15 The ranking could be based on the OIA’s Equipment Index Brand Module

43
Immediate Next Steps
The team acknowledges that beginning to consider a company’s environmental impacts can
be overwhelming. Therefore, the team has identified immediate steps bicycle companies can take.
Specifically, it is recommended that all bicycle companies:
Hire or establish a sustainability position or department to ensure compliance with
environmental regulations, establish a baseline of impacts, and decrease environmental
impacts in all aspects of the companies’ practices
o Alternatively, hire a summer intern from a leading graduate program to identify
sustainability projects and draft sustainability policies
Complete the OIA Equipment Index Brand Module, as well as the Product Module for the
most popular products, in order to quickly identify opportunities for improvement and
provide a landscape of current practices within the supply chain
Network with OIA SWG and bicycle industry members by attending events and meetings or
reaching out to and communicating with other bicycle companies about new initiatives and
progress made
Review the OIA SWG website to learn about sustainability work currently being done within
the outdoor industry
Taking these steps will open the industry to significant savings opportunities. Some savings
will be monetary in the form of material reduction while other savings will be avoided costs due to
regulation compliance. Regardless, the industry will be able to get ahead of increasingly strict
environmental regulations on substances in manufacturing, waste water discharge, and solid waste
disposal and avoid shutting down its suppliers.
Regarding the Outdoor Industry Association’s Equipment Index
The team has developed several recommendations specifically for the OIA in order to
improve the Equipment Index’s effectiveness. One issue the team discovered when completing the
Index was how to answer questions that addressed general company policies. Specialized has a wide
range of products with different policies, so the Index should direct companies use an “average”
program or policy for each indicator to reduce this uncertainty.
The Index is designed to award points for incremental levels of achievement, but many
smaller and newer companies may not have reached even the lowest levels specified in the tool.
Therefore, some additional indicators for companies who are just beginning to implement
sustainability progams should be included to encourage all bicycle companies to complete the Index.
Finally, the OIA should continue updating and revising the Index. Since the completion of
this study, the Index has been expanded to include product waste and heat treating impacts, which
will more accurately assess product impacts. Updating the Index will continue to be important in the
future as additional research is completed.

44
C. Scope for Further Research
This research was the first of its kind and therefore there are significant opportunities for
further research. In general, it is recommended that NSOE MP research teams further the research
in order to continue to provide the industry with unbranded research. Specifically, there are
opportunities to:
Calculate LCAs on a complete Roubaix bicycle and a complete Allez bicycles
Assess the impact of other Roubaix and Allez frame sizes through LCA
Conduct comparative LCAs between different types of bicycles
Improve the accuracy of existing and future LCAs through direct data collection and
reduction of assumptions and proxies
Complete the OIA Equipment Index for a complete bicycle
Administer the survey to a national, diverse population
Interview bicycle company chief executive officers to understand their perceptions on
sustainability and the barriers they face to reduce their impacts
The above recommendations are direct extensions of the research presented in this report.
The original scope of this research was to assess the impact of a complete Roubaix and Allez bicycle.
However, due to data collection barriers, this work could not be completed. By completing an LCA
on a full Roubaix and Allez bicycle, additional areas for impact reduction could be identified.
Additionally, the LCAs conducted in this report are limited by the data received via email and the
life cycle inventory (LCI) databases available through Duke’s Center for Sustainability & Commerce.
The LCAs can be further refined through direct data collection, further research to confirm the
assumptions and proxies used, and by acquiring additional LCI databases. This research only
considered a size 56cm frame, yet impacts could vary by frame size. It is recommended to assess this
potential variation through additional LCAs.
This study only completed the OIA Equipment Index for the Roubaix and Allez bicycle
framesets. Completing the index for a complete bicycle will further highlight any additional
challenges of using the OIA Equipment Index for complex consumer goods.
Qualitatively, national consumer demand can be further assessed by administering the survey
to a national, diverse population. When considering the outlets and networks for administering the
survey, it is recommended that a combination of bicycle-themed and bicycle-neutral networks be
used. Finally, interviewing executive leadership at bicycle manufacturing companies will identify
barriers, challenges, and concerns of addressing sustainability in their supply chains and further shed
light on next steps for the bicycle industry to decrease its environmental impact.

45
VI. Conclusions
Over the course of one year, a NSOE MP research team quantitatively analyzed the
sustainability of manufacturing processes used to produce Specialized’s bicycles and qualitatively
determined the current state of interest for sustainably made bikes. The results from this assessment
highlighted opportunities to minimize environmental impacts in Specialized’s supply chain and
indicated that there is consumer demand for sustainably made bikes. The lack of progress made thus
far in the industry can be partially attributed to the media’s positive portrayal of bicycles and the
bicycle industry. These results led the team to conclude its final recommendations to the client and
industry. In particular, Specialized and the industry should immediately and continually act to:
Engage with its supply chain to record current practices, measure current impacts, establish
clear policies and programs, set goals to minimize impacts, and then measure and track
changes and improvements
Collaborate among the industry to identify and prolong best manufacturing and management
practices
Little work has been done to measure and address the environmental sustainability of the
bicycle supply chain so there is substantial opportunity for significant improvements as well as much
more to learn. The team is hopeful that this research will catalyze a conversation within the industry
that will eventually lead to a more efficient supply chain.

46
VII. Works Cited
Ababa, A. (2014, February 8). An awakening giant; Manufacturing in Africa. The Economist.
Accell Group. (2012). Sustainable Materials and Recycling. Retrieved February 12, 2014. From Accell
Group: http://www.accell-group.com/uk/page.asp?id=9518092
Accell Group. (2013). Corporate Social Responsibility. Retrieved April 1, 2013, from Accell Group:
http://www.accell-group.com/uk/page.asp?id=2402766
Alta Bicycle Share. (2014). Home Page. Retrieved March 20, 2014, from Alta Bicycle Share:
http://www.altabicycleshare.com
Anonymous. (2008, September 20). Business: On your bike; Giant Manufacturing. The Economist.
Anonymous. (2008, August 9). Business: High Seas, high prices; Business in China. The Economist
Anonymous. (2008, November 29). On your bike; transport in Africa. The Economist
Anonymous. (2012, November 7). Re-cycling: Cardboard bicycles. The Economist.
Anonymous. (2013, March 30). The last of the metal-bashers; Manufacturing towns. The Economist
Anonymous. (2013, November 22). The Wheel Problem. Retrieved on February 10, 2014 from The
Economist http://www.economist.com/news/britain/21590590-cycling-britain-not-always-
dangerousbut-it-could-be-much-safer-wheel-problem
Badger, A. (2014, April 1). Why DC’s bikeshare is flourishing while New York’s is financially
struggling. Retrieved on April 10, 2014 from The Washington Post: http://www.washington
post.com/blogs/wonkblog/wp/2014/04/01/why-dcs-bikeshare-is-flourishing-while-new-
yorks-is-financially-struggling/
Bain Capital. (2014). BainCapital. Retrieved March 20, 2014, from BainCapital.com:
http://www.baincapital.com
Bainbridge, B. (2013, April 2). Sustainability Strategist, Specialized Bicycle Components. (Alice
Kodama, Interviewer).
Bainbridge, B. (2014a, February 9). Sustainability Strategist, Specialized Bicycle Components. (Alice
Kodama, Interviewer).
Bainbridge, B. (2014b, February 13). Sustainability Strategist, Specialized Bicycle Components. (Alice
Kodama, Interviewer).
Bainbridge, B. (2014c, February 18). Sustainability Strategist, Specialized Bicycle Components. (Alice
Kodama, Interviewer).
Bainbridge, B. (2014d, April 8). Sustainability Strategist, Specialized Bicycle Components. (Alice
Kodama, Interviewer).
Bardelline, J. (2010, August 3). Levi's, Outdoor Industry Join Forces for Product Footprint Tool. Retrieved
March 24, 2013, from GreenBiz.com: http://www.greenbiz.com/news/2010/08/03/levis-
outdoor-industry-join-forces-product-footprint-tool
Berman, M. (2012, April 13). Capital Bikeshare to sell helmets to members. Retrieved on February
10, 2014 from The Washington Post: http://www.washingtonpost.com/local/trafficand
commuting/capital-bikeshare-to-sell-helmets-to-
members/2012/04/13/gIQAXgr5FT_story.html
Bernstein, L. (2012, June 4). Bike commuting in D.C.: From the suburbs, it’s not so easy. Retrieved
on February 2, 2014 from The Washington Post:
47
http://www.washingtonpost.com/lifestyle/wellness/bike-commuting-in-dc-from-the-
suburbs-its-not-so-easy/2012/06/04/gJQA9pLZEV_story.html
Bicycle Product Suppliers Association. (n.d.). OIA Affiliation. Retrieved March 24, 2013, from
Bicycle Product Suppliers Association: http://bpsa.org/articles/oia-affiliation-pg86.htm
Bicycle Retailer and Industry News. (2012, April 23). Earth Day news: Tons of carbon recycled. Retrieved
March 24, 2013, from Bicycle Retailer and Industry News:
http://www.bicycleretailer.com/north-america/2012/04/23/earth-day-news-tons-carbon-
recycled#.UU-a47_6F90
Bicycle Retailer and Industry News. (2014, March 5). Taiwan focuses on high-end market as average
complete bike selling price continues to rise. Retrieved April 11, 2014, from Bicycle Retailer
and Industry News: http://www.bicycleretailer.com/international/2014/03/05/taiwan-
focuses-high-end-market-average-complete-bike-selling-price#.U1E51lfYPnY
Bicycling. (2014, March 7). America’s Bike-Share Programs. Retrieved March 20, 2014, from
Bicycling.com: http://www.bicycling.com/news/featured-stories/americas-bike-share-
programs
bicyclinginfo.org. (n.d.). How many people ride bikes? Retrieved March 24, 2013, from General Bicycling
Statistics: http://www.bicyclinginfo.org/facts/statistics.cfm
Bikes Belong. (n.d.). When People Ride Bikes, Good Things Happen. Retrieved March 24, 2013, from
Bikes Belong: http://www.bikesbelong.oli.us/StatsOnePager.pdf
Bike Europe. (2014, April 17). Anti-Dumping Duty on Vietnamese Bicycle Tyres. Retrieved April
19, 2014, from Bike Europe: http://www.bike-eu.com/Sales-Trends/Market-
trends/2014/4/Anti-Dumping-Duty-on-Vietnamese-Bicycle-Tyres-1505774W/
Bike Europe. (2011, November 1). China-Taiwan’s Free Trade Agreement Becomes Fully Operational in
2012. Retrieved April 10, 2014, from Bike Europe: http://www.bike-eu.com/Laws-
Regulations/Regulations/2011/11/China--Taiwans-Free-Trade-Agreement-Becomes-Fully-
Operational-in-2012-BIK005391W/
Bike Europe. (2013, August 13). Ideal Shifts to China for Dumping Exemption. Retrieved April 19,
2014, from Bike Europe: http://www.bike-eu.com/Sales-Trends/Business-
trends/2013/8/Ideal-Shifts-to-China-for-Dumping-Duty-Exemption-1333605W/
Bilton, N. (2013, October 21). Start-Up Reinvents the Bicycle Wheel. Retrieved on February 21,
2014 from The New York Times: http://bits.blogs.nytimes.com/2013/10/21/start-up-literally
reinvents-the-bicyclewheel/?action=click&module=Search®ion=searchResults%231
&version=&url=http%3A%2F%2Fquery.nytimes.com%2Fsearch%2Fsitesearch%2F%3Fact
ion%3Dclick%26region%3DMasthead%26pgtype%3DHomepage%26module%3DSearchSu
bmit%26contentCollection%3DHomepage%26t%3Dqry610%23%2Fbicycle%2Bindustry%
2Ffrom20060101to20140314%2Fallresults%2F2%2F
Bjorling, Eric and Eric Bybee. (2013, December 5). Marketing, Product Quality Engineer, Trek
Bicycles. (Alice Kodama, Interviewer).
Bloomberg. (2014). Chemicals-Diversified Companies. Retrieved on April 20, 2014 from Bloomberg:
http://www.bloomberg.com/markets/companies/chemicals-diversified/

48
Bluesign. (2013). About Us. Retrieved March 16, 2014, from Bluesign:
http://www.bluesign.com/home/about-us#.UyZi3dzZGKw
Boggan, S. (2001, October 20). Nike Admits to Mistakes Over Child Labor. Retrieved March 23, 2013,
from Common Dreams: http://www.commondreams.org/headlines01/1020-01.htm
Bryant, John. n.d. Sinyard the Obsessed. Retrieved January 18, 2014. From Bicycling Magazine:
http://www.bicycling.com/news/featured-stories/sinyard-obsessed?page=0,0
Burrill, Daniel. (2012). How to Fabricate Automotive Fiberglass & Carbon Fiber Parts. North Branch, MN:
CarTech.
Chavez, N. (2013, August 2). As Capital Bikeshare expands, service feels growing pains. Retrieved
February 1, 2014 from The Washington Post:
http://www.washingtonpost.com/local/trafficandcommuting/as-capital-bikeshare-expands-
in-popularity-and-size-it-runs-into-logistical-issues/2013/08/02/c2ee7f80-f925-11e2-afc1-
c850c6ee5af8_story.html
Cropp, I. (2011, July 2). Why it costs almost 1,000 to get a bike. Retrieved on February 11, 2014
from The Washington Post http://www.washingtonpost.com/business/why-it-costs- almost-
1000-got-a-bike/2011/06/29/AGDcHQvH_story.html
Croucher, Tom. (2010). Polymer (Glycol) Quenchants. Retrieved on January 4, 2014 from
http://www.croucher.us/glycol
Das, Suji. (2011). Life cycle assessment of carbon fiber-reinforced polymer composites. The
International Journal of Life Cycle Assessment, 16(3) 268-282.
Dave, S. (2010, February). Life Cycle Assessment of Transportation Options for Commuters. Retrieved March
24, 2013, from http://files.meetup.com/1468133/LCAwhitepaper.pdf
Davis, Dwain (personal communication, January 18, 2014)
Davis, Joseph R. (1993). Aluminum and Aluminum Alloys. ASM International.
Depillis, L. (2014, January 24). This is how Wal-Mart is bringing jobs back to the U.S. Retrieved on
February 11, 2014, from The Washington Post
http://www.washingtonpost.com/blogs/wonkblog/wp/2014/01/24/this-is-how-walmart-
is-bringing-jobs-back-to-the-u-s/
Diffusion Alloys Limited. (n.d.). Chromising. Retrieved on April 17, 2014 from http://www.diffusion-
alloys.com/downloads/DAL-Chromising.pdf
DiNucci, Mark. (2013, December 31). DiNucci Cycles. (Alice Kodama, Interviewer).
Discovery Communications. (2009). How It’s Made: Nuts and Bolts. Retrieved December 30, 2014,
from https://www.youtube.com/watch?v=kidWBeyOMA0
Discovery Communications. (2014). How It’s Made: Sandpaper. Retrieved December 18, 2014, from
http://www.sciencechannel.com/tv-shows/how-its-made/videos/how-its-made-mini-
episodes-sandpaper.htm
Dogwood Ceramic Supply. (2014, February). What is my Voltage? Retrieved April 17, 2014, from
http://www.dogwoodceramics.com/product/paragon/support/what-is-my-voltage.htm
Dorel. (n.d.). Recreational Leisure. Retrieved March 24, 2013, from Dorel:
http://www.dorel.com/eng/CMS/DOR_mBook'12_xREC.pdf

49
Doty, Alex. (2013, June 13). Executive Director, The Bicycle Coalition of Greater Philadelphia.
(Alice Kodama, Interviewer).
Dow. (1998). Epoxy Novolac Resins. Retrieved January 16, 2014 from http://msdssearch.dow.com/
PublishedLiteratureDOWCOM/dh_0030/0901b8038003042d.pdf?filepath=/296-
00279.pdf&fromPage=GetDoc
Dow. (2003). A Guide to Glycols. Retrieved January 13, 2014 from http://msdssearch.dow.com/
PublishedLiteratureDOWCOM/dh_0047/0901b803800479d9.pdf?filepath=propyleneglycol
/pdfs/noreg/117-01682.pdf&fromPage=GetDoc
Dow. (n.d.). D.E.R. 331. Retrieved on January 6, 2014 from http://msdssearch.dow.com/
PublishedLiteratureDOWCOM/dh_01e8/0901b803801e8ef7.pdf?filepath=epoxy/pdfs/nor
eg/296-01408.pdf&fromPage=GetDoc
Duce, A. D. (2011, September 2). Life Cycle Assessment of conventional and electric bicycles. Retrieved
March 24, 2013, from Eurobike: http://www.eurobike-show.de/eb-
wAssets/daten/rahmenprogramm/pdf/LifeCycleAssessment_DelDuce_englisch.pdf
Duke University. (2012). Quick Facts About Duke. Retrieved February 14, 2014, from
http://newsoffice.duke.edu/all-about-duke/quick-facts-about-duke
Du-Lite. (2013, February 6). Material Safety Data Sheet: Steelkote. Retrieved on January 8, 2014, from:
http://www.dulite.com/MSDS/Steelkote%20MSDS.pdf
Du-Lite. (n.d.). Operating instructions for Du-Lites’ Steelkote Black Oxide Salts For Blackening of Cold Rolled
Steel, Plain Carbon and Low Alloy Steels. Retrieved on January 8, 2014, from:
http://www.dulite.com/Operating%20Insructions/Steelkote_OI.pdf
Farrell, S. (2009, June 9). Beater Bikes, the Cheap Workhorses of Cycling. Retrieved on February 20,
2014 from The New York Times: http://cityroom.blogs.nytimes.com/2009/06/09/beater-
bikes the-cheap-workhorses-
ofcycling/?action=click&module=Search®ion=searchResults%
2312&version=&url=http%3A%2F%2Fquery.nytimes.com%2Fsearch%2Fsitesearch%2F%
3Faction%3Dclick%26region%3DMasthead%26pgtype%3DHomepage%26module%3DSea
rchSubmit%26contentCollection%3DHomepage%26t%3Dqry610%23%2Fbicycle%2Bindu
stry%2Ffrom20060101to20140314%2Fallresults%2F13%2F
Fast Company. (2010, November). Suppliers Set Out to Grade Products with Sustainability Scorecards.
Retrieved January 11, 2014, from http://www.fastcompany.com/1693714/suppliers-set-out-
grade-products-sustainability-scorecards
Fluidforming. (2010). Hydroforming machines Formbalancer FB25 and FB35. Retrieved on December 16,
2013, from http://www.fluidforming.de/index.php/en/hydroformmaschine-formbalancer
Friedman, S. (2006, November 9). You Paid How Much for That Bike? Retrieved on February 20,
2014 from The New York Times:
http://www.nytimes.com/2006/11/09/fashion/09Fitness.html?
pagewanted=print&action=click&module=Search®ion=searchResults%230&version=&
url=http%3A%2F%2Fquery.nytimes.com%2Fsearch%2Fsitesearch%2F%3Faction%3Dclic
k%26region%3DMasthead%26pgtype%3DHomepage%26module%3DSearchSubmit%26co

50
ntentCollection%3DHomepage%26t%3Dqry610%23%2Fbicycle%2Bindustry%2Ffrom200
60101to20140314%2F
Greenpeace. (2014a). The Detox Campaign. Retrieved April 12, 2014, from
http://www.greenpeace.org/international/en/campaigns/toxics/water/detox/intro/
Greenpeace. (2014b). Search Results. Retrieved on April 19, 2014 from Greenpeace.com:
http://www.greenpeace.org/usa/en/Searchresult/?cx=006365659792415701065:qjtac-
0qbwo&cof=FORID:11&q=bicycle&sa=Search
Grossman, J. (2010, June 2). Make Bikes in the U.S. or Go Abroad to Cut Costs? Retrieved on
February 20, 2014 from The New York Times:
http://www.nytimes.com/2010/06/03/business?smallbusiness/03sbiz.html?action=click&
module=Search®ion=searchResults%230&version=&url=http%3A%2F%2Fquery.nytim
es.com%2Fsearch%2Fsitesearch%2F%3Faction%3Dclick%26region%3DMasthead%26pgty
pe%3DHomepage%26module%3DSearchSubmit%26contentCollection%3DHomepage%2
6t%3Dqry610%23%2Fbicycle%2Bmanufacturing%2Ffrom20060101to20140314%2F
Grynbaum, M. & Connelly, M. (2012, August 21). Most New Yorkers Say Bike Lanes Are a Good
Idea. Retrieved on February 13, 2014 from The New York Times:
http://www.nytimes.com/2012/08/22/nyregion/most-new-yorkers-say-bike-lanes-are-a-
good-idea.html?adxnnl=1&adxnnlx=1398108058-I+MbMagN2p6XdTC7n6f5Xw
Hall, M. L. (2012, November 1). NYC Study Finds Protected Bicycle Lanes Boost Local Business. Retrieved
March 24, 2013, from America Bikes: http://www.americabikes.org/nyc_study_finds_
protected_bicycle_lanes_boost_local_business
Halper, M. (2011, October 13). Steel Industry: Carbon fiber an environmental culprit. Retrieved March 24,
2013, from smartplanet: http://www.smartplanet.com/blog/intelligent-energy/steel-
industry-carbon-fiber-an-environmental-culprit/9584
Halsey, A. (2013a, February 7). Proposal mandating bike helmets gets a cold shoulder from cyclists.
Retrieved February 2, 2014 from The Washington Post:
http://www.washingtonpost.com/local/trafficandcommuting/md-proposal-mandating-
bike-helmets-gets-a-cold-shoulder-from-cyclists/2013/02/07/f8df9b62-6c9c-11e2-bd36-
c0fe61a205f6_story.html
Halsey, A. (2013b, May 16). Bike commuting increases in D.C. Retrieved February 2, 2014 from The
Washington Post: http://www.washingtonpost.com/local/trafficandcommuting/bike-
commuting-increases- in-dc/2013/05/16/cb27b7b8-be18-11e2-97d4-
a479289a31f9_story.html
Halsey, A. (2014, January 30). Frigid temps are no barrier to the growing number of bicycle riders.
Retrieved February 2, 2014 from The Washington Post:
http://www.washingtonpost.com/local/trafficandcommuting/frigid-temps-are-no-barrier-
to-the-growing-number-of-bicycle-riders/2014/01/30/065155b0-89c0-11e3-916e-
e01534b1e132_story.html
Hamburger, T. (2012, June 21). Romney’s Bain Capital invested in companies that moved jobs
overseas. Retrieved February 2014, from The Washington Post: http://www.washington
post.com/business/economy/romneys-bain-capital-invested-in-companies-that-moved-

51
jobs-overseas/2012/06/21/gJQAsD9ptV_story.html
Harmanci, R. (2011, November 10). Cyclist Fashion Is Diversifying, Way Beyond Spandex.
Retrieved on February 12, 2014 from The New York Times:
http://www.nytimes.com/2011/11/11/us/cyclist-fashion-is-diversifying-way-beyond-
spandex.html
Henkel. (2011, August 12). Material Safety Data Sheet: Eccobond G-909 QT. Retrieved on December 18,
2013, from http://hybris.cms.henkel.com/henkel/msdspdf?country=US&language
=EN&matnr=1188755
Henkel. (2014, February 19). Material Safety Data Sheet: Loctite. Retrieved on December 29, 2013,
from http://henkelconsumerinfo.com/products/henkel.datasheets.Search.pdf?
BUSAREA=0006&DOCTYPE=MSDS&LANG=EN&COUNTRY=US&VKORG=3450
&MATNR=209728
H.J. (2010, August 3). Cycling in Brazil: Vicious cycling. Retrieved February 10, 2014 from The
Economist: http://www.economist.com/blogs/gulliver/2010/08/cycling_brazil
Hout, Erik van der. (2014, January 16). Corporate Social Responsibility, Accell Group. (Alice
Kodama, Interviewer).
Huang, James. (2009, August 18). Trek 2010: Urban Specials from Trek to Gary Fisher. Retrieved March
7, 2014, from bikeradar: http://www.bikeradar.com/us/gear/article/trek-2010-urban-
specials-from-trek-and-gary-fisher-22797/
Hubbard Hall. (2009, January 28). Aquaease PL 72 A16. Retrieved on December 16, 2013. From
http://www.hubbardhall.com/Collateral/ProductBulletins/English-US/2053005.pdf
Huetteman, E and Harris, E. (2014, January 23). Walmart Fund to Support U.S. Manufacturing.
Retrieved on February 22, 2014 from The New York Times: http://www.nytimes.com/
2014/01/24/business/walmart-creates-10-million-fund-to-stimulate-american-
manufacturing.html?action=click&module=Search®ion=searchResults%231&version=&
url=http%3A%2F%2Fquery.nytimes.com%2Fsearch%2Fsitesearch%2F%3Faction%3Dclic
k%26region%3DMasthead%26pgtype%3DHomepage%26module%3DSearchSubmit%26co
ntentCollection%3DHomepage%26t%3Dqry610%23%2Fbicycle%2Bmanufacturing%2Ffro
m20060101to20140314%2Fallresults%2F2%2F
Industrial Process. (2013). Electric Industrial Ovens. Retrieved on December 19, 2013, from
http://www.industrialprocessoven.com/html/cabinet_ovens.html
International Standards Organization. (2014). ISO 14000 – Environmental Management. Retrieved
February 23, 2014, from http://www.iso.org/iso/iso14000
Iscar. (n.d.). Material Grades. Retrieved on April 17, 2014, from http://nsert-uk.com/wordpress/wp-
content/uploads/2012/04/MATERIAL-GRADES.pdf
Jakubas, Kate. (2013, September 17). Environmental Compliance Specialist, SRAM. (Alice Kodama,
Interviewer).
Jamarco. (n.d.). Making Sense of Sandpaper. Retrieved on January 13, 2014, from
http://www.jamarco.com/91b_Technical/sandpaper/Making%20Sense%20of%20Sandpap
er%20-%20Page%203%20-%20Fine%20Woodworking.htm

52
Jui Chih Machinery Industrial Co., LTD. (2009). Tube Pre-Processing Equipment. Retrieved on
December 16, 2013, from http://www.juichih.com.tw/products/product-ja01c.html
Kilgannon, C. & Singer, J. (2011, June 12). Battery Power Gives Deliverymen a Boost, at a Cost.
Retrieved on February 12, 2014 from The New York Times:
http://cityroom.blogs.nytimes.com/2011/06/12/battery-power-gives-deliverymen-a-boost-
at-a-cost/
Korn, Derek. (2005, Nov. 11). Machining Composites by Conventional Means. Retrieved on December 30,
2013, from http://www.mmsonline.com/articles/machining-composites-by-conventional-
means
Kutsmeda, Ken. (2012, September 19). Specifying medium-voltage distribution. Retrieved on April 17,
2014, from http://www.csemag.com/single-article/specifying-medium-voltage-
distribution/9ea49999f50f77b358677b5c3c283fff.html
Laufenberg. (2014). PE-Coated Kraft (PEK). Retrieved on December 18, 2013, from
http://laufenberg.info/en/products/silicone-coated-papers/pe-coated-kraft-pek/
Lazo, L. (2014, February 27). Capital Bikeshare put on hold in College Park. Retrieved February 10,
2014, from The Washington Post http://www.washingtonpost.com/blogs/dr-
gridlock/wp/2014/02/27/capital-bikeshare-put-on-hold-in-college-park/
Lee, J. (2009, April 9). Study Links Alcohol and Bicycle Deaths. Retrieved February 12, 2014 from
The New York Times: http://cityroom.blogs.nytimes.com/2009/04/09/study-links-alcohol-
and-bike-deaths/
Leuenberger, M., & Frischknecht, R. (2010, June). Life Cycle Assessment of Two Wheel Vehicles.
Retrieved March 24, 2013, from http://www.esu-
services.ch/fileadmin/download/leuenberger-2010-TwoWheelVehicles.pdf
Levi Strauss & Co. (2009, March). A Product Lifecycle Approach to Sustainability. Retrieved on March 24,
2014. From: http://lsco.s3.amazonaws.com/wp-content/uploads/2014/01/A-Product-
Lifecyle-Approach-to-Sustainability.pdf
Matbase. (2014). LDPE. Retrieved on December 18, 2014. From http://www.matbase.com/
material-categories/natural-and-synthetic-polymers/commodity-polymers/material-
properties-of-low-density-polyethylene-ldpe.html#properties
Matbase. (2014). Silicone Rubber. Retrieved on December 18, 2014. From http://www.matbase.com/
material-categories/natural-and-synthetic-polymers/elastomers/material-properties-of-
silicone-rubber.html#properties
McLaughlin, M. (2013, October 4). In Washington, more kids head to school by bike. Retrieved on
February 3, 2014 from The Washington Post:
http://www.washingtonpost.com/lifestyle/kidspost/in-washington-more-kids-head-to-
school-by-bike/2013/10/03/bd39f71a-260f-11e3-b3e9-d97fb087acd6_story.html
Megatech. (2011). CY-0900 DDP Sprayer. Retrieved on January 6, 2014. From
http://www.megatech-trading.com/index.php/products/spray-equipment/air-spray-finish-
pump-packages/item/47-cy-0900-air-spray-package
Mesa, Malou, personal communication, January 5, 2014.

53
Montgomery, D. (2008, August 2). Cycling Back Around: Four Wheels Good, Two Wheels Better.
In the City, and Old Fashioned Conveyance Returns. Retrieved from The Washington Post:
http://www.washingtonpost.com/wpdyn/content/article/2008/08/01/AR2008080103246
_pf.html
Montgomery, D. (2009, September 28). Stripped-Down Fixies Have Long Been The Bike of Choice
Among Couriers. Now, Hip Urbanites Have Gotten the Message. Retrieved on February 10,
2014 from The Washington Post: http://www.washingtonpost.com/wp-dyn/content/article/
2009/09/27/AR2009092703241.html
Mott, Adam. (2014, January 21). Sustainability Manager, The North Face. (Alice Kodama,
Interviewer).
M.S. (2013, November 11). Cycling v cars: The American right-of-way. Retrieved on February 10,
2014 from The Economist:
http://www.economist.com/blogs/democracyinamerica/2013/11/cycling-v-cars
National Bicycle Dealers Association. (2012). A Look at the Bicycle Industry’s Vital Statistics. Retrieved
on January 18, 2014. From Industry Overview 2012: http://nbda.com/articles/industry-
overview-2012-pg34.htm
Nike, Inc. (2014). Considering the Impact of Our Choices. Retrieved on March 1, 2014. From Design:
http://nikeinc.com/pages/design
Nike Responsibility. (n.d.) Material Choice and Impact. Retrieved on April 20, 2014, from
http://www.nikeresponsibility.com/infographics/materials/index.html
Nippon Graphite Fiber Corporation. (n.d.). Retrieved on December 19, 2013, from
http://www.ngfworld.com/en/en_product/en_prepreg.html
Okala Practitioner. (2014). Genesis of Okala. Retrieved on March 7, 2014. From Okala Practitioner:
http://www.okala.net/genesis.html
Outdoor Industry Association. (2013). Corporate Responsibility. Retrieved on March 24, 2013, from
Outdoor Industry Association: http://www.outdoorindustry.org/responsibility/index.html
Rampell, C. (2008, November 16). How Industries Survive Change. If They Do. Retrieved on
February 20, 2014 from The New York Times http://www.nytimes.com/2008/11/16/
weekinreview/16rampell.html?contentCollection=Homepage&t=qry610%23/bicycle+indus
try/from20060101to20140314/&version=&action=click®ion=Masthead&module=Searc
hSubmit&url=http://query.nytimes.com/search/sitesearch/?action=click&pgtype=Homep
age&pagewanted=print
Rawsthorn, A. (2010, May 9). New York Museum Showcases Custom-Made Bicycles. Retrieved on
February 20, 2014 from The New York Times: http://www.nytimes.com/2010/05/10/arts/
10iht-design10.html?action=click&module=Search®ion=searchResults%232&version
=&url=http%3A%2F%2Fquery.nytimes.com%2Fsearch%2Fsitesearch%2F%3Faction%3D
click%26region%3DMasthead%26pgtype%3DHomepage%26module%3DSearchSubmit%2
6contentCollection%3DHomepage%26t%3Dqry610%23%2Fbicycle%2Bindustry%2Ffrom
20060101to20140314%2Fallresults%2F3%2F
54
Raytech. (2010). Vibratory Tumblers: Heavy Duty. Retrieved on January 28, 2014, from
http://www.raytechmetalfinishing.com/vibratory-tumblers/heavy-
duty/raymf_vt_hd_av25ss.php
Rivera, R. (2007, March 29). New Legislation Protects Delivery Workers Who Use Bikes. Retrieved
February 11, 2014 from The New York Times:
http://www.nytimes.com/2007/03/29/nyregion/29mayor.html?fta=y
RockWest Composites. (2013). FAQ. Retrieved on December 30, 2013, from
http://www.rockwestcomposites.com/faqs
Rosler. (2013, February 2). Compound CS 6 P/ 3. Retrieved on December 15, 2013, from
http://www.rosler.it/fileadmin/images_roesler/compounds/cs6p-3_en_1.pdf
SAE International. (2008, January 16). Black Oxide Coating. Retrieved on January 8, 2014 from
Techstreet.
Sea-Distances. (2014). Home Page. Retrieved on December 16, 2013, from http://www.sea-
distances.org
Shuz Tung Machinery Industrial Co., LTD. (n.d.). HT-10-01H (carbon) Circular Saw Cutting Machine for
Carbon Tube. Retrieved on January 29, 2014, from
http://www.shuztung.com/new/web_c/html/02_products/en/bicycle_detail_HT-10-
01H.html
Shuz Tung Machinery Industrial Co., LTD. (n.d.). HT-10-042 (alluminum) Rotary Blade Type Auto
Cutting M/C. Retrieved on January 28, 2014, from http://www.shuztung.com/
new/web_c/html/02_products/en/bicycle_detail_HT-10-042.html
Shuz Tung Machinery Industrial Co., LTD. (n.d.). HT-10-302 Hydraulic Press. Retrieved on January
28, 2014, from http://www.shuztung.com/new/web_c/html/02_products/
en/bicycle_detail_HT-10-302.html
Shuz Tung Machinery Industrial Co., LTD. (n.d.). HT-10-470 Top Tube Double Ends Milling M/C.
Retrieved on December 16, 2013, from http://www.shuztung.com/new/web_c/html/
02_products/en/bicycle_detail_HT-10-470.html
Shuz Tung Machinery Industrial Co., LTD. (n.d.). HT-50-260 B.B. Shell Thread Cashing M/C.
Retrieved on January 28, 2014, from http://www.shuztung.com/new/web_c/
html/02_products/en/bicycle_detail_HT-50-260.html
Sikkens. (n.d.). Creating Together. Retrieved on February 17, 2014, from
http://www.sikkens.net/sikkenscr/US/Pages/HomePage.aspx
Smart Growth America. (2010). What Are Complete Streets? Retrieved March 24, 2013, from National
Complete Streets Coalition: http://www.smartgrowthamerica.org/complete-
streets/complete-streets-fundamentals/complete-streets-faq
Smart USA. (2014). Pure Coupe. Retrieved on February 13, 2014. From Smart USA.com:
http://www.smartusa.com/models/pure-coupe/overview.aspx
S.N. (2013, October 22). How do bike-sharing schemes shape cities? Retrieved February 10, 2014
from The Economist: http://www.economist.com/blogs/economist-
explains/2013/10/economist-explains-14

55
Solar One. (2008). Electricity in NYC! Retrieved on February 13, 2014. From:
http://communityresourcesscied.wikispaces.com/file/view/Electricity+in+New+York+Cit
y+Lesson+Plan.pdf
Song, Young S., Youn, J.R., Gutowski, T.G. (2009). Life cycle energy analysis of fiber-reinforced
composites. Composites, 40A(8) 1257-1265.
Special Chem. (2014). Glossary. Retrieved on February 13, 2014. From:
http://www.specialchem4polymers.com/tc/flame-retardants/index.aspx?id=9324
Specialized Bicycle Components. (2013). Sustainable Innovation. Retrieved April 1, 2013, from
Specialized: http://www.specialized.com/us/en/ctisca/
Specialized Bicycle Components. (2014). Home Page. Retrieved on February 12, 2014. From:
http://www.specialized.com/us/en/home
Spiegel, J. (2009, January 1). A Surge in Bicyclists Appears to Be Waiting. Retrieved on February 20,
2014 from The New York Times: http://www.nytimes.com/2009/01/01/business/
smallbusiness/01sbiz.html?version=&action=click®ion=searchResults&pagewanted=pri
nt
Staff, B. (2013, February 19). Are cyclists interested in sustainability? Survey will tell. Retrieved March 24,
2013, from Bicycle Retailer and Industry News: http://www.bicycleretailer.com/industry-
news/2013/02/19/are-cyclists-interested-sustainability-survey-will-tell#.UU-bcr_6F91
Steel Data. (2010). C68 Steel. Retrieved on April 17, 2014, from http://www.steeldata.info/
hardenability/demo/html/668.html
Stellin, S. (2009, December 8). Clearing a Path for Bikes in City Office Buildings. Retrieved on
February 12, 2014 from The New York Times:
http://www.nytimes.com/2009/12/09/realestate/commercial/09bike.html
Strong, Brent. (2006). Retrieved December 19, 2013, from http://strong.groups.et.byu.net/
pages/articles/articles/prepregs.pdf
Sullivan, P. (2014, January 22). King Street bike lanes bother residents who will lose street parking
along busy route. Retrieved on February 2, 2014 from The Washington Post:
http://www.washingtonpost.com/local/king-street-bike-lanes-bother-residents-who-will-
lose-street-parking-along-busy-route/2014/01/21/c374b620-7fa5-11e3-9556-
4a4bf7bcbd84_story.html
Sustainability Working Group. (2014). Sustainability Working Group. Retrieved on February 12, 2014.
From Outdoor Industry Association:
https://www.outdoorindustry.org/responsibility/swg/index.html
Sustainable Apparel Coalition. (2012). Retrieved November 25, 2012, from The Higg Index:
http://www.apparelcoalition.org/higgindex/
Taiwan Exporter. (2013). A-Forge Enterprise Co., LTD. Retrieved on November 20, 2013. From
http://www.taiwanexporter.net/bicycle/a-forge.html
Taiwanese Bureau of Energy. (2011). What is the existing energy mix and current Energy Policy in Taiwan?
Retrieved on February 21, 2014. From Ministry of Economic Affairs:
http://web3.moeaboe.gov.tw/ECW/english/content/Content.aspx?menu_id=1679
56
TerraPass. (2014). Carbon Footprint Calculator. Retrieved on February 13, 2014. From:
http://terrapass.com/carbon-footprint-calculator-2/
The Home Depot. (2013). Norton SandWet 600 Grit Ultra-Fine Sandpapers (QTY 5). Retrieved on
December 18, 2013. From: http://www.homedepot.com/p/Norton-SandWet-600-Grit-
Ultra-Fine-Sandpapers-QTY-5-02343/202241223#specifications
The League of American Bicyclists. (2013). Bike Commuting Data. Retrieved on April 20, 2013, from
The League of American Bicyclists: http://www.bikeleague.org/news/acs2010.php
Trek Bikes. (2014). We Believe in Bikes. Retrieved March 11, 2014, from Trek Bikes:
http://www.trekbikes.com/us/en/company/products/
Tuff, S. (2008, May 1). Cycling Success Measured in Frequent-Flier Miles. Retrieved on February 20,
2014, from The New York Times:
http://www.nytimes.com/2008/05/01/fashion/01fitness.html?
pagewanted=all&action=click&module=Search®ion=searchResults%236&version=&url
=http%3A%2F%2Fquery.nytimes.com%2Fsearch%2Fsitesearch%2F%3Faction%3Dclick%
26region%3DMasthead%26pgtype%3DHomepage%26module%3DSearchSubmit%26conte
ntCollection%3DHomepage%26t%3Dqry610%23%2Fbicycle%2Bindustry%2Ffrom200601
01to20140314%2Fallresults%2F7%2F
United States International Trade Commission. (2013, January 15). Harmonized Tariff Schedule of
the United States, Retrieved from: http://hts.usitc.gov/hts_search.asp?search_txt=bicycle
U.S. Energy Information Administration. (2013, October 29). Japan. Retrieved April 17, 2014, from
http://www.eia.gov/countries/cab.cfm?fips=ja
Walden Hyde. (2013a). 2013 Bicycle Consumer Survey: 20 Questions. Retrieved March 24, 2013, from
https://docs.google.com/spreadsheet/viewform?formkey=dHdKZEZNeFBr
WEw5V0VXa2xxTF9VVmc6MQ
Walden Hyde. (2013b, April 18). People Who Ride Bikes Talk Sustainability. Retrieved September 15,
2013, from http://www.waldenhyde.com/2013/people-who-ride-bikes-talk-sustainability/
Walthert, Martin. (2013, November 1). Vice President of Research and Development, DT Swiss.
(Bryant Bainbridge, Interviewer).
White, Philip. (2007, October). Okala Impact Factors: North American single-figure process values for impact
assessment. Retrieved April 15, 2014, from http://www.lcacenter.org/InLCA2007/
presentations/139.pdf
Wiebe, M. (2012, December 4). BPSA pushes forward with business sustainability program. Retrieved
March 24, 2013, from http://www.bicycleretailer.com/north-america/2012/12/04/bpsa-
pushes-forward-business-sustainability-program#.UU-bPL_6F91
Williams, A. (2009, September 9). Whose Bike Are You Wearing? Retrieved February 20, 2014 from
The New York Times: http://www.nytimes.com/2009/09/10/fashion/10bikes.html?
action=click&module=Search®ion=searchResults%239&version=&url=http%3A%2F%
2Fquery.nytimes.com%2Fsearch%2Fsitesearc%2F%3Faction%3Dclick%26region%3DMast
head%26pgtype%3DHomepage%26module%3DSearchSubmit%26contentCollection%3D
Homepage%26t%3Dqry610%23%2Fbicycle%2Bindustry%2Ffrom20060101to20140314%2
Fallresults%2F10%2F

57
World Health Organization. (2014). What is the minimum quantity of water needed? Retrieved February
13, 2014, from Water Sanitation Health: http://www.who.int/water_sanitation_health
/emergencies/qa/emergencies_qa5/en/
World Resources Institute. (2014). Aqueduct. Retrieved February 16, 2014, from
http://www.wri.org/our-work/project/aqueduct/aqueduct-atlas
World Trade Organization. (2014). Anti-dumping. Retrieved April 22, 2014, from
http://www.wto.org/english/tratop_e/adp_e/adp_e.htm
Yale University (2014). Environmental Performance Index. Retrieved on January 11, 2014, from
http://epi.yale.edu/epi
Yardley, W. (2007, November 5). In Portland, Cultivating a Culture of Two Wheels. Retrieved on
February 20, 2014 from The New York Times:
http://www.nytimes.com/2007/11/05/us/05bike
.html?contentCollection=Homepage&t=qry610#/bicycle+industry/from20060101to201403
14/&version=&action=click®ion=Masthead&module=SearchSubmit&url=http://query
.nytimes.com/search/sitesearch/?action=click&pgtype=Homepage&pagewanted=print
You’re The Boss Editors. (2010, June 2). Would You Build Bikes in the U.S. or the Far East?
Retrieved on February 21, 2014 from The New York Times: http://boss.blogs.nytimes.com/
2010/06/02/would-you-build-bikes-in-the-u-s-or-the-
fareast/?action=click&module=Search&
region=searchResults%231&version=&url=http%3A%2F%2Fquery.nytimes.com%2Fsearc
h%2Fsitesearch%2F%3Faction%3Dclick%26region%3DMasthead%26pgtype%3DHomepa
ge%26module%3DSearchSubmit%26contentCollection%3DHomepage%26t%3Dqry610%2
3%2Fbicycle%2Bmanufacturing%2Ffrom20060101to20140314%2Fallresults%2F2%2F
Y.S. Paint. (2003). An Introduction of Y.S. Paints. Retrieved on December 19, 2014, from
http://www.y-s-paint.com.tw/profile.htm

58
VIII. Appendices
Appendix 1: The Research Team
Rebecca Johnson [email protected] http://www.linkedin.com/pub/becky-johnson/56/714/77 Masters of Environmental Management, 2014 Nicholas School of the Environment, Duke University B.A. Public Policy, 2011 University of North Carolina at Chapel Hill Becky Johnson graduated from UNC Chapel Hill in 2011 with a BA in Public Policy and a
minor in Environmental Studies. After graduating, she managed community outreach and advocacy at a clean transportation program with the Town of Chapel Hill Planning Department. She then decided to return to school to expand her knowledge in energy and transportation, and has since worked for the North Carolina League of Conservation Voters on hydraulic fracturing policy research and the Natural Resources Defense Council on alternative transportation issues in Charlotte, NC. After graduation, she will be working as an Associate for the Croatan Institute, located in Durham, NC.
Alice Kodama [email protected] http://www.linkedin.com/in/alicekodama/ Masters of Environmental Management, 2014 Nicholas School of the Environment, Duke University B.S. Materials Science & Engineering, 2009 Lehigh University
Alice Kodama graduated from Lehigh University in 2009 with a BS in Materials Science & Engineering and a Minor in Design Arts. During her time at Lehigh, she was heavily involved in environmental advocacy work on campus. Following graduation, she worked for Advanced Sports International, owner of Fuji, SE Racing, Kestrel, Breezer, and Oval Concepts bicycle brands. She worked for ASI's Product Department in various capacities for three years; including administrative coordinator and project manager. She also acted as ASI's Advocacy & Sustainability Manager. While at the Nicholas School, Alice had the opportunity to consult REI on apparel end of life solutions. Because of this experience and the work included in this paper, Alice is pursuing opportunities in product and supply chain sustainability.
Regina Willensky [email protected] http://www.linkedin.com/pub/regina-willensky/51/a64/777 Masters of Environmental Management, 2014 Nicholas School of the Environment, Duke University B.A. Economics & Management and Environmental Studies, 2012 Beloit College
Regina Willensky graduated from Beloit College in 2012 with a BA in Economics and Management and Environmental Studies. Regina has coordinated research and policy analysis of environmental concerns in New York State and New York City for Senator Charles E. Schumer and for a NYC Mayoral candidate. While at the Nicholas School, Regina has conducted research in conjunction with Duke University and the Bill & Melinda Gates Foundation on Sanitation and Health in developing countries.

59
Appendix 2: Summary of Life Cycle Assessment Results
Total Freshwater Used & Consumed
Roubaix
Frame
Roubaix
Fork
Allez
Frame Allez Fork
Front
Wheel
Rear
Wheel Chain
Total Freshwater Use (L) 65,300 31,200 2,000 35,600 308 375 18
Liters Used per 1kg of Product 61,600 79,000 1,350 82,300 381 385 70
Liters Used per Year 1,310,000,000 623,000,000 45,000,000 801,000,000 13,100,000 15,900,000 755,000
Olympic Pools Filled per Year 523 249 18.0 320 5.23 6.37 0.30
Total Number of People per
Year 477,000 228,000 16,400 293,000 4,780 5,820 276
Table A1. Total freshwater use for each product analyzed. One Olympic pool is assumed to hold 2.5 million liters of water. One person requires 7.5 liters of water per day
to survive (World Health Organization, 2014). It is assumed that the wheels and chain are sold on the Roubaix and Allez frames.
Roubaix
Frame
Roubaix
Fork
Allez
Frame Allez Fork
Front
Wheel
Rear
Wheel Chain
Total Freshwater Consumption
(including rainwater) (L) 2,310 884 1,670 903 308 375 13
Freshwater Used per 1kg of Product 2,160 2,080 1,240 2,060 382 385 50
Liters Consumed per Year 46,100,000 17,700,000 37,500,000 20,300,000 13,100,000 15,900,000 541,000
Olympic Pools Filled per Year 18.0 7.07 15.0 8.12 5.23 6.37 0.22
Total Number of People per Year 16,800 6,560 13,700 7,420 4,780 5,820 198
Table A2. Total freshwater (including rainwater) consumed for each product analyzed. One Olympic pool is assumed to hold 2.5 million liters of water. One person
requires 7.5 liters of water per day to survive (World Health Organization, 2014). It is assumed that the wheels and chain are sold on the Roubaix and Allez frames.

60
Embedded Energy
Roubaix
Frame
Roubaix
Fork
Allez
Frame Allez Fork
Front
Wheel
Rear
Wheel Chain
Gross Caloric Energy (kWh) 467 205 2,380 229 82 153 21
Gross Caloric Energy per 1kg of
Product 440 520 1,600 530 102 157 84
Gross Caloric Energy per Year 9,340,000 4,100,000 53,600,000 5,160,000 3,500,000 6,480,000 895,000
Hours of Powering NYC per Year 20.4 8.94 117 11.3 7.64 14.2 1.95
Table A3. Embedded energy for each product expressed as gross caloric energy in kilowatt hours. It is assumed that New York City uses 11,000,000 kilowatt-hours every
day (Solar One, 2008).
Global Warming Potential
Roubaix
Frame
Roubaix
Fork
Allez
Frame Allez Fork
Front
Wheel
Rear
Wheel Chain
GWP (kg-e CO2) 67.2 30.0 255 33.5 8.71 15.7 1.93
GWP (kg-e CO2) per 1kg of Product 63.4 75.8 171.3 77.5 10.8 16.1 7.66
GWP (kg-e CO2) per Year 1,340,000 598,000 5,730,000 755,000 370,000 666,000 82,100
Miles Driven per Year 3,510,000 1,560,000 15,000,000 1,970,000 967,000 1,740,000 214,000
Kilometers Driven per year 5,650,000 2,510,000 24,100,000 3,170,000 1,560,000 2,800,000 345,000
Table A4. Global warming potential for each product in kilogram equivalents of carbon dioxide. The distances driven were calculated for a 2013 Ford Explorer with front
wheel drive (TerraPass, 2014).
Solid Waste
Roubaix
Frame
Roubaix
Fork
Allez
Frame Allez Fork
Front
Wheel
Rear
Wheel Chain
Solid Waste (kg) 1.01 0.39 0.06 0.41 0.16 0.50 0.94
Solid Waste (kg) per 1kg of Product 0.95 0.99 0.04 0.96 0.20 0.52 3.71
Solid Waste (kg) per Year 20,200 7,780 1,310 9,290 7,000 21,400 39,800
Smart Cars per Year 24.7 9.49 1.59 11.3 8.54 26.1 48.5
Table A5. Solid waste produced for each product. One Smart car is assumed to weigh 1,808 pounds (Smart USA, 2014).

61
Appendix 3: Full List of Life Cycle Assessment Assumptions
General Assumptions
Item Assumed Description Resource
Consumables
Data on consumables were not received and therefore are not considered unless part of an aggregated process developed by PE International. Consumables refer to oil, lubricants, and similar chemicals used on machinery
Electricity Electricity mix is approximately the same in Japan and Taiwan
(Taiwanese Bureau of Energy, 2011; U.S. Energy Information Administration, 2013)
Electricity mix Medium voltage is used in industrial settings (Dogwood Ceramic Supply, 2014)
Dropout hangers The same dropout hanger is used on Allez and Roubaix
Chainstay protector The same chainstay protector is used on the Allez and Roubaix
Transportation
It is assumed that all container ships and trucks used are full on both the outgoing and returning trips. Only outgoing trips are considered.
Decal adhesive The adhesive used on decals is assumed to be negligible and therefore not considered in this model
Pre-impregnated Carbon Fiber Weight percentage of resin
The resin weight percentage is between 25% and 37%. An average, 31%, was used
(Nippon Graphite Fiber Corporation)
Yield of resin film transfer loss
The yield of resin film transfer loss is approximately 96% in SMC, a similar process to creating pre-impregnated carbon fiber. The yield of resin film transfer loss is assumed to be 80% since the pre-impregnated carbon fiber process involves spraying epoxy
(Das, 2011)
Electricity usage for making pre-impregnated carbon fiber
An MIT publication indicates that 40MJ/kg is needed to produce pre-impregnated carbon fiber
(Song, et.al., 2009)
Carbon fiber The carbon fiber is manufactured in Toyohashi, Japan
Carbon fiber
The carbon fiber is trucked to Tokyo (298km), shipped from Tokyo, Japan to Hong Kong (1821 nautical miles) and then trucked to Shenzhen (15km)

62
Sandpaper for Carbon Components
Sandpaper Sandpaper components were considered, but not the manufacturing of sandpaper
(Discovery Communications, 2014)
Sandpaper fabric Polycotton is a polyester cotton blend
Sandpaper An equivalent of 600-grit sandpaper is used (Burrill, 2012)
Sandpaper Aluminum oxide is the abrasive on the sandpaper
(The Home Depot, 2013)
Sandpaper
The ecoinvent dataset RER: urea formaldehyde resin, at plant accurately represents the resin typically used in sandpaper production
(Jamarco)
Sandpaper The weight of sandpaper is approximately 80% backing, 15% grit, 5% resin
CCK Paper
CCK paper
The CCK paper is silicone and low-density PE coated. Assumed that Kraft paper is coated with 1 micrometer of silicone and 1 micrometer of low-density PE
(Laufenberg, 2014)
Extrapolations of components of CCK paper
Extrapolated from densities and assumed that silicone and LDPE are coated at 1 micrometer of thickness. 97.6% of weight is paper, 1.4% is silicone rubber, and 1% is LDPE
(Matbase, LDPE, 2014; Matbase, Silicone, 2014)
CCK paper Electricity to make CCK paper was not considered
Headset
Transportation of secondary materials
The transportation of inputs to the headset manufacturing process was not considered since this information was not available. However, transportation of the aluminum used was considered since it makes up substantial weight of the final product
Topcap
Topcap turning The topcap is machined (turned) and the rough pre-machined topcap is 13g
Topcap drilled machining
The topcap is machined to create hole for bolt and the resulting weight is 12.801g
Topcap is tumbled
Electricity usage is only considered. It is assumed that a Raytech Metal Finishing tumbler is similar to the one used in production. 10 topcaps can be tumbled in this size tumbler using a demand of 172.5 W. Topcap is tumbled for 5 minutes.
(Raytech, 2010)
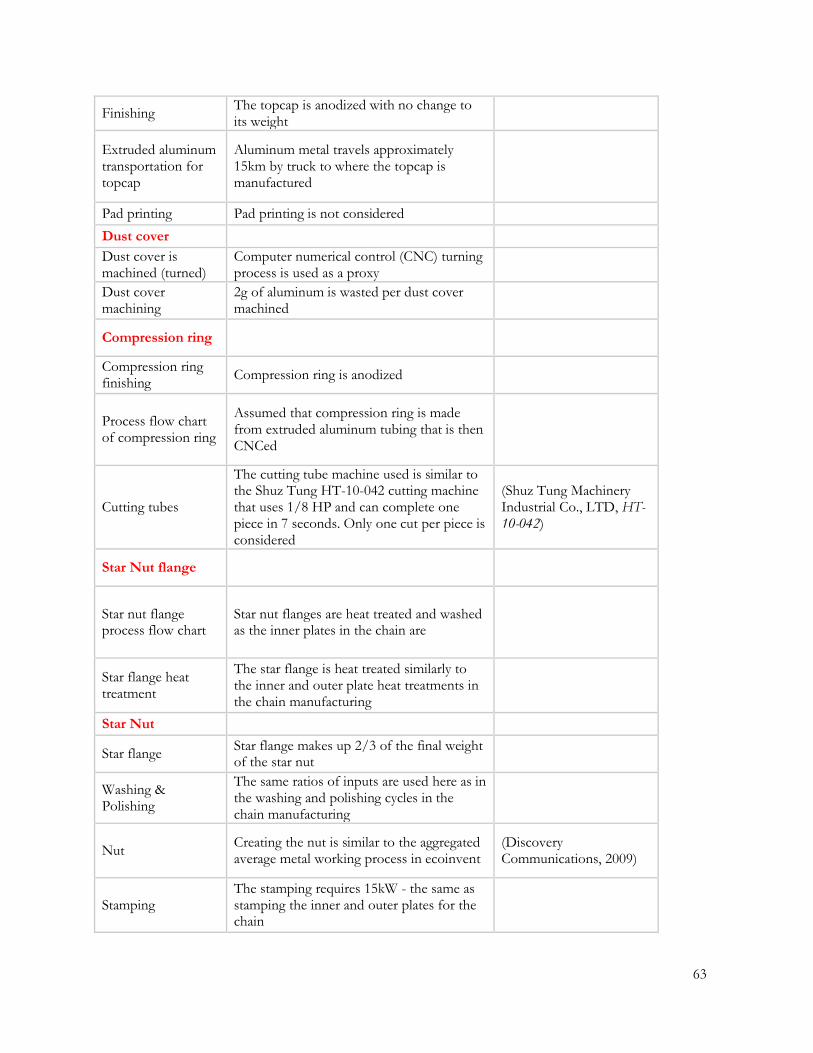
63
Finishing The topcap is anodized with no change to its weight
Extruded aluminum transportation for topcap
Aluminum metal travels approximately 15km by truck to where the topcap is manufactured
Pad printing Pad printing is not considered
Dust cover
Dust cover is machined (turned)
Computer numerical control (CNC) turning process is used as a proxy
Dust cover machining
2g of aluminum is wasted per dust cover machined
Compression ring
Compression ring finishing
Compression ring is anodized
Process flow chart of compression ring
Assumed that compression ring is made from extruded aluminum tubing that is then CNCed
Cutting tubes
The cutting tube machine used is similar to the Shuz Tung HT-10-042 cutting machine that uses 1/8 HP and can complete one piece in 7 seconds. Only one cut per piece is considered
(Shuz Tung Machinery Industrial Co., LTD, HT-10-042)
Star Nut flange
Star nut flange process flow chart
Star nut flanges are heat treated and washed as the inner plates in the chain are
Star flange heat treatment
The star flange is heat treated similarly to the inner and outer plate heat treatments in the chain manufacturing
Star Nut
Star flange Star flange makes up 2/3 of the final weight of the star nut
Washing & Polishing
The same ratios of inputs are used here as in the washing and polishing cycles in the chain manufacturing
Nut Creating the nut is similar to the aggregated average metal working process in ecoinvent
(Discovery Communications, 2009)
Stamping The stamping requires 15kW - the same as stamping the inner and outer plates for the chain
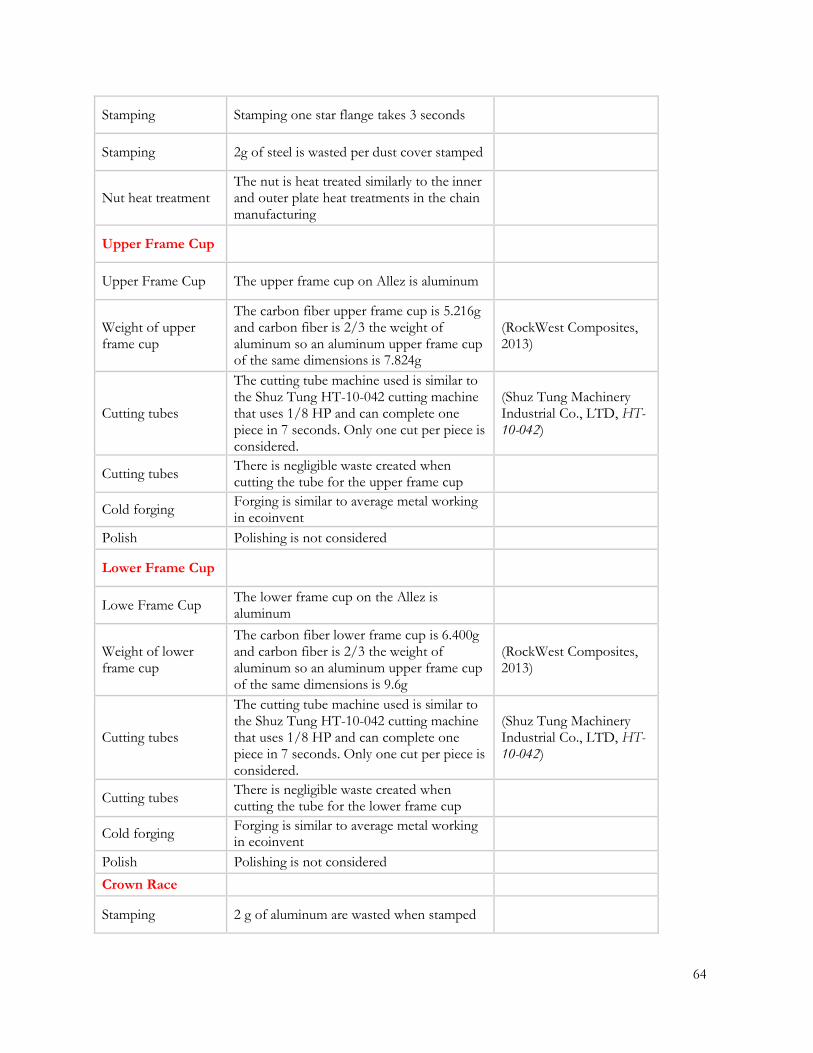
64
Stamping Stamping one star flange takes 3 seconds
Stamping 2g of steel is wasted per dust cover stamped
Nut heat treatment The nut is heat treated similarly to the inner and outer plate heat treatments in the chain manufacturing
Upper Frame Cup
Upper Frame Cup The upper frame cup on Allez is aluminum
Weight of upper frame cup
The carbon fiber upper frame cup is 5.216g and carbon fiber is 2/3 the weight of aluminum so an aluminum upper frame cup of the same dimensions is 7.824g
(RockWest Composites, 2013)
Cutting tubes
The cutting tube machine used is similar to the Shuz Tung HT-10-042 cutting machine that uses 1/8 HP and can complete one piece in 7 seconds. Only one cut per piece is considered.
(Shuz Tung Machinery Industrial Co., LTD, HT-10-042)
Cutting tubes There is negligible waste created when cutting the tube for the upper frame cup
Cold forging Forging is similar to average metal working in ecoinvent
Polish Polishing is not considered
Lower Frame Cup
Lowe Frame Cup The lower frame cup on the Allez is aluminum
Weight of lower frame cup
The carbon fiber lower frame cup is 6.400g and carbon fiber is 2/3 the weight of aluminum so an aluminum upper frame cup of the same dimensions is 9.6g
(RockWest Composites, 2013)
Cutting tubes
The cutting tube machine used is similar to the Shuz Tung HT-10-042 cutting machine that uses 1/8 HP and can complete one piece in 7 seconds. Only one cut per piece is considered.
(Shuz Tung Machinery Industrial Co., LTD, HT-10-042)
Cutting tubes There is negligible waste created when cutting the tube for the lower frame cup
Cold forging Forging is similar to average metal working in ecoinvent
Polish Polishing is not considered
Crown Race
Stamping 2 g of aluminum are wasted when stamped
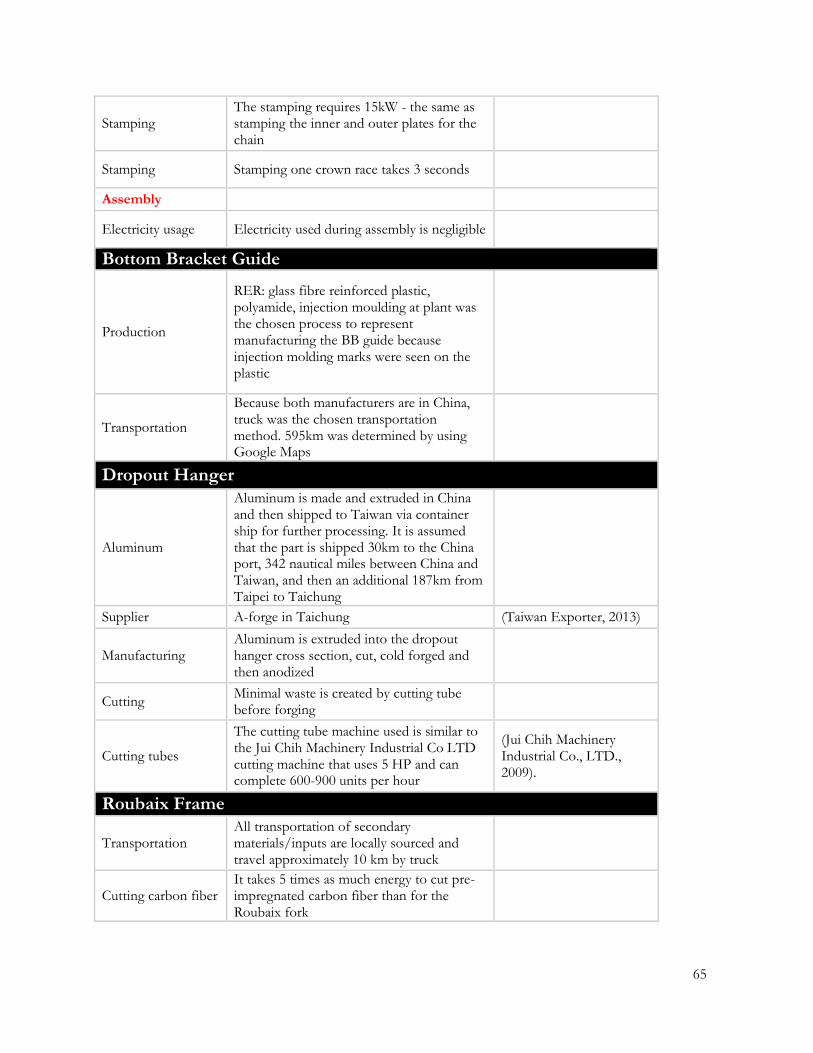
65
Stamping The stamping requires 15kW - the same as stamping the inner and outer plates for the chain
Stamping Stamping one crown race takes 3 seconds
Assembly
Electricity usage Electricity used during assembly is negligible
Bottom Bracket Guide
Production
RER: glass fibre reinforced plastic, polyamide, injection moulding at plant was the chosen process to represent manufacturing the BB guide because injection molding marks were seen on the plastic
Transportation
Because both manufacturers are in China, truck was the chosen transportation method. 595km was determined by using Google Maps
Dropout Hanger
Aluminum
Aluminum is made and extruded in China and then shipped to Taiwan via container ship for further processing. It is assumed that the part is shipped 30km to the China port, 342 nautical miles between China and Taiwan, and then an additional 187km from Taipei to Taichung
Supplier A-forge in Taichung (Taiwan Exporter, 2013)
Manufacturing Aluminum is extruded into the dropout hanger cross section, cut, cold forged and then anodized
Cutting Minimal waste is created by cutting tube before forging
Cutting tubes
The cutting tube machine used is similar to the Jui Chih Machinery Industrial Co LTD cutting machine that uses 5 HP and can complete 600-900 units per hour
(Jui Chih Machinery Industrial Co., LTD., 2009).
Roubaix Frame
Transportation All transportation of secondary materials/inputs are locally sourced and travel approximately 10 km by truck
Cutting carbon fiber It takes 5 times as much energy to cut pre-impregnated carbon fiber than for the Roubaix fork

66
CCK paper transportation
CCK paper travels approximately 10 km
Fluorine liquid transportation
The fluorine travels approximately 10 km
Nylon bladder The production of nylon 6 is considered, but not the manufacturing of the actual bladder
Curing MIT paper reports that it takes 21.9MJ/kg to autoclave mold a carbon fiber product
(Song, et.al., 2009)
Cutting cured carbon fiber
A machine similar to Shuz Tung's HT-10-01H (carbon) Circular Saw Cutting Machine for Carbon Tube was used. This demands 1 HP and cuts at a rate of 4-6 seconds per piece. Assumed that 2 cuts per frame are made
(Shuz Tung Machinery Industrial Co., LTD, HT-10-01H)
Cutting carbon fiber
It was indicated that the water used during the cutting process is recycled. It is assumed that 95% gets recycled and the remaining 5% is wastewater. It is also assumed that 3 L of water is used to cut the cured carbon fiber
(Korn, 2005)
Bonding Agents Henkel G909's MSDS was reviewed and since it is 30-60% epoxy resin, epoxy resin has been used as a proxy
(Henkel, 2011)
Bonding Agents Henkel DP460 could not be found on Henkel's website therefore it is assumed that it is also primarily made of epoxy resin
Bonding electricity usage
Electricity used to bond is negligible
Putty and paint processes
45g of epoxy resin is used during the putty phase and 90g during the painting phase
Paint Assumed that automotive painting process from the US LCI Professional database is similar to the process used for bikes.
Paint curing Oven is set to 130C according to Y.S. website
(Y.S. Paints, 2003)
Industrial curing ovens - paint
An oven 4'x6'x8' can cure approximately 16 56cm Allez frames
(Industrial Process, 2013)
Industrial curing ovens
The oven used demands approximately 30kW
(Industrial Process, 2013)
Exhaust from curing
85.7kg (as seen in chain heat treatment) of exhaust is released during one oven usage
Decal weight The weight of the frame decal is 10g with 3 grams wasted

67
Front Derailleur Hanger
Assumed that the front derailleur hanger has a surface area of approximately .005 sqm
Roubaix Rear Dropouts
Rear dropout material
The rear dropout is made of aluminum and carbon fiber. The aluminum portion is forged and machined
Aluminum dropouts Aluminum dropouts are locally sourced and travel 10 km by truck
Pre-impregnated carbon fiber
The finished weight of rear dropouts is 70% aluminum and 30% carbon fiber
Pre-impregnated carbon fiber
10% of pre-impregnated carbon fiber is wasted while cutting the pre-impregnated carbon
Cutting carbon fiber
Cutting pre-impregnated carbon fiber takes approximately 1/4th the amount of electricity as cutting aluminum and since more carbon is used and it takes twice as much electricity to cut the carbon fiber as in the front dropouts
Nylon bladder The production of nylon 6 is considered, but not the manufacturing of the actual bladder
Nylon bladder Each front dropout uses a nylon bladder that weighs 6 grams
Nylon bladder transportation
The bladder travels approximately 10 km
CCK paper Each rear dropout requires 4 grams of CCK paper during the layup stage
CCK paper transportation
CCK paper travels approximately 10 km
Fluorine liquid Each rear dropout requires 2 gram of fluorine liquid
Fluorine liquid transportation
The fluorine travels approximately 10 km
Cured carbon fiber cutting
An additional 8 grams per dropout is cut off after cured
Curing MIT paper reports that it takes 21.9MJ/kg to autoclave mold a carbon fiber product
(Song, et. al., 2009)

68
Cutting cured carbon fiber
A machine similar to Shuz Tung's HT-10-01H (carbon) Circular Saw Cutting Machine for Carbon Tube was used. This demands 1 horsepower and cuts at a rate of 4-6 seconds per piece. Assumed that 2 cuts per frame are made
(Shuz Tung Machinery Industrial Co., LTD, HT-10-01H)
Cutting cured carbon fiber
It takes 0.25kg of water to cut cured carbon fiber dropouts and 5% of this is wasted
Bonding Electricity used to bond is negligible
Roubaix Carbon Fork
Cutting carbon fiber Cutting pre-impregnated carbon fiber takes approximately 1/4th the amount of electricity as cutting aluminum
CCK paper transportation
CCK paper travels approximately 10
Nylon bladder The production of nylon 6 is considered, but not the manufacturing of the actual bladder
Nylon bladder transportation
The bladder travels approximately 10 km
Fluorine liquid The fluorine travels approximately 10 km
Sandpaper weight
The weight of 600 grit sandpaper was taken from HomeDepot's website and extrapolated to determine the weight of one sheet used
(The Home Depot, 2013)
Sanding 1 L of water is used and wasted for sanding the cured carbon fiber
Curing It takes 21.9MJ/kg to autoclave mold a carbon fiber product
(Song, et.al., 2009)
Cutting carbon fiber
The water used during the cutting process is recycled. It is assumed that 95% gets recycled and the remaining 5% is wastewater. It is also assumed that 2 L of water is used to cut the cured carbon fiber
(Korn, 2005).
Cutting cured carbon fiber
A machine similar to Shuz Tung's HT-10-01H (carbon) Circular Saw Cutting Machine for Carbon Tube was used. This demands 1 horsepower and cuts at a rate of 4-6 seconds per piece. Assumed that 1 cut per fork are made
(Shuz Tung Machinery Industrial Co., LTD, HT-10-01H)
Bonding Agents Henkel G909's MSDS was reviewed and since it is 30-60% epoxy resin, epoxy resin has been used as a proxy
(Henkel, 2011)
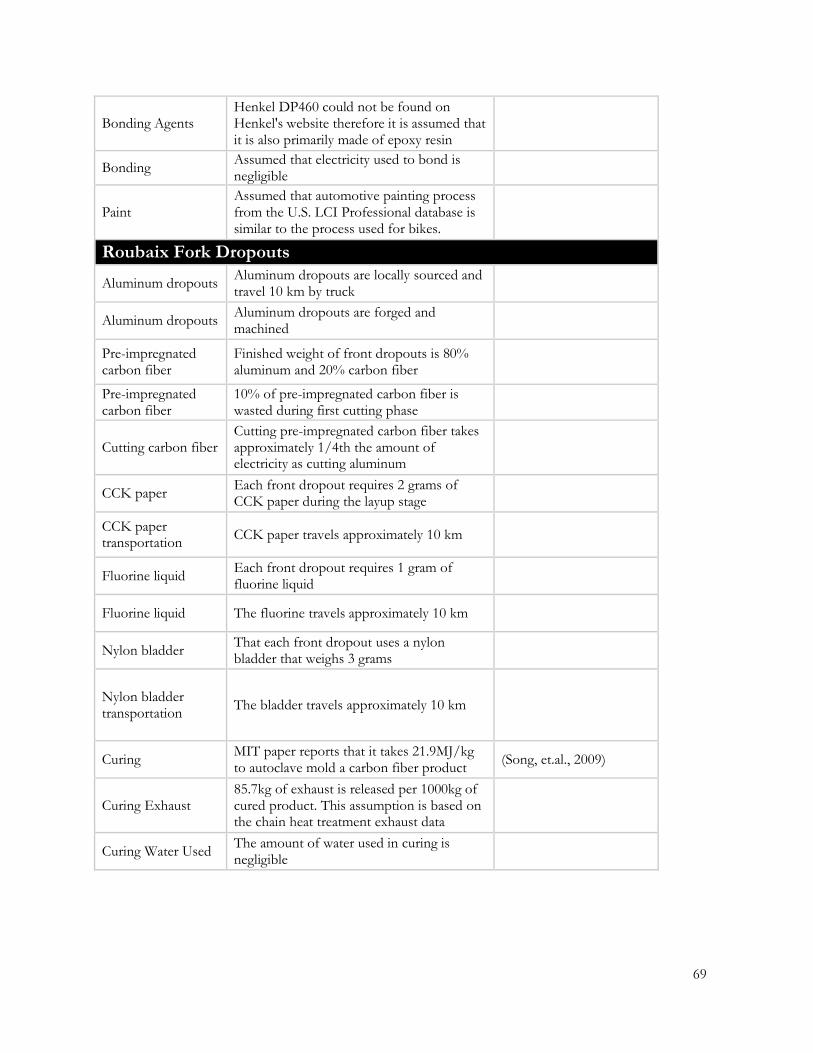
69
Bonding Agents Henkel DP460 could not be found on Henkel's website therefore it is assumed that it is also primarily made of epoxy resin
Bonding Assumed that electricity used to bond is negligible
Paint Assumed that automotive painting process from the U.S. LCI Professional database is similar to the process used for bikes.
Roubaix Fork Dropouts
Aluminum dropouts Aluminum dropouts are locally sourced and travel 10 km by truck
Aluminum dropouts Aluminum dropouts are forged and machined
Pre-impregnated carbon fiber
Finished weight of front dropouts is 80% aluminum and 20% carbon fiber
Pre-impregnated carbon fiber
10% of pre-impregnated carbon fiber is wasted during first cutting phase
Cutting carbon fiber Cutting pre-impregnated carbon fiber takes approximately 1/4th the amount of electricity as cutting aluminum
CCK paper Each front dropout requires 2 grams of CCK paper during the layup stage
CCK paper transportation
CCK paper travels approximately 10 km
Fluorine liquid Each front dropout requires 1 gram of fluorine liquid
Fluorine liquid The fluorine travels approximately 10 km
Nylon bladder That each front dropout uses a nylon bladder that weighs 3 grams
Nylon bladder transportation
The bladder travels approximately 10 km
Curing MIT paper reports that it takes 21.9MJ/kg to autoclave mold a carbon fiber product
(Song, et.al., 2009)
Curing Exhaust 85.7kg of exhaust is released per 1000kg of cured product. This assumption is based on the chain heat treatment exhaust data
Curing Water Used The amount of water used in curing is negligible

70
Cutting cured carbon fiber
A machine similar to Shuz Tung's HT-10-01H (carbon) Circular Saw Cutting Machine for Carbon Tube was used. This demands 1 horsepower and cuts at a rate of 4-6 seconds per piece. Assumed that 2 cuts per frame are made
(Shuz Tung Machinery Industrial Co., LTD, HT-10-01H)
Cutting cured carbon fiber
It takes 0.25kg of water to cut cured carbon fiber dropouts and 5% of this is wasted
Allez Frame
Parts not considered Guide tubing for internal cable routing, Seat clamp, Water bottle bosses, Cable stopper
Aluminum Tubing
Aluminum extrusion Transportation
Aluminum production and extrusion takes place in China and is trucked, shipped, and then trucked to the factory that cuts, butts, bends, and hydroforms the tubes before sending them
Aluminum extrusion Transportation
Finished tubing is shipped from Kaohsium City a distance of 246 km in Taichung.
Cutting process The waste created during this process is negligible
Cutting tubes
The cutting tube machine is similar to the Shuz Tung HT-10-042 cutting machine that uses 1/8 horsepower and can complete one piece in 7 seconds. Only one cut per piece is considered
(Shuz Tung Machinery Industrial Co., LTD, HT-10-042)
Tube butting The butting process is done using a machine similar to the Shuz Tung HT-10-42
(Shuz Tung Machinery Industrial Co., LTD, HT-10-042)
Tube bending
The tube bending machine is similar to the Shuz Tung HT-10-302 Hydraulic Press which demands 7.5 kW and assumed that it takes approximately 15 seconds to create a bend in an aluminum tube
(Shuz Tung Machinery Industrial Co., LTD, HT-10-302)
Tube bending The toptube, downtube, seatstay, and chainstay are bent with one bend per tube
Hydroforming Hydroforming tubes demand a similar amount of electricity as a machine that hydroforms sheet metal
(Fluidforming, 2010)
Hydroforming
Water & oil used in hydroforming is recycled and little is lost during the process. Assumed that 15kg of water is used during the process and 1.5kg of water (10%) is lost
(Fluidforming, 2010)
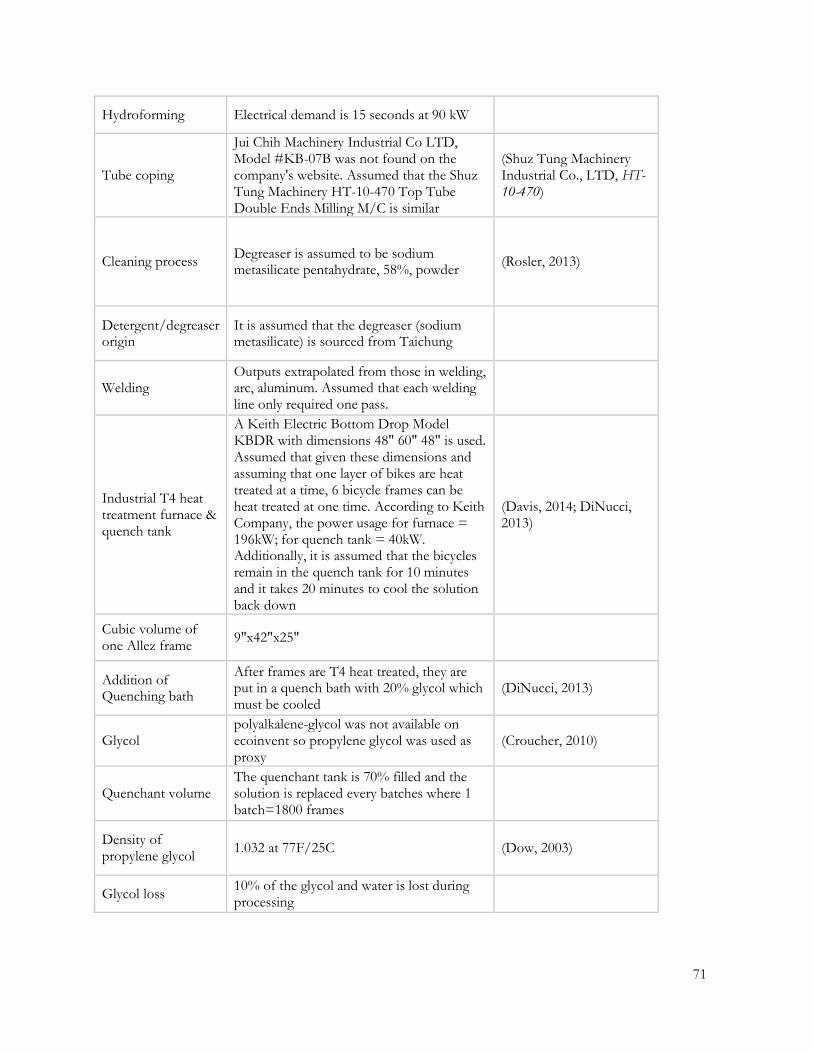
71
Hydroforming Electrical demand is 15 seconds at 90 kW
Tube coping
Jui Chih Machinery Industrial Co LTD, Model #KB-07B was not found on the company's website. Assumed that the Shuz Tung Machinery HT-10-470 Top Tube Double Ends Milling M/C is similar
(Shuz Tung Machinery Industrial Co., LTD, HT-10-470)
Cleaning process Degreaser is assumed to be sodium metasilicate pentahydrate, 58%, powder
(Rosler, 2013)
Detergent/degreaser origin
It is assumed that the degreaser (sodium metasilicate) is sourced from Taichung
Welding Outputs extrapolated from those in welding, arc, aluminum. Assumed that each welding line only required one pass.
Industrial T4 heat treatment furnace & quench tank
A Keith Electric Bottom Drop Model KBDR with dimensions 48" 60" 48" is used. Assumed that given these dimensions and assuming that one layer of bikes are heat treated at a time, 6 bicycle frames can be heat treated at one time. According to Keith Company, the power usage for furnace = 196kW; for quench tank = 40kW. Additionally, it is assumed that the bicycles remain in the quench tank for 10 minutes and it takes 20 minutes to cool the solution back down
(Davis, 2014; DiNucci, 2013)
Cubic volume of one Allez frame
9"x42"x25"
Addition of Quenching bath
After frames are T4 heat treated, they are put in a quench bath with 20% glycol which must be cooled
(DiNucci, 2013)
Glycol polyalkalene-glycol was not available on ecoinvent so propylene glycol was used as proxy
(Croucher, 2010)
Quenchant volume The quenchant tank is 70% filled and the solution is replaced every batches where 1 batch=1800 frames
Density of propylene glycol
1.032 at 77F/25C (Dow, 2003)
Glycol loss 10% of the glycol and water is lost during processing

72
Industrial furnace for artificial aging
The same type of furnace as used for the T4 heat treatment is used for artificial aging
Machining process The machining process requires the same amount of electricity as the tube coping process
Screw machining
Screw-machining process refers to bottom bracket threading. Shuz Tung Machinery makes a BB threading machine that demands 1.6 kW and requires 24 seconds per part
(Shuz Tung Machinery Industrial Co., LTD, HT-50-260)
Phosphate in cleaning process 2
The phosphate cleaner used is similar to Hubbard Hall's Aquaease™ PL 72 A16. Water is not heated. Trisodium phosphate is used to represent the phosphates
(Hubbard Hall, 2009)
Primer The primer used is similar to Sikkens' Autobase Plus RM Special Effect Colour
(Sikkens Creating Together)
Paint The paint used is similar to Sikkens' Autosurfacer Rapid Light Grey
(Sikkens Creating Together)
Clear Coat The clear coat used is similar to Autoclear LV
(Sikkens Creating Together)
Substitution for 4-methylpentan-2-one
2-methylpentane, from naphtha was used as a substitute
Substitution for n-butyl acetate
butyl acetate was substituted
Substitution for 1-methoxy-2-propanol
2-Methoxy-1-propanol
Substitution for naphtha (petroleum), hydrotreated heavy
The naphtha, at regional storage process was used as a substitute
Primer, Paint, and Clear Coat Densities
Densities were used to calculate wasted wet weight. The percentage of solids was the weight of the added dry paint on the frame
Paint curing The oven is set to 130°C according to Y.S. website
(Y.S. Paints, 2003)
Industrial curing ovens - paint
A 4'x6'x8' oven can cure approximately 16 56cm Allez frames
(Industrial Process, 2013)
Industrial curing ovens
The oven used demands approximately 30kW
(Industrial Process, 2013)

73
Exhaust from curing
85.7 kg (as in chain heat treatment) of exhaust is released during one oven usage
BB Guide The BB guide associated with the Roubaix is negligibly different from the Allez BB Guide
Transportation of secondary inputs
All secondary inputs are assumed to be locally sourced and have traveled 15km by truck
Rear Dropouts
Rear dropout
The dropout in the Allez weighs 2 grams less than the Roubaix dropouts since they are not wrapped in carbon fiber (10 grams each)
Rear dropout The rear dropouts are forged and machined aluminum
Bottom Bracket
Bottom Bracket The bottom bracket weighs approximately 128 grams.
Bottom Bracket The bottom bracket is a plain aluminum tube
Aluminum extrusion Transportation
The aluminum production and extrusion takes place in China and is trucked, shipped, and then trucked to the factory that cuts, butts, bends, and hydroforms the tubes
Aluminum extrusion Transportation
The extrusion takes place near Shenzhen and truck transportation between factory and Hong Kong port is negligible
Aluminum extrusion Transportation
The aluminum is shipped from Hong Kong to Kaohsiung City, Taiwan ports and travels a distance of 342 nautical miles. Then, these unfinished tubes are assumed to be shipped 100 km to where they are cut, butted, bent, and hydroformed
(Sea-Distances, 2014)
Aluminum extrusion Transportation
Finished tubing is shipped from Kaohsium City a distance of 246 km

74
Seat stay bridge
Seat stay bridge The bottom bracket weighs approximately 43 grams.
Seat stay bridge The seat stay bridge is forged and machined aluminum
Aluminum extrusion Transportation
Aluminum production and extrusion takes place in China and is trucked, shipped, and then trucked to the factory that cuts, butts, bends, and hydroforms the tubes
Aluminum extrusion Transportation
Extrusion takes place near Shenzhen and truck transportation between factory and Hong Kong port is negligible
Aluminum extrusion Transportation
Aluminum is shipped from Hong Kong to Kaohsiung City, Taiwan ports and travels a distance of 342 nautical miles. Then, these unfinished tubes are assumed to be shipped 100 km to where they are cut, butted, bent, and hydroformed
(Sea-Distances, 2014)
Aluminum extrusion Transportation
Finished tubing is shipped from Kaohsium City a distance of 246 km
Allez Carbon Fork
Front dropouts Dropouts weigh the same amount as those received for the Roubaix fork
Cutting carbon fiber Cutting pre-impregnated carbon fiber takes approximately 1/4th the amount of electricity as cutting aluminum
CCK paper transportation
CCK paper travels approximately 10 km
Nylon bladder The production of nylon 6 is considered, but not the manufacturing of the actual bladder
Nylon bladder transportation
The bladder travels approximately 10 km
Fluorine liquid The fluorine travels approximately 10 km
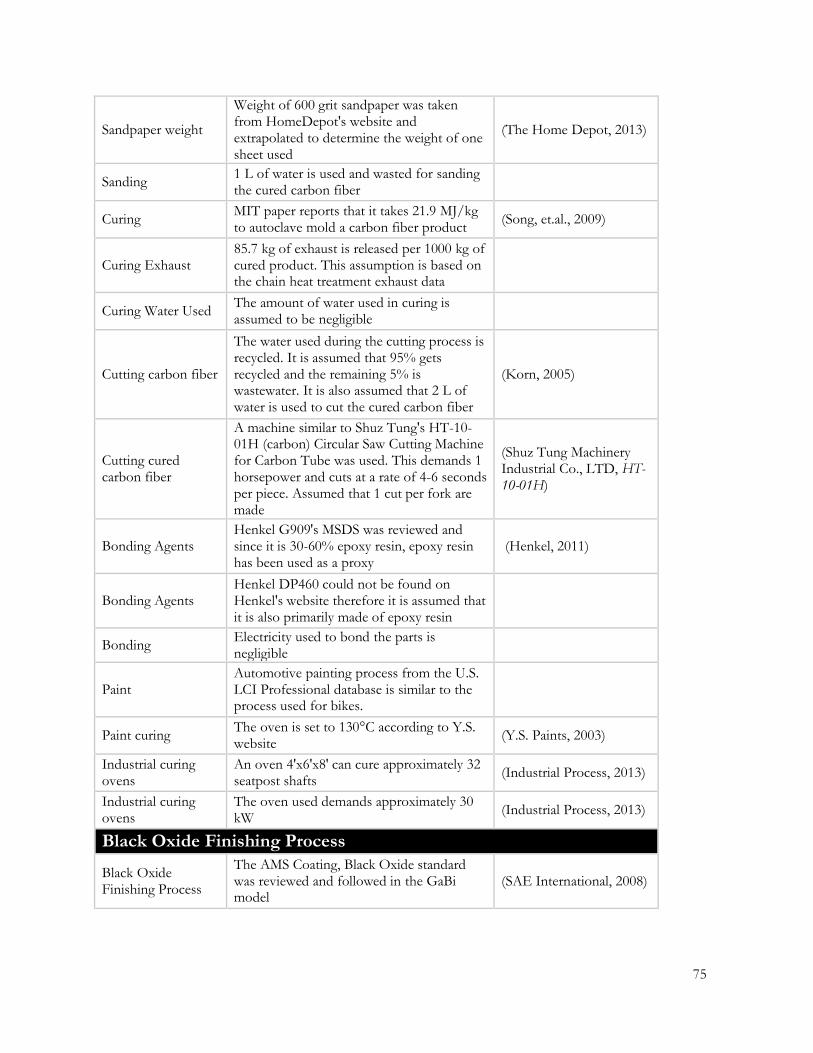
75
Sandpaper weight
Weight of 600 grit sandpaper was taken from HomeDepot's website and extrapolated to determine the weight of one sheet used
(The Home Depot, 2013)
Sanding 1 L of water is used and wasted for sanding the cured carbon fiber
Curing MIT paper reports that it takes 21.9 MJ/kg to autoclave mold a carbon fiber product
(Song, et.al., 2009)
Curing Exhaust 85.7 kg of exhaust is released per 1000 kg of cured product. This assumption is based on the chain heat treatment exhaust data
Curing Water Used The amount of water used in curing is assumed to be negligible
Cutting carbon fiber
The water used during the cutting process is recycled. It is assumed that 95% gets recycled and the remaining 5% is wastewater. It is also assumed that 2 L of water is used to cut the cured carbon fiber
(Korn, 2005)
Cutting cured carbon fiber
A machine similar to Shuz Tung's HT-10-01H (carbon) Circular Saw Cutting Machine for Carbon Tube was used. This demands 1 horsepower and cuts at a rate of 4-6 seconds per piece. Assumed that 1 cut per fork are made
(Shuz Tung Machinery Industrial Co., LTD, HT-10-01H)
Bonding Agents Henkel G909's MSDS was reviewed and since it is 30-60% epoxy resin, epoxy resin has been used as a proxy
(Henkel, 2011)
Bonding Agents Henkel DP460 could not be found on Henkel's website therefore it is assumed that it is also primarily made of epoxy resin
Bonding Electricity used to bond the parts is negligible
Paint Automotive painting process from the U.S. LCI Professional database is similar to the process used for bikes.
Paint curing The oven is set to 130°C according to Y.S. website
(Y.S. Paints, 2003)
Industrial curing ovens
An oven 4'x6'x8' can cure approximately 32 seatpost shafts
(Industrial Process, 2013)
Industrial curing ovens
The oven used demands approximately 30 kW
(Industrial Process, 2013)
Black Oxide Finishing Process
Black Oxide Finishing Process
The AMS Coating, Black Oxide standard was reviewed and followed in the GaBi model
(SAE International, 2008)

76
Step 1: Washing
The part must be washed first, but not dried. The wash cycle from washing the inner plates was used. However, since the product is not being dried, 25% of the electricity used in the wash & dry cycle for inner plates was only considered
Step 2: submerge in chemicals
A mix similar to Du-Lite Steelkote is used (Du-Lite, 2013)
Step 2: submerge in chemicals
The product takes 30 minutes at 280°F to coat the product
(Du-Lite)
Step 2: submerge in chemicals
Ratio of water to kg of product assumed to be the same as in inner plate washing cycle
Step 2: submerge in chemicals
The water is initially at room temperature (70°F) before heated to 280°F and therefore it takes 210 Btus to heat 1 pound of water
Step 2: submerge in chemicals
10% of solution is wasted
Step 2: submerge in chemicals
The water is not recycled (Du-Lite)
Step 3: Oil
Kwikseal is used as the final oil stage. GLO: solvents, organic, unspecified, at plant [organics] is used as a proxy for the hydrocarbons
(Du-Lite, 2013)
Step 3: Oil 185 kg of Kwikseal is needed to coat 250 kg of product
Step 3: Oil 10%, in the form of hydrocarbons emitted to fresh water, of oil is wasted through normal use
(Du-Lite)
Wheels
Transportation of anodizing chemicals
Wrapped up in ecoinvent anodizing process and therefore transportation of chemicals are not directly considered
Rim
Pins for Rim
Transportation 186 km between Taichung and Tainan was determined by using Google Maps
Spoke
Steel wire Stainless steel wire was not available on the ecoinvent database, so regular steel wire was used
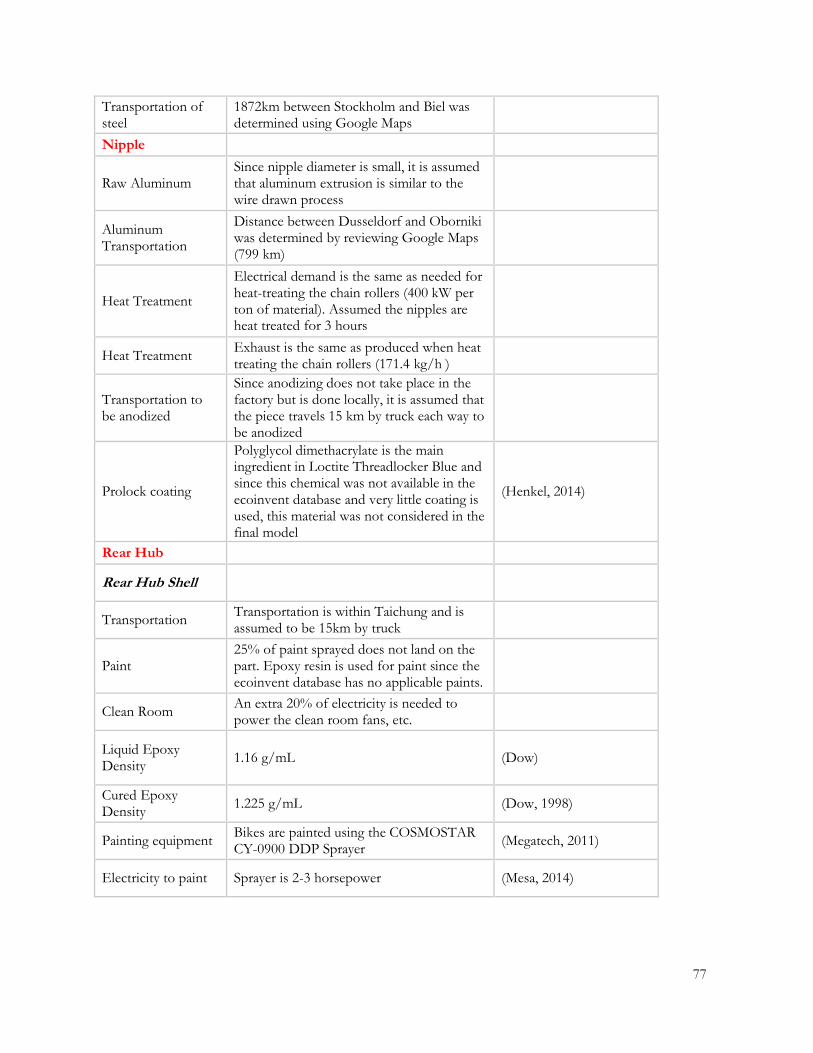
77
Transportation of steel
1872km between Stockholm and Biel was determined using Google Maps
Nipple
Raw Aluminum Since nipple diameter is small, it is assumed that aluminum extrusion is similar to the wire drawn process
Aluminum Transportation
Distance between Dusseldorf and Oborniki was determined by reviewing Google Maps (799 km)
Heat Treatment
Electrical demand is the same as needed for heat-treating the chain rollers (400 kW per ton of material). Assumed the nipples are heat treated for 3 hours
Heat Treatment Exhaust is the same as produced when heat treating the chain rollers (171.4 kg/h )
Transportation to be anodized
Since anodizing does not take place in the factory but is done locally, it is assumed that the piece travels 15 km by truck each way to be anodized
Prolock coating
Polyglycol dimethacrylate is the main ingredient in Loctite Threadlocker Blue and since this chemical was not available in the ecoinvent database and very little coating is used, this material was not considered in the final model
(Henkel, 2014)
Rear Hub
Rear Hub Shell
Transportation Transportation is within Taichung and is assumed to be 15km by truck
Paint 25% of paint sprayed does not land on the part. Epoxy resin is used for paint since the ecoinvent database has no applicable paints.
Clean Room An extra 20% of electricity is needed to power the clean room fans, etc.
Liquid Epoxy Density
1.16 g/mL (Dow)
Cured Epoxy Density
1.225 g/mL (Dow, 1998)
Painting equipment Bikes are painted using the COSMOSTAR CY-0900 DDP Sprayer
(Megatech, 2011)
Electricity to paint Sprayer is 2-3 horsepower (Mesa, 2014)

78
Rear Hub Axle
Transportation Transportation is all within Taichung and is assumed to be 15km by truck
Rotor Body
Forging
Forged aluminum was bought for producing the rotor body. It is assumed that the ecoinvent aggregated process RER: aluminium product manufacturing, average metal working is sufficient for representing aluminum being forged
Transportation Transportation is all within Taichung and is assumed to be 15km by truck
Rotor Spacer
Transportation Transportation is all within Taichung and is assumed to be 15km by truck
Rotor Insert
Transportation 186 km between Taichung and Tainan was determined by using Google Maps
Transportation to be anodized
Since anodizing does not take place in the factory but is done locally, it is assumed that the piece travels 15 km by truck each way to be anodized
Heat Treatment Electrical demand is the same as needed for heat-treating the chain rollers (400 kW per ton of material).
Heat Treatment Exhaust is the same as produced when heat-treating the chain rollers (171.4kg/h).
Ring Nut
Heat Treatment Heat treatment is two hours
Heat Treatment Electrical demand is the same as needed for heat treating the chain rollers (400 kW per ton of material)
Heat Treatment Exhaust is the same as produced when heat-treating the chain rollers (171.4 kg/h).
Transportation 186 km between Taichung and Tainan was determined by using Google Maps
Spacer
Transportation 186 km between Taichung and Tainan was determined by using Google Maps
Adaptor
Transportation of extruded aluminum
15 km by truck since it is sourced within Taichung
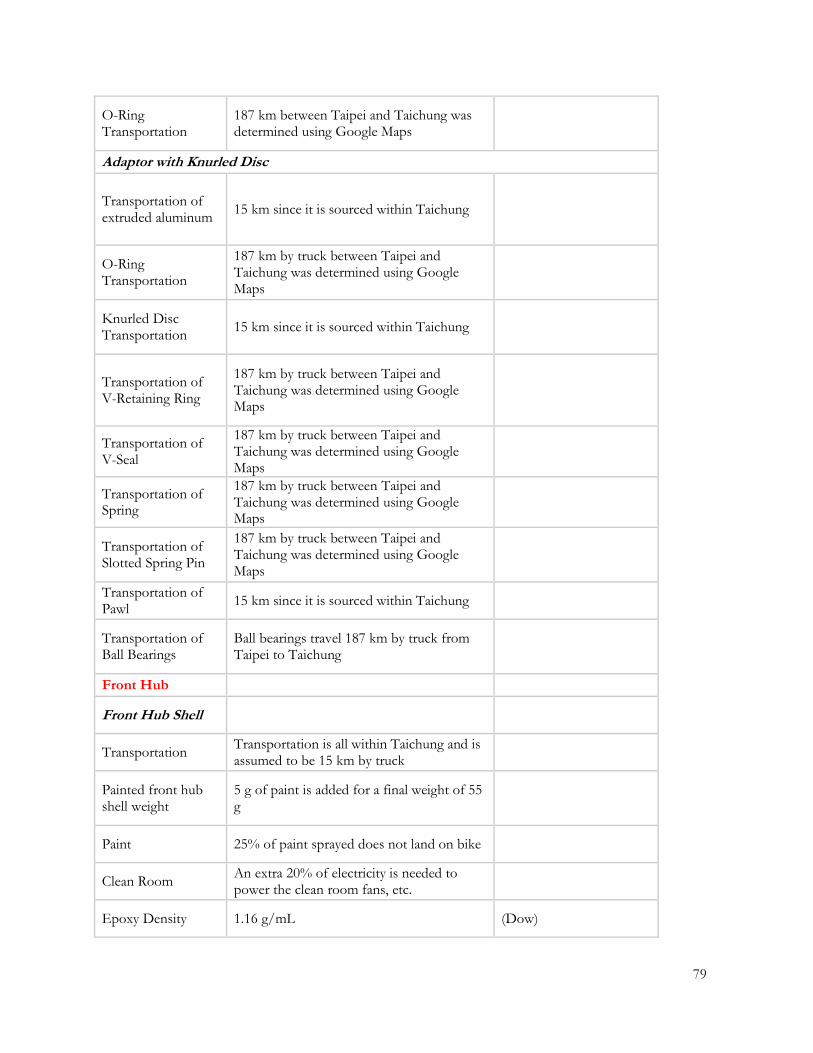
79
O-Ring Transportation
187 km between Taipei and Taichung was determined using Google Maps
Adaptor with Knurled Disc
Transportation of extruded aluminum
15 km since it is sourced within Taichung
O-Ring Transportation
187 km by truck between Taipei and Taichung was determined using Google Maps
Knurled Disc Transportation
15 km since it is sourced within Taichung
Transportation of V-Retaining Ring
187 km by truck between Taipei and Taichung was determined using Google Maps
Transportation of V-Seal
187 km by truck between Taipei and Taichung was determined using Google Maps
Transportation of Spring
187 km by truck between Taipei and Taichung was determined using Google Maps
Transportation of Slotted Spring Pin
187 km by truck between Taipei and Taichung was determined using Google Maps
Transportation of Pawl
15 km since it is sourced within Taichung
Transportation of Ball Bearings
Ball bearings travel 187 km by truck from Taipei to Taichung
Front Hub
Front Hub Shell
Transportation Transportation is all within Taichung and is assumed to be 15 km by truck
Painted front hub shell weight
5 g of paint is added for a final weight of 55 g
Paint 25% of paint sprayed does not land on bike
Clean Room An extra 20% of electricity is needed to power the clean room fans, etc.
Epoxy Density 1.16 g/mL (Dow)

80
Painting equipment Bikes are painted using the COSMOSTAR CY-0900 DDP Sprayer
(Megatech, 2011)
Electricity to paint Sprayer is 2-3 horsepower (Mesa, 2014)
Front Hub Axle
Transportation 15 km by truck since it is sourced within Taichung
Adaptor
Transportation of extruded aluminum
15 km by truck since it is sourced within Taichung
O-Ring Transportation
187 km by truck between Taipei and Taichung was determined using Google Maps
Transportation of Ball Bearings
Ball bearings travel 187 km by truck from Taipei to Taichung
Front Wheel Assembly
Rim Transportation 186 km by truck between Taichung and Tainan was determined by using Google Maps
Nipple Transportation
554 km by truck from Oberniki to Hamburg; 10162 nautical miles between Hamburg and Kaohsiung; 246 km between Kaohsiung and Taichung
Spoke Transportation
630 km by truck from Biel to Antwerpen, 9914 nautical miles between Antwerpen and Kaohsiung; 246 km between Kaohsiung and Taichung
Front Hub Transportation
15 km by truck since it is sourced within Taichung
PVC decals Travels approximately 15 km
Front Wheel Assembly
Rim Transportation 186 km by truck between Taichung and Tainan was determined by using Google Maps
Nipple Transportation
554 km by truck from Oberniki to Hamburg; 10162 nautical miles between Hamburg and Kaohsiung; 246 km between Kaohsiung and Taichung
Spoke Transportation
630 km by truck from Biel to Antwerpen, 9914 nautical miles between Antwerpen and Kaohsiung; 246 km between Kaohsiung and Taichung
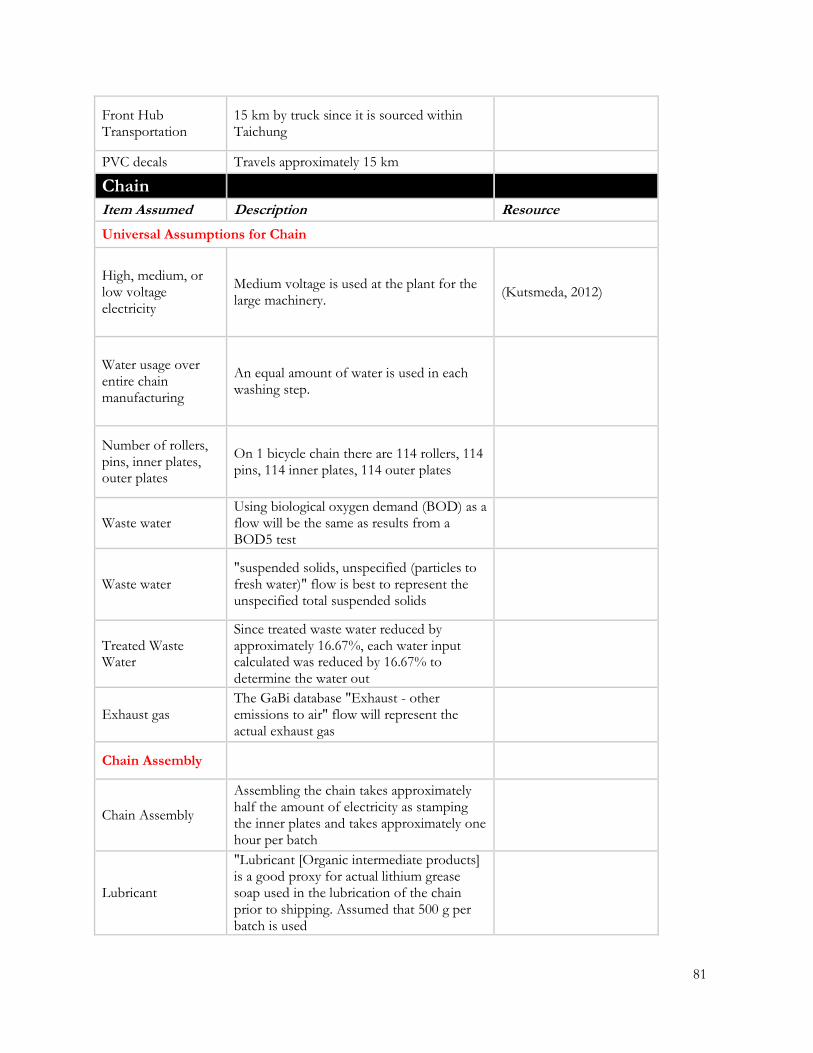
81
Front Hub Transportation
15 km by truck since it is sourced within Taichung
PVC decals Travels approximately 15 km
Chain
Item Assumed Description Resource
Universal Assumptions for Chain
High, medium, or low voltage electricity
Medium voltage is used at the plant for the large machinery.
(Kutsmeda, 2012)
Water usage over entire chain manufacturing
An equal amount of water is used in each washing step.
Number of rollers, pins, inner plates, outer plates
On 1 bicycle chain there are 114 rollers, 114 pins, 114 inner plates, 114 outer plates
Waste water Using biological oxygen demand (BOD) as a flow will be the same as results from a BOD5 test
Waste water "suspended solids, unspecified (particles to fresh water)" flow is best to represent the unspecified total suspended solids
Treated Waste Water
Since treated waste water reduced by approximately 16.67%, each water input calculated was reduced by 16.67% to determine the water out
Exhaust gas The GaBi database "Exhaust - other emissions to air" flow will represent the actual exhaust gas
Chain Assembly
Chain Assembly
Assembling the chain takes approximately half the amount of electricity as stamping the inner plates and takes approximately one hour per batch
Lubricant
"Lubricant [Organic intermediate products] is a good proxy for actual lithium grease soap used in the lubrication of the chain prior to shipping. Assumed that 500 g per batch is used

82
Lubricant It takes half the amount of electricity to lubricate as it does to assemble the chain
Lubricant Transportation assumed to be from Kaiserslautern, Germany (Fuchs Libritech) to Coimbra, Portugal (SRAM Portugal)
Steel Manufacturing & Transportation
Type of steel used for inner plate
C27 steel is a low- or un-alloy steel (Steel Data, 2010)
Type of steel used for outer plate
C35 steel is a low- or un-alloy steel (Steel Data, 2010)
Rolled steel input
RER: Sheet rolling, steel (aggregated process) is assumed to represent that manufacturing of sheet rolled steel (includes raw material extraction)
Transportation of sheet metal
Transportation of rolled sheet metal from Austria to Coimbra is over Single unit truck that is diesel powered
Transportation of sheet metal
A route that covers 2640 km is used
Corrosion Inhibitor Manufacturing & Transportation
Corrosion Inhibitor
Corrosion Inhibitor is shipped by truck from Laudos, Portugal to Coimbra, Portugal (from Quimidois to SRAM Portugal). A distance of 155 km was determined using Google Maps
Abrasive Manufacturing & Transportation
Abrasive
The abrasive comes from Pechiney in Valadares, Portugal as indicated on the footnote of the SDS. Google Maps was used to determine a distance of 117km
Rollers
Roller manufacturing
Rollers are made through extrusion
Roller manufacturing
Follows the same process as the pin for heating, washing etc.; electricity medium voltage PET
Transportation for rollers to Portugal
Using "OCE transport, transoceanic freight ship" as a proxy. Distance of 10100 nautical miles was determined by using this website and assuming that the freighter went through the Suez canal
(Sea-Distance, 2014)
Transportation for rollers to Portugal
The most direct route is taken using a single unit diesel truck to go from the port in Rotterdam to Coimbra. A distance of 2020 km was determined using Google Maps.
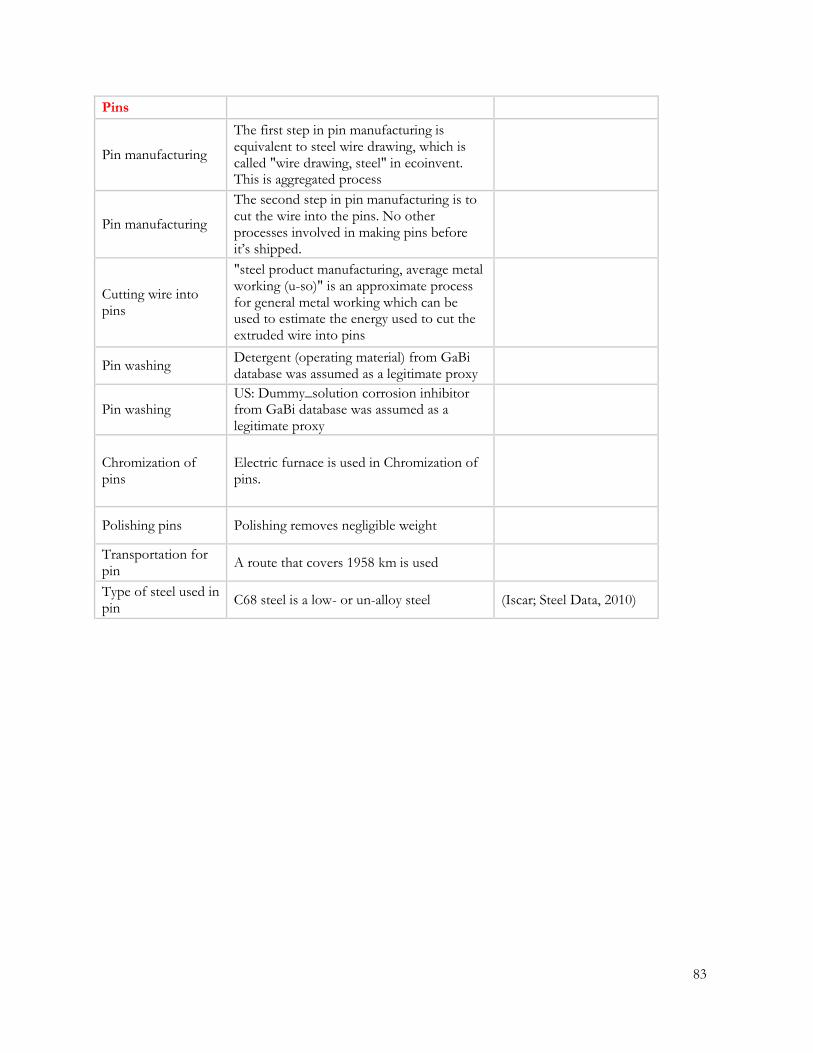
83
Pins
Pin manufacturing
The first step in pin manufacturing is equivalent to steel wire drawing, which is called "wire drawing, steel" in ecoinvent. This is aggregated process
Pin manufacturing
The second step in pin manufacturing is to cut the wire into the pins. No other processes involved in making pins before it’s shipped.
Cutting wire into pins
"steel product manufacturing, average metal working (u-so)" is an approximate process for general metal working which can be used to estimate the energy used to cut the extruded wire into pins
Pin washing Detergent (operating material) from GaBi database was assumed as a legitimate proxy
Pin washing US: Dummy_solution corrosion inhibitor from GaBi database was assumed as a legitimate proxy
Chromization of pins
Electric furnace is used in Chromization of pins.
Polishing pins Polishing removes negligible weight
Transportation for pin
A route that covers 1958 km is used
Type of steel used in pin
C68 steel is a low- or un-alloy steel (Iscar; Steel Data, 2010)

84
Appendix 4: Full Index Assessment
Brand Module
Section Description Actual
Score
Possible
Score
GEN-B-1.1
Brand has established internal metrics to hold product team(s) accountable for
sustainability performance and continuous improvement.
Example: Product team sets goal for the number of products evaluated with The Higg
Index per year.
0 40
GEN-B-2.1.1 Brand provides direct assistance (training, coaching, field teams, etc.) to its suppliers
[facilities] on reducing environmental impacts related to materials and components
(raw material and textile finishing) and related processes
0 10
GEN-B-2.1.2 Brand provides direct assistance (training, coaching, field teams, etc.) to its suppliers
[facilities] on reducing environmental impacts related to packaging (raw materials) and
related processes
10 10
GEN-B-2.1.3 Brand provides direct assistance (training, coaching, field teams, etc.) to its suppliers
[facilities] on reducing environmental impacts related to manufacturing (assembly) and
related processes
0 10
GEN-B-3.1.1 Brand has an updated list of Tier 1 suppliers [facilities] that it contracts with (directly
or indirectly). This list may include the name of brand, facility ID, facility location/
address, a contact person, and what product or material is supplied.
6 6
GEN-B-3.1.2
Brand has an updated list of Tier 2 (raw material and trim suppliers + subcontracted
processes) suppliers [facilities] that it contracts with (directly or indirectly). This list
may include the name of brand, facility ID, facility location/ address, a contact person,
and what product or material is supplied.
6 14
GEN-B-4.1.1
Company has a program aimed at reducing the environmental impacts of product
sampling. Specifically, the program/initiative includes a policy/operating strategy
outlining the overarching goal of understanding and reducing environmental impact
from Sampling.
0 2
GEN-B-4.1.2 Company has a program aimed at reducing the environmental impacts of product
sampling. Specifically, the program/initiative includes the tracking, measuring, and
documenting of Sampling environmental impacts.
0 2
GEN-B-4.1.3 Company has a program aimed at reducing the environmental impacts of product
sampling. Specifically, the program/initiative includes the setting of targets and goals
to reduce the Sampling environmental impacts.
0 2
GEN-B-4.1.4
Company has a program aimed at reducing the environmental impacts of product
sampling. Specifically, the program/initiative includes publicly reporting – at least
annually – on the program/initiative’s Sampling environmental impacts and the
progress against the targets and goals.
0 2
GEN-B-4.1.5 Company has a program aimed at reducing the environmental impacts of product
sampling. Specifically, the program/initiative includes independent 3rd party
verification of these efforts (at least every two years).
0 2
MAT-B-1.1.1
Brand has a program aimed at understanding and reducing the Materials
environmental impacts (from the production and finishing of materials and trims) of
its products. Specifically, the program/initiative includes a policy/operating strategy
outlining the overarching goal of understanding and reducing environmental impact
from Materials.
6 6
MAT-B-1.1.2
Brand has a program aimed at understanding and reducing the Materials
environmental impacts (from the production and finishing of materials and trims) of
its products. Specifically, the program/initiative includes the tracking, measuring, and
documenting of Materials environmental impacts. This must include a portfolio of all
major materials used to build equipment products and an evaluation of their
environmental impacts.
0 6

85
MAT-B-1.1.3
Brand has a program aimed at understanding and reducing the Materials
environmental impacts (from the production and finishing of materials and trims) of
its products. Specifically, the program/initiative includes the setting of targets and
goals to reduce those Materials environmental impacts.
0 6
MAT-B-1.1.4
Brand has a program aimed at understanding and reducing the Materials
environmental impacts (from the production and finishing of materials and trims) of
its products. Specifically, the program/initiative includes publicly reporting – at least
annually – on the program/initiative’s Materials environmental impacts and the
progress against the targets and goals.
0 6
MAT-B-1.1.5
Brand has a program aimed at understanding and reducing the Materials
environmental impacts (from the production and finishing of materials and trims) of
its products. Specifically, the program/initiative includes independent 3rd party
verification of these efforts (at least every two years).
0 6
MAT-B-2.1
Brand has written Restricted Substance List (RSL) or has adopted an industry-accepted
standard RSL. The RSL reflects the strictest regulations of all countries/markets in
which the brand operates and sells products (e.g., regulations in manufacturing,
marketing, or sales location).
3 3
MAT-B-2.2 RSL is based on the most stringent global regulations. (Note: If the brand already
operates in the markets with the most stringent global regulations, a “Yes” answer to
MAT-B-2.1 would also apply here)
3 3
MAT-B-2.3 RSL based on voluntary standards/limits of chemicals of concern beyond regulations
(using the Precautionary Principle and sound science).
[Note: Requires a “Yes” response to MAT-B-2.1 and MAT-B-2.2 to score]
3 3
MAT-B-2.4 Brand makes RSL (content, procedures, etc., but not results) publicly available and
easily accessible. 0 3
MAT-B-2.5 Brand has an Input Stream Management program that complements (but does not
replace) its Restricted Substance List (RSL) and RSL testing. 3 3
MAT-B-3.1
Select which statement applies to your brand’s Restricted Substance List (RSL)
verification and certification requirements:
- No (or unknown) RSL verification or certification requirements(0)
- Brand requires suppliers to demonstrate adherence to the RSL through self-
declaration or by inclusion of RSL compliance requirements in supplier
contracts/agreements(2)
- Brand requires suppliers to demonstrate adherence to the RSL through independent,
certified 3rd-party lab testing and has a documented standard operating procedure that
is communicated to the supplier(20)
- Unknown(0)
20 20
MAT-B-4.1
Brand has program/policy/operating strategy to engage with suppliers to reduce
chemical impacts beyond RSL compliance; at a minimum, guidance to suppliers:
• Includes how to identify and/or prioritize chemicals for elimination AND how to
evaluate alternatives
OR
• Cites an industry-accepted chemical risk (hazard + exposure) assessment tool
• Green input chemistry is included
0 9
MAT-B-4.2 Brand requires or rewards suppliers who participate in a credible chemical impact
reduction management program (“green chemistry program”). 0 3
MAT-B-4.3 Brand targets a prioritized set of materials from its full portfolio and is working with
the suppliers to evaluate sourcing options and material innovation as it relates to
“green chemistry”.
0 3
MAT-B-5.1 Brand has policy/strategy and standard operating procedure for verification of
material durability (for intended end use) as part of the material selection and approval
process.
10 10
MAT-B-5.2 Brand has policy/strategy and standard operating procedure for verification of
material RSL compliance (in accordance with your company’s Restricted Substance
List testing requirements) as part of the material selection and approval process.
10 10

86
PKG-B-1.1.1
Brand has a program aimed at understanding and reducing the Packaging
environmental impacts of its products. Specifically, the program/initiative includes a
policy/operating strategy outlining the overarching goal of understanding and reducing
environmental impact from Packaging.
3 3
PKG-B-1.1.2 Brand has a program aimed at understanding and reducing the Packaging
environmental impacts of its products. Specifically, the program/initiative includes the
tracking, measuring, and documenting of Packaging environmental impacts.
3 3
PKG-B-1.1.3 Brand has a program aimed at understanding and reducing the Packaging
environmental impacts of its products. Specifically, the program/initiative includes the
setting of targets and goals to reduce those Packaging environmental impacts.
3 3
PKG-B-1.1.4
Brand has a program aimed at understanding and reducing the Packaging
environmental impacts of its products. Specifically, the program/initiative includes
Publicly reporting – at least annually – on the program/initiative’s Packaging
environmental impacts and the progress against the targets and goals.
0 3
PKG-B-1.1.5 Brand has a program aimed at understanding and reducing the Packaging
environmental impacts of its products. Specifically, the program/initiative includes
independent 3rd party verification of these efforts (at least every two years)
0 3
PKG-B-2.1 Brand has a PRSL based on applicable regulations; AND PRSL requirements are
applied within the brand and its supply chain (e.g. packaging specifications, supplier
guidelines).
2 2
PKG-B-2.2
Brand requires packaging suppliers to provide certification and supporting
documentation (i.e., test results report) that packaging is compliant with the brand’s
PRSL; AND brand has a materials portfolio listing all materials included in a
component of packaging.
2 2
PKG-B-2.3 Brand’s PRSL is based on industry best practices that exceed applicable regulations;
AND brand conducts regular monitoring and verification that packaging complies
with the brand’s PRSL.
4 4
PKG-B-2.4 Brand makes Packaging Restricted Substance List (PRSL) publicly available and easily
accessible. 0 2
PKG-B-3.1
Brand employs packaging design and construction techniques to guide/reward
reductions in the weight AND volume of the packaging, including using less materials
and/or lighter materials—while still maintaining packaging functionality—with
different types of packaging AND requires any reductions be documented.
These efforts should focus on the full spectrum of packaging:
• Primary: weight and volume (product-to-packaging ratio)
• Secondary: weight and volume (cube efficiency)
• Tertiary: pallet/container optimization (covered in transportation)
6 6
PKG-B-3.2 Brand employs packaging design and construction techniques to guide/reward the use
of fewer adhesives, labels, foils, inks, colorants, fasteners, seals, liners, laminates,
waxes, coatings, etc. AND requires any reductions be documented.
6 6
PKG-B-3.3
Brand has a written policy/strategy/operating procedure to minimize the practice of
completely changing packaging for already packaged products.
The policy/strategy/operating procedure must require these practices:
• The brand employs “rolling changeovers” where the same product is
allowed to be in multiple packaging designs until previous/obsolete packaging
inventory is depleted
• If packaging changes do occur, the brand reports on the environmental
impact of the change, including disposition of obsolete packaging inventory (i.e., not
product packaging already in points of purchase)
3 3
PKG-B-4.1 Brand employs packaging design and construction techniques to create recyclable
packaging, while still maintaining packaging functionality. 15 15
MFG-B-1.1.1
Brand has a program aimed at understanding and reducing the Manufacturing
environmental impacts of its products. Specifically, the program/initiative includes a
policy/operating strategy/program outlining the overarching goal of understanding
and reducing environmental impact from Manufacturing.
0 7
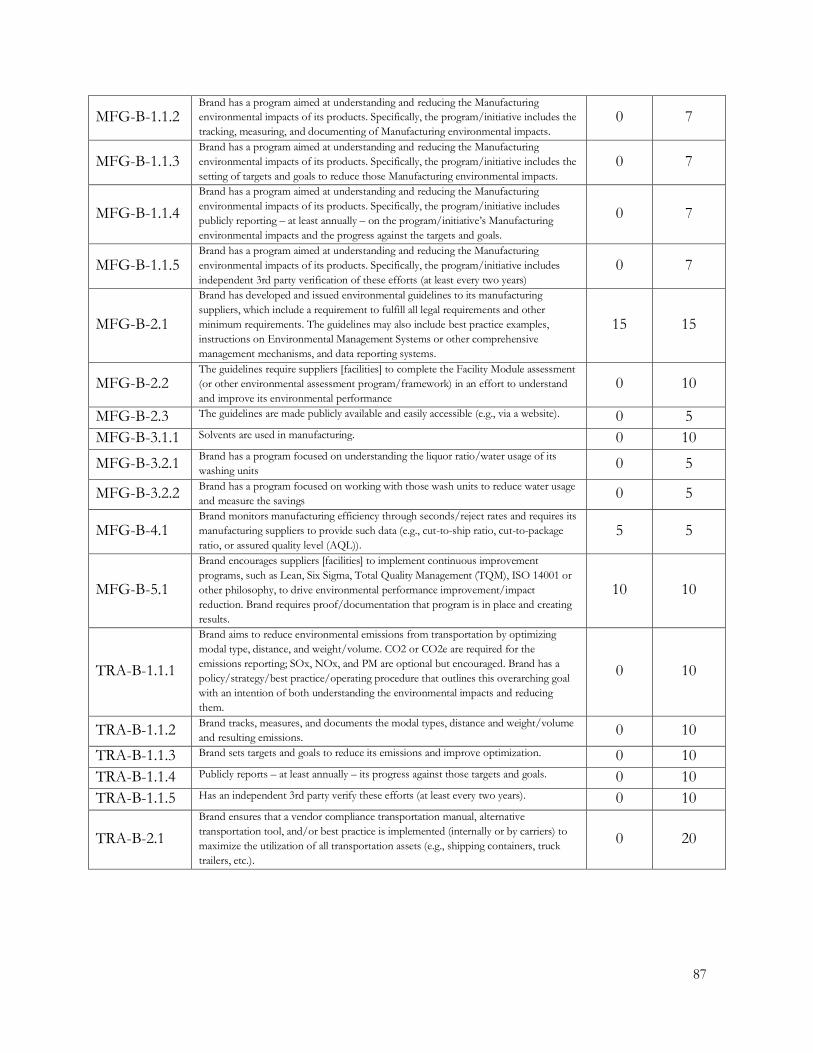
87
MFG-B-1.1.2 Brand has a program aimed at understanding and reducing the Manufacturing
environmental impacts of its products. Specifically, the program/initiative includes the
tracking, measuring, and documenting of Manufacturing environmental impacts.
0 7
MFG-B-1.1.3 Brand has a program aimed at understanding and reducing the Manufacturing
environmental impacts of its products. Specifically, the program/initiative includes the
setting of targets and goals to reduce those Manufacturing environmental impacts.
0 7
MFG-B-1.1.4
Brand has a program aimed at understanding and reducing the Manufacturing
environmental impacts of its products. Specifically, the program/initiative includes
publicly reporting – at least annually – on the program/initiative’s Manufacturing
environmental impacts and the progress against the targets and goals.
0 7
MFG-B-1.1.5 Brand has a program aimed at understanding and reducing the Manufacturing
environmental impacts of its products. Specifically, the program/initiative includes
independent 3rd party verification of these efforts (at least every two years)
0 7
MFG-B-2.1
Brand has developed and issued environmental guidelines to its manufacturing
suppliers, which include a requirement to fulfill all legal requirements and other
minimum requirements. The guidelines may also include best practice examples,
instructions on Environmental Management Systems or other comprehensive
management mechanisms, and data reporting systems.
15 15
MFG-B-2.2 The guidelines require suppliers [facilities] to complete the Facility Module assessment
(or other environmental assessment program/framework) in an effort to understand
and improve its environmental performance
0 10
MFG-B-2.3 The guidelines are made publicly available and easily accessible (e.g., via a website). 0 5
MFG-B-3.1.1 Solvents are used in manufacturing. 0 10
MFG-B-3.2.1 Brand has a program focused on understanding the liquor ratio/water usage of its
washing units 0 5
MFG-B-3.2.2 Brand has a program focused on working with those wash units to reduce water usage
and measure the savings 0 5
MFG-B-4.1 Brand monitors manufacturing efficiency through seconds/reject rates and requires its
manufacturing suppliers to provide such data (e.g., cut-to-ship ratio, cut-to-package
ratio, or assured quality level (AQL)).
5 5
MFG-B-5.1
Brand encourages suppliers [facilities] to implement continuous improvement
programs, such as Lean, Six Sigma, Total Quality Management (TQM), ISO 14001 or
other philosophy, to drive environmental performance improvement/impact
reduction. Brand requires proof/documentation that program is in place and creating
results.
10 10
TRA-B-1.1.1
Brand aims to reduce environmental emissions from transportation by optimizing
modal type, distance, and weight/volume. CO2 or CO2e are required for the
emissions reporting; SOx, NOx, and PM are optional but encouraged. Brand has a
policy/strategy/best practice/operating procedure that outlines this overarching goal
with an intention of both understanding the environmental impacts and reducing
them.
0 10
TRA-B-1.1.2 Brand tracks, measures, and documents the modal types, distance and weight/volume
and resulting emissions. 0 10
TRA-B-1.1.3 Brand sets targets and goals to reduce its emissions and improve optimization. 0 10
TRA-B-1.1.4 Publicly reports – at least annually – its progress against those targets and goals. 0 10
TRA-B-1.1.5 Has an independent 3rd party verify these efforts (at least every two years). 0 10
TRA-B-2.1
Brand ensures that a vendor compliance transportation manual, alternative
transportation tool, and/or best practice is implemented (internally or by carriers) to
maximize the utilization of all transportation assets (e.g., shipping containers, truck
trailers, etc.).
0 20

88
TRA-B-3.1
Are 5 or more of these considerations included?
Brand engages contract carriers [or internal fleet] on environmental improvement (via
development discussions, sourcing criteria, contract/request-for-proposal
requirements, etc.) that specifically include at least five (5) of the following
considerations:
• Annual emissions reports for CO2 or CO2e (required), SOx, NOx, and PM (1 of 3
required); emissions are provided per modal type and per unit of distance
• Public reporting of annual emission reports
• Optimized routing dynamics designed to reduce environmental impacts;
• Origin consolidation programs to minimize less-than-container load and less-than-
truckload shipments;
• Alignment of inbound and outbound freight to reduce empty miles;
• ISO 14001, European Eco-Management and Audit Scheme, or similar third-party
certified environmental management systems; or
• Responsible recycling and/or disposal of decommissioned assets.
• Slow-steaming vessels on all major lanes
0 15
TRA-B-3.2
Carrier Environmental Reduction Programs
Brand engages contract carriers [or internal fleet] on environmental improvement (via
development discussions, sourcing criteria, contract/request-for-proposal
requirements, etc.) that entails participation in environmental impact reduction
programs that range from local/regional to international.
0 5
TRA-B-4.1 Brand employs an operating program or model that gives priority to sourcing
timelines/processes in alignment with the most environmentally efficient
transportation modes (all of which are slower than air) to be utilized.
0 5
TRA-B-4.2 Do you track, monitor, and report on air freighting? 0 5
USE-B-1.1.1
Brand has a program aimed at understanding and reducing the Product Care & Repair
Service environmental impacts of its products. Specifically, the program/initiative
includes a policy/operating strategy/program outlining the overarching goal of
understanding and reducing environmental impact from Product Care & Repair
Service
0 4
USE-B-1.1.2
Brand has a program aimed at understanding and reducing the Product Care & Repair
Service environmental impacts of its products. Specifically, the program/initiative
includes the tracking, measuring, and documenting of Product Care & Repair Service
environmental impacts.
0 4
USE-B-1.1.3
Brand has a program aimed at understanding and reducing the Product Care & Repair
Service environmental impacts of its products. Specifically, the program/initiative
includes the setting of targets and goals to reduce those Product Care & Repair Service
environmental impacts.
0 4
USE-B-1.1.4
Brand has a program aimed at understanding and reducing the Product Care & Repair
Service environmental impacts of its products. Specifically, the program/initiative
includes publicly reporting – at least annually – on the program/initiative’s Product
Care & Repair Service environmental impacts and the progress against the targets and
goals.
0 4
USE-B-1.1.5 Brand has a program aimed at understanding and reducing the Product Care & Repair
Service environmental impacts of its products. Specifically, the program/initiative
includes independent 3rd party verification of these efforts (at least every two years).
0 4

89
USE-B-2.1
Brand makes apparel product “Repair Service” information (such as repair vs. replace
guidance and disclosure on how brand is properly disposing of products) publicly
available and easily accessible for consumers (e.g., through website, phone customer
service, in-store printed materials, trained staff, and/or warranties or similar policies) –
excluding on-product permanent labeling (covered at product module).
Where applicable, the “Repair Service” information should include (in order of
priority):
1) Instructions for on product care to prevent/avoid service and increase longevity of
product
2) What options are available if repair service is needed (i.e., how to service the
product)
3) If a product is returned/replaced, how the brand handles / processes the
returned/replaced item (e.g., recycling, disposal, servicing, return to manufacturer, etc.)
15 15
USE-B-3.1 Brand has design standards in place to provide guidance/incentives for design
considerations to maximize product features that are repairable and upgradable (e.g.,
replacement buckles, zipper pulls, tent poles, bike components, etc.).
15 15
USE-B-4.1.1 Brand has a field testing program in which products are used as intended and under
typical user conditions 5 5
USE-B-4.1.2 Brand has a product fatigue or destructive testing program in which finished products
are tested in the lab to ASTM, AATCC, EN or any other similar industry standards. 10 10
USE-B-4.1.3 Brand has design standards in place to provide guidance/incentives for design
considerations to maximize the durability of finished product 10 10
USE-B-5.1.1
Brand has a Quality Assurance Program aimed at understanding and enhancing the
durability and longevity of its products. The program must bring durability and
longevity information back to the product creation team (i.e., create a feedback loop).
In creating that information feedback loop, does your program include developing
both product- and material-level durability criteria to ensure longevity in the product’s
intended use.
5 5
USE-B-5.1.2 Establishing a correlation between durability lab testing and the product’s intended
end-use. 5 5
USE-B-5.1.3 Establishing a correlation between durability field testing and the product’s intended
end-use. 5 5
USE-B-5.1.4
Maintaining an active system of feedback to continuously assess worn products
(including returns) and upgrade durability criteria accordingly. For example, this may
include documenting and reporting product return rates with reason codes that
reference “failure due to materials, trims, assembly, etc.”
5 5
USE-B-5.1.5 At least annually, the Quality Assurance Program sets, tracks, and reviews specific
goals, targets, and timelines that demonstrate program efficacy and impact. 0 5
EOL-B-1.1.1
Brand has a program aimed at understanding and reducing the End of Life
environmental impacts of its products. Specifically, the program/initiative includes:
a policy/operating strategy/program outlining the overarching goal of understanding
and reducing environmental impact from End of Life and identify which EOL
stream(s)—repair, re-use, re-purpose, and/or closed-/open-loop fiber recycling—are
being utilized.
8 8
EOL-B-1.1.2 The tracking, measuring, and documenting of End of Life environmental impacts and
program performance. This may require working with partners (e.g., charities) to
collect and monitor performance data.
0 8
EOL-B-1.1.3 The setting of targets and goals to reduce those End of Life environmental impacts
and demonstrate the EOL stream(s) are functioning effectively. 0 8
EOL-B-1.1.4 Publicly reporting – at least annually – on the program/initiative’s End of Life
environmental impacts and the progress against the targets and goals. 0 8
EOL-B-1.1.5 Independent 3rd party verification of these efforts (at least every two years). 0 8

90
EOL-B-2.1
Brand adopts, promotes, or develops the collection and processing infrastructure
(public or private) required for the End of Life stream(s) utilized in its EOL program
to function. These efforts should consider cultural nuances and avoid disrupting
existing, well-functioning systems that may be in place locally, regionally, or nationally.
This may include:
• Re-Use
o Brand develops partnerships with recognized, credible, and licensed charities
o Brand supports public collection and/or processing infrastructure
• Re-purpose
o Brand develops partnerships with recognized, credible, and licensed second-hand
businesses
o Brand partners-with or subscribes to third-party organizations for product take-back
service
o Brand supports public collection and/or processing infrastructure
• Closed-/Open-Loop Recycling (upcycling or downcycling)
o Brand partners with or subscribes to third-party organizations for product take-back
service (closed/open loop recycling)
o Brand supports development of technologies that enable material recycling
20 20
EOL-B-3.1
Brand publicly communicates instructions on 1 or more EOL streams for its products
via one or more of the following channels:
Websites (5)
In-store communications (written materials and/or staff training)(5)
Marketing materials (5)
Product packaging (excludes on-product permanent labels - covered in product
module) (5)
15 20
EOL-B-4.1
Brand has one or more of the End of Life-oriented design policies listed below that
support its EOL program(s):
• Products are designed to include identification of each individual material type so
that material types can be separated for EOL recycling.
• Products are designed with material types that are compatible with existing material
EOL recycling streams.
• Policy for designing products with a single material type to aid in closed-/open-loop
material recycling
• Design for disassembly:
o With publicly available tools,
o Ensure easy access to connecting parts,
o Use easily detachable connections,
o Ensure easily visible access to connections for disassembly.
20 20
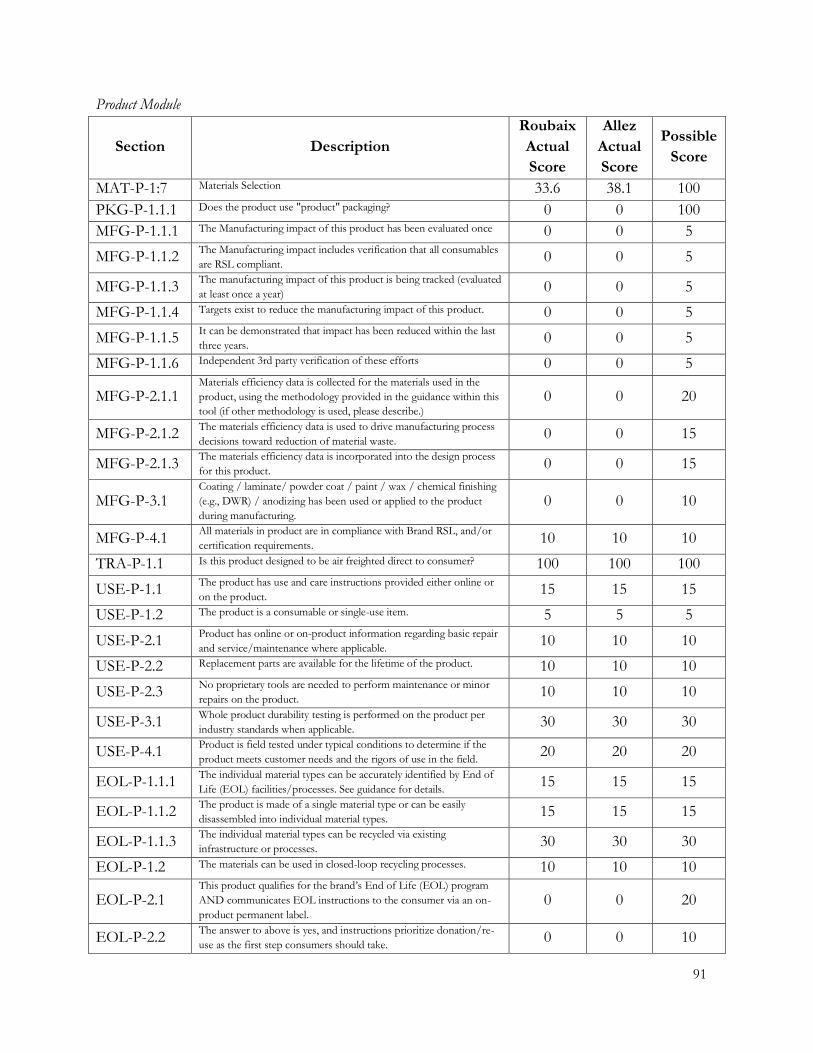
91
Product Module
Section Description
Roubaix
Actual
Score
Allez
Actual
Score
Possible
Score
MAT-P-1:7 Materials Selection 33.6 38.1 100
PKG-P-1.1.1 Does the product use "product" packaging? 0 0 100
MFG-P-1.1.1 The Manufacturing impact of this product has been evaluated once 0 0 5
MFG-P-1.1.2 The Manufacturing impact includes verification that all consumables
are RSL compliant. 0 0 5
MFG-P-1.1.3 The manufacturing impact of this product is being tracked (evaluated
at least once a year) 0 0 5
MFG-P-1.1.4 Targets exist to reduce the manufacturing impact of this product. 0 0 5
MFG-P-1.1.5 It can be demonstrated that impact has been reduced within the last
three years. 0 0 5
MFG-P-1.1.6 Independent 3rd party verification of these efforts 0 0 5
MFG-P-2.1.1 Materials efficiency data is collected for the materials used in the
product, using the methodology provided in the guidance within this
tool (if other methodology is used, please describe.)
0 0 20
MFG-P-2.1.2 The materials efficiency data is used to drive manufacturing process
decisions toward reduction of material waste. 0 0 15
MFG-P-2.1.3 The materials efficiency data is incorporated into the design process
for this product. 0 0 15
MFG-P-3.1 Coating / laminate/ powder coat / paint / wax / chemical finishing
(e.g., DWR) / anodizing has been used or applied to the product
during manufacturing.
0 0 10
MFG-P-4.1 All materials in product are in compliance with Brand RSL, and/or
certification requirements. 10 10 10
TRA-P-1.1 Is this product designed to be air freighted direct to consumer? 100 100 100
USE-P-1.1 The product has use and care instructions provided either online or
on the product. 15 15 15
USE-P-1.2 The product is a consumable or single-use item. 5 5 5
USE-P-2.1 Product has online or on-product information regarding basic repair
and service/maintenance where applicable. 10 10 10
USE-P-2.2 Replacement parts are available for the lifetime of the product. 10 10 10
USE-P-2.3 No proprietary tools are needed to perform maintenance or minor
repairs on the product. 10 10 10
USE-P-3.1 Whole product durability testing is performed on the product per
industry standards when applicable. 30 30 30
USE-P-4.1 Product is field tested under typical conditions to determine if the
product meets customer needs and the rigors of use in the field. 20 20 20
EOL-P-1.1.1 The individual material types can be accurately identified by End of
Life (EOL) facilities/processes. See guidance for details. 15 15 15
EOL-P-1.1.2 The product is made of a single material type or can be easily
disassembled into individual material types. 15 15 15
EOL-P-1.1.3 The individual material types can be recycled via existing
infrastructure or processes. 30 30 30
EOL-P-1.2 The materials can be used in closed-loop recycling processes. 10 10 10
EOL-P-2.1 This product qualifies for the brand’s End of Life (EOL) program
AND communicates EOL instructions to the consumer via an on-
product permanent label.
0 0 20
EOL-P-2.2 The answer to above is yes, and instructions prioritize donation/re-
use as the first step consumers should take. 0 0 10

92
Appendix 5: Articles Used in Media Analysis
The Washington Post
Cropp, I. (2011, July 2). Why it costs almost 1,000 to get a bike. Retrieved on February 11, 2014
from The Washington Post: http://www.washingtonpost.com/business/why-it-costs-almost-
1000-got-a-bike/2011/06/29/AGDcHQvH_story.html
Why it costs almost $1,000 to get a bike
While you can find a used cruiser bike online for the price of a taxi ride, you can also buy a top-end road bike
that costs more than a used car. A quality hybrid bike, such as a Trek 7.5FX, retails for $979.99. So why does
it cost this much?
Many shops lose money on the sale of middle- and lower-end bikes (the break-even point on bicycle markups
is 38.6 percent.) When bikes arrive at the shop from the distributor, someone needs to build them and make
adjustments, which can take over an hour. A salesperson might spend an hour with a customer looking at
bikes, then another 30 minutes or so getting the bike set to ride. On the production side, bike manufacturers
in Taiwan often pay well below wholesale price for parts and have huge bargaining power, considering they
manufacture bikes for many companies.
Cost to manufacturer $473.43 Cost to retailer $984.25
Frame 61.44 Bike 710.14
Fork 61.44 Staff 149.05
Rims 61.44 Rent 55.99
Wheels 46.08 Advertising and marketing 5.09
Tires 24.58 Insurance 5.82
Tubes 4.92 Licenses/professional services 7.27
Crankset 61.44 Deliveries/postage 12.36
Chain 7.68 Depreciations 6.54
Chainwheel 7.68 Cost to consumer $979.99
Front derailleur 15.36 Loss to retailer $4.26
Rear derailleur 15.36
Rear cogs 13.82
Shifter 15.36
Handlebars 9.22
Tape/grips 4.30
Stem 9.22
Brake levers 5.84
Brakes 12.90
Pedals 4.61
Saddle 15.36
Seat post 15.36
Cost to supplier $568.11

93
Depillis, L. (2014, January 24). This is how Wal-Mart is bringing jobs back to the U.S. Retrieved on
February 11, 2014, from The Washington Post : http://www.washingtonpost.com/blogs/
wonkblog/wp/2014/01/24/this-is-how-walmart-is-bringing-jobs-back-to-the-u-s/
This is how Wal-Mart is bringing jobs back to the U.S.
For the past few months, Wal-Mart has been pushing its new face of corporate responsibility: After
decades of sending work overseas through ruthless price competition, it's bringing them back to
America, by committing to purchase hundreds of billions of dollars more in U.S.-made goods. But
those manufacturing jobs, once they return, aren't going to look quite like they did in the past.
Consider the case of Kent Bicycles, which Wal-Mart announced on Thursday would be building a
new plant in South Carolina. Kent's story is the story of American manufacturing: It started out
making bicycles in New Jersey back in the 1970's, but by the 1990's, the imbalance between labor
costs in America and China had grown to great to ignore, and the company completely outsourced
production.
"By that time, the whole mystique of 'made in the USA' was disappearing, and nobody would pay a
premium of 2 percent for a U.S. product compared to an import," says Arnold Kamler, the
company's CEO. "We always hoped that we could start back up again."
That didn't happen, though, until Wal-Mart's beginning of the year meeting last March. The giant
retailer had favored Kent with one of its "supplier of the quarter" awards, and reached out about the
possibility of moving some production to the U.S. Kent currently imports 2.8 million bikes a year,
but its international business is doing well enough that it could sell all those bikes abroad, and bring
a new plant online to satisfy U.S. demand. Meanwhile, the fundamentals of the labor market were
shifting in a way that it started to make economic sense.
"One of the things we're seeing now in China is not only is the cost of labor going higher, but the
workers' attitude is getting more apathetic," Kamler says. "The factories in China are fighting with
workers to make sure they don't take cellphones to the assembly line. This texting thing is crazy.
You can't be concentrating on your job in a factory if you're sending text messages to your buddies."
So Kamler started looking for a place to site a new plant, starting in the company's home state of
New Jersey. Ultimately, though, he became leery of the state's lack of a right-to-work law, which
would make it easier for unions to organize the staff. "New Jersey gave us really nice incentives, and
were very excited," Kamler said. "But when we had our plant in the U.S. previously, we were non-
union, but we battled 24-7 to stay so."
The search widened up and down the Eastern seaboard, and as far west as Texas, looking for a place
near a port since parts would still have to be imported as production ramped up. Early on, Wal-Mart
introduced Kamler to South Carolina Gov. Nikki Haley, and the two hit it off. Touring the state, he

94
found a lot to like in Clarendon County, which has a 12.2 percent unemployment rate -- which is
especially high in manufacturing -- and a few other medium-sized factories.
"There was something just about the people and the workers that I saw, the factories in Clarendon,
it felt right," Kamler says. "The workers are very serious about their jobs. There are a lot of women,
single mothers, this job is their bread and butter. The whole attitude of people in the South is nicer.
People are just nice, because that's how they're brought up."
That wouldn't have been enough, though. Most corporate relocations these days involve playing
jurisdictions against each other for incentive packages, which Wal-Mart encourages. "It's turned into
a bit of a competition," said Wal-Mart CEO Bill Simon to the winter gathering of the U.S.
Conference of Mayors on Thursday, in announcing Kent's relocation. "But just think, the rewards
are absolutely incredible. If you bring a factory to your city or town, it will be there for generations."
To get the most out of the deal, Kent Bicycles engaged consultants from Deloitte, who weighed the
sets of incentives. Clarendon offered to train all Kent's workers for free, without requiring them to
hire anybody in particular, and kicked in a set of tax subsidies in exchange for Kent getting to a
promised employment level of 175 people. The company expects to invest $4.5 million in the plant
over three years, achieving a peak production level of half a million bikes a year, and to pay people
"substantially over minimum wage," which in South Carolina is $7.25 an hour.
Would Kent Bicycles have decided to build a new plant in the U.S. without Wal-Mart's nudge?
Kamler pauses to think. The deal didn't come with any purchase orders. Wal-Mart, which accounts
for half the bikes sold in the U.S. and is Kent's biggest buyer, could decide at any time to look for
cheaper bikes somewhere else. But it helped give him the confidence to make the leap.
"Certainly Wal-Mart's commitment to this project has been the encouragement to go ahead and
really do it," Kamler says. "We're not asking for charity. They're going to make sense for Wal-Mart."
That's only possible, of course, because jurisdictions are now competing so hard for these plants.
And union organizing -- the one area where Wal-Mart will never back down -- isn't part of the
picture.
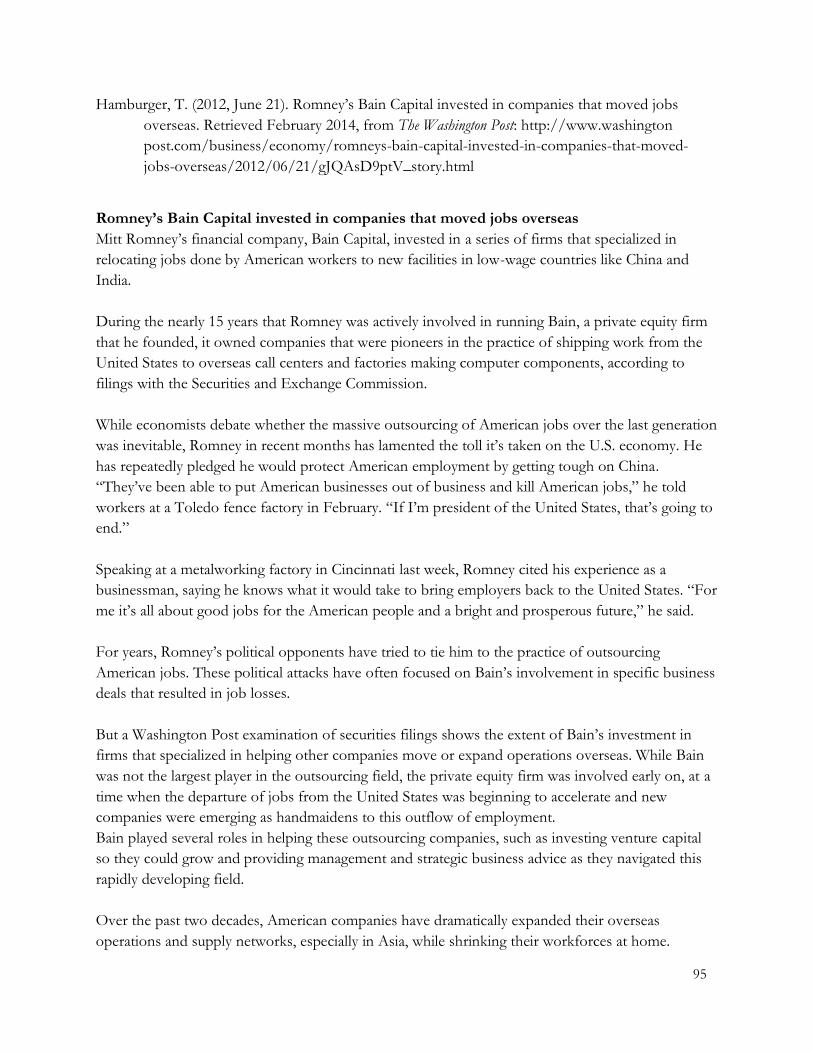
95
Hamburger, T. (2012, June 21). Romney’s Bain Capital invested in companies that moved jobs
overseas. Retrieved February 2014, from The Washington Post: http://www.washington
post.com/business/economy/romneys-bain-capital-invested-in-companies-that-moved-
jobs-overseas/2012/06/21/gJQAsD9ptV_story.html
Romney’s Bain Capital invested in companies that moved jobs overseas
Mitt Romney’s financial company, Bain Capital, invested in a series of firms that specialized in
relocating jobs done by American workers to new facilities in low-wage countries like China and
India.
During the nearly 15 years that Romney was actively involved in running Bain, a private equity firm
that he founded, it owned companies that were pioneers in the practice of shipping work from the
United States to overseas call centers and factories making computer components, according to
filings with the Securities and Exchange Commission.
While economists debate whether the massive outsourcing of American jobs over the last generation
was inevitable, Romney in recent months has lamented the toll it’s taken on the U.S. economy. He
has repeatedly pledged he would protect American employment by getting tough on China.
“They’ve been able to put American businesses out of business and kill American jobs,” he told
workers at a Toledo fence factory in February. “If I’m president of the United States, that’s going to
end.”
Speaking at a metalworking factory in Cincinnati last week, Romney cited his experience as a
businessman, saying he knows what it would take to bring employers back to the United States. “For
me it’s all about good jobs for the American people and a bright and prosperous future,” he said.
For years, Romney’s political opponents have tried to tie him to the practice of outsourcing
American jobs. These political attacks have often focused on Bain’s involvement in specific business
deals that resulted in job losses.
But a Washington Post examination of securities filings shows the extent of Bain’s investment in
firms that specialized in helping other companies move or expand operations overseas. While Bain
was not the largest player in the outsourcing field, the private equity firm was involved early on, at a
time when the departure of jobs from the United States was beginning to accelerate and new
companies were emerging as handmaidens to this outflow of employment.
Bain played several roles in helping these outsourcing companies, such as investing venture capital
so they could grow and providing management and strategic business advice as they navigated this
rapidly developing field.
Over the past two decades, American companies have dramatically expanded their overseas
operations and supply networks, especially in Asia, while shrinking their workforces at home.

96
McKinsey Global Institute estimated in 2006 that $18.4 billion in global information technology
work and $11.4 billion in business-process services have been moved abroad.
While the export of jobs has been disruptive for many workers and communities in the United
States, outsourcing has been a powerful economic force. It has often helped lower the prices that
American consumers pay for products and created a global supply chain that has made U.S.
companies more nimble and profitable.
Romney campaign officials repeatedly declined requests to comment on Bain’s record of investing in
outsourcing firms during the Romney era. Campaign officials have said it is unfair to criticize
Romney for investments made by Bain after he left the firm but did not address those made on his
watch. In response to detailed questions about outsourcing investments, Bain spokesman Alex
Stanton said, “Bain Capital’s business model has always been to build great companies and improve
their operations. We have helped the 350 companies in which we have invested, which include over
100 start-up businesses, produce $80 billion of revenue growth in the United States while growing
their revenues well over twice as fast as both the S&P and the U.S. economy over the last 28 years.”
Until Romney left Bain Capital in 1999, he ran it with a proprietor’s zeal and attention to detail,
earning a reputation for smart, hands-on management.
Bain’s foray into outsourcing began in 1993 when the private equity firm took a stake in Corporate
Software Inc., or CSI, after helping to finance a $93 million buyout of the firm. CSI, which catered
to technology companies like Microsoft, provided a range of services including outsourcing of
customer support. Initially, CSI employed U.S. workers to provide these services but by the mid-
1990s was setting up call centers outside the country.
Two years after Bain invested in the firm, CSI merged with another enterprise to form a new
company called Stream International Inc. Stream immediately became active in the growing field of
overseas calls centers. Bain was initially a minority shareholder in Stream and was active in running
the company, providing “general executive and management services,” according to SEC filings.
By 1997, Stream was running three tech-support call centers in Europe and was part of a call center
joint venture in Japan, an SEC filing shows. “The Company believes that the trend toward
outsourcing technical support occurring in the U.S. is also occurring in international markets,” the
SEC filing said.
Stream continued to expand its overseas call centers. And Bain’s role also grew with time. It
ultimately became the majority shareholder in Stream in 1999 several months after Romney left Bain
to run the Salt Lake City Olympics.
Bain sold its stake in Stream in 2001, after the company further expanded its call center operations
across Europe and Asia.

97
The corporate merger that created Stream also gave birth to another, related business known as
Modus Media Inc., which specialized in helping companies outsource their manufacturing. Modus
Media was a subsidiary of Stream that became an independent company in early 1998. Bain was the
largest shareholder, SEC filings show.
Modus Media grew rapidly. In December 1997, it announced it had contracted with Microsoft to
produce software and training products at a center in Australia. Modus Media said it was already
serving Microsoft from Asian locations in Singapore, South Korea, Japan and Taiwan and in Europe
and the United States.
Two years later, Modus Media told the SEC it was performing outsource packaging and hardware
assembly for IBM, Sun Microsystems, Hewlett-Packard Co. and Dell Computer Corp. The filing
disclosed that Modus had operations on four continents, including Asian facilities in Singapore,
Taiwan, China and South Korea, and European facilities in Ireland and France, and a center in
Australia.
“Technology companies, in particular, have increasingly sought to outsource the business processes
involved in their supply chains,” the filing said. “. . . We offer a range of services that provide our
clients with a one-stop shop for their outsource requirements.”
According to a news release issued by Modus Media in 1997, its expansion of outsourcing services
took place in close consultation with Bain. Terry Leahy, Modus’s chairman and chief executive, was
quoted in the release as saying he would be “working closely with Bain on strategic expansion.” At
the time, three Bain directors sat on the corporate board of Modus.
The global expansion that began while Romney was at Bain continued after he left. In 2000, the firm
announced it was opening a new facility in Guadalajara, Mexico, and expanding in China, Malaysia,
Taiwan and South Korea.
In addition to taking an interest in companies that specialized in outsourcing services, Bain also
invested in firms that moved or expanded their own operations outside of the United States.
One of those was a California bicycle manufacturer called GT Bicycle Inc. that Bain bought in 1993.
The growing company relied on Asian labor, according to SEC filings. Two years later, with the
company continuing to expand, Bain helped take it public. In 1998, when Bain owned 22 percent of
GT’s stock and had three members on the board, the bicycle maker was sold to Schwinn, which had
also moved much of its manufacturing offshore as part of a wider trend in the bicycle industry of
turning to Chinese labor.
Another Bain investment was electronics manufacturer SMTC Corp. In June 1998, during Romney’s

98
last year at Bain, his private equity firm acquired a Colorado manufacturer that specialized in the
assembly of printed circuit boards. That was one of several preliminary steps in 1998 that would
culminate in a corporate merger a year later, five months after Romney left Bain. In July 1999, the
Colorado firm acquired SMTC Corp., SEC filings show. Bain became the largest shareholder of
SMTC and held three seats on its corporate board. Within a year of Bain taking over, SMTC told the
SEC it was expanding production in Ireland and Mexico.
In its prospectus that year, SMTC explained that it was in a strong position to meet the swelling
demand from other manufacturers for overseas production of circuit boards. The company said that
communications and networking companies “are dramatically increasing the amount of
manufacturing they are outsourcing and we believe our technological capabilities and global
manufacturing platform are well suited to capitalize on this opportunity.”
Just as Romney was ending his tenure at Bain, it reached the culmination of negotiations with
Hyundai Electronics Industry of South Korea for the $550 million purchase of its U.S. subsidiary,
Chippac, which manufactured, tested and packaged computer chips in Asia. The deal was
announced a month after Romney left Bain. Reports filed with the SEC in late 1999 showed that
Chippac had plants in South Korea and China and was responsible for marketing and supplying the
company’s Asian-made computer chips. An overwhelming majority of Chippac’s customers were
U.S. firms, including Intel, IBM and Lucent Technologies.
A filing with the SEC revealed the promise that Chippac offered investors. “Historically,
semiconductor companies primarily manufactured semiconductors in their own facilities,” the filing
said. “Today, most major semiconductor manufacturers use independent packaging and test service
providers for at least a portion of their . . . needs. We expect this outsourcing trend to continue.”

99
Lazo, L. (2014, February 27). Capital Bikeshare put on hold in College Park. Retrieved February 10,
2014, from The Washington Post: http://www.washingtonpost.com/blogs/dr-
gridlock/wp/2014/02/27/capital-bikeshare-put-on-hold-in-college-park/
Capital Bikeshare put on hold in College Park
A plan to bring Capital Bikeshare to College Park is on hold as a result of the bankruptcy filing of a
company that manufactures the bicycles for the operator of the program, a College Park official said.
College Park and the university said in October they were negotiating a one-year contract with Alta
Bicycle Share, the company that runs Capital Bikeshare, to install bike stations, supply bicycles and
operate the system. The plan was to have Capital Bikeshare running by Feb. 1.
Terry A. Schum, director of planning for College Park, said the city was very close to signing the
agreement with Alta, but it is now on hold due to Public Bike System Co.’s filing for bankruptcy
protection last month. Public Bike System is one of Alta’s main equipment and technology suppliers.
“Unfortunately, we are in a holding pattern,” said Schum in an email this week.
Alta Bicycle Share said in a statement last month that current bike sharing operations in the
Washington area are not affected by the bankruptcy filing.
“Our systems across the country — in Washington D.C., Boston, New York City, Chicago, the Bay
Area, Columbus, OH, and Chattanooga, TN—are up and running and ABS will ensure that they
continue to operate without interruption,” the company said. “Given our plans to expand current
systems and launch new systems this year, we’re in constant communication with both PBSC as well
as its suppliers to ensure we can do so successfully.”
Schum said College Park is working with the Capital Bikeshare partners in the District, Virginia and
and Montgomery County and should have an update on the city’s launch by the end of March.
City and university officials said last year they hoped to have Capital Bikeshare running just in time
for the spring semester at the University of Maryland. The plan in College Park is to install 10 bike
stations with 62 bikes across the city, including six stations on university property and one at the
College Park Metro station.
College Park would be the latest jurisdiction in the region — and the first in Prince George’s County
— to join the fast-growing bicycle-sharing network.
Capital Bikeshare operates in the District, Arlington, Alexandria and Montgomery. Last month
Capital Bikeshare added two new stations in Montgomery, bringing their total stations to 43.
Officials in Prince George’s say they expect strong demand for bike rentals from the Metro station
to the university campus and for commuting between new housing developments along the Route 1
corridor to the university, which is the largest employer in the city.
The annual cost to operate all 10 stations is expected to be $160,646. The city and the university
received a state grant of $374,980 to help cover costs to start the program.

100
Montgomery, D. (2008, August 2). Cycling Back Around: Four Wheels Good, Two Wheels Better.
In the City, and Old Fashioned Conveyance Returns. Retrieved from The Washington Post:
http://www.washingtonpost.com/wpdyn/content/article/2008/08/01/AR2008080103246
_pf.html
Cycling Back Around
Four Wheels Good, Two Wheels Better. In the City, an Old-Fashioned Conveyance Returns
This is the summer of women on bicycles riding around town free as anything, wearing long dresses
or skirts, sandals or even high heels, hair flowing helmet-free, pedaling not-too-hard and sitting
upright on their old-school bikes, the kind with front baskets where they put their laptops, and
handlebars that curve gently back in a bow shaped like the upper line of someone's perfectly drawn
red lipstick.
They never appear to sweat. They make you think you are in Paris or Rome. No, they make you
think you are in a movie about Paris or Rome.
This is the summer of men rolling down 14th Street NW with briefcases in the grocery pannier, ties
flipped back over the shoulder by the breeze, wingtips inserted into toe clips. In the movie version,
they would return home at day's end with a baguette under one arm and maybe a bouquet of
flowers. Instead, their left hand grips the handle of a Whole Foods bag while their right presses a
cellphone to the ear.
This summer in Bicycle Washington, it's back to the future. Old bikes are back, new bikes look old.
The riders, too, seem sketched from another age.
The machine of the moment is the 1969 Schwinn Deluxe Racer, picked up on Craigslist for $75,
with lightly rusted metal fenders and a three-speed Sturmey-Archer shifter on the upright
handlebars. Or it's a new Jamis Commuter, or a Breezer Villager, this year's models that aren't
ashamed of the primitive, durable genius of an old Schwinn.
"Somewhere along the line, we made biking a hobby and a sport instead of a way to get around,"
says Alexandra Dickson, an architect who commutes from Southwest Washington to her downtown
office on a blue Breezer Villager that she calls Babe, after Babe the Blue Ox. "I'd like to see it get
back to being a way of getting around."
Shopping by bike, she says, "feels more like an adventure than a chore." The other day, she tied a
milk crate to her rack, biked to a hardware store on Pennsylvania Avenue and carried home a flat of
flowers on the crate.
Riding to the office, sometimes "I wear heels and skirts," she says, "and I'm not the only girl in town

101
who does. It's like, Why not? I'm not running. I'm just using the pads of my feet. . . . People need to
see bikers dressed like that, so they can say, 'I can do that.' "
She says: "When you first take off your training wheels, the first excitement of being allowed to ride
to school -- that was the first level of freedom. I think that's something you never lose."
This is the summer of bike-parking attendants at Nationals games, of a new fleet of communal
unisex Treks at the U.S. House of Representatives, of a proposed bike-share program in the city, of
street musicians strapping keyboards and speakers to milk crates on beater bikes, of thick, bright
orange German-made contraptions pedaled by diplomats, with metal child-seats built on back and
metal cargo carriers installed in front.
This is the summer when every day you witness astonishing feats of two-wheeled conveyance of
everything from 30-packs of Bud Ice on the handlebars to gift baskets of fruit on the homemade
wood-and-PVC-pipe trailer behind. This summer it makes perfect sense that columnist Bob Novak,
after hitting a pedestrian with his Corvette, should have the police called on him by a lawyer
commuting by bicycle.
Your first three-speed was a Schwinn. It was built to live as long as you did -- except you left yours
behind in some dank, enchanted basement of discarded Flexible Flyers, little red wagons, scooters,
badminton nets, croquet mallets and fishing poles.
This is the summer you realize you need it again.
* * *
What's happening is, the American conception of the bicycle-as-toy and the bicycle-as-sports-
equipment is being infiltrated by the European notion of the bicycle-as-transportation and the Asian
notion of the bicycle-as-cargo-hauler.
The idea has dawned that, guess what, contrary to biker dogma of the 1970s and 1980s, you don't
have to break your back with drop-down handlebars and obsess over ever-lighter space-age frames.
The totemic two-wheeler is no longer the Specialized Roubaix Elite Triple with the carbon frame
and the 30-speed Shimano drivetrain for $1,949.99, last seen tearing down Beach Drive on
weekends, bearing lawyers and lobbyists in full spandex peloton plumage. And good riddance to the
1980s' and 1990s' craze for tank-treaded, double-suspension mountain bikes. The only time you ever
found yourself "off-road," dude, was on the C&O Canal towpath.
Hybrids came along, of course, a compromise between road bikes and mountain bikes. Now hybrids
have been refined and gussied into "commuter bikes," made by such companies as Jamis, Breezer
and others, costing a few hundred bucks up to $1,000.
The handlebars are set higher than the seats, so you sit upright and comfortable. What a concept.
102
The reign of the purists is over, and all the accessories they forbade are permitted again. There are
baskets in front and racks in back. There are chain guards so you don't get grease on your slacks, and
skirt guards so you don't catch your dress. Kickstands are no longer a heresy punishable by sneering.
Fenders are back, along with mudflaps, so you don't get a splatter trail up your back on rainy days.
On some of the models, front and rear lights come installed.
Basically, it's the 1969 Schwinn Racer, with more gears.
The bike industry's fresh supply of new-old bikes is being supplemented by the tectonic forces of
Craigslist and eBay unearthing vast midden heaps of old-old Schwinns, Raleighs, Huffys, Peugeots,
Sears Roebuck Free Spirits and so on. They have the advantage of being cheap and retro-hip.
"There's a whole new clientele" choosing these bikes, Charlie McCormick, founder of City Bikes,
says of this summer in Bicycle Washington. "People who haven't been riding for years and years are
going back to it. It's all right to show up at a barbecue on a bike. You're not marginalized. It's cool."
* * *
A bicycle is a minimalist sculpture, an object that is also a concept, sparely rendered in a few lines
and curves. The old ones have a certain special elegance. Never discount the aesthetic motive when
it comes to biking -- even commuter biking.
"My friends call it the Cadillac of bikes," Bryce Pardo says of his green and white 1969 Schwinn
Racer. It is locked to a parking sign on the sidewalk of K Street, where he works with an
international exchange program. He commutes from Capitol Hill in his dark slacks, button-down
shirts and work shoes.
Ah, the fat tires, the fenders, the molded plastic hand grips, the "S" on the saddle. Pardo got the bike
on Craigslist for $75 and added a vintage-looking rearview mirror from eBay.
Emily and Chris Leaman ride fixed-gear bikes. Favored by messengers, now adopted by hipsters,
these direct-drive machines have pedals that move with the wheels, like a child's tricycle. Sometimes
they have no brakes. The way to stop is pedal backward. They are the most extreme expression of
the pared-down, low-maintenance, retro ideal. Wheels, steel and a chain. And beautiful.
Emily rides hers to work at Washingtonian, Chris to the State Department. This evening they've
ridden to Whole Foods on P Street NW, where the bike rack is full, and the parking meters and
parking signs, invented for cars, also are tethering shoppers' bicycles.
Into their messenger bags they pack hummus, guacamole, pita chips and wine. They are biking down
to the Mall to picnic and watch "The Candidate" at Screen on the Green, another lovely night in
Bicycle Washington.
* * *
103
Found and lost, lost and found. What Bicycle Washington affords this summer is redemption, for
both rider and bike.
It all began for Ed Cabic with a Mt. Shasta Capella that he got about 17 years ago when he was 11,
growing up in Columbia. It was a nice hybrid, large for the boy, and he rode it a lot. Then he got his
driver's license.
Nothing beats driving, until Cabic realized he was arriving at work every morning mad and stressed.
A couple of years ago, he hauled out the dependable, upright Mt. Shasta. He started riding from
Petworth to his job as a computer applications developer for a law firm at 10th and K.
The first day, he had to stop five times on the hills going home. Within two weeks, he didn't have to
stop anymore.
"I went from hating my commute to having the commute be what I was looking forward to all day,"
says Cabic, now 28. "I come into work happy."
So happy that: "I found my commute was not long enough."
So he moved to Alexandria. That commute is about 15 miles round trip, 30 minutes each way. He
got studded tires to ride in the snow. He does 2,500 to 3,000 miles a year.
While shedding 40 pounds, he calculated he also was saving about $4,500 a year -- before the recent
jump in gas prices.
He has invested about $1,500 of the savings to upgrade the Mt. Shasta. Old bike, new accessories:
He's got two panniers -- one doubles as a backpack, the other holds a full-size grocery bag -- plus a
utility bag on the rack. The panniers carry his work shoes and a change of clothes. He rides in faded
spandex and showers at the office.
He packs a lunch, a breakdown kit, lights, a CO2 tire inflator, latex gloves in case he has to handle
his chain. On the handlebars is a bell, an air horn for really obnoxious or dangerous motorists, and a
GPS device that he mainly uses as a speedometer.
He kept the Mt. Shasta's friction-shifters because he considers the old system more durable and
lower-maintenance than the new index gears.
He wears a helmet, and also goggles, to which he has attached a tiny rearview mirror: "Probably the
best $15 I ever spent."
"I love D.C.," he says. "A big part of being in love with the city is biking it."

104
His favorite part of the morning commute is cresting the hill on the Mount Vernon Trail bike path
near Reagan National Airport. That's the moment the monuments suddenly come into view.
Now it's the end of the day. Heading home, he cruises the Mall on Madison Drive. As he pedals
over the 14th Street bridge, planes swoop toward National while boats ply the Potomac River. "You
get quite the vista," he says. "At night you can see the Nationals' stadium."
He turns onto the Mount Vernon Trail and follows the river toward Alexandria. Bikers are coming
and going. They have left the cars behind, and it is quiet along the river.
105
Montgomery, D. (2009, September 28). Stripped-Down Fixies Have Long Been The Bike of Choice
Among Couriers. Now, Hip Urbanites Have Gotten the Message. Retrieved on February 10,
2014 from The Washington Post http://www.washingtonpost.com/wp-dyn/content/article/
2009/09/27/AR2009092703241.html
Look Ma, No Brakes! Stripped-Down Fixies Have Long Been The Bike of Choice Among
Couriers. Now, Hip Urbanites Have Gotten the Message.
What a profile they cut, slicing through the city: gorgeous, exotic, dangerous. You see them parked
like emaciated steeds outside the coolest clubs.
They don't make much sense, yet for one more fleeting season at least, they are the rage in certain
circles. Sort of dumb and super hip: the twin characteristics of many things in life.
We are talking about a bicycle. A very special kind of road bicycle, called a fixed-gear bike, or fixie
for short.
A fixie has one speed, which makes it difficult to pedal uphill. A classic fixie has no brakes, which
makes it difficult to slow on the downhill. A fixie has no freewheel, the part that makes coasting
possible. Instead, the chain directly drives the rotation of the rear wheel, which means the pedals
always turn while the bike moves.
What else do they have going for them?
Well, fixies are impractical, perverse throwbacks to a time more than a century ago, before the
invention of the derailleur and the Tour de France, when the bicycle chain and the pneumatic tube
were novelties, and the high-wheel penny-farthing "ordinary" bicycle had just been eclipsed by the
chain-driven "safety" bike.
And yet despite all that -- or is it because of all that? -- a fixie manages the neat trick of
simultaneously communicating taste and rebellion.
To each his own bicycle, in a town where bicycling is an ever-expanding religion, with many rival
sects. But a fixie? Speak to us, pilgrims.
Jason Stevenson was one of Washington's earliest fixie converts. He remembers the first time he saw
one. It was the leanest machine he had ever seen, a contraption almost completely unknown in
Washington. He was spellbound.
"So clean, so fluid. I just had to have one," he says. "I was like, whatever bike that is, I want to ride
something like that."

106
The year was 1993, and Stevenson was a bike messenger, as he is now.
He knew of only three messengers riding fixies then. Washington was a little behind the curve. Some
date the dawn of fixie chic to the 1986 movie "Quicksilver," starring Kevin Bacon, which glorified
fixie-riding messengers in New York.
But countercultural couriers and speed-demon messengers didn't invent fixies. The inspiration was
handed down to them by the obscure yet mighty gods of the velodrome, who race indoors on one-
speed brakeless track bikes. Fixies take the track bike concept and relocate it to city streets.
From the roguish example set by the bike messengers, fixies spread to post-skate-punk urban kids,
who revered the bikes' mechanical simplicity and sheer speed. Since then, fixies have been adopted
by the boho aesthetes, the greens, the anti-corporate activists and, finally, the new urbanites with
money.
A fixie map of Washington would center on a handful of neighborhoods. Your fixie is what gets you
from your futon in Columbia Heights to your computer screen downtown, then on to peruse the
produce and fiction in Logan and Dupont circles, finally delivering you to an outdoor table on U
Street NW, a rope line on H Street NE or a bike polo match at Eastern Market. Fixies haven't made
it in a big way to the suburbs, and may never, for strictly topographical reasons. They aren't good
over long hilly distances.
At City Bikes in Adams Morgan, near the heart of fixie culture, in recent years fixies have accounted
for between 10 and 20 percent of road-bike sales. That doesn't factor in all the homemade fixie
conversions from old 10-speed Raleighs, Peugeots and the like -- a huge factor in the fixie market,
where shade-tree fixie mechanics will rip out the gears and cables, purging their machines of mere
convenience, obeying the ideal of fixie asceticism. Nor does City Bikes' tally reflect the new wave of
fixies being marketed over the Internet, including a recent model from Urban Outfitters, the
clothing chain, signaling the fixie's transformation into an article of downtown fashion.
But we're getting ahead of ourselves.
More fixie evangelism, please. Make us believers.
Back to Stevenson. No matter what skeptics may think, there is nothing like the experience of riding
a fixie in the city, he says.
"You have to be super-aware of your surroundings," he says. "You have to pick your lines a lot
further ahead of time. It gives you a sense of invulnerability almost. You know how catastrophic
things could get. If you're good at it, you feel untouchable."
Fixie riders also talk about achieving a sense of "flow" as they navigate streams of cars. They

107
describe a kind of "dance" set to the rhythm of traffic lights. You can't coast through life on a fixie.
The euphoric riding experience is achieved via the discipline of the fixie's low technology. In zealous
self-denial, a fixie rider experiences more with less. The reason you have to be super-aware of your
surroundings and think ahead is because stopping can be a challenge. Fixie riders are like sharks,
constant motion is an existential requirement.
Cool, but here comes the steep hill up 14th Street heading north past Florida Avenue. Now what?
Stand and pedal hard, dude. No granny gear for you. Or get off and push, a lame shame. Fixie riders
tend to be in good shape, though a surprising number smoke.
Now you're heading back down the 14th Street hill. Picking up speed. Pedals churning faster and
faster. Uh-oh.
Fixies are built for speed, but if you must slow down, one way to do it is to resist the pedal
momentum with your leg muscles and knees. (Your poor knees.) Toe clips or cleats help you pull
back on the pedals. A more dramatic recourse is the skip-stop, which involves leaning forward,
hopping the rear wheel and locking one leg to start a skid when the rear wheel comes down. In the
unlikely event your chain falls off, you will be a helpless, speeding missile with only a helmet for
protection, if you wear one. Some do, some don't.
Or you can install a hand brake. All you need is one in front, the lever usually placed near the center
of the handlebars.
To brake or not to brake is a debate within the fixie community to which conventional bikers can
listen only with astonishment.
Riding without brakes gives an extra edge to the riding experience.
"It's definitely more dangerous," says David Waterman, 27, a high school math teacher locking his
brakeless fixie one night outside the Black Cat on 14th Street, where seven of 15 bikes parked before
the show are fixies. He prefers muscle power to skidding as a slowing strategy, because skidding
wastes tires. But, he allows, "You look really cool when you skid."
"I'm not interested in destroying my knees," counters Corey Dipietro, 31, a collections manager for
the Smithsonian, parking his fixie with a brake at the club for the same show.
A fixie with a brake is a more conventional though still athletically challenging ride. Your fixie with a
brake distinguishes you from the biking masses because of the degree of difficulty involved. It takes
a couple weeks to get the hang of riding one, with or without a brake -- an initiation that adds to the
mystique.

108
But a brake cable mars the clean lines of a fixie. The aggressively minimalist profile is a fundamental
part of the appeal. A fixie is the essence of bicycleness reduced to a few lines and curves, like
Picasso's sketch of a dove. The bodies of the riders accentuate this aesthetic. As a tribe, fixie riders
tend to be cropped, unadorned, skinny people, like stick figures dashed off in the same spare style as
their bikes.
"I like a bike that still looks like a bike and not an accessory," says Todd Gajewski, 35, a mechanic at
Capitol Hill Bikes, showing off the fixie he put together a few hours earlier. He took a Giant frame,
dispensed with the gear clutter, spray-painted it flat black, trimmed it with red grips and a red brake
cable. "You look at these bikes, they're not so beautiful, but they got a lot of heart and character
because they've been put together piece by piece. They also look cool, in a post-apocalyptic kind of
way."
Now corporate America is catching on. Bike manufacturers are attempting to re-create the anarcho,
no-logo, idiosyncratic fixie soul in color-coordinated models that can be purchased off the rack or
online for $400-$800. The color palettes scream iPod and Volkswagen Bug. There are lines of fixed-
gear apparel -- skimpy art-school canvas deck shoes with reinforced rubber toes to handle toe clips
($52), messenger bags and T-shirts that say "Fixed Gear Revolution."
Bikemaker Specialized's new riff on the fixie is called the Roll. It's gorgeous, but not so dangerous:
Front and rear brakes are standard -- though installation is optional, a nod to fixie purists. And it's
not so impractical, coming with a "flip-flop hub," allowing riders to switch from a fixie to a one-
speed with a freewheel by taking off the rear wheel, turning it around and putting it back on so the
freewheel side engages with the chain instead of the fixed-gear side. Then you can coast.
The Roll is aimed at "late adopters" and more "mainstream" customers, says Specialized brand
manager Garrett Chow. The online ad copy promises: "The Roll will live up to the most competitive
urban assaults and still keep an unmistakably clean, cool and collected attitude."
"This is a lifestyle tool," Chow says.
All of which may be evidence that the whole scene is about to die, transform itself again or
completely jump the shark. Fixie riders greet the prospect with a characteristic understated shrug.
"Urban culture is always co-opted," says Devin Miller, 28. He's riding his brakeless fixie home after a
dog-walking job, flowing with carefree grace through Columbia Heights. Five of the seven partners
in his worker-owned dog-walking collective ride fixies. He made his first fixie a decade ago from his
mom's 25-year-old Raleigh because he didn't have any money. This one with a fancy imported frame
he got more than a year ago at an auction for about $450.
"Any place that's fallen victim to gentrification will have these parked outside," Miller says. "It won't
be cool in a few years, and people will be back to geared bikes."

109
Stevenson, the early adopter, will never give up his fixie. But now he's almost 40. His knees are
getting older. Like many fixie riders, he keeps a fully geared road bike on the side.
"You don't want to ride a track bike every day," he says. "It just wears you out."

110
The Economist
Ababa, A. (2014, February 8). An awakening giant; Manufacturing in Africa. The Economist.
An awakening giant; Manufacturing in Africa
If Africa's economies are to take off, Africans will have to start making a lot more things. They may
well do so.
LESS than an hour's drive outside Ethiopia's capital, Addis Ababa, a farmer walks along a narrow
path on a green valley floor after milking his cows. Muhammad Gettu is carrying two ten-litre cans
to a local market, where he will sell them for less than half of what they would fetch at a dairy in the
city. Sadly, he has no transport. A bicycle sturdy enough to survive unpaved tracks would be enough
to double his revenues. At the moment none is easily available. But that may be about to change.
An affiliate of SRAM, the world's second-largest cycle-components maker, based in Chicago, is
aiming to invest in Ethiopia. Its Buffalo Bicycles look ungainly but have puncture-resistant tires, a
heavy frame and a rear rack that can hold 100kg. They are designed and assembled in Africa, and a
growing number of components are made there from scratch, creating more than 100
manufacturing jobs. About 150,000 Buffalo bikes are circulating on the continent, fighting puncture-
prone competition from Asia.
F.K. Day, a SRAM founder, says he set up his first African workshop in South Africa and is looking
at Addis Ababa and Mombasa in Kenya as possible next sites. Landlocked Ethiopia has only
partially shed its Marxist heritage yet is attracting industrial companies. Huajian, a Chinese
shoemaker (pictured above), has built an export factory not far from Mr Gettu's farm.
Those who cast doubt on Africa's rise often point to the continent's lack of manufacturing. Few
countries, they argue, have escaped poverty without putting a lot of workers through factory gates.
Rick Rowden, a sceptical development pundit, says, "Apart from a few tax havens, there is no
country that has attained a high standard of living on the basis of services alone."
Yet a quiet boom in manufacturing in Africa is already taking place. Farming and services are still
dominant, backed by the export of commodities, but new industries are emerging in a lot of African
countries.
Thandika Mkandawire, a Malawi-born expert, and Dani Rodrik, a Princeton economist, argue that
growth is bound to fizzle because of a dearth of factories. But they may be too pessimistic.
Manufacturing's share of GDP in sub-Saharan Africa has held steady at 10-14% in recent years.
Industrial output in what is now the world's fastest-growing continent is expanding as quickly as the
rest of the economy. The evidence, big and small, is everywhere.
H&M, a multinational Swedish retail-clothing firm, and Primark, an Ireland-based one, source a lot
of material from Ethiopia. General Electric, an American conglomerate, is building a $250m plant in
Nigeria to make electrical gear. Madecasse, a New York-based chocolatier, is looking for new hires
111
to add to its 650 workers in Madagascar already turning raw cocoa into expensively wrapped milky
and nutty bars. Mobius Motors, a Kenyan firm started a few years ago by Joel Jackson, a Briton, is
building a cheap, durable car for rough roads.
Domestically owned manufacturing is growing, too. Seemhale Telecoms of South Africa is planning
to make cheap mobile phones for the African market. Angola says it is to build its own arms
industry, with help from Brazil. African craftsmen are making inroads in fashion. Ali Lamu makes
handbags from recycled dhow sails on the Kenyan coast and sells them on Western websites.
Many of these businesses are beneficiaries of growth outside the manufacturing sector. The spread
of big retail shops encourages light industry. In Zambia a surprising number of goods in South
African-owned supermarkets are made locally; it is often too expensive to transport bulky stuff
across borders.
A construction boom is fostering access to high-voltage power. The spread of mobile telephony,
including mobile banking, helps small suppliers struggling with overheads. IBM, an American
computer giant with an eye on Africa, goes so far as to say that "software is the manufacturing of
the future". Consumers will still want to buy hardware, but growing local demand is creating a
market for African app and software developers.
Underpinning all this is a big improvement in education. Charles Robertson, the chief economist of
Renaissance Capital, a financial firm founded in Russia, has argued that for the first time in its
history Africa now has the human capital to take part in a new industrial revolution. In the 1970s
Western garment-makers built factories in places like Mexico and Turkey, where a quarter of
children went to secondary school. Africa, then at 9%, has caught up.
Another spur for African manufacturing is investment by Chinese workers who stay behind after
completing their contracts for work in mining and infrastructure projects. Many thousands of them
have set up workshops to fill the gaps in local markets. The African Growth and Opportunity Act,
signed by America's Congress in 2000, has also boosted trade in African-made goods.
The World Bank has been suggesting for several years that Asian manufacturing jobs could migrate
to Africa. Obiageli Ezekwesili, a vice-president of the bank, says that more than 80m jobs may leave
China owing to wage pressures, not all to neighbouring countries with low costs; if African labour
productivity continues to rise, many could go to Africa, especially if corruption and red tape, still
major scourges of the continent, are curbed. In contrast to China, business in parts of Africa is
becoming cheaper as infrastructure improves and trade barriers are lifted. The average cost of
manufacturing in Uganda, for instance, has been falling.
Can cheetahs beat tigers?
This could mark a sea change. The rise of Asian manufacturers in the 1990s hit African firms hard;

112
many were wiped out. Northern Nigeria, which once had a thriving garments industry, was unable to
compete with low-cost imports. South Africa has similar problems; its manufacturing failed to grow
last year despite the continental boom.
This is partly the fault of governments. Buoyed by commodity income, they have neglected
industry's needs, especially for roads and electricity. But that, too, may at last be changing. Wolfgang
Fengler, a World Bank economist, says, "Africa is now in a good position to industrialise with the
right mix of ingredients." This includes favourable demography, urbanisation, an emerging middle
class and strong services. "For this to happen," he adds, "the continent will need to scale up its
infrastructure investments and improve the business climate, and many [African] countries have
started to tackle these challenges in recent years."
Kenya is not about to become the next South Korea. African countries are likely to follow a more
diverse path, benefiting from the growth of countless small and medium-sized businesses, as well as
some big ones. For the next decade or so, services will still generate more jobs and wealth in Africa
than manufacturing, which is fine. India has boomed for more than two decades on the back of
services, while steadily building a manufacturing sector from a very low base. Do not bet against
Africa doing the same.

113
Anonymous. (2008, August 9). Business: High Seas, high prices; Business in China. The Economist
Business: High seas, high prices; Business in China
Could rising shipping costs scupper China's export boom? This question has been much discussed
since Jeff Rubin and Benjamin Tal of CIBC, a Canadian bank, issued a memo a few weeks ago
saying that a reversal of the great migration of manufacturing operations to China might already be
under way. The cost of shipping a standard 40-foot container from Shanghai to America's east coast,
for example, has jumped from $3,000 in 2000 to about $8,000 today. The extra cost of transporting
goods halfway around the world, Messrs Rubin and Tal wrote, is wiping out the often slim margins
of Chinese exporters. What is more, if oil and shipping prices stay high, many Western companies
that now outsource their manufacturing to China might decide that it makes more sense to shift
production closer to their customers at home. Such scenarios would entail a huge shift in global
trade patterns.
How much will rising shipping costs hurt Chinese manufacturing?
ON LAND, high oil prices have ended America's love affair with sport-utility vehicles, forcing
carmakers to revamp their product line-ups. In the air, sky-high fuel costs have prompted airlines to
raise ticket prices and cut routes. What about at sea? Could rising shipping costs scupper China's
export boom?
This question has been much discussed since Jeff Rubin and Benjamin Tal of CIBC, a Canadian
bank, issued a memo a few weeks ago saying that a reversal of the great migration of manufacturing
operations to China might already be under way. The cost of shipping a standard 40-foot container
from Shanghai to America's east coast, for example, has jumped from $3,000 in 2000 to about
$8,000 today. The extra cost of transporting goods halfway around the world, Messrs Rubin and Tal
wrote, is wiping out the often slim margins of Chinese exporters. What is more, if oil and shipping
prices stay high, many Western companies that now outsource their manufacturing to China might
decide that it makes more sense to shift production closer to their customers at home.
Such scenarios would entail a huge shift in global trade patterns. Stephen Jen of Morgan Stanley, an
investment bank, says higher shipping costs could even sound the death knell of the entire East
Asian export model. This is because so many of the finished goods that China exports to America
and Europe are made from components imported from Taiwan, Japan or South Korea. Clearly,
affordable transport costs are an essential ingredient in this regional production matrix.
Exporters in China are certainly feeling the pain of higher shipping costs. The Transpacific
Stabilisation Agreement bunker charge, a benchmark fuel surcharge imposed by shipping firms on
sea freight, has risen from $455 per 40-foot equivalent unit in January 2007 to $1,130. Shipments to
Europe face similar increases. In the first half of 2008 the growth rate of Chinese exports slowed to
21.9% from 27.6% a year earlier. In Guangdong province, the traditional heart of China's export
manufacturing, growth plunged to 13% from 26.5%.
But if there is a migration of manufacturing from China, it is hardly an exodus. Even the latest trade

114
figures do not show a fall in Chinese exports--only a drop in their pace of growth. And this can be
attributed to a number of factors, including China's stronger currency (up almost 7% against the
dollar this year), upward pressure on domestic wages, less generous Chinese government incentives
for low-end exporters and weakening foreign demand.
There are already signs that Chinese officials are rethinking their "get tough" policy towards
manufacturers of cheap goods. On August 1st the finance ministry increased export-tax rebates on a
range of clothing products from 11% to 13%, and on bamboo products from 5% to 11%, in an
apparent effort to help exporters of cheap goods. The closure of thousands of small factories is
clearly worrying officials.
As for shipping costs, many companies in China export on a "free on board" basis. So theoretically
it is the buyers on the other side of the ocean who must absorb the higher fuel surcharges on freight.
Of course, they are forcing sellers to share some of the cost. But large bulk purchasers, such as
Home Depot or Wal-Mart, are also squeezing the shipping companies to keep the overall bill down.
On balance, higher shipping costs are "not as big a factor" as the rising yuan or cost of raw
materials, says an executive in the Shanghai office of an American building-materials company which
exports Chinese-made goods to America, India and Australia. For a typical pair of Chinese-made
shoes sold in America, shipping accounts for only 3-4% of the price.
Besides, companies will not find it easy to move their manufacturing out of China. Norman Cheng,
co-founder of Strategic Sports, one of the world's largest motorcycle and bicycle helmet-makers,
with two factories in Guangdong, says if he shifted production out of China, he would have to set
up factories in his two biggest markets, North America and Europe. Shipping costs would fall, but
labour costs would rise and there would be fewer economies of scale.
So China's manufactured-export industry does not seem to be in imminent danger. Few companies
will take the decision to leave China lightly, especially when no one knows if the price of oil will hit
$200 or fall back to $100 in the coming months. A senior manager at a large Chinese electronics
company, with four factories abroad, says higher shipping costs instead "give us urgency and an
incentive to become significantly more efficient and competitive". Foreign and local firms can also
divert production to China's fast-growing domestic market. There is no doubt that oil at $200 would
have dire consequences, both for Chinese exporters and for other firms. But given the impact on the
world economy, higher shipping costs might be the least of their worries.

115
Anonymous. (2008, September 20). Business: On your bike; Giant Manufacturing. The Economist
Business: On your bike; Giant Manufacturing
Obesity and high oil prices are good news for the world's biggest bikemaker
THESE are tough times for carmakers, many of which are labouring under high oil prices, slowing
demand and financial weakness. For makers of human-powered, two-wheeled vehicles, by contrast,
business is booming. Giant Manufacturing, the world's largest bicycle-maker, sold a record 460,000
units last month and is heading for its best year ever. Such is the demand for bikes that shortages
were reported in New York earlier this year. In Taiwan, Giant's home market, supply is tighter still:
for many models, buyers put down deposits months before their bikes come off the assembly line.
After a slow 2006, sales took off last year in Europe and America as fuel prices shot up. Suddenly a
bicycle seems like the remedy for many modern ills, from petrol prices to pollution and obesity.
Each market has its own idiosyncrasies. Europeans mainly use bikes for commuting, but have the
odd habit of ignoring models made explicitly for that purpose in favour of sleeker, faster models
which are then expensively modified. Americans prefer off-road BMX trail bikes. Taiwanese
demand is led by racing-style bikes used for exercise.
Giant, as the largest producer, makes everything for every market. Its share price has held up fairly
well despite stockmarket turmoil and dramatically higher costs for raw materials, notably aluminium.
Strong demand and a desire for better bikes have allowed bikemakers to pass higher material costs
on to buyers. Since 2004 wholesale prices of bikes have gone up by 23% in Europe, 45% in America
and almost 50% in Asia, even as thousands of low-cost factories in China, including some run by
Giant, churn out boatloads of cheap bikes.
Giant began in 1972, taking advantage of low-cost Taiwanese labour to make bicycles for foreign
firms as well as domestic buyers. A critical early order came from Schwinn, the dominant American
brand of the time, which wanted to reduce its dependence on a factory in Chicago that was beset by
poor labour relations and low productivity. After contracting out to Giant proved successful,
Schwinn shifted its orders to a factory in southern China. But quality was poor, deliveries were late
and Schwinn slid into bankruptcy. (It is now owned by Dorel Industries of Canada.)
Meanwhile, having started out as a low-cost manufacturer, Giant was moving upmarket. Even its
cheapest bikes, which are sold in China, are relatively expensive (at around $100), yet Giant has the
largest market share, at around 7%, according to Deutsche Bank. Globally, Giant is one of a handful
of big companies that can make frames and forks (the most important components of a bicycle) out
of sophisticated alloys and carbon fibre. Components from other manufacturers are then added to
the frame. The resulting bikes are sold under Giant's own name, or under contract to big customers
in Europe and America.
Because frame- and component-makers are happy to sell to potential competitors, there are in effect

116
no barriers to entry to the bike business--all that is needed is a brand name. As a result, competition
is brutal. Capturing customers at volume, and at ever-higher prices, requires an unending series of
improvements. Giant will soon begin distributing a new frame with built-in lightweight shock-
absorbers, which should appeal to riders on potholed streets and off-road trails. Details of the
design remain a secret, because good ideas are commonly copied within a year. By then, Giant must
come up with a further innovation. It is the only way to survive.

117
Anonymous. (2008, August 9). Business: High Seas, high prices; Business in China. The Economist
Business: High seas, high prices; Business in China
Could rising shipping costs scupper China's export boom? This question has been much discussed
since Jeff Rubin and Benjamin Tal of CIBC, a Canadian bank, issued a memo a few weeks ago
saying that a reversal of the great migration of manufacturing operations to China might already be
under way. The cost of shipping a standard 40-foot container from Shanghai to America's east coast,
for example, has jumped from $3,000 in 2000 to about $8,000 today. The extra cost of transporting
goods halfway around the world, Messrs Rubin and Tal wrote, is wiping out the often slim margins
of Chinese exporters. What is more, if oil and shipping prices stay high, many Western companies
that now outsource their manufacturing to China might decide that it makes more sense to shift
production closer to their customers at home. Such scenarios would entail a huge shift in global
trade patterns.
How much will rising shipping costs hurt Chinese manufacturing?
ON LAND, high oil prices have ended America's love affair with sport-utility vehicles, forcing
carmakers to revamp their product line-ups. In the air, sky-high fuel costs have prompted airlines to
raise ticket prices and cut routes. What about at sea? Could rising shipping costs scupper China's
export boom?
This question has been much discussed since Jeff Rubin and Benjamin Tal of CIBC, a Canadian
bank, issued a memo a few weeks ago saying that a reversal of the great migration of manufacturing
operations to China might already be under way. The cost of shipping a standard 40-foot container
from Shanghai to America's east coast, for example, has jumped from $3,000 in 2000 to about
$8,000 today. The extra cost of transporting goods halfway around the world, Messrs Rubin and Tal
wrote, is wiping out the often slim margins of Chinese exporters. What is more, if oil and shipping
prices stay high, many Western companies that now outsource their manufacturing to China might
decide that it makes more sense to shift production closer to their customers at home.
Such scenarios would entail a huge shift in global trade patterns. Stephen Jen of Morgan Stanley, an
investment bank, says higher shipping costs could even sound the death knell of the entire East
Asian export model. This is because so many of the finished goods that China exports to America
and Europe are made from components imported from Taiwan, Japan or South Korea. Clearly,
affordable transport costs are an essential ingredient in this regional production matrix.
Exporters in China are certainly feeling the pain of higher shipping costs. The Transpacific
Stabilisation Agreement bunker charge, a benchmark fuel surcharge imposed by shipping firms on
sea freight, has risen from $455 per 40-foot equivalent unit in January 2007 to $1,130. Shipments to
Europe face similar increases. In the first half of 2008 the growth rate of Chinese exports slowed to
21.9% from 27.6% a year earlier. In Guangdong province, the traditional heart of China's export
manufacturing, growth plunged to 13% from 26.5%.

118
But if there is a migration of manufacturing from China, it is hardly an exodus. Even the latest trade
figures do not show a fall in Chinese exports--only a drop in their pace of growth. And this can be
attributed to a number of factors, including China's stronger currency (up almost 7% against the
dollar this year), upward pressure on domestic wages, less generous Chinese government incentives
for low-end exporters and weakening foreign demand.
There are already signs that Chinese officials are rethinking their "get tough" policy towards
manufacturers of cheap goods. On August 1st the finance ministry increased export-tax rebates on a
range of clothing products from 11% to 13%, and on bamboo products from 5% to 11%, in an
apparent effort to help exporters of cheap goods. The closure of thousands of small factories is
clearly worrying officials.
As for shipping costs, many companies in China export on a "free on board" basis. So theoretically
it is the buyers on the other side of the ocean who must absorb the higher fuel surcharges on freight.
Of course, they are forcing sellers to share some of the cost. But large bulk purchasers, such as
Home Depot or Wal-Mart, are also squeezing the shipping companies to keep the overall bill down.
On balance, higher shipping costs are "not as big a factor" as the rising yuan or cost of raw
materials, says an executive in the Shanghai office of an American building-materials company which
exports Chinese-made goods to America, India and Australia. For a typical pair of Chinese-made
shoes sold in America, shipping accounts for only 3-4% of the price.
Besides, companies will not find it easy to move their manufacturing out of China. Norman Cheng,
co-founder of Strategic Sports, one of the world's largest motorcycle and bicycle helmet-makers,
with two factories in Guangdong, says if he shifted production out of China, he would have to set
up factories in his two biggest markets, North America and Europe. Shipping costs would fall, but
labour costs would rise and there would be fewer economies of scale.
So China's manufactured-export industry does not seem to be in imminent danger. Few companies
will take the decision to leave China lightly, especially when no one knows if the price of oil will hit
$200 or fall back to $100 in the coming months. A senior manager at a large Chinese electronics
company, with four factories abroad, says higher shipping costs instead "give us urgency and an
incentive to become significantly more efficient and competitive". Foreign and local firms can also
divert production to China's fast-growing domestic market. There is no doubt that oil at $200 would
have dire consequences, both for Chinese exporters and for other firms. But given the impact on the
world economy, higher shipping costs might be the least of their worries.

119
Anonymous. (2008, September 20). Business: On your bike; Giant Manufacturing. The Economist
Business: On your bike; Giant Manufacturing
Obesity and high oil prices are good news for the world's biggest bikemaker
THESE are tough times for carmakers, many of which are labouring under high oil prices, slowing
demand and financial weakness. For makers of human-powered, two-wheeled vehicles, by contrast,
business is booming. Giant Manufacturing, the world's largest bicycle-maker, sold a record 460,000
units last month and is heading for its best year ever. Such is the demand for bikes that shortages
were reported in New York earlier this year. In Taiwan, Giant's home market, supply is tighter still:
for many models, buyers put down deposits months before their bikes come off the assembly line.
After a slow 2006, sales took off last year in Europe and America as fuel prices shot up. Suddenly a
bicycle seems like the remedy for many modern ills, from petrol prices to pollution and obesity.
Each market has its own idiosyncrasies. Europeans mainly use bikes for commuting, but have the
odd habit of ignoring models made explicitly for that purpose in favour of sleeker, faster models
which are then expensively modified. Americans prefer off-road BMX trail bikes. Taiwanese
demand is led by racing-style bikes used for exercise.
Giant, as the largest producer, makes everything for every market. Its share price has held up fairly
well despite stockmarket turmoil and dramatically higher costs for raw materials, notably aluminium.
Strong demand and a desire for better bikes have allowed bikemakers to pass higher material costs
on to buyers. Since 2004 wholesale prices of bikes have gone up by 23% in Europe, 45% in America
and almost 50% in Asia, even as thousands of low-cost factories in China, including some run by
Giant, churn out boatloads of cheap bikes.
Giant began in 1972, taking advantage of low-cost Taiwanese labour to make bicycles for foreign
firms as well as domestic buyers. A critical early order came from Schwinn, the dominant American
brand of the time, which wanted to reduce its dependence on a factory in Chicago that was beset by
poor labour relations and low productivity. After contracting out to Giant proved successful,
Schwinn shifted its orders to a factory in southern China. But quality was poor, deliveries were late
and Schwinn slid into bankruptcy. (It is now owned by Dorel Industries of Canada.)
Meanwhile, having started out as a low-cost manufacturer, Giant was moving upmarket. Even its
cheapest bikes, which are sold in China, are relatively expensive (at around $100), yet Giant has the
largest market share, at around 7%, according to Deutsche Bank. Globally, Giant is one of a handful
of big companies that can make frames and forks (the most important components of a bicycle) out
of sophisticated alloys and carbon fibre. Components from other manufacturers are then added to
the frame. The resulting bikes are sold under Giant's own name, or under contract to big customers
in Europe and America.
Because frame- and component-makers are happy to sell to potential competitors, there are in effect

120
no barriers to entry to the bike business--all that is needed is a brand name. As a result, competition
is brutal. Capturing customers at volume, and at ever-higher prices, requires an unending series of
improvements. Giant will soon begin distributing a new frame with built-in lightweight shock-
absorbers, which should appeal to riders on potholed streets and off-road trails. Details of the
design remain a secret, because good ideas are commonly copied within a year. By then, Giant must
come up with a further innovation. It is the only way to survive.

121
Anonymous. (2008, November 29). On your bike; transport in Africa. The Economist
International: On your bike; Transport in Africa
Cycling has never really taken off in Africa. Africans tend to turn their back on bikes as soon as they
can afford anything with an engine. Yet, with low purchase and running costs, the humble bike
could be a key to mobilising rural Africans and unclogging the cities. One problem is that few bikes
are manufactured in Africa. An American bike-maker, Craig Calfee, and a group of scientists at the
Lamont-Doherty Earth Observatory in New York, aim to introduce and sell bamboo bikes in
Africa.
A scheme to encourage cheap transport on two wheels
PEDAL power has never really taken off in Africa. Cycling enthusiasts blame the sweltering heat,
potholes, and the dumping of Chinese bikes unsuitable for glutinous dirt roads for the ascendancy
of belching minivans, even over short distances. Still, bike-crazy pockets of the continent show what
is possible. Smugglers on the Kenya-Uganda border popularised the boda-boda taxi (originally,
border-border) in the 1970s: boda-bodas still ply village-to-market routes across Africa's Great Lakes
region, carrying passengers or sacks of maize on their often funereal velveteen back seats.
Groups of concerned cyclists in Europe and America have long shipped containers of used bikes to
Africa but this bike aid has yet to roll into a movement with critical mass. Indeed, Africans tend to
turn their back on bikes as soon as they can afford anything with an engine. The bike has suffered
from the indifference of car-driving rulers. There are hardly any bike paths; few people campaign for
pedalling. Cyclists rarely contribute to their own safety. Helmets and reflectors or lights at night are
rare. Maintenance is invariably slapdash. Yet, with low purchase and running costs, the humble bike
could be a key to mobilising rural Africans and unclogging the cities.
One problem is that few bikes are manufactured in Africa. Some charities customise bikes for rural
health workers. A more ambitious plan, led by an American bike-maker, Craig Calfee, and a group
of scientists at the Lamont-Doherty Earth Observatory in New York, aims to introduce and sell
bamboo bikes in Africa.
Bamboo has a higher tensile strength than steel and can be taped together with natural fibre and
resin. A finished frame should be light, easy to handle and ideal for carrying goods. Production is set
to begin next year in Ghana's second city, Kumasi, in the hope of selling bikes for $55 on a business
plan backed by KPMG, an accountancy firm. Material will come from bamboo forests in the
surrounding Ashanti region, with wheels and other parts imported. If the Kumasi bike proves
durable, workshops across Africa could start turning out their own versions.

122
Anonymous. (2012, November 7). Re-cycling: Cardboard bicycles. The Economist.
Re-cycling: Cardboard bicycles
Mr Gafni's target market is the poorer countries of the world. Since manufacturing the cardboard
bike will, he reckons, cost $9-12 a unit, his velocipedes should find demand which metal bikes
cannot.
A bicycle made of cardboard may spread cycling to places it does not now reach
THE first bicycles were made of wood. After that, manufacturers used steel tubes. These days, for
high-end bikes where weight is at a premium, they turn to aluminium alloys or even to carbon fibre.
But Izhar Gafni, an amateur cyclist who owns a number of such high-end bikes, wonders whether
the original inventors had a point. He proposes to go back to using wood--or, rather, a derivative of
wood, namely cardboard.
Mr Gafni, who is based in Ahituv, Israel, spent years trying to work out how to make a cardboard
bicycle able to support the weight of a human being. The trick is twofold. First, he folds the
cardboard--commercial-grade material, made from recycled paper--to increase its strength. (He
worked out the exact pattern of folding for each of the machine's components using the principles
of origami.) Then, once it is folded, he treats the result with a proprietary resin that holds it in shape
and stiffens it, before cutting it into the form of the component required. A second application of
resin renders the component waterproof, and a lick of lacquer makes it look good. The result, Mr
Gafni claims, is stronger than carbon fibre.
The bike's frame, wheels, handlebars and saddle are all made of cardboard in this way, and then
fitted together. The tyres--again harking back to the early days of cycling--are composed of solid
rubber, recycled from old car tyres. That makes the ride a little harder than if they were pneumatic,
but means they cannot be punctured.
The chain, whose design is based on the timing belt of a car, is also made from car-tyre rubber. The
pedals are plastic recycled from bottles. And the brakes are also recycled materials, though Mr Gafni
is not yet ready to disclose exactly what. The finished product weighs 9kg and can carry a rider
weighing 220kg.
Mr Gafni's target market is the poorer countries of the world. Since manufacturing the cardboard
bike will, he reckons, cost $9-12 a unit, his velocipedes should find demand which metal bikes
cannot. But people in rich countries may be interested too. In Tel Aviv, the commercial capital of
Mr Gafni's native land, 2,000 stolen bikes were recently put on display by police, for their owners to
claim. If bicycles cost less than the locks that chained them to lampposts, it might cease to be
worthwhile stealing them.

123
Anonymous. (2013, March 30). The last of the metal-bashers; Manufacturing towns. The Economist
The last of the metal-bashers; Manufacturing towns
In odd corners of the country British industry clings on
TO WALK into Devonshire Dock Hall, in Barrow-in-Furness, a town of 70,000 in England's north-
west, is to walk into the heart of a community. Some 260 metres long, this cathedral of industry
houses three part-built grey and black nuclear submarines. Workers in blue overalls and hard hats
are busy assembling the vast machines. Among them are "fourth- or even fifth-generation
shipbuilders", says Alan Dunn, the operations director at the plant. "When people here go to the
pub, they talk about submarines. The yard dominates everything we do."
In most parts of Britain, manufacturing has all but disappeared in the past half-century. In 1997
about 4.4m people worked making things; now, just 2.8m do. North of Birmingham the urban
landscape is characterised by redundant factories and the glitzy regeneration schemes intended to
replace them. And yet in a few places, such as Barrow-in-Furness in Cumbria, or Pendle in
Lancashire by the Yorkshire Dales, manufacturing and engineering continue to thrive. If there ever
is a new "march of the makers", as George Osborne, the chancellor of the exchequer, hopes, these
places will be where they head for.
In Barrow 33% of male employment is in manufacturing and engineering--mostly at BAE Systems
(virtually all the manufacturing employees there are male). In Pendle the figure is 29%, many in small
and medium-sized aerospace and high-tech businesses which cluster around a Rolls-Royce factory.
In Corby, a former steel town in Northamptonshire, a sprawl of factories processing food and
fashioning steel tubes employ a quarter of the population. All three offer lessons about how to
succeed in manufacturing in Britain today.
The first condition is to have a long history of making things. Like its neighbour, Burnley, Pendle's
industry has its roots in the 19th-century cotton trade: many of its newer businesses still operate out
of revamped historic mills. At the centre of Barrow-in-Furness is a grid of spectacularly grand
redbrick Victorian buildings, erected by the entrepreneurs who founded the town to exploit nearby
iron-ore and coal reserves to smelt steel and build ships. Corby grew up as a post-war new town
around a 1930s steel works.
But a bit of government intervention also helps. Barrow would no doubt have gone the way of
Britain's other shipbuilding towns without Ministry of Defence orders for submarines. Pendle's
aerospace businesses, though now largely independent of government demand, owe their existence
to a decision to relocate aircraft manufacturing out of range of the Luftwaffe in the second world
war. Corby had the first of the enterprise zones the government created in the 1980s.
Such history provides a pool of skilled labour, as well as lots of suitable sites for industry. The
quality of the workforce is especially important in places such as Barrow and Pendle, which are far

124
away from big cities and where the businesses are more high-tech. But it probably helps in Corby
too, as even low-tech manufacturing operations tend to need a good number of trained engineers
and technicians. Highly skilled workers maintain the competitiveness of local businesses, but they
also help new ones set up, both because they attract outside investors and because ex-employees
start their own firms.
Unfortunately, this skilled workforce is an extraordinarily fragile resource, which may help explain
why Britain has so few manufacturing clusters left. Barrow's shipyard is still recovering from the late
1990s, when defence cuts led to an exodus of valuable staff. When people leave, it is hard to get
them to move back, says John Hudson, the submarines director at BAE Systems. Even if engineers
want to return, there is too little in these isolated and monochromatic economies for their wives (or
husbands) to do. Dennis Mendoros, the founder of Euravia, a company in Pendle which services
aircraft engines, complains bitterly that too many engineering graduates prefer to become bankers or
management consultants in London.
Local loyalty is one thing that can overcome the capital's pull. All three places now have enormous,
new, factory-like technical colleges, and in Pendle and Barrow, at least, most talent is home-grown.
In Barrow 97% of people identified themselves as "white British" in the 2011 census. In Pendle the
taxi drivers wear salwar kameez and speak Urdu but they are almost all British-born. Only Corby,
which is far closer to London, has had much immigration in recent years.
Without manufacturing, these places might well have little work at all. Barrow-in-Furness and
Pendle in particular are too far from big cities to support the service-sector businesses that Britain
does so well. None of the three has a university to attract and retain high-flying professionals. Small-
town life does not appeal to many young people--even though in Pendle newly-qualified technicians
can buy pretty Victorian terraced houses at the age of 21 and spend their weekends hiking and
cycling in the mountains. Secure jobs support local pubs and shops, and entrepreneurs live in the
homes of the old mill-owners.
More could be done to boost growth. As he shows off his machines, Ian Weatherill, the co-owner of
Hope Technology, a bicycle-parts firm in Pendle, says that he has repeatedly been told to transfer
production overseas to cut costs (he has ignored this advice). Barrow-in-Furness will be lost if
demand for submarines ever dries up--and yet it lacks basic infrastructure improvements that might
attract new businesses. Of the three, Corby's jobs are probably the most sustainable, but they are
also the worst paid and least enjoyable, and increasingly done by immigrants.
It may be too much to hope for a manufacturing renaissance. In Mr Weatherill's converted old mill,
where once hundreds of workers would have sat at their looms, tens of robot lathes now hum under
the watchful eyes of barely a dozen supervisors. Most manufacturing has become too mechanised
and competitive to employ large numbers of people. But in the past two decades valuable skills were
lost through heedlessness: the government let apprenticeship programmes fade into nothingness

125
while companies often pursued short-term profits at the expense of long-term capability. If a little of
the damage could be undone, it would at least secure the future of the last industrialised corners of
Britain.
126
The New York Times
Bilton, N. (2013, October 21). Start-Up Reinvents the Bicycle Wheel. Retrieved on February 21,
2014 from The New York Times: http://bits.blogs.nytimes.com/2013/10/21/start-up-
literally-reinvents-the-bicycle-wheel/?action=click&module=Search®ion=search
Results%231&version =&url=http%3A%2F%2Fquery.nytimes.com%2Fsearch%2F
sitesearch%2F%3Faction%3Dclick%26region%3DMasthead%26pgtype%3DHomepage%2
6module%3DSearchSubmit%26contentCollection%3DHomepage%26t%3Dqry610%23%2
Fbicycle%2Bindustry%2Ffrom20060101to20140314%2Fallresults%2F2%2F
Start-Up Reinvents the Bicycle Wheel
It’s rare that a company comes along and reinvents the wheel, but it looks like that is about to
happen.
Superpedestrian, a start-up in Boston, announced on Monday that it has received $2.1 million in
financing to help build a wheel that transforms some standard bicycles into hybrid e-bikes.
The product, the Copenhagen Wheel, is a design from the Massachusetts Institute of
Technology SENSEable City Laboratory. The original goal of the wheel was to entice more people
to more bicycles in large cities in lieu of cars by giving them help from a motor.
“If you think about today’s cities, they have been developed for the scale of the automobile, with
people being required to travel great distances that are quiet large,” said Assaf Biderman, founder
of Superpedestrian and associate director of the SENSEable City Lab. “Most cities are built around
topographies that require motorized transport and it can make cycling and walking very difficult.”
Superpedestrian’s solution is to slip a motor into an existing analog product: the bicycle.
While the new wheel is still round, it has technology that makes it different from most normal bike
wheels.
The Copenhagen Wheel replaces the rear wheel of a bicycle. It includes a motor powered by a built-
in battery and sensors. When someone pedals with the new wheel in place, the bike uses sensors and
an app on a smartphone to measure the amount of effort the rider is putting into each pedal. It then
offers an additional boost when necessary.
One of the most interesting components of the new wheel is that the rider doesn’t need to tell the
bike when help is necessary, the wheel just figures it out using the sensors and gives the bike a push.
“Riding on a flat surface, or up a hill, will feel exactly the same,” Mr. Biderman said.
The wheel doesn’t need to be charged or plugged in on a nightly basis, either. Instead, the wheel
captures the energy from the brakes when a rider goes down hill and then stores that power in a

127
high-capacity lithium battery. The motor also acts like a generator, creating power for later rides
when the rider pedals in reverse.
The company said the wheel will last for 15 miles in each direction and will fit on most standard
bicycles.
Superpedestrian is expected to start taking orders for the wheel next month and will begin shipping
to customers at the start of next year.
The financing round is being led by Spark Capital with participation from David Karp, the founder
of Tumblr.

128
Farrell, S. (2009, June 9). Beater Bikes, the Cheap Workhorses of Cycling. Retrieved on February 20,
2014 from The New York Times: http://cityroom.blogs.nytimes.com/2009/06/09/beater-
bikes-the-cheap-workhorses-of-cycling/?action=click&module=Search®ion=
searchResults%2312& version=&url=http%3A%2F%2Fquery.nytimes.com%2Fsearch%2F
sitesearch%2F%3Faction%3Dclick%26region%3DMasthead%26pgtype%3DHomepage%2
6module%3DSearchSubmit%26contentCollection%3DHomepage%26t%3Dqry610%23%2
Fbicycle%2Bindustry%2Ffrom20060101to20140314%2Fallresults%2F13%2F
Beater Bikes, the Cheap Workhorses of Cycling
There is an old saying in New York bike circles that for the ultimate peace of mind for around-town
cycling (and parking), one should get a $100 lock and a $50 bike.
But in the newly cycling-obsessed New York, where until recently people were buying (or at least
trying to sell) $20,000 racing machines, or getting gussied up and mounting their $1,000 to $2,000
Dutch townies, can a bike even be had for $50?
That was the question Akshay Arora, a computer programmer, hoped to answer two Sundays ago.
Mr. Arora and hundreds of others attended the Brooklyn Bike Jumble, an outdoor bicycle swap
meet and show held on May 31 at the Old Stone House in J. J. Byrne Park. Billed as something of an
outdoor bicycle flea market, it seemed like an ideal place to find a very cheap bike.
Mr. Arora bypassed the tables of vintage racing bicycles and parts — his $50 was not going toward
an antique leather bike saddle.
“I don’t have a bike, and I don’t want to pay a bajillion dollars for one,” he said. He wanted
something to ride down to the store, to visit friends. Mr. Arora was after what is affectionately
known as a “beater bike.”
A free beater bike was available for the taking.
The beater is to the bicycle world what a well-worn Crown Victoria is to the automotive world, a
sturdy workhorse machine that can take a few knocks and keep going. The ideal beater can soak up
a few potholes, might repel thieves with its rust spots and will not break the bank.
“I think of a delivery bike,” said Patrick Tomeny, manager of the East Village shop of the nonprofit
Recycle-a-Bicycle organization. “Maybe something with some beat-up wheels; maybe one of the
brakes doesn’t work.”
Recycle-a-Bicycle routinely runs out of the refurbished used bikes it sells, and when they are in
stock, they cost $200 to $300, according to Mr. Tomeny, who notes that all of the bikes get full
overhauls. “It might look like beater, but it won’t ride like one.”

129
(Full disclosure, this Spokes reporter has volunteered with Recycle-a-Bicycle in the past.)
Those kinds of bike shop prices had already put Mr. Arora off. He had looked online, too, but
found Craigslist offerings “off the charts.”
Mr. Arora is not alone. Anyone who has perused New York City’s Craigslist ads has probably been
shocked by the going rates for what many cyclists would consider beaters.
The anonymous bicycle blogger bikesnobnyc has often called out egregious examples of overpriced
used bikes in a feature called “Worst of N.Y.C. Craigslist Bike Ads,” especially those converted into
the popular fixed-gear style.
And an ever-growing, somewhat snarky guide to selling used bicycles has been bouncing around the
nation’s Craigslists. The latest, a now 40-point list of dos and don’ts, recently appeared on the New
York Craigslist.
Point No. 2 goes straight to the beater conundrum: “A low-end bike that was $97 in 1976 is not
magically worth $400 now.”
Luckily for Mr. Arora, there were beaters to be had at the Brooklyn Bike Jumble, and they were
cheap.
Joel Flood, a salesman from Via Bicycle in Philadelphia, had driven a cargo van loaded with beaters
to the Brooklyn Bike Jumble. Via, Mr. Flood explained, travels the country buying up old bikes from
shops going out of business and from thrift stores.
The nicer ones get tune-ups and are sold at the Philadelphia shop for $150 to $250.
Mr. Flood’s wares were lined up under a tree. Many had already seen rough action. When an eager
customer accidentally knocked a handful of bikes over, domino style, no one seemed to mind. If
anything, it seemed proof that these were true beaters, worthy of their name.
Two hours into the event, most of the beaters he had parked under a tree were sold, most going for
less than $50.
Mr. Arora bought one Mr. Flood’s beaters, a teal Raleigh mountain bike with a bit of rust on the
spokes for $30.
“You can’t beat $30,” he said.

130
Cindy Tolan, a casting director who bought a green Sears three-speed bike for $30 from Mr. Flood,
agreed. She had also scored, somewhere on the other side of the swap, a lock for a $1. “It even has a
key,” she said.

131
Friedman, S. (2006, November 9). You Paid How Much for That Bike? Retrieved on February 20,
2014 from The New York Times: http://www.nytimes.com/2006/11/09/fashion/
09Fitness.html? pagewanted=print&action=click&module=Search®ion=searchResults
%230&version=&url=http%3A%2F%2Fquery.nytimes.com%2Fsearch%2Fsitesearch%2F
%3Faction%3Dclick%26region%3DMasthead%26pgtype%3DHomepage%26module%3DS
earchSubmit%26contentCollection%3DHomepage%26t%3Dqry610%23%2Fbicycle%2Bind
ustry%2Ffrom20060101to20140314%2F
You Paid How Much for That Bike?
IN April, two months before turning 39, Stacy Jargowsky decided to learn to ride a bicycle. So she
spent $9,000 for a brushed-silver custom-made bike called a Guru. “If I can only have one, I feel like
it should be the best,” she said. It was made of titanium, which — gearhead chatter about high
performance, ultralight strength and lifetime durability notwithstanding — is as incredibly cool as it
sounds. (Try saying “I’m taking my titanium Guru out for a spin today.” Don’t you feel better?)
A few months later, Ms. Jargowsky, who works for Flybar, a pogo-stick manufacturer, spent $10,000
for another custom-made cycle. “They kind of become like pets,” she said. “Once you have one, you
want to get another.” This time she bought a Cervelo, made of carbon fiber. It’s black. Carbon,
according to many in the gearhead community, is even cooler than titanium.
That Ms. Jargowsky spent the equivalent of a few years’ tuition at a perfectly respectable state
university to buy two bikes when she barely knew how to ride may strike some people as — let’s be
honest here — floridly insane. Then again, people who raise their eyebrows at titanium Gurus and
the men and women who love them like pets, it is safe to say, have not been paying attention to
what’s been happening at the upper end of the cycling market in Manhattan.
“You go to Central Park and there are all these expensive custom-made bikes, and they’re not just
for the bike geeks anymore,” said Noah Budnick, a deputy director at Transportation Alternatives, a
nonprofit group that lobbies for bicycle-friendly laws in New York City. “You have these corporate
guys now. I like to say that bicycling is the new golf.”
Nationwide, demand for specially made bikes is higher than ever. “Custom bike sales are on the rise,
and we’re nowhere near the saturation point yet,” said Megan Tompkins, the editor of Bicycle
Retailer and Industry News, a trade magazine.
Lance Armstrong’s seven Tour de France victories provide one explanation why the road bike has
seized back ground it had lost to mountain bikes in the ’80s and ’90s.
Another reason: aging baby boomers with worn-out knees have embraced cycling as a low-impact,
aerobically demanding alternative to cartilage-grinding sports like basketball and tennis. The
explosive growth of triathlons, whose participants need bicycles that will perform at long distances,
has created tens of thousands more buyers since 2000. Finally — and not to be underestimated,
132
especially in Manhattan — rich people like to buy cool things.
It’s no secret to anyone who has ever endured an encounter with a grease-stained, eye-rolling,
heavily sighing bicycle shop employee that customer service in the industry has historically ranged
from sullen to supercilious to overtly hateful. (“It’s one of the few retail industries where a condition
for employment seems to be utter contempt for the customer,” said one industry executive.)
Perhaps that’s why many local sellers of custom bikes are newcomers to the market and eager to
cater to a discriminating clientele. In January, JackRabbit, based in Brooklyn, opened a store at 42
West 14th Street, near Union Square. It traffics almost exclusively in custom bicycles, mostly carbon
and titanium. So does two-year-old SBR MultiSports, at 203 West 58th Street, where Ms. Jargowsky
bought her bikes. Signature Cycles opened its appointment-only store at 80 West End Avenue in
February.
Although Altheus Cycling and Endurance Center, based in Rye, N.Y., closed its Union Square
branch this week, Tom Crawford, the store’s president, said the company plans to open at least one
Manhattan outpost in 2007. In mid-April, another store that specializes in custom bicycles, Cadence
Cycling and Multisport Centers in Philadelphia, will open an 11,000-square-foot store at 174 Hudson
Street.
Customers who buy bikes at any of these shops first undergo an interrogation that bears more
similarity to an adoption proceeding than to a bicycle purchase. What are their hopes for their new
bicycle? What are their dreams? After the discussion comes the hallmark feature of the custom bike
experience: the fitting. An assessment can last one to five hours, and — depending on the store —
may involve computerized pedaling analysis, range-of-motion tests and individually designed insoles
for cycling shoes (all for $200 to $375).
The cheapest bike at any of the stores costs about $1,600 (a single-speed aluminum road bike), and
the most expensive, $23,000 (a carbon time-trial bike sold at Signature Cycles that comes with
handmade German wheels at $5,500 a set).
If traditional bicycle shops are to SBR, Altheus and JackRabbit as coach is to first class, then
Signature Cycles is a Gulfstream jet. “Very, very boutique,” David Jordan, a cycling coach and
former professional racer, said of Signature Cycles. He said that Paul Levine, Signature’s owner, will
“offer you a glass of Courvoisier while you discuss your cycling habits.”
At Signature Cycles’ Manhattan store (there is also a branch in Central Valley, N.Y.), there is a
massage table for range-of-motion analysis. There is an espresso machine. There is, at the bar,
Penfolds Shiraz and Maker’s Mark. Courvoisier, too. There is a shower, because the fitting can be
strenuous, and, as Grant Salter, an employee, said, “Our clients are Wall Street guys, and they don’t
want to go back to the office after a visit here and close a $5 million deal all sweaty and smelly.”

133
To cyclists for whom the phrase “close a $5 million deal” has approximately the same relevance as
“Why not take a weekend jaunt to the third moon of Jupiter,” bicycles like the ones sold at Signature
may represent nothing so much as the glittery and degraded signs of a gilded age’s inevitable decline.
Don’t tell that to custom bike owners, though.
A year ago, when Manny Vidal came to Signature Cycles, he was 42 and hadn’t been on a road bike
for 20 years, and, at 5 feet 11 inches, weighed 260 pounds. He would go to the gym once or twice a
week. He felt tired often.
Since buying his $10,000 gray titanium-and-carbon Serotta, Mr. Vidal, the chief executive of Vidal
Partnership, which specializes in advertising in the Hispanic market, has lost more than 40 pounds.
He rides at least 5 days a week for 90 minutes.
Mr. Vidal admits that his Serotta is sometimes more than just something he pedals. “Oh, it’s
definitely an accessory,” he said. “People stop you and comment on the bike. They’ll want to talk
about it, ask you about it. They’re the same kinds of looks I used to get when I drove a Porsche.”
Ms. Jargowsky, who rides 60 to 70 miles a week, also confesses to a special bond with her bikes.
“The first time I had to check my triathlon bike for my race, I really noticed it missing in my home,”
said Mr. Jargowsky, who finished three triathlons this summer. “I would look out in the hallway and
it wasn’t there. It was kind of sad.”
An accessory? Sad? Are these the sentiments of serious cyclists or well-heeled fanatics? Is there a
difference? Dr. David Levine, an orthopedic surgeon at the Hospital for Special Surgery in
Manhattan, took up cycling three years ago. Now 39, he rides three or four laps around Central Park
every weekday morning, with a group of other doctors from the hospital. They average about 16
minutes for a 6-mile lap, or 22.5 miles an hour. Dr. Levine (no relation to Paul, the Signature Cycles
owner) rides a carbon Colnago, which he got from an Italian anesthesiologist who, he said, “has a
nice connection to a bike shop in Como.”
Yes, he said, riders of high-end bikes notice other high-end bikes. Is there wheel envy? “I’m not sure
I’d call it that,” he said, adding that it’s more a matter of proud owners comparing the advantages of
their bikes’ technology.
Dr. Levine bristled slightly when it was suggested that people like him may be a little, um, obsessed
with what is, after all, just a bicycle.
“You do feel a connection with it,” he said. “But I don’t think anyone in our group takes it to a
psychotic, unreasonable extent.”
He paused. “But my wife might disagree with that.”

134
Grossman, J. (2010, June 2). Make Bikes in the U.S. or Go Abroad to Cut Costs? Retrieved on
February 20, 2014 from The New York Times: http://www.nytimes.com/2010/06/03/
business/ smallbusiness/03sbiz.html?action=click&module=Search®ion=search
Results%230&version=&url=http%3A%2F%2Fquery.nytimes.com%2Fsearch%2Fsitesearc
h%2F%3Faction%3Dclick%26region%3DMasthead%26pgtype%3DHomepage%26module
%3DSearchSubmit%26contentCollection%3DHomepage%26t%3Dqry610%23%2Fbicycle
%2Bmanufacturing%2Ffrom20060101to20140314%2F
Make Bikes in the U.S., or Go Abroad to Cut Costs?
A SMALL bicycle company for big riders, Super Sized Cycles, manufactures and adapts bicycles for
overweight riders who are too big for conventional bikes. The five-year-old business, which is based
in Vermont, had sales last year of $104,000.
THE CHALLENGE Joan Denizot, the founder, has been agonizing over whether to manufacture
bicycles in the United States or to import them from Asia at much lower costs.
THE BACKGROUND Her business is at a crossroads. Though she has increased sales through
her Web site every year, she remains barely in the black — and only by paying herself a pittance.
She has been seeking a marketing breakthrough that would enable her to expand her business and
thereby aid more people like herself.
“I’ve come to peace with the word fat,” she said. “I know for a lot of people that’s still a sensitive
word. But for me, it’s not a taboo word. It’s what I am. I weigh more than 225 pounds, quite a bit
more. I have lost some weight, but for me it’s more about being healthy.”
Her enterprise might be considered a niche business, except that it is aimed at a growing segment of
the population: the obese, who according to the Centers for Disease Control and Prevention,
number about one in every three adults.
Ms. Denizot started her company after trying in vain, while recuperating from gastric bypass surgery,
to exercise by biking, but could not find a bike that was comfortable and safe. “I’d get on bikes and
the tires would flatten,” she said.
Ms. Denizot looked for alternatives in bike shops. She searched the Internet and the sites she found,
she said, “talked about how much the bike weighed and the parts, but never about how much weight
the bike could carry.”
Ms. Denizot could have had a bike custom made for her and been done with it. But she wanted to
help others her size get moving, get healthier and spend more time outdoors with their children.
(She has four, all over 20 years old.)

135
Her bikes, which range from $699 to $3,395, feature broader, sturdier wheels and tires, wider seats
and pedal placement, and strong steel frames. She said one model can support riders weighing as
much as 550 pounds. Over all, she sells about 100 bikes a year.
She has added electric assist bikes to her line and is especially fond of the model she rides on hilly
dirt roads around her home near Burlington. Like several of the bikes she sells, this one is made by
another American manufacturer and upgraded to her standards.
That is also the case with the Big 29er, which has wheels three inches bigger than on standard bikes
and can accommodate riders as tall as 6-feet-7. Still, Ms. Denizot is banking on two models of her
own design, which are the standard-bearers for the company. These models, A New Leaf and Time
of Your Life, sell for $2,070.
Until recently, she made these core models entirely in the United States. But that drove up costs and
prices, prompting complaints from customers. Last year, following the advice of an investor who
provided the upfront money and the contact with an experienced overseas agent, Ms. Denizot had
70 of her New Leaf bikes manufactured in Taiwan. That move has left her wrestling with whether to
follow her heart (manufacture in the United States) or her head (build her proprietary designs
overseas).
THE OPTIONS A former employment counselor with the state of Vermont, Ms. Denizot, 52, has
not lost her social worker bent and would love to provide skilled manufacturing jobs and perhaps
apprenticeships to Americans. “There’s a lot to be said for helping a community and creating jobs
here, but I need to be competitive, and I need to make a quality product, too,” she said.
She was extremely pleased with the workmanship on the first shipment of bicycles from Taiwan.
And she was even happier with the per-bike price. Though one-time upfront costs tied to overseas
sourcing pushed her costs up, Ms. Denizot says she believes she could soon be paying $550 per bike,
fully assembled.
Currently, she pays $400 to $500 just for her custom bike frames, which are made in Iowa and then
shipped to the Vermont workshop of her master assembler — where the manufacturing costs of her
American-built bikes rise to $1,250.
On the other hand, manufacturing in the United States enables her to provide a level of
individualized customer service not easily matched by producing her bikes overseas. “As it is, people
call and say I’ve got this issue and that issue, and Tim Mathewson is so good he knows what to do
to make the bike right for that person,” she said, referring to her Vermont bike guru.
THE DECISION In the end, Ms. Denizot’s decision had a lot to do with the size of her business
(“still very much the Joan show”), which would render her talk of job creation moot. Moreover, the
size of her business leaves her ill-prepared to stave off the competition she anticipates.

136
“Eventually, the big bike builders are going to wake up,” Ms. Denizot said. “And when they do,
they’re not going to fool around with having them custom built in the U.S. They’re going to go
overseas and get them built. Will they be as good as mine? I don’t think so. But I’ll still have to be
competitive on price.”
Shifting manufacturing to Taiwan will position her to do that. Lower prices and increased sales, she
reasons, will create other opportunities. “Warehousing and distribution, marketing and telephone
sales — those are the kinds of jobs I can provide, and they will stay in America,” she said. “There
are tons of things I want to do.”
137
Huetteman, E and Harris, E. (2014, January 23). Walmart Fund to Support U.S. Manufacturing.
Retrieved on February 22, 2014 from The New York Times: http://www.nytimes.com/
2014/01/24/business/walmart-creates-10-million-fund-to-stimulate-american-
manufacturing.html?action=click&module=Search®ion=searchResults%
231&version=&url=http%3A%2F%2Fquery.nytimes.com%2Fsearch%2Fsitesearch%2F%3
Faction%3Dclick%26region%3DMasthead%26pgtype%3DHomepage%26module%3DSear
chSubmit%26contentCollection%3DHomepage%26t%3Dqry610%23%2Fbicycle%2Bmanu
facturing%2Ffrom20060101to20140314%2Fallresults%2F2%2F
Walmart Fund to Support U.S. Manufacturing
WASHINGTON — William S. Simon, chief executive of Walmart for the United States, said on
Thursday at the United States Conference of Mayors that the company was providing a $10 million
fund to promote American manufacturing in a public push to sell more American-made products.
The fund, to be distributed over five years, will award grants for new manufacturing processes and
help to encourage such projects in this country, a company spokeswoman said.
Early last year, Walmart said it would increase sourcing of American-made products by $50 billion
over a 10-year period, buying goods already made here and helping vendors bring production back
from overseas.
Showcasing Walmart’s power with manufacturers as the nation’s largest retailer, Mr. Simon told the
mayors that one of its suppliers, Kent International, a maker of bicycles, planned to move its
overseas operations to South Carolina, where it would create at least 175 jobs and assemble half a
million bikes annually by 2016.
This announcement comes in the face of a growing clamor for a higher minimum wage in the
United States. In November, White House officials said they would support an increase in the
federal minimum wage to $10.10, from $7.25 an hour, but fierce opposition in the Republican-
controlled House means that the chance of an increase, at least in the near term, are slim.
Major retailers and fast-food companies have said a higher minimum wage would force them to
reduce work force numbers or raise prices. Retail workers nationwide receive a median of about
$9.60 an hour, or less than $20,000 a year.
Mr. Simon said that the company had yet to analyze the effects that raising the minimum wage
would have on operational decisions and costs, but he speculated that it could lead to wage
compression or increased component costs.
“I think it addresses a symptom,” Mr. Simon said of proposals for an increase. “It doesn’t address
the illness.”
The company also said on Thursday that it would hold a second summit meeting on American

138
manufacturing in August. The first was last August.
Now is a time of transition at Walmart. Michael T. Duke, the chief executive of the entire company,
will retire in just a few days, to be succeeded by C. Douglas McMillon, who has been chief executive
of Walmart International for the last several years.
Mr. McMillon, a consummate company insider, joined Walmart in 1984, while Mr. Simon, who was
another possible candidate to succeed Mr. Duke, came to Walmart in 2006.
The transition is occurring at the end of what appears to have been a rocky holiday season for
retailers over all. While Walmart has not yet announced its holiday results, many companies have
been cutting their earnings forecasts and reporting slim growth over last year’s holiday season, or no
growth at all.
Going into the holiday season, Mr. Simon tempered expectations, warning that the income of
Walmart’s core customers was not keeping up with the cost of living. Given that landscape, Mr.
Simon said he expected “about as competitive of a market as we’ve ever seen.” Such price-slashing
can cut into a company’s profit margins, even at Walmart.

139
Rawsthorn, A. (2010, May 9). New York Museum Showcases Custom-Made Bicycles. Retrieved on
February 20, 2014 from The New York Times: http://www.nytimes.com/2010/05/10/
arts/10iht-design10.html?action=click&module=Search®ion=searchResults%232&
version=&url=http%3A%2F%2Fquery.nytimes.com%2Fsearch%2Fsitesearch%2F%3Factio
n%3Dclick%26region%3DMasthead%26pgtype%3DHomepage%26module%3DSearchSub
mit%26contentCollection%3DHomepage%26t%3Dqry610%23%2Fbicycle%2Bindustry%2
Ffrom20060101to20140314%2Fallresults%2F3%2F
New York Museum Showcases Custom-Made Bicycles
When Sacha White was cycling 60 miles a day as a bike messenger in Portland, Oregon, his bicycle
frame cracked and he took it to a repair shop. “Seeing the raw work in progress, the way the frame
went together and all of the joinery that’s usually concealed by paint, sparked something in me,” he
recalled. “I saved up for a year and a half to take a class in frame-building.”
He now makes some 40 bespoke bikes a year and sells them for $4,500 to $12,000 each at Vanilla
Bicycles, his Portland workshop, which has a five-year waiting list. Lots of people want to jump that
list, including Michael Maharam, co-owner of the eponymous American textile company and an avid
cycle collector. “I was trying to talk Sacha into selling me a bicycle and it wasn’t going very well,” he
said. “Then he revealed that he wanted to mark his tenth year in business by building a number of
bicycles and showing them. Did I have any idea where he might do that?”
Mr. Maharam had been invited to curate an exhibition at the Museum of Arts and Design in New
York, and suggested that he and Mr. White collaborate on a show of hand-built bicycles there. The
result is “Bespoke,” which opens Thursday featuring the work of Mr. White and five other builders
in 21 custom-made metal bikes, including a kid’s tricycle and a mud-splattered cyclocross racer.
Each bicycle is the product of weeks, sometimes months of skilled workmanship, starting with
several hours spent measuring the rider to determine the best possible dimensions for the frame.
Different builders then adopt distinctive approaches to making their bikes: sourcing materials and
components from favorite suppliers; developing their own techniques of bending, welding, carving
and wrapping; often inventing their own tools.
Every detail, from the way the tubes are joined together, to the style of painting, bears the builder’s
signature. “Each of these guys prides himself on being very, very singular,” noted Mr. Maharam.
“Like all great craftsmen, their personalities are reflected in their choice of materials, forms and
techniques.”
Mr. White is acclaimed for his finely worked “lugs” — the sockets on the ends of the tubes — each
of which is “brazed,” or bonded, in silver alloy. Whereas Dario Pegoretti, the Italian builder who is
the only non-American in the show, is renowned for pioneering the lug-less frame (he welds his
tubes together instead) and for his expressionistic paint work.

140
As for the others, Richard Sachs has devoted his career to perfecting the same type of racing bike,
always in steel, always in red. (The muddy cyclocross racer in “Bespoke” is his.) Jeff Jones specializes
in mountain bikes, but spurns suspension systems in favor of building sturdy frames and wheels that
“soften” any bumps and jolts. Peter Weigle produces rugged randonneur bikes, which are designed
for 100-mile, or 160-kilometer, rides and inspired by French models from the 1950s and 1960s.
While Mike Flanigan makes utility bikes for urban cyclists, equipping them with early 1900s-style
baskets, racks and bells.
Aesthetics apart, the main appeal of a bespoke bicycle is its fit. As every cyclist knows (and has often
learnt the hard way) the better a bike fits, the easier it is to ride. “An off-the-shelf bike can be made
to fit and will be fine, but it was designed to fit one body and one set of proportions,” explained Mr.
White. “If the stem is lengthened or the saddle moved, the rider may no longer be balanced above
the wheels, and the quality of the ride and handling of the bike will suffer. An experienced builder
will put the rider’s body in an ideal position and design the bike underneath them.”
Some argue that this isn’t enough. Cycling is a fiercely political field: Speed freaks. Techies.
Locavores. Sports junkies. Environmentalists. They and other bike nuts have equally impassioned,
often conflicting reasons for loving it. Some dismiss custom-built bikes like the ones in “Bespoke”
as frivolous distractions from the serious business of establishing bicycles as alternatives to cars.
“These bikes can be very beautiful, but aren’t necessarily better to ride, because the components can
be lower-tech than on industrial models,” said Jens Martin Skibsted, co-founder of Biomega, the
Danish cycle company. “Though a positive aspect of an exhibition like this is encouraging people to
view bicycles as aesthetic objects to be cherished, and enjoyed.”
It is interesting to ask why that hasn’t happened before — at least not outside cycling circles. The
bikes that are praised for their design merits tend to be industrial models, which excel in terms of
speed and convenience, not craftsmanship. While the process of building bicycles, even bespoke
ones, has seemed too oily and mechanical to be appreciated by the craft lobby, which has
traditionally disdained anything associated with machinery.
That’s changing. A new book, “The Arts of Industry in the Age of Enlightenment” by the British
historian, Celina Fox, is a useful reminder that machines were treasured for their beauty and
ingenuity in the late 1700s and early 1800s. (It wasn’t until the late 1800s that they were demonized.)
Another influence has been the emergence of software design as an intellectually dynamic medium
in which design and production are controlled by the same person. This has encouraged both the
craft and design craft camps to adopt the more eclectic, inclusive approach to their disciplines
advocated by the American sociologist Richard Sennett in his book “The Craftsman.” All of which
makes it seem rather timely to celebrate the craftsmanship of the “Bespoke” bikes.
As for Mr. Maharam, has he finally managed to bag one of Mr. White’s bikes? Well, sort of. “One
day I got an e-mail blast from Sacha’s studio saying that they’d come upon a frame built many years

141
ago — first come first served,” he recalled. “The e-mail arrived on my BlackBerry and I couldn’t
open the attachment with the specifications, so I just said: ‘I’ll take it.’ It’s a beautiful turquoise and
mustard frame in exactly my size. Amazing.”
142
Spiegel, J. (2009, January 1). A Surge in Bicyclists Appears to Be Waiting. Retrieved on February 20,
2014 from The New York Times: http://www.nytimes.com/2009/01/01/business/
smallbusiness/01sbiz.html?version=&action=click®ion=searchResults&pagewanted=pri
nt
A Surge in Bicyclists Appears to Be Waiting
After a summer of their dreams, bicycle store owners are facing a grim reality this winter.
Big increases in business this year led some shop owners to think that they were largely insulated
from a slowing economy. But the economy has continued to spiral downward, taking bicycle sales
and much else with it.
The question now is whether all the bicyclists who appeared last summer will be back next summer.
“This is not like the rest of the recessions we’ve been through,” said Jay Graves, who owns six Bike
Gallery stores in Portland, Ore., the first of which his father started in 1974.
Business skyrocketed last summer along with gasoline prices, Mr. Graves said, especially sales of
hybrid bikes that can be used for recreation and transportation. So Mr. Graves ordered plenty of
cold weather gear for what he believed would be legions of new bike commuters.
“We wished we hadn’t gone in quite as heavy,” Mr. Graves said. “Business is not growing at the rate
it was earlier in the year.”
Summer is high season anyway for bicycle store sales; Christmas sales are minuscule comparatively.
And double-digit increases in revenue for the stores last summer only underscored the
unpredictability of the business.
Industry analysts like Jay Townley, a partner with the Gluskin Townley Group, bicycle industry
consultants in Wisconsin, were skeptical even last summer that small bike stores would sustain their
surge in the off-season.
They said even then that bicycle store owners and managers who had made the same inventory
decision as Mr. Graves were misreading the indicators. What owners perceived to be a commuter
trend was probably not. The analysts argued that bicycle commuters were generally a fixed group.
These riders account for less than 1 percent of commuters in the United States; in isolated pockets
like Portland, they might account for about 6 percent.
Mr. Townley is even more skeptical now, predicting a flat to slightly down year for small bicycle
stores. Declining gas prices are one reason. He also cited major price increases in bicycles and
accessories resulting from the rising cost of materials and shipping — 98 percent of bicycles are
manufactured overseas — which cut into profits. He said data showed that wholesale sales of new
143
bicycles to shops for the first nine months of the year were down more than 4 percent.
“More people riding bikes has not translated into any improvement in bike business,” he said.
He said data going back to the 1960s showed that the bicycle industry did suffer during recessions.
“Is a consumer going to buy bikes or do anything the way they did in 2008 in the summer of 2009?”
Mr. Townley asked. “I don’t know.”
Since 1999, sales of bicycles in the United States have held steady at about 18 million a year,
including bicycles for children, according to data compiled by Gluskin Townley. Counting sales of
related parts and accessories, that adds up to about $6 billion a year.
In those same years, the number of small specialty bicycle stores dropped to about 4.300 now from
a little more than 6,000 in 2000. While those small stores account for only 17 percent of the bicycles
sold (the rest are sold by chain stores, mass merchants or on the Internet), they represent about 50
percent of the revenue.
The number of bicycles sold may surpass sales of motor vehicle this year, mainly because of the big
drop in demand for cars and trucks. The last time bicycle sales were stronger than motor vehicle
sales was in the early 1970s, in the midst of another recession, which was set off by the Arab oil
embargo.
Surveys by Bikes Belong, a group in Boulder, Colo., that advocates more bicycle riding, and Gluskin
Townley echoed observations of bicycle store owners and managers that the most pervasive, and
possibly the biggest, contributor to the summer bicycle business boom was in repairs. People were
dragging long-forgotten bikes out of basements and garages and fixing them up for recreation
because they were staying home instead of traveling.
Many stores said that they had to hire more mechanics. The most curious development was an
influx of bicycles so old that they caused a run on 27-inch tires, once an industry standard but largely
out of use since the early 1980s.
Peter Clark, 38, of Branford, Conn., brought his 1993 Trek, complete with duct-taped seat, to Zane’s
Cycles, a nationally known store among serious cyclists, and grabbed his not-quite-trim midsection
when asked why he was getting his bike fixed. “I could go out and buy a new bike,” he said, but
added, “I don’t want to commit to a bike and then not ride it.”
In interviews, store owners said they had trouble last summer keeping up their stock of accessories,
especially bike bags, car racks, tires and tubes. That told industry observers that people were actually
using the bikes they had fixed up.
“The question is,” Mr. Townley said, “will they take the bike out of the basement, inflate the tires
and ride it again? My gut says no.”

144
Tim Blumenthal, executive director of Bikes Belong, disagreed. “I believe that last summer’s spike in
gas prices and the reaction of Americans was different from any previous spike and any previous
reaction,” he said. “It wasn’t just about sticker shock at the pumps. When people ride bikes, lots of
good things happen.”
At Zane’s, Tom Girard said that in his 15 years as general manager, he could not remember a
comparable summer, with business up 30 percent over the previous year. Three months later, he
said that business has stayed strong and that his gamble to increase cold weather gear inventory 25
percent was paying off, though at the low end of what he had hoped. An employee he hired in the
fall — an unusual time to add a worker in a seasonal business like biking — is still on staff.
“It’s like package stores,” he said. “When the economy’s bad, people drink. When the economy is
good, people drink. When the economy’s bad, people still need to do something. So they ride their
bikes.”
But Mr. Girard hastened to add that no one is recession-proof. “If you’re a good store and have a
good business plan,” he said, “I think that makes you more recession-proof than what you’re
selling.”
The experts say surviving in this economic climate means small bicycle stores must choose products
carefully to keep inventory low and cash flow high. Mike Hamannwright, a 20-year veteran of the
business and co-owner of four Revolution Cycles stores in the Washington area, said he had cut
back on cold weather gear even though he saw plenty of stay-at-home people, especially couples,
buying bicycles last summer.
“Some bike shops are going to go out of business,” he said he had told his staff. “Not every bike
shop is going to go out of business, and if we don’t want to be one, we’ve got to be great.
“Anybody who was a little weak, this is going to be the crushing blow,” he added.
One view contends that the sluggish coda to the summer bicycling boom is not the end of the
refrain.
“I don’t think any of us are fools that $1.89-a-gallon gasoline is really going to be the way it will be
from here on out,” said Fred Clements, executive director of the National Bicycle Dealers
Association. “I don’t want to appear to be too bullish, but some of the longer term trends — how
we get out of an economic recession like this — don’t necessarily put bicycles in a bad spot. Bicycles
are part of a solution to the problem.”

145
Tuff, S. (2008, May 1). Cycling Success Measured in Frequent-Flier Miles. Retrieved on February 20,
2014, from The New York Times: http://www.nytimes.com/2008/05/01/fashion/
01fitness.html? pagewanted=all&action=click&module=Search®ion=searchResults
%236&version=&url=http%3A%2F%2Fquery.nytimes.com%2Fsearch%2Fsitesearch%2F
%3Faction%3Dclick%26region%3DMasthead%26pgtype%3DHomepage%26module%3DS
earchSubmit%26contentCollection%3DHomepage%26t%3Dqry610%23%2Fbicycle%2Bind
ustry%2Ffrom20060101to20140314%2Fallresults%2F7%2F
Cycling Success Measured in Frequent-Flier Miles
EARLY last year, Dr. Jason Newland, a 34-year-old pediatric infectious disease physician from
Stilwell, Kan., decided he would upgrade his Cannondale road bike to something more
aerodynamically suited for triathlons, where riders must fight the wind on their own, without the
pack shielding them. But instead of ambling into a local sports shop, Mr. Newland flew nearly 1,400
miles from Kansas City, Mo., to Waitsfield, Vt., where he bought a custom titanium and carbon
Serotta Legend Ti from a specialty-fit studio called Fit Werx. The price: about $7,000, not including
travel.
“It’s hard to tell people I went all that way to buy a bicycle,” Mr. Newland said. “They say, ‘Why
didn’t you find a place in Kansas City?’ I’m kind of a fanatic.”
It is apparently no longer enough for dedicated amateur or recreational cycling enthusiasts to pay
$2,000 to $20,000 for custom-fit bikes, a practice that has become more commonplace in the last
few years. Now, to fully appreciate the magnificence of their new toys, those athletes must also be
able to tell of flight miles logged and far-off bicycle gurus consulted.
“When you travel to do anything,” said Matt Boyer, the marketing director at Wheat Ridge Cyclery
near Denver, “there is that cachet that says, ‘What I’m doing is very important because I have to
leave town to do it.’ ”
Even with Ron Kiefel, a 1984 Olympic road cycling men’s team time-trial bronze medalist, as its
general manager, Mr. Boyer has been surprised at the number of out-of-staters drawn to the fitting
mezzanine at the 30,000-square-foot shop. Nor has the recent economic downturn stalled the
cyclists and triathletes from outside Colorado. “If you’re a $15,000 customer, the recession isn’t
going to stop you,” he said.
Feeding the fire is the fact that high-end bike shops like Fit Werx and Wheat Ridge are courting
buyers, not just with travel discounts and refunds but with more personal touches like dinner
recommendations.
Fit Werx arranges lodging deals at local inns and will pick up customers at the airport, said Ian
Buchanan, a fitter and an owner. Recently, he said, Fit Werx found a London-based cyclist a
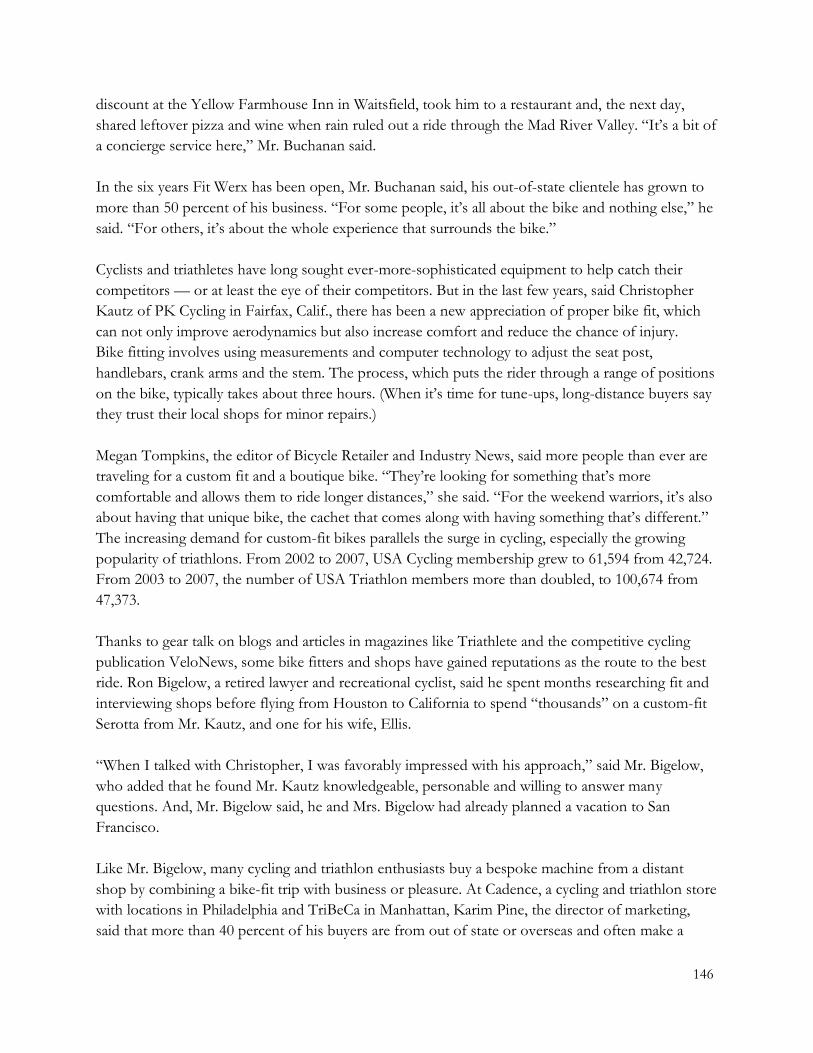
146
discount at the Yellow Farmhouse Inn in Waitsfield, took him to a restaurant and, the next day,
shared leftover pizza and wine when rain ruled out a ride through the Mad River Valley. “It’s a bit of
a concierge service here,” Mr. Buchanan said.
In the six years Fit Werx has been open, Mr. Buchanan said, his out-of-state clientele has grown to
more than 50 percent of his business. “For some people, it’s all about the bike and nothing else,” he
said. “For others, it’s about the whole experience that surrounds the bike.”
Cyclists and triathletes have long sought ever-more-sophisticated equipment to help catch their
competitors — or at least the eye of their competitors. But in the last few years, said Christopher
Kautz of PK Cycling in Fairfax, Calif., there has been a new appreciation of proper bike fit, which
can not only improve aerodynamics but also increase comfort and reduce the chance of injury.
Bike fitting involves using measurements and computer technology to adjust the seat post,
handlebars, crank arms and the stem. The process, which puts the rider through a range of positions
on the bike, typically takes about three hours. (When it’s time for tune-ups, long-distance buyers say
they trust their local shops for minor repairs.)
Megan Tompkins, the editor of Bicycle Retailer and Industry News, said more people than ever are
traveling for a custom fit and a boutique bike. “They’re looking for something that’s more
comfortable and allows them to ride longer distances,” she said. “For the weekend warriors, it’s also
about having that unique bike, the cachet that comes along with having something that’s different.”
The increasing demand for custom-fit bikes parallels the surge in cycling, especially the growing
popularity of triathlons. From 2002 to 2007, USA Cycling membership grew to 61,594 from 42,724.
From 2003 to 2007, the number of USA Triathlon members more than doubled, to 100,674 from
47,373.
Thanks to gear talk on blogs and articles in magazines like Triathlete and the competitive cycling
publication VeloNews, some bike fitters and shops have gained reputations as the route to the best
ride. Ron Bigelow, a retired lawyer and recreational cyclist, said he spent months researching fit and
interviewing shops before flying from Houston to California to spend “thousands” on a custom-fit
Serotta from Mr. Kautz, and one for his wife, Ellis.
“When I talked with Christopher, I was favorably impressed with his approach,” said Mr. Bigelow,
who added that he found Mr. Kautz knowledgeable, personable and willing to answer many
questions. And, Mr. Bigelow said, he and Mrs. Bigelow had already planned a vacation to San
Francisco.
Like Mr. Bigelow, many cycling and triathlon enthusiasts buy a bespoke machine from a distant
shop by combining a bike-fit trip with business or pleasure. At Cadence, a cycling and triathlon store
with locations in Philadelphia and TriBeCa in Manhattan, Karim Pine, the director of marketing,
said that more than 40 percent of his buyers are from out of state or overseas and often make a

147
vacation out of the bike-fitting experience. “They want to scratch all their itches,” he said.
Last month, Doug Jacobs, the chief executive of an auto-finance company who lives in Weston, Fla.,
flew to Greenwich, Conn., for meetings and squeezed in a bike fit by Paul Levine at Signature Cycles
on the counsel of several members in his road cycling club.
Mr. Jacobs, 45, said he began cycling about two years ago and is building up his skills before he
enters races. In the meantime, he said, “our group’s pretty fast, and if you’re not ready to ride really
hard, you’re going to get dropped.”
So, after a two-and-a-half-hour fitting at Signature Cycles, which is known to pamper well-heeled
clients with beer or wine and long discussions about lifestyles, Mr. Jacobs paid about $14,000 to
have a Serotta MeiVici with hand-rolled carbon tubes custom built and shipped to him. “I haven’t
gotten the bike yet, but I’m very excited,” he said.
Mr. Jacobs admitted that he can seem obsessed about his sport, but that considering the amount of
time he puts into cycling, “it’s money well spent.”
The weak dollar is also luring more overseas customers, said Christophe Vandaele, the president of
SBR Multisports (for swim, bike, run) in Midtown Manhattan. This spring, Mr. Vandaele began to
promote more actively his two-year-old program that promises customers who fly to New York and
spend $2,500 or more on a bike a refund of $200 for lodging or air fare.
Mr. Vandaele said many of the international customers are couples: “The wife wants to shop on
Fifth Avenue, and the gentleman wants to shop at SBR.”
But how expensive a bike does one really need? Loren Mooney, the executive editor of Bicycling
magazine, said that for $2,500 to $3,500, most road cyclists and triathletes can get an exceptional
road or triathlon bike without traveling far. T. J. Murphy, the editor of Triathlete magazine, said the
low end for a good triathlon bike without a custom fit, for a beginner or an experienced rider, is
about $2,000. Ms. Mooney cautions against a keep-up-with-the-Joneses mentality that can spur five-
figure splurges. “What you get for $15,000 is something ultralightweight, with pro-level
performance,” she said. “But the reality is that very few people have the cycling ability to take
advantage of all that.”
Even some devotees admit that what they treasure most about their trophy items may be merely
superficial. Rafael Aguilar, a 38-year-old lawyer and triathlete from Miami, conceded that a perk of
traveling to Mr. Kautz’s shop in California and spending several thousand dollars was being able to
show off the bike at races.

148
“There’s always a certain amount of bling, as most triathletes are relatively affluent professionals
who aren’t hesitant to spend their money on nice equipment,” Mr. Aguilar said. “But a bicycle is a
bicycle. At the end of the day, it’s a question of who crosses the finish line first.”
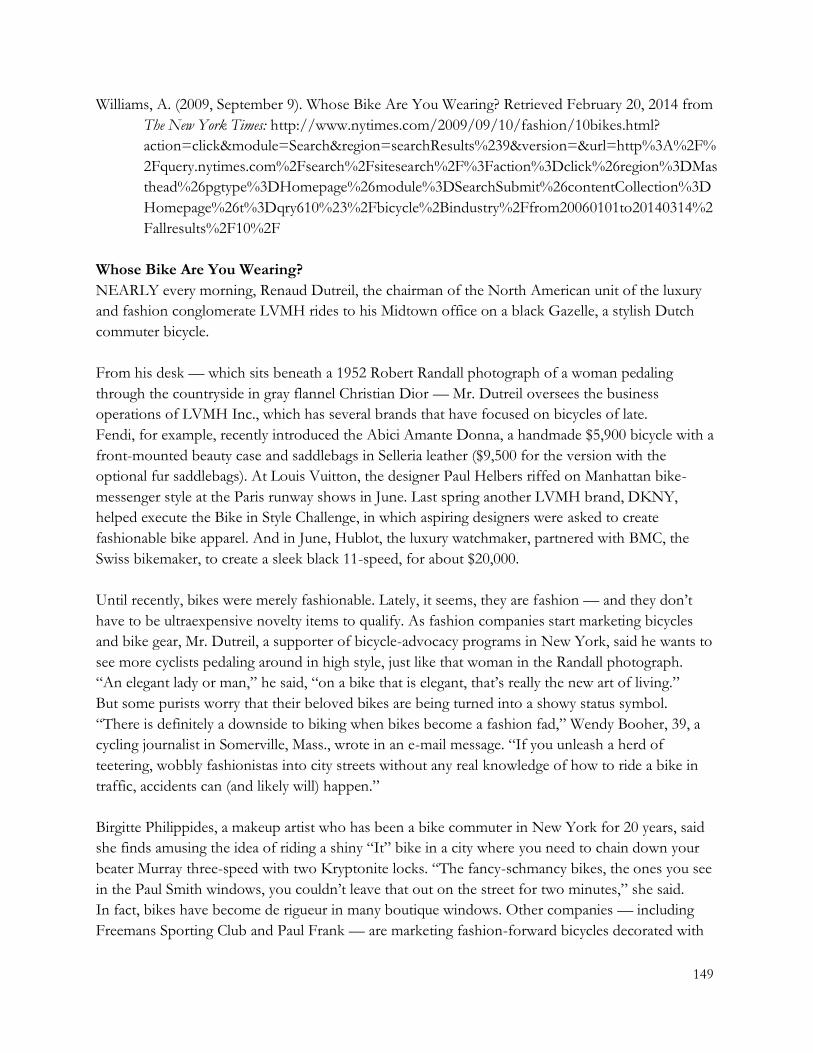
149
Williams, A. (2009, September 9). Whose Bike Are You Wearing? Retrieved February 20, 2014 from
The New York Times: http://www.nytimes.com/2009/09/10/fashion/10bikes.html?
action=click&module=Search®ion=searchResults%239&version=&url=http%3A%2F%
2Fquery.nytimes.com%2Fsearch%2Fsitesearch%2F%3Faction%3Dclick%26region%3DMas
thead%26pgtype%3DHomepage%26module%3DSearchSubmit%26contentCollection%3D
Homepage%26t%3Dqry610%23%2Fbicycle%2Bindustry%2Ffrom20060101to20140314%2
Fallresults%2F10%2F
Whose Bike Are You Wearing?
NEARLY every morning, Renaud Dutreil, the chairman of the North American unit of the luxury
and fashion conglomerate LVMH rides to his Midtown office on a black Gazelle, a stylish Dutch
commuter bicycle.
From his desk — which sits beneath a 1952 Robert Randall photograph of a woman pedaling
through the countryside in gray flannel Christian Dior — Mr. Dutreil oversees the business
operations of LVMH Inc., which has several brands that have focused on bicycles of late.
Fendi, for example, recently introduced the Abici Amante Donna, a handmade $5,900 bicycle with a
front-mounted beauty case and saddlebags in Selleria leather ($9,500 for the version with the
optional fur saddlebags). At Louis Vuitton, the designer Paul Helbers riffed on Manhattan bike-
messenger style at the Paris runway shows in June. Last spring another LVMH brand, DKNY,
helped execute the Bike in Style Challenge, in which aspiring designers were asked to create
fashionable bike apparel. And in June, Hublot, the luxury watchmaker, partnered with BMC, the
Swiss bikemaker, to create a sleek black 11-speed, for about $20,000.
Until recently, bikes were merely fashionable. Lately, it seems, they are fashion — and they don’t
have to be ultraexpensive novelty items to qualify. As fashion companies start marketing bicycles
and bike gear, Mr. Dutreil, a supporter of bicycle-advocacy programs in New York, said he wants to
see more cyclists pedaling around in high style, just like that woman in the Randall photograph.
“An elegant lady or man,” he said, “on a bike that is elegant, that’s really the new art of living.”
But some purists worry that their beloved bikes are being turned into a showy status symbol.
“There is definitely a downside to biking when bikes become a fashion fad,” Wendy Booher, 39, a
cycling journalist in Somerville, Mass., wrote in an e-mail message. “If you unleash a herd of
teetering, wobbly fashionistas into city streets without any real knowledge of how to ride a bike in
traffic, accidents can (and likely will) happen.”
Birgitte Philippides, a makeup artist who has been a bike commuter in New York for 20 years, said
she finds amusing the idea of riding a shiny “It” bike in a city where you need to chain down your
beater Murray three-speed with two Kryptonite locks. “The fancy-schmancy bikes, the ones you see
in the Paul Smith windows, you couldn’t leave that out on the street for two minutes,” she said.
In fact, bikes have become de rigueur in many boutique windows. Other companies — including
Freemans Sporting Club and Paul Frank — are marketing fashion-forward bicycles decorated with

150
head-turning paint schemes and accessories. Urban Outfitters recently opened an online custom
bike shop, where customers can choose among hundreds of component and color combinations.
And in June, Topshop, the British clothing retailer, which recently opened a New York store, used a
bike-lending promotion to try to raise its profile on these shores.
It is no coincidence that fashion is having a bike moment at the same time that New York City, the
capital of American fashion, has gone bicycle crazy. The number of daily cyclists in the city has
jumped to an estimated 185,000, from 107,000 in 2005, according to Transportation Alternatives, a
bicycle-advocacy organization. Indeed, some New York designers are bike commuters themselves,
like Steven Alan, who commutes to work on a foldable Strida, which looks like a bicycle as
reimagined by Duchamp.
In addition, the city has installed more than 120 miles of bike lanes in the last two years, making it
easier for new cyclists to take to the streets dressed to impress, not to duel with cars.
“LVMH wouldn’t make a $9,000 bike if you couldn’t actually ride down Eighth Avenue in your
Zegna suit or Chanel dress and make it to work in one piece,” Philippe von Borries, a founder of
Refinery29, the fashion Web site, wrote by e-mail.
Others note that designers have marketed environmentally sensitive clothing in recent years, so it
makes sense that some of them would eventually adopt — or co-opt — the greenest form of
transportation. “The luxury industry has to show a new way,” said Mr. Dutreil of LVMH. “It’s very
logical to connect the art of living, and the elegance, to a new duty, which is to respect our
environment.” Bikes can also be used to highlight an individual’s style, said Simon Collins, the dean
of fashion at Parsons the New School for Design, who recalled riding a retro one-speed gentleman’s
cruiser in British racing green when he lived in London, in part because it matched his couture suits.
Single-speed fixed-gear track bicycles like the Bianchi Pista were popular with bike messengers, then
were adopted by Williamsburg creative types, who posed with their bikes in street-style blogs like
The Sartorialist.
Eventually, fashion companies closed the loop. Acne, for instance, now sells a stylized version of the
$749 Pista — available in pink for women — for $2,300. Cynthia Rowley sells her beach cruisers
($550) in limited editions of 25 per pattern and color. While the sales numbers are small, the
marketing possibilities are considerable. Ms. Rowley introduced the bikes at her 2008 spring show in
New York, where each model hopped on a colorful cruiser and wheeled back down the runway for a
striking finale. Leighton Meester rode one on “Gossip Girl.” “It helps tell the story of my
company,” Ms. Rowley wrote in an e-mail message. “It’s chic and sporty, and unexpected.”
Fendi’s bike market is even more exclusive. So far, the Fendi bike has sold only to a few celebrity
types, but it enhances the brand image — it was featured in the June issue of Vogue and countless
fashion blogs — if not mass market sales. “It’s an item that harkens back to everything Fendi was at
the beginning” — fur, leather and rich adornment, said Michael Burke, the chief executive of Fendi.

151
While some cyclists outside the fashion world expressed mixed feelings about seeing their trusty
mode of transportation turned into the next gladiator sandal, others looked on the bright side. Even
if new riders buy a bike only because they’re the cool new thing, they’re still buying a bike, wrote
Matt Simonds, a cyclist who works at a nonprofit agency, in an e-mail message. In such cases, he
wrote, “it’s kind of strange what happens when they got on a bike after a long period away from one
— they remember how awesome it is to ride one.”

152
Yardley, W. (2007, November 5). In Portland, Cultivating a Culture of Two Wheels. Retrieved on
February 20, 2014 from The New York Times: http://www.nytimes.com/2007/11/05/us/05
bike.html?contentCollection=Homepage&t=qry610#/bicycle+industry/from20060101to20
140314/&version=&action=click®ion=Masthead&module=SearchSubmit&url=http://
query.nytimes.com/search/sitesearch/?action=click&pgtype=Homepage&pagewanted=prin
t
In Portland, Cultivating a Culture of Two Wheels
PORTLAND, Ore. — Susan Peithman did not have a job lined up when she moved here in
September to pursue a career in “nonmotorized transportation.” No worries, she figured; the market
here is strong.
Now, business owners like Tony Pereira, a bike builder, are part of the city’s growing cycling
industry.
“In so many ways, it’s the center,” Ms. Peithman, 26, explained. “Bike City, U.S.A.”
Cyclists have long revered Portland for its bicycle-friendly culture and infrastructure, including the
network of bike lanes that the city began planning in the early 1970s. Now, riders are helping the city
build a cycling economy.
There are, of course, huge national companies like Nike and Columbia Sportswear that have
headquarters here and sell some cycling-related products, and there are well-known brands like
Team Estrogen, which sells cycling clothing for women online from a Portland suburb.
Yet in a city often uncomfortable with corporate gloss, what is most distinctive about the emerging
cycling industry here is the growing number of smaller businesses, whether bike frame builders or
clothing makers, that often extol recycling as much as cycling, sustainability as much as success.
Like the local indie rock bands that insist they are apathetic about fame, many of the smaller local
companies say craft, not money, is what drives them.
“All the frame builders I know got into this because they love bikes,” said Tony Pereira, a bike
builder whose one-man operation has a 10-month waiting list, “not because they wanted to start a
business.”
Mia Birk, a former city employee who helped lead Portland’s efforts to expand cycling in the 1990s,
said the original goals were rooted in environmental and public health, not the economy.
“That wasn’t our driving force,” Ms. Birk said. “But it has been a result, and we’re comfortable
saying it is a positive result.”
Ms. Birk now helps run a consulting firm, Alta Planning and Design, which advises other cities on
how to become more bicycle-friendly. In a report for the City of Portland last year, the firm
estimated that 600 to 800 people worked in the cycling industry in some form. A decade earlier, Ms.

153
Birk said in an interview, the number would have been more like 200 and made up almost entirely of
employees at retail bike stores.
Now, Ms. Birk said, the city is nurturing the cycling industry, and there are about 125 bike-related
businesses in Portland, including companies that make bike racks, high-end components for racing
bikes and aluminum for bikes mass-produced elsewhere. There are small operations that make
cycling hats out of recycled fabric. Track, road and cyclo-cross races are held year-round, and state
tourism groups promote cycling packages. There is Ms. Birk’s firm, which had two employees in
Portland in 1999 and now has 14. There are nonprofit advocacy groups and Web sites, including
www.bikeportland.org, that are devoted to cycling issues and events in Portland.
And then there is the growing, high-end handmade bike industry, which was made up of just one or
two businesses a decade ago but now has more than 10. The Portland Development Commission is
working with a handful of the bike builders to improve their business and accounting skills and help
them network with one another.
This month, the city will be the host of a trade show featuring bike builders from Oregon, which
locals say has more makers than any other state. And early next year, the North American
Handmade Bicycle Show will bring its fourth annual event to Portland for the first time. It is
expected to be the largest national show so far.
Sam Adams, a city commissioner in charge of transportation, joined development officials to help
lure the show to Portland. It seemed a natural fit. The city regularly ranks at the top of Bicycling
Magazine’s list of the best cycling cities and has the nation’s highest percentage of workers who
commute by bike, about 3.5 percent, according to the Census Bureau. Drivers here are largely
respectful of riders, and some businesses give up parking spaces to make way for bike racks.
“Our intentions are to be as sustainable a city as possible,” Mr. Adams said. “That means socially,
that means environmentally and that means economically. The bike is great on all three of those
factors. You just can’t get a better transportation return on your investment than you get with
promoting bicycling.”
Although the city has worked to help drivers and riders share roadways, two cyclists were killed in
October when they were hit by trucks, and questions persist over whether enough is being done to
protect cyclists.
Mr. Adams said he was preparing a budget proposal that would spend $24 million to add 110 miles
to the city’s existing 20-mile network of bike boulevards, which are meant to get cyclists away from
streets busy with cars. Doing so could “double or triple ridership,” he said.
The streets were not always so crowded with cyclists. Andy Newlands, by most accounts the first
person in Portland to start making bikes by hand, got into the business in the 1970s. Back then, he

154
said, young men would come to him for help piecing together racing bikes. Now, he said, “More and
more it’s some guy with a wife and kids and a BMW and all that, and he wants a handmade bike.”
Thirty years ago Mr. Newlands sold frames for under $300. Now a new bike might cost the buyer
well over $5,000.
“There’s so much mass-produced stuff out there that there’s just kind of a little bit of a backlash,”
he said. “People like a handmade product.”
Sacha White, who was a bike messenger before he started Vanilla Bicycles, one of the most
prominent bike makers in Portland, said city officials embraced not only cycling but also the niche
industry that has grown out of it, something he considered striking given the size of most
operations. His company, among the largest of its kind, has six employees including himself.
“I think the biggest thing that’s come from the effort the city has put into this is the vote of
confidence,” Mr. White said, speaking of bike riders and bike makers. “They want us here.”
Ms. Peithman, the recent Portland arrival, had lived in Chicago until September, where she worked
for the Chicagoland Bicycle Federation, a nonprofit advocacy group. She decided to move here on
her own without any job prospects based “90 percent on the bike thing,” she said.
“I’m a long-term-thinking, spreadsheet kind of girl,” Ms. Peithman said. “This is the most rash thing
I’ve ever done.”

155
You’re The Boss Editors. (2010, June 2). Would You Build Bikes in the U.S. or the Far East?
Retrieved on February 21, 2014 from The New York Times: http://boss.blogs.nytimes.com/
2010/06/02/would-you-build-bikes-in-the-u-s-or-the-far-east/?action=click&module=
Search®ion=searchResults%231&version=&url=http%3A%2F%2Fquery.nytimes.com%
2Fsearch%2Fsitesearch%2F%3Faction%3Dclick%26region%3DMasthead%26pgtype%3D
Homepage%26module%3DSearchSubmit%26contentCollection%3DHomepage%26t%3Dq
ry610%23%2Fbicycle%2Bmanufacturing%2Ffrom20060101to20140314%2Fallresults%2F2
%2F
Would You Build Bikes in the U.S. or the Far East?
We have just published a case study of Super Sized Cycles, a company based in Vermont that
manufactures and adapts bicycles for overweight riders who are too big for conventional bikes.
Written by John Grossmann, the article explains why Joan Denizot, founder of Super Sized, is torn
between having her bikes manufactured in the United States (keeping the jobs local) or in the Far
East (where her costs are much lower).
Below, you will find the analyses of several small-business owners and experts who have had similar
experiences. Please leave your own thoughts in the comment section.
Kevin Czinger, chief executive of CODA Automotive, an all-electric car company:
“Given her desire to expand production and create jobs domestically, Ms. Denizot should search for
a new, domestic manufacturer and negotiate a competitive rate in exchange for a long-term
commitment. If she is unable to find a supplier who can provide a competitive rate, her only option
is to risk losing her business or look elsewhere for manufacturing.”
Robert Buckley, founder and chief executive of Marin Bikes, which makes mountain bikes:
“Business is business, and in this world today, it’s a world economy. Nationalism can bankrupt a
company.
“Taiwan is a good start, but the small quantities that she is buying are not a very appealing order for
these very large frame factories. It sounds like she has the foundation for expansion set with lower
pricing and good quality.”
Angelo Santinelli, founder of Dakin Management, a strategy consultancy and a lecturer at Babson
College:
“My advice would be to take advantage of the additional gross margin dollars made available
through the much lower cost of offshore manufacturing of her most popular models ($400 versus
$1250) and apply those new-found dollars to design, sales and marketing. By focusing on design and
brand development she’ll increase her chances of survival, growth and perhaps non-manufacturing
job creation in Vermont. She might choose to keep the more highly customized work in Vermont,

156
for which she can charge higher prices.”
Noel Zeller, co-founder with his wife, Adele, of Zelco, which is best known for inventing the Itty
Bitty Book Light.
“We too started with the idea that we wanted to manufacture in the U.S. for all the same reasons.
What we quickly learned was that having a good product and a well-thought-out marketing plan was
just the beginning. No start-up that I am familiar with began over-capitalized. Having enough
money for R&D, manufacturing, inventory, and account-receivable financing usually does not leave
enough for setting up your own factory and/or subcontracting domestic production.
“My advice is to concentrate on market and not get caught up in manufacturing, which sounds like
an area you really are not familiar with. There should be no doubt on your part that larger companies
are already aware of the market niche that you have created. The advantage you have is that you are
the first to recognize it and to exploit its possibilities.”
John Sortino, founder and chief executive of the Vermont Teddy Bear Company and founder and
chief executive of the short-lived Chicago Bicycle Company (and an occasional mentor to Ms.
Denizot for several years):
“It’s really hard to make bicycles in the United States. And it’s really expensive. I had to buy all my
own equipment. I had to train my guys on how to bend big steel tubes for the curved frames. The
Taiwanese and overseas manufacturers are way better at building bicycles. They’ve been doing it
longer.
“I lived in Vermont most of my adult life—and it’s the kind of place where people, as a culture, go
overboard making things — toys, cheese, even Teddy bears, like we did. So I can understand her
desire to build bikes in her home state, because of the Vermont culture. But she’ll create more jobs,
I think, by making them over there [in Asia] efficiently and using the cost differential to have more
money to spend on educating the overweight public about getting off the couch and getting out and
riding a bicycle and getting some exercise.”
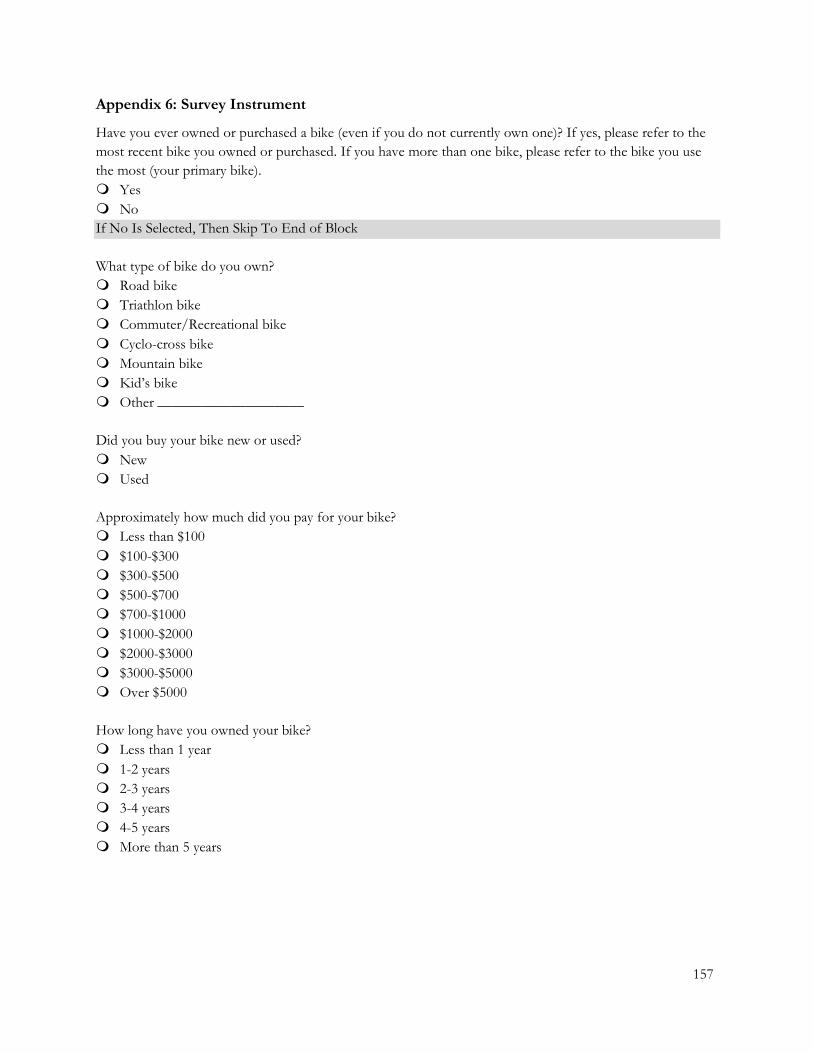
157
Appendix 6: Survey Instrument
Have you ever owned or purchased a bike (even if you do not currently own one)? If yes, please refer to the
most recent bike you owned or purchased. If you have more than one bike, please refer to the bike you use
the most (your primary bike).
Yes
No
If No Is Selected, Then Skip To End of Block
What type of bike do you own?
Road bike
Triathlon bike
Commuter/Recreational bike
Cyclo-cross bike
Mountain bike
Kid’s bike
Other ____________________
Did you buy your bike new or used?
New
Used
Approximately how much did you pay for your bike?
Less than $100
$100-$300
$300-$500
$500-$700
$700-$1000
$1000-$2000
$2000-$3000
$3000-$5000
Over $5000
How long have you owned your bike?
Less than 1 year
1-2 years
2-3 years
3-4 years
4-5 years
More than 5 years

158
How often do you ride your bike?
Less than once a month
1-2 times a month
Once a week
2-3 times a week
More than 4 times a week
Why do you ride your bike? Please select all that apply.
I am a competitive racer
I ride for fun
I ride for fitness/weight loss
I commute to work or school
Other ____________________
What was your most recent bike-related purchase?
A complete bicycle
Components or parts of a bicycle (frame, seat post, shifters, saddle, etc)
Bicycle accessories or clothing (food, water bottle, lights, jersey, etc)
Other ____________________
When was the above purchase?
Within the last week
In the last month
In the last 3 months
In the last 6 months
In the last year
Over a year ago
How often do you buy new bikes, components, or bike accessories, on average?
Less than once a year
1-2 times a year
3-4 times a year
Once a month
Once a week
More than once a week

159
What are the most important factors when buying a bike, components, or bike accessories? Please drag and
drop the following factors in the order of most important (1) to least important (7).
______ Weight
______ Performance
______ Environmental-friendliness
______ Cost
______ Comfort
______ Appearance/Color
______ Quality
Answer If Have you ever owned or purchased a bike (even if you do not currently own one)? If yes, please
answer the rest of the survey for the most recent bike you owned or purchased. If you have more than o...
No Is Selected
What is the most significant reason you have never owned or purchased a bike?
Bikes are too expensive
I am physically unable to ride a bike
I use other forms of transportation and therefore do not need a bike
I live in an area that is unsafe or inconvenient for biking
I exercise in different ways
Other (please specify) ____________________
Answer If Have you ever owned or purchased a bike (even if you do not currently own one)? If yes, please
answer the rest of the survey for the most recent bike you owned or purchased. If you have more than o...
No Is Selected
Please select the option that is most true for you. “I am more likely to buy a bike if…
The bike is affordable
I know the bike was manufactured in an environmentally sustainable way
The area I live in is more bike-friendly
My current form of transportation becomes more expensive (i.e. gas prices increase)
Other (please specify) ____________________
In the past month, which of the following stores have you shopped at for groceries?
A superstore (Target, Wal-mart, etc)
A chain grocery store (Harris Teeter, A&P, Stop N’ Shop, Kroger, Food Lion, etc)
A locally-owned grocery store (corner store, mom & pop, etc)
A natural, organic food store or co-op
Whole Foods or Trader Joe’s
Online retailer
Farmer’s markets
Other ____________________

160
How often do you buy "green", organic, or sustainably produced products?
All of the time
Most of the time
Sometimes
Rarely
Never
If it came to your attention that a company was producing its products in an <u>unsustainable</u> way,
how would you react?
I would consider buying less from the company
I would consider buying less from the company only if comparable products were priced similarly
My buying behavior would remain the same
I would consider buying more from the company only if comparable products were priced similarly
I would consider buying more from the company
If it came to your attention that a company was producing its products in a <u>sustainable</u> way, how
would you react?
I consider buying less from the company
I would consider buying less from the company only if comparable products were priced similarly
My buying behavior would remain the same
I would consider buying more from the company only if comparable products were priced similarly
I would consider buying more from the company
Answer If Approximately how much did your bike cost? Less than $100 Is Selected
Suppose you were going to buy a new bicycle. Your favorite bicycle company sells a bike for $100. If that
company began selling the same bike made in a sustainable way, how much would you be willing to pay for
the sustainable bicycle?
I would pay less than $100
I would pay $100
I would pay $105 (5% more)
I would pay $110 (10% more)
I would pay $120 (20% more)
I would pay $150 (50% more)

161
Answer If Approximately how much did your bike cost? $100-$300 Is Selected
Suppose you were going to buy a new bicycle. Your favorite bicycle company sells a bike for $200. If that
company began selling the same bike made in a sustainable way, how much would you be willing to pay for
the sustainable bicycle?
I would pay less than $200
I would pay $200
I would pay $210 (5% more)
I would pay $220 (10% more)
I would pay $240 (20% more)
I would pay $300 (50% more)
Answer If Approximately how much did your bike cost? $300-$500 Is Selected
Suppose you were going to buy a new bicycle. Your favorite bicycle company sells a bike for $400. If that
company began selling the same bike made in a sustainable way, how much would you be willing to pay for
the sustainable bicycle?
I would pay less than $400
I would pay $400
I would pay $420 (5% more)
I would pay $440 (10% more)
I would pay $480 (20% more)
I would pay $600 (50% more)
Answer If Approximately how much did your bike cost? $500-$700 Is Selected
Suppose you were going to buy a new bicycle. Your favorite bicycle company sells a bike for $600. If that
company began selling the same bike made in a sustainable way, how much would you be willing to pay for
the sustainable bicycle?
I would pay less than $600
I would pay $600
I would pay $630 (5% more)
I would pay $660 (10% more)
I would pay $720 (20% more)
I would pay $900 (50% more)
Answer If Approximately how much did your bike cost? $700-$1000 Is Selected
Suppose you were going to buy a new bicycle. Your favorite bicycle company sells a bike for $900. If that
company began selling the same bike made in a sustainable way, how much would you be willing to pay for
the sustainable bicycle?
I would pay less than $900
I would pay $900
I would pay $945 (5% more)
I would pay $990 (10% more)
I would pay $1080 (20% more)
I would pay $1350 (50% more)

162
Answer If Approximately how much did your bike cost? $1000-$2000 Is Selected
Suppose you were going to buy a new bicycle. Your favorite bicycle company sells a bike for $1500. If that
company began selling the same bike made in a sustainable way, how much would you be willing to pay for
the sustainable bicycle?
I would pay less than $1500
I would pay $1500
I would pay $1575 (5% more)
I would pay $1650 (10% more)
I would pay $1800 (20% more)
I would pay $2250 (50% more)
Answer If Approximately how much did your bike cost? $2000-$3000 Is Selected
Suppose you were going to buy a new bicycle. Your favorite bicycle company sells a bike for $2500. If that
company began selling the same bike made in a sustainable way, how much would you be willing to pay for
the sustainable bicycle?
I would pay less than $2500
I would pay $2500
I would pay $2625 (5% more)
I would pay $2750 (10% more)
I would pay $3000 (20% more)
I would pay $3750 (50% more)
Answer If Approximately how much did your bike cost? $3000-$5000 Is Selected
Suppose you were going to buy a new bicycle. Your favorite bicycle company sells a bike for $4000. If that
company began selling the same bike made in a sustainable way, how much would you be willing to pay for
the sustainable bicycle?
I would pay less than $4000
I would pay $4000
I would pay $4200 (5% more)
I would pay $4400 (10% more)
I would pay $4800 (20% more)
I would pay $6000 (50% more)
Answer If Approximately how much did your bike cost? Over $5000 Is Selected
Suppose you were going to buy a new bicycle. Your favorite bicycle company sells a bike for $5000. If that
company began selling the same bike made in a sustainable way, how much would you be willing to pay for
the sustainable bicycle?
I would pay less than $5000
I would pay $5000
I would pay $5250 (5% more)
I would pay $5500 (10% more)
I would pay $6000 (20% more)
I would pay $7500 (50% more)

163
What is your age?
Under 18
18-25
26-35
36-45
46-55
56 and over
Prefer not to say
What is your gender?
Male
Female
Prefer not to say
What is the highest level of education completed by any member of your household?
Less than high school
High school diploma or GED
Some college
Technical or Associate degree
Bachelor’s degree
Post-graduate degree
Prefer not to say
What is your affiliation with Duke University?
Undergraduate Student
Graduate Student
Faculty
Staff
Other (please describe) ____________________
I am not affiliated with Duke University.
What department are you primarily affiliated with? For students, please specify your major/degree. For
faculty and staff, please specify your primary department affiliation.
What is your total annual household income?
Less than $20,000
$20,000-$34,999
$35,000-$49,999
$50,000-$74,999
$75,000-$100,000
More than $100,000
Prefer not to say
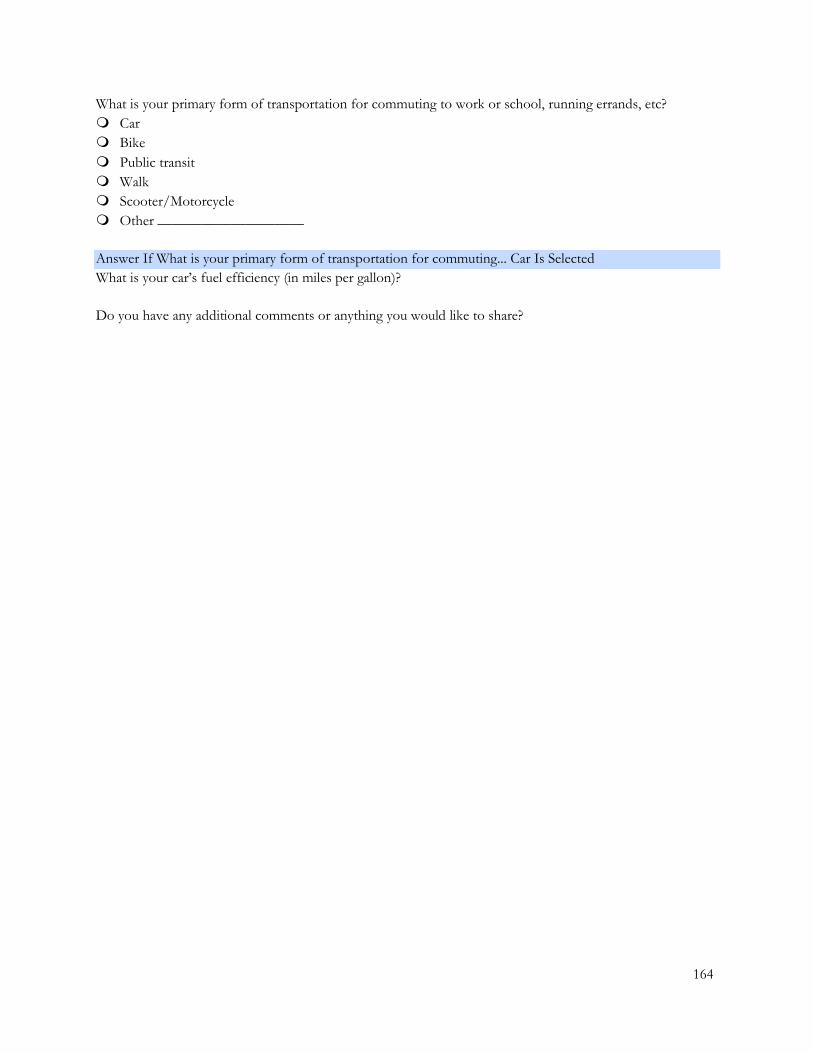
164
What is your primary form of transportation for commuting to work or school, running errands, etc?
Car
Bike
Public transit
Walk
Scooter/Motorcycle
Other ____________________
Answer If What is your primary form of transportation for commuting... Car Is Selected
What is your car’s fuel efficiency (in miles per gallon)?
Do you have any additional comments or anything you would like to share?
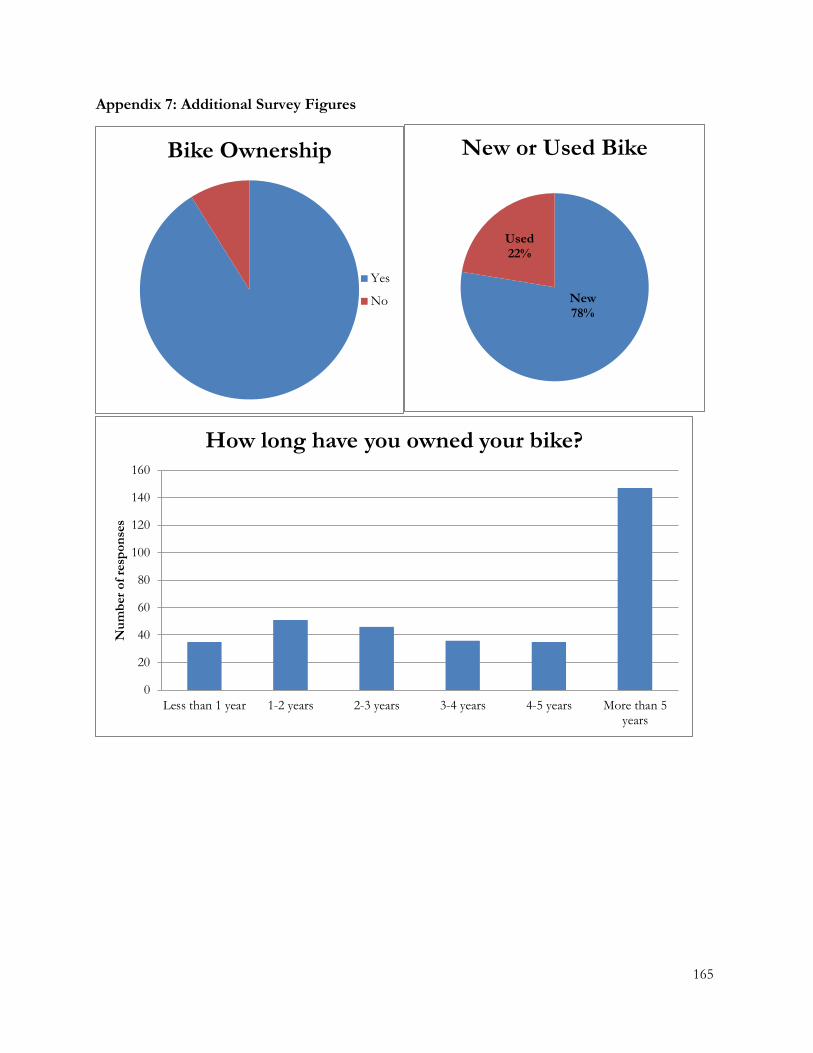
165
Appendix 7: Additional Survey Figures
Bike Ownership
Yes
No New 78%
Used 22%
New or Used Bike
0
20
40
60
80
100
120
140
160
Less than 1 year 1-2 years 2-3 years 3-4 years 4-5 years More than 5years
Nu
mb
er
of
resp
on
ses
How long have you owned your bike?

166
020406080
100120140
Nu
mb
er
of
resp
on
ses
What are the most important factors when buying a bike?
Ranked 1st
Ranked 2nd
Ranked 3rd
Ranked 4th
Ranked 5th
Ranked 6th
Ranked Last
0
20
40
60
80
100
120
140
Less than oncea month
1-2 times permonth
Once a week 2-3 times perweek
More than 4times per week
Nu
mb
er
of
resp
on
ses
How often do you ride your bike?
0
20
40
60
80
100
120
140
160
Complete Bicycle Components/Parts Bike Accessories Other
Nu
mb
er
of
resp
on
ses
What was your most recent bike-related purchase?

167
0
20
40
60
80
100
120
140
160
180
In the lastweek
In the lastmonth
In the last 3months
In the last 6months
In the lastyear
Over 1 yearago
Nu
mb
er
of
resp
on
ses
When was your last bike-related purchase?
0
50
100
150
200
250
Less thanonce a year
1-2 times ayear
3-4 times ayear
Once amonth
Once aweek
More thanonce a week
Nu
mb
er
of
resp
on
ses
How often do you buy bike-related purchases?

168
0
2
4
6
8
10
12
14
16
Bikes are tooexpensive
I am physicallyunable to ride a
bike
I use otherforms of
transportation
I live in an areathat is unsafe or
inconvenientfor biking
I exercise indifferent ways
Other
Nu
mb
er
of
resp
on
ses
Why have you never owned a bike?
02468
101214161820
The bike isaffordable
Bike wasmanufactured
sustainably
The area I livein is more bike
friendly
My currentform of
transportationbecomes more
expensive
I would neverbuy one
Other
Nu
mb
er
of
resp
on
ses
I am more likely to buy a bike if...

169
0
5
10
15
20
25
30
35
Would pay lessthan original
bike
Would payequal to
original bike
Would pay 5%more
Would pay10% more
Would pay20% more
Would pay50% more
Nu
mb
er
of
resp
on
ses
Willingness-to-Pay by Original Bike Price
$100
$200
$400
$600
$900
$1,500
$2,500
$4,000
0
10
20
30
40
50
60
Would pay lessthan original
bike
Would payequal to
original bike
Would pay 5%more
Would pay10% more
Would pay20% more
Would pay50% more
Perc
en
tag
e o
f to
tal
resp
on
se
Willingness-to-Pay by Original Bike Price
$100
$200
$400
$600
$900
$1,500
$2,500
$4,000
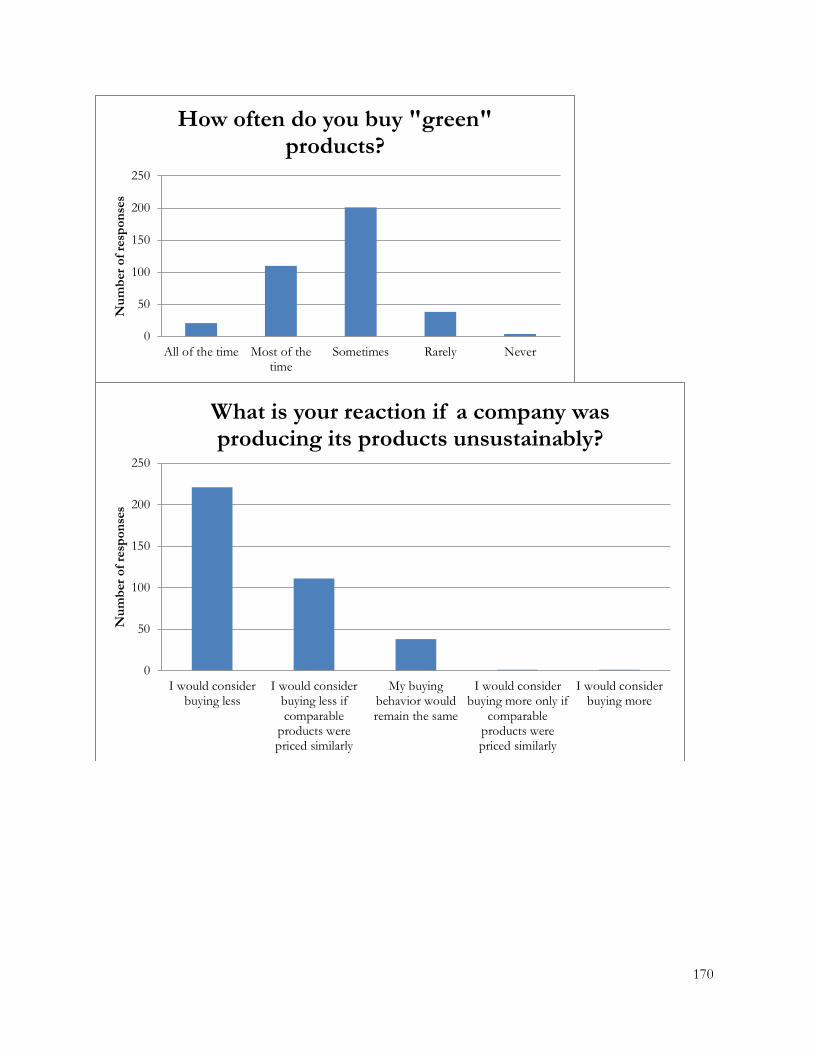
170
0
50
100
150
200
250
All of the time Most of thetime
Sometimes Rarely Never
Nu
mb
er
of
resp
on
ses
How often do you buy "green" products?
0
50
100
150
200
250
I would considerbuying less
I would considerbuying less ifcomparable
products werepriced similarly
My buyingbehavior wouldremain the same
I would considerbuying more only if
comparableproducts werepriced similarly
I would considerbuying more
Nu
mb
er
of
resp
on
ses
What is your reaction if a company was producing its products unsustainably?

171
0
20
40
60
80
100
120
140
160
180
200
I would considerbuying less
I would considerbuying less ifcomparable
products werepriced similarly
My buyingbehavior wouldremain the same
I would considerbuying more only
if comparableproducts werepriced similarly
I would considerbuying more
Nu
mb
er
of
resp
on
ses
What is your reaction if a company was producing its products sustainably?
0102030405060708090
100
Under 18 18-25 26-35 36-45 46-55 55 andover
Prefernot to
say
Nu
mb
er
of
resp
on
ses
Age of Respondents
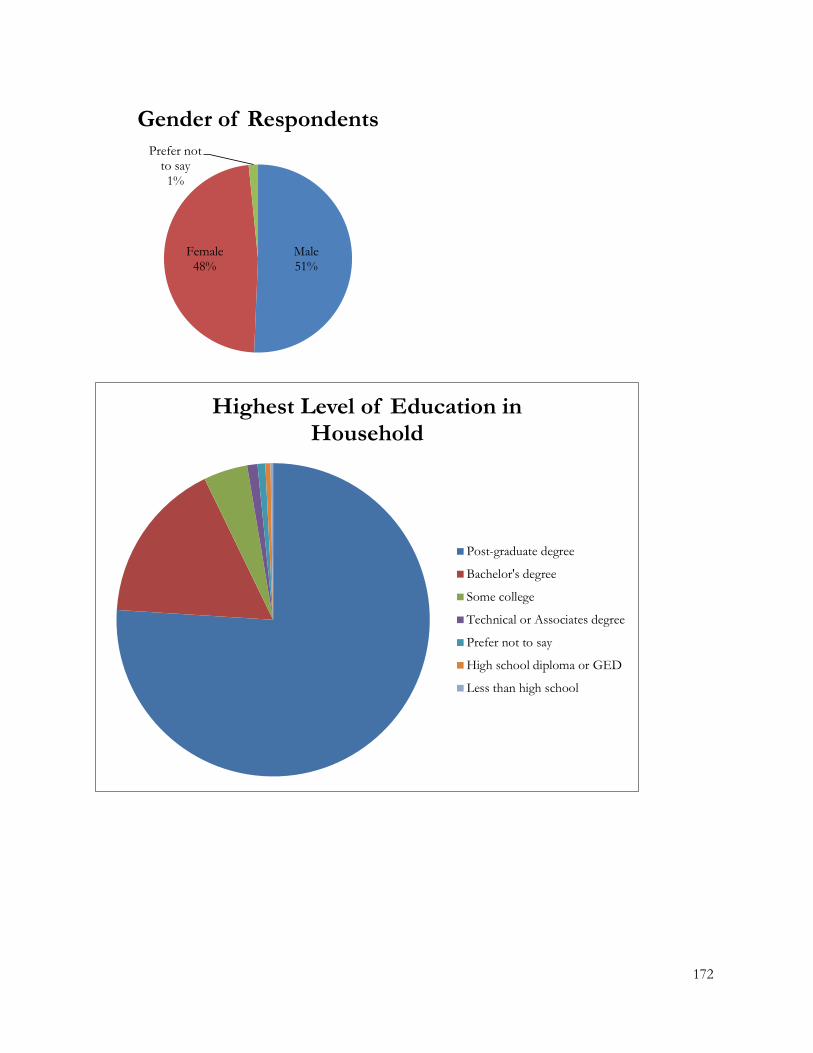
172
Male 51%
Female 48%
Prefer not to say 1%
Gender of Respondents
Highest Level of Education in Household
Post-graduate degree
Bachelor's degree
Some college
Technical or Associates degree
Prefer not to say
High school diploma or GED
Less than high school

173
0
20
40
60
80
100
120
140
160
180
Less than$20,000
$20,000 -$34,999
$35,000 -$49,999
$50,000 -$74,999
$75,000 -$100,000
More than$100,000
Prefer notto say
Nu
mb
er
of
resp
on
ses
Annual Household Income
Primary Form of Transportation Used
Car
Bike
Public Transit
Walk
Scooter/Motorcycle
More than 1 primary form
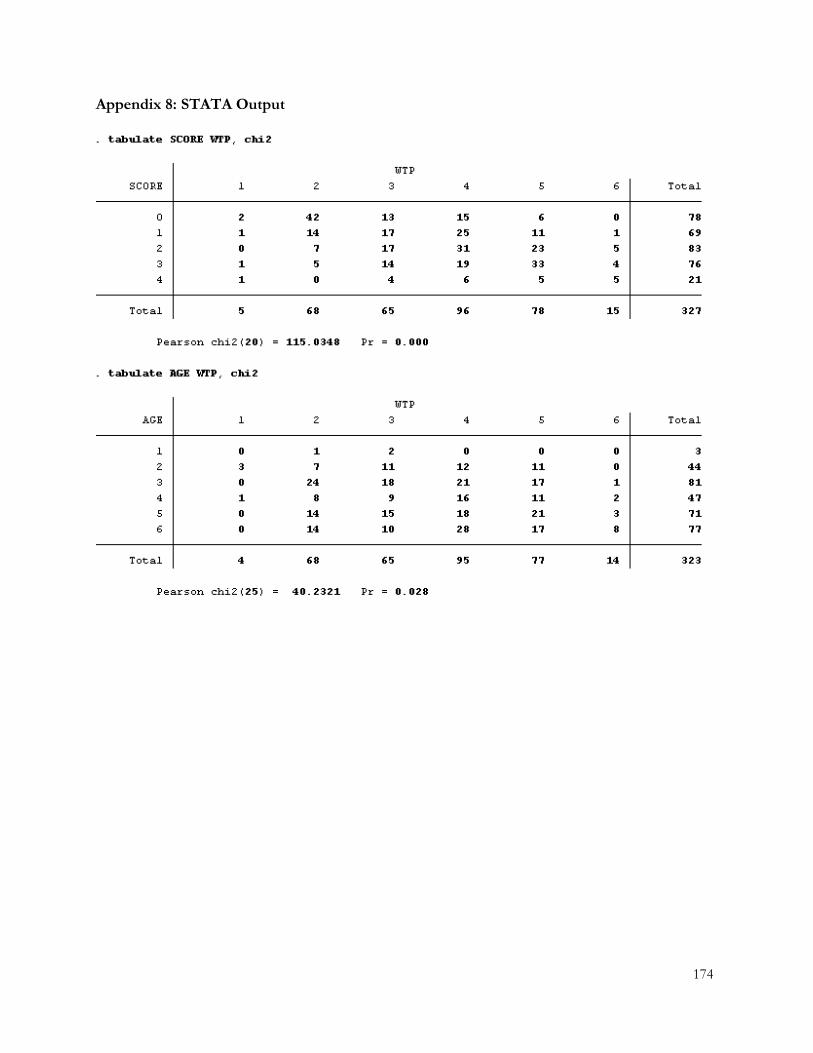
174
Appendix 8: STATA Output

175
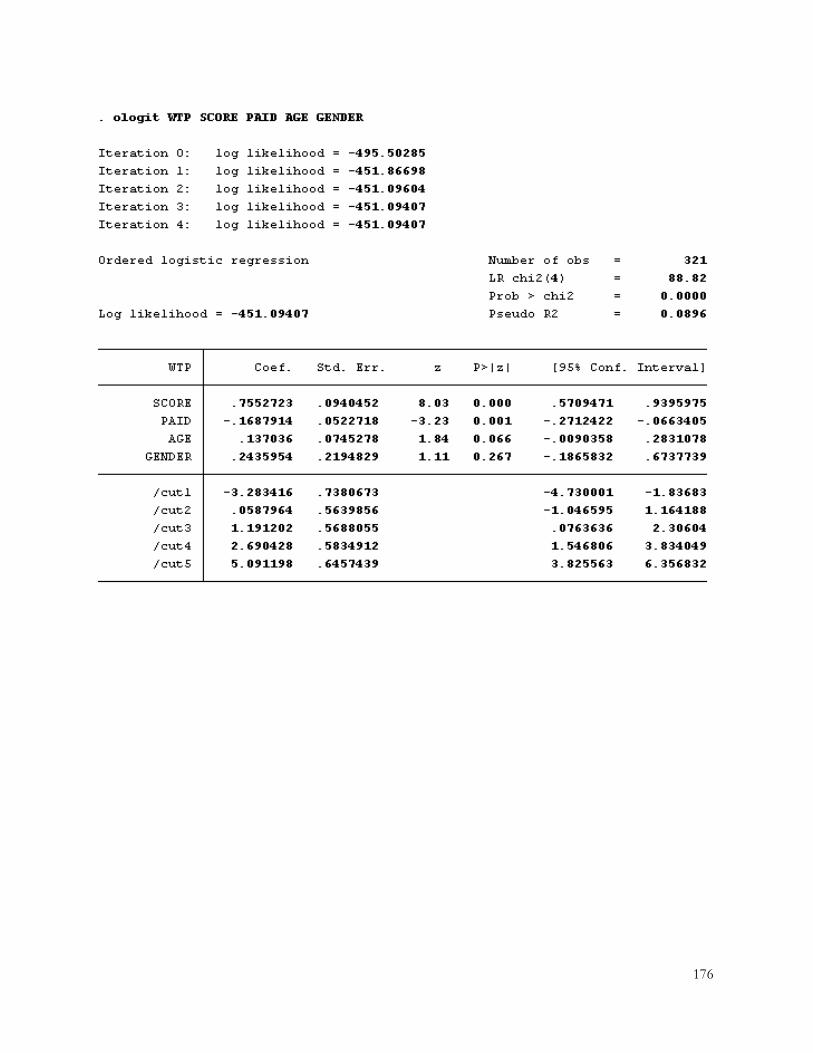
176

177

178