executive office of environmental affairs hassanova, pls ken fields – manager of research effort...
TRANSCRIPT

Executive Office of Environmental AffairsMassachusetts Office of Coastal Zone Management
Massachusetts Chapter 91 Mapping Project
Final Report February 22, 2007

Commonwealth of Massachusetts Page 1 of 78 June 9, 2006 Chapter 91 Mapping Project BSC Group, Inc.
prepared by: BSC Group, Inc. 384 Washington Street
Norwell, MA 02061
Executive Summary In the winter of 2002, the Massachusetts Office of Coastal Zone Management (CZM), in conjunction with the Department of Environmental Protection (DEP), began working on a project with The BSC Group, Inc., an interdisciplinary group of Land Surveyors, Civil Engineers, and Environmental Planners, to map state tidelands jurisdiction, pursuant to Chapter 91 and the Waterways Regulations (310 CMR 9.00). The project was designed to pursue a vigorous and comprehensive plan-based program of historic research, plan evaluation, technical analysis, and professional review to develop presumptive lines of jurisdiction. For those geographic areas that are located on filled tidelands, a key focus of this work included the mapping of Historic High and Low Water Marks as these terms are defined in the Waterways Regulations at 310 CMR 9.02. The project generally covers the entire Massachusetts coast (excluding Provincetown, which was mapped in 1995, and the Elizabeth Islands) from New Hampshire to Rhode Island (including Cape Cod, Martha’s Vineyard, and Nantucket). This report, in conjunction with the appended project notebooks and electronic database includes the following:
• An indexed and cross-referenced cartobibliography of all historic maps, plans, etc. evaluated as part of the research program, including hard and digital copies of all recovered plans.
• A discussion of the methodology used for historic plan registration. • A discussion of potential sources of error and estimated accuracies associated with historic sources
evaluated. • A description of the Sequential Cartographic Analysis (SCA) process developed for the progressive plan
screening and evaluation associated with Historic High and Low Water Mark Determinations (RFR Section 4.0) and ultimately the development of Chapter 91 Shoreline Maps (RFR Section 5.0).
• Documentation of the methodology used in final Historic High and Low Water Mark determination and depiction.
• A discussion of the estimated accuracy of the Historic High and Low Water Lines depicted on the final plans and their conformance with appropriate technical standards and specifications discussed above.
• A discussion of the basis for the depiction of DEP tidelands jurisdiction on the final plans, including documentation of the origin of each jurisdictional line type and a discussion of those lines, such as contemporary high water that, by necessity, have been depicted as approximate and statements of final plan accuracy.
Scot MacDonald, PLS BSC Group, Inc.

Commonwealth of Massachusetts Page 2 of 78 June 9, 2006 Chapter 91 Mapping Project BSC Group, Inc.
prepared by: BSC Group, Inc. 384 Washington Street
Norwell, MA 02061
Table of Contents Executive Summary Pg. 1 1.0 Background and Definitions Pg. 7 2.0 Project Purpose Pg. 9 3.0 Research Pg. 11 3.1 General Considerations Pg. 11 3.2 Potential Sources of Information Pg. 12 3.3 Research Methodology Pg. 14 3.4 Plan Reproduction Pg. 14 3.5 General Types of Plans Recovered Pg. 15 3.6 Archiving and Databasing Pg. 17 4.0 Plan Qualification and Analysis Pg. 18 5.0 Registration Methodologies Pg. 20 5.1 Mathematical Transformations Pg. 21 5.2 Independent Assessment of Plan Registration Pg. 24 5.3 Uncertainty Assessment Pg. 25 5.4 Historical Base Map Pg. 27 6.0 High and Low Water Determination Pg. 29 6.1 Historical High Water Lines Pg. 29 6.2 Historical Low Water Lines Pg. 30 6.3 Historic Shoreline Analysis Pg. 31 6.3 Sequential Cartographic Analysis Pg. 35 6.4 New England Salt Marshes and Sequential Cartographic Analysis Pg. 37 7.0 Interpretation and Use of Chapter 91 Shoreline Maps and Jurisdiction Plans Pg. 40 7.1 Chapter 91 Shoreline Plans and Digital Product Pg. 41 7.2 Jurisdiction Plans Pg. 43 8.0 Deliverable Products Pg. 46 9.0 Summary of Deliverables Pg. 49 10.0 Phase Specific Discussions
10.1 Phase I – Boston Harbor Pg. 50 10.2 Phase II – North Shore Pg. 54 10.3 Phase III – South Shore Pg. 58 10.4 Phase IV – South Coast (Buzzards Bay) Pg. 59 10.5 Phase V – Cape Cod, Martha’s Vineyard, Nantucket Pg. 61
Appendix A – Historical Survey Efforts Pg. 65 Horizontal Datums Pg. 68 Vertical Datums/Tidal Datums Pg. 69 Planes of Reference Pg. 70 Appendix B - 310CMR 9.00 Waterways Jurisdiction Pg. 73 Appendix C – Chesbrough’s Report to the Joint Standing Committee on Boston Pg. 77 Harbor Appendix D – List of municipalities not providing roadway acceptance dates Pg. 78
Commonwealth of Massachusetts Page 3 of 78 June 9, 2006 Chapter 91 Mapping Project BSC Group, Inc.
prepared by: BSC Group, Inc. 384 Washington Street
Norwell, MA 02061
“All maps are graphic interpretations of spatial information. They are abstractions of spatial reality at a point in time where the reality was perceived by a particular author within the framework of accepted cartographic procedures. As such, maps vary in quality with the state of knowledge of an area, the drafting skills of the author, the purpose for which the maps were drawn, and the state of technology that permitted the author to make his original observations and transform them into a map…” Heidenreich, C.F.
Explorations and Mapping of Samuel De Champlain, 1603-1632. CARTOGRAPHICA, Monograph No. 17. 1976. 142 pages (p. xi.)

Commonwealth of Massachusetts Page 4 of 78 June 9, 2006 Chapter 91 Mapping Project BSC Group, Inc.
prepared by: BSC Group, Inc. 384 Washington Street
Norwell, MA 02061
Project Team Massachusetts Office of Coastal Zone Management
Stephen T. Mague - Project Manager Alex Strysky –Project Review Coordinator (formerly of DEP Waterways Program)
Diane Carle, Data Information Manager (formerly of CZM)
Massachusetts Department of Environmental Protection – Waterways Program Ben Lynch – Waterways Program Chief Sharon Pelosi (former Waterways Program Chief)
BSC Group, Inc. Scot Macdonald, M.S., PLS - Project Manager Roger Corbin, PLS Marie Hassanova, PLS Ken Fields – Manager of Research Effort Evanson Browne, Adam Sloat, Lincoln Versoy, Monika Bruzkova, Nicole Girard, Steve Cohen, Ken Thompson, Jeremy Reardon, Timothy Witman, Brad Washburn, Peter Baisley, Magdalena Pavlak-Chiaradia
Geonetics, Inc. Matt von Wahlde – President Andrew Arace, Hichame Tagzine, Gurudev Lotun – Senior Programmers
Boelter & Associates Alice Boelter, President
Urban Harbors Institute/University of Massachusetts, Boston Campus Jack Wiggin – Director, Urban Harbors Institute Dr. Richard Gelpke, Dr. Alberto Giordano
Acknowledgements: The Project Team would like to thank Scott Seiler (Records Manager, DEP Bureau of Resource Protection), Mike Trust, (GIS Database Administrator, MASSGIS) David Doyle (National Geodetic Survey), Greg Ketcham (Harbor Planning Coordinator for the City of Gloucester), Betsy Lowenstein and Christine Gebhard (The State Library of Massachusetts Special Collections), Martha Clark and Janis Duffy (Massachusetts Archives at Columbia Point), Eric Frazier (Boston Public Library Rare Books & Manuscripts), Kathy Flynn (Phillips Library Peabody Essex Museum), Rachel Penner (Phillips Academy Oliver Wendell Holmes Library), Donna Maturi (Peabody Institute Library of Danvers), Lincoln Thurber (Nantucket Athenaeum), Martin von Weiss (Boston Redevelopment Authority), Stephen Z. Nonack, William D. Hacker (Head of Reader Services, The Boston Athenæum), and all other individuals and organizations that provided invaluable assistance in completing this project. The project team would like to extend a special word of thanks to Captain Albert (Skip) Theberge of the National Oceanographic and Atmospheric Administration (NOAA) for providing

Commonwealth of Massachusetts Page 5 of 78 June 9, 2006 Chapter 91 Mapping Project BSC Group, Inc.
prepared by: BSC Group, Inc. 384 Washington Street
Norwell, MA 02061
high quality diapositives of U.S. Coast Survey T and H sheets, his vast knowledge of the history of the U.S. Coast Survey, its development and methods, and perhaps most importantly his ever-present sense of humor. Peer Review Group In September of 2004, CZM convened a Peer Review Working Group (the Group) consisting of knowledgeable and respected professionals with experience in cartography, shoreline mapping and the Chapter 91 licensing process, to review and evaluate project methodology relative to contemporary principles of best practice and standards of professional care applicable to a project of this nature. The Project Team wishes to thank the following participants for their review of project methodology and information, the drafting of incisive and constructive comments and recommendations, and to further project goals: Mr. Daniel J. Bailey, Director Environmental and Land Use Department, Rackemann, Sawyer, & Brewster, Boston, MA. An attorney, and former geologist, Mr. Bailey concentrates his law practice in the areas of zoning, land use and real estate development advising property owners, lenders, fiduciaries, property managers and tenants regarding the applicability and effect of state and local zoning, land use and environmental laws, with particular expertise in the permitting and development of Massachusetts waterfront mixed use projects pursuant to Chapter 91 and the Waterways Regulations (310 CMR 9.00) and all aspects of Brownfields redevelopment in Massachusetts, including site assessment and remediation, drafting and implementation of Activity and Use Limitations (AULs), prospective purchaser agreements and other liability protection measures, environmental insurance and post-remediation development. Dr. Mark R. Byrnes, Senior Coastal Scientist and Principal, Applied Coastal Research and Engineering, Mashpee, MA. As Principal Investigator/Program Manager for more than 55 coastal and nearshore process studies, Dr. Byrnes has developed state-of-science methods for compiling and analyzing historical hydrographic and shoreline map data and surveys; was co-editor of the 2003 publication entitled Shoreline Mapping and Change Analysis: Technical Considerations and Management Implications. Journal of Coastal Research, Special Issue 38; and authored more than 60 publications including:
Anders, F.J. and Byrnes, M.R., 1991. Accuracy of shoreline change rates as determined from maps and aerial photographs. Shore and Beach, 59(1), 17 – 26.
Byrnes, M.R., R.A. McBride, and M.W. Hiland, 1991. Accuracy standards and development of a national shoreline change database. In: N.C. Kraus, K.J. Gingerich, and D.L. Kriebel (editors), Coastal Sediments '91, American Society of Civil Engineers, New York, NY, pp. 1027-1042.
Byrnes, M.R., Baker, J.L., and Feng Li. September 2002. Quantifying Potential Measurement Errors and Uncertainties Associated with Bathymetric Change Analysis. US Army Corps of Engineers, ERDC/CHL CHETN – IV – 50.
Mr. Robert W. Foster, Professional Land Surveyor and Professional Engineer. Hopkinton, MA. A former president of the American Congress on Surveying and Mapping (ACSM) and a former president of the International Federation of Surveyors (FIG), Mr. Foster has testified before the

Commonwealth of Massachusetts Page 6 of 78 June 9, 2006 Chapter 91 Mapping Project BSC Group, Inc.
prepared by: BSC Group, Inc. 384 Washington Street
Norwell, MA 02061
United States Congress and the Massachusetts Legislature; participated in rewriting Minimum Standards Detail Requirements for ALTA/ACSM Land Title Surveys" adopted by the American Land Title Association and ACSM; published articles on the global positioning system (GPS), ethics, professional practice, public relations, mapping the wetlands of Massachusetts, and the need for a land data system in New England; and presented nationally and internationally at numerous conventions and seminars on subjects including the education of surveyors, Spatial Information Management in the 21st Century, and The Importance of International Bodies for Surveyors. Mr. Dean A. Schofield, Professional Engineer, President Schofield Brothers of New England. Mr. Schofield, who as a Senior Project Manager has been responsible for overseeing numerous multi-discipline projects including site planning and permitting for commercial, industrial and residential projects, various GIS mapping projects, and developing mapping standards and procedures for integrating CADD and GIS technologies into local land information systems, serves currently on the committee overseeing revisions to the Rules and Regulations Governing the Practice of Engineering and Land Surveying (250 CMR 1.00-6.00) and is a former Director of the Massachusetts Association of Land Surveyors and Civil Engineers (MALSCE) and President of The Engineering Center (TEC) in Boston, MA.

Commonwealth of Massachusetts Page 7 of 78 June 9, 2006 Chapter 91 Mapping Project BSC Group, Inc.
prepared by: BSC Group, Inc. 384 Washington Street
Norwell, MA 02061
1.0 Background and Definitions Documenting the extent of tidelands jurisdiction is important because of the public’s rights in tidelands and their associated regulatory and legal implications. The Massachusetts Public Trust Doctrine has its roots in the principles of English law, under which the Commonwealth is charged with the protection of public interests in all tidelands. Under early colonial common law, private title to uplands along the shore extended seaward to the high water mark. The Colonial Ordinances of 1641-1647, however, extended private ownership of property bordering tidal waters to the low water mark or 100 rods (1,650 feet) from the high water mark – which ever was less to encourage maritime commerce.1 While the Colonial Ordinances granted shorefront land proprietors ownership of tidelands directly adjacent to their property, the grant respected the traditional nature of the public trust doctrine and continued to reserve rights of “fishing, fowling, and navigation” for the general public.
The waters and submerged lands seaward of private ownership (beyond low water or 100 rods) are held by the State as the sovereign. The right of the legislature regarding the area beyond private ownership is paramount to all private rights and subject only to the authority of the United States government. The Colonial Ordinances of 1641-1647 represent the first codification of the public trust doctrine in America and continue to shape Massachusetts’s waterfront development by Massachusetts General Law Chapter 91 (Chapter 91). Chapter 91, the Public Waterfront Act, is implemented through the Massachusetts Department of Environmental Protection (Waterways Program) through the Waterways Regulations 310 CMR 9.00. Together, Chapter 91 and the Waterways Regulations guide development in a manner that protects, promotes, and preserves the public’s interest in tidelands, great ponds, and non-tidal rivers/streams by establishing performance standards for projects in these areas. The Waterways regulations, 310 CMR 9.02, define tidelands as “present and former submerged lands and tidal flats lying between the present or historical high water mark, whichever is farther landward, and the seaward limit of state jurisdiction.” Consequently, both flowed tidelands, defined as “present submerged lands and tidal flats which are subject to the action of the tides”, and filled tidelands, defined as “former submerged lands and tidal flats which are no longer subject to tidal action because they have been filled”, remain impressed with public rights and are included within the regulatory definition of tidelands. In general, areas of geographic tideland jurisdiction in which activities require authorization pursuant to 310 CMR 9.00 can be summarized as follows:
• Flowed tidelands: any project located in, on, over, or under tidal waters seaward of the present high water shoreline, as defined in 310 CMR 9.02, out to the territorial limits of state jurisdiction.
• Filled tidelands: with the exception of filled tidelands in Designated Port Areas (DPA, as
defined in 310 CMR 9.02), the landward limit of jurisdiction is established by the first
1 Massachusetts Office of Coastal Zone Management Website http://www.mass.gov/czm/shorelinepublicaccess.htm

Commonwealth of Massachusetts Page 8 of 78 June 9, 2006 Chapter 91 Mapping Project BSC Group, Inc.
prepared by: BSC Group, Inc. 384 Washington Street
Norwell, MA 02061
public way in existence as of January 1, 1984 or 250 feet from present high water, whichever is farther landward. Former tidelands located landward of this line are, therefore, not subject to jurisdiction and referred to as being “landlocked”. Within DPAs the landward limit of jurisdiction is the historical high water mark meaning that all filled tidelands are in jurisdiction and the concept of “land locked” tidelands does not apply.
In addition to the characterization of tidelands as filled or flowed, the Waterways Regulations further distinguish tidelands by ownership, depending on their location relative to the present and historical low water boundaries. Comprising the area seaward of the line of private ownership, Commonwealth Tidelands refer to land held by the Commonwealth in trust for the benefit of the public, or land held in private ownership by license or grant from the Commonwealth that is subject to “an express or implied condition subsequent that it be used for public purpose.” Tidelands are presumed to be Commonwealth tidelands if they lie seaward of the current or historical low water boundary or a line 100 rods (1,650 feet) seaward of the current or historical high water mark, whichever is farther landward. Private tidelands refer to those tidelands held in private ownership that are subject to an easement of the public for the purposes of such activities as navigation, fishing, and fowling. Tidelands are generally presumed to be Private Tidelands if, with the exception of certain lands in Provincetown, they lie landward of the historical low water mark or of a line running 100 rods (1,650 feet) seaward of the historical high water mark, whichever is farther landward.

Commonwealth of Massachusetts Page 9 of 78 June 9, 2006 Chapter 91 Mapping Project BSC Group, Inc.
prepared by: BSC Group, Inc. 384 Washington Street
Norwell, MA 02061
2.0 Project Purpose Many of the Commonwealth’s waterfronts have evolved from those of the earliest settlements through the periodic filling or altering of flowed tidelands. The identification of reliable and reproducible historical high and low water marks, therefore, is a fundamental requirement of the Chapter 91 licensing process. Defined in the Waterways Regulations as those marks that “existed prior to human alteration of the shoreline by filling, dredging, excavation, impounding, or other means” the historic high and low water lines are presumed to be those associated with “the farthest landward former shoreline, which can be ascertained with reference to topographic or hydrographic surveys, previous license plans, and other historical maps or charts, which may be supplemented as appropriate by soil logs, photographs, and other documents, written records, or information sources of the type on which reasonable persons are accustomed to rely in the conduct of serious business affairs.” Any contemporary characterization of the public/private nature of the tidelands along the Massachusetts coast, particularly in highly developed waterfront areas, therefore, requires careful inquiry and professional assessment of local and regional historical plans and maps depicting historical high and low water lines. Recognizing the importance of such work to both the public and littoral property owners, the goals of this project are two fold. The first is to undertake a mapping program, grounded in a thorough program of research, analysis, and evaluation of the best available historical plans and information for the Massachusetts coast that will result in an accurate depiction of historical tidal boundaries as they have been defined by the Waterways regulations. In conjunction with this mapping effort, the second goal is to produce plans depicting geographic presumptive lines of DEP jurisdiction in tidelands pursuant to Chapter 91 and the Waterways Regulations. The Waterways Program (DEP) has been delegated the authority of the Legislature to oversee and administer the Chapter 91 licensing process. Since the inception of tidelands licensing in 1866, approximately 20,000 licenses have been issued in Massachusetts in support of coastal development, installation and maintenance of coastal structures, or filling of tidelands.2 Traditionally, jurisdictional determinations have been conducted on a site-by-site basis, relying on site specific historical high and low water information found in DEP’s archives, information provided by project proponents and their consultants, or previous licensing efforts. The site-specific nature of these sources is difficult to use to assess jurisdiction for the entire Massachusetts coastline such as is required for this project. In 2002, the Massachusetts Office of Coastal Zone Management (CZM) selected The BSC Group, Inc. to undertake a systematic program of research, plan assessment, and data compilation to prepare a mapping product that will assist state regulatory agencies with complex determinations of tidelands jurisdiction, particularly in those areas of filled tidelands requiring assessments of historical maps and plans. These mapping products, which depict presumptive lines of Chapter 91 jurisdiction, will provide DEP with a consistent and reliable source of information upon which to make jurisdictional determinations.
2 Commonwealth of Massachusetts DEP website http://www.mass.gov/dep/brp/waterway/faqs.htm

Commonwealth of Massachusetts Page 10 of 78 June 9, 2006 Chapter 91 Mapping Project BSC Group, Inc.
prepared by: BSC Group, Inc. 384 Washington Street
Norwell, MA 02061
Since the filling of Massachusetts tideland areas began in the mid to late 17th century and escalated during the 18th, 19th, and early 20th centuries, a standardized and comprehensive project methodology was required that would facilitate evaluation of historical plans and maps. Recognizing this need, BSC developed a plan-based methodology for establishing and assessing historical shorelines based on the planimetric information and symbology present on historical plans. Recognizing that the best available planimetric evidence can vary with the topography, hydrography, and stability of the site; the type, amount and purpose of the data and other records; and the state of the art and science of surveying at the time the measurement(s) was made3, final determinations of the most appropriate line(s) were, by necessity, the result of an iterative and comparative process relying on multiple sources. Jurisdictional lines based entirely or in part on historical plans, therefore, are the result of the application of a rigorous project methodology, grounded in high quality historical cartographic information, and constructed to meet contemporary standards of professional care for this type of mapping work. As presumptive lines, they represent the best spatial representation of former shoreline conditions that can be documented by the project database. While the database is extensive, it is possible that additional plans or information could be recovered that would support future modification to the line defined by project data sets. 3 p. 150-1, Putting the Public Trust Doctrine to Work

Commonwealth of Massachusetts Page 11 of 78 June 9, 2006 Chapter 91 Mapping Project BSC Group, Inc.
prepared by: BSC Group, Inc. 384 Washington Street
Norwell, MA 02061
3.0 Research General Considerations The foundation of the Chapter 91 mapping project lies with the recovery and analysis of a wide range of coastal maps, plans, and charts that were available through public and private sources. A key part of this process is the systematic assessment of important plan information and characteristics that may prove useful in reconstructing historical shorelines. Not all important information on a plan may be patently obvious. There are attributes, both cartographic and textual, that although not directly attributable to historical tidal boundaries, may support certain conclusions regarding the nature of the mapping, methods used, and its suitability to this project. Generally, plans that serve as a primary source of information for this project have the following characteristics:
• Plans should be spatially correct. The geographic relationships between landforms and other features (man-made or natural) should reflect real world positions.
• Plans should depict shoreline conditions prior to filling or alteration. • Plans should be the result of accepted survey methodology and techniques utilizing
contemporary equipment for the time the plans were produced.
• Plans should reflect information acquired from actual surveys where possible or compiled or adapted from prior works by competent individuals knowledgeable in surveying and mapping.
• Plans should contain sufficient detail to allow registration of plans to the project
horizontal datum.
• Plans, where possible, should reflect actual tidal boundaries (high and low water lines) that are the result of actual surveys and period-specific data. In the case of low water lines, the boundary should be determined through hydrographic survey techniques in use at the time of plan preparation.
• Plans should have consistent cartography and use intuitive or standardized symbology.
• Plans should be prepared at a useful scale. Larger scale plans are typically more useful
than small scale plans. With respect to plan scale, plans should be compiled at scales that facilitate reliable placement of lines on the ground
The primary research goal was to identify, for subsequent rigorous testing and evaluation, the most reliable historical maps/plans illustrating the shoreline and hydrographic conditions that existed prior to human alteration. To that end, the following general guidelines were formed:

Commonwealth of Massachusetts Page 12 of 78 June 9, 2006 Chapter 91 Mapping Project BSC Group, Inc.
prepared by: BSC Group, Inc. 384 Washington Street
Norwell, MA 02061
• Recognize that certain data sources will be more meaningful and useful than others depending on the geographic history of the respective shoreline area or harbor development since the times of early colonial settlement.
• Minimize the time retrieving, reviewing, and recovering marginally useful documents. • Identify and prioritize available historical mapping and licensing information that will
potentially support the ultimate goal of defensible tidelands jurisdictional information while insuring reasonable due diligence has been performed with respect to research.
• Use non-primary source plans that were developed previously for specific sites, such as
c.91 license plans, Land Court plans, or Registry plans where possible to supplement data gaps. These plans often show shoreline conditions from unknown sources and can be extremely difficult to register to a known coordinate system.
DEP’s archives contain a large volume of information related to the issuance of the over 20,000 Chapter 91 permits and licenses prepared over the past 130 plus years. These permit plans provide a wealth of information regarding the programmatic alteration of Massachusetts’ coastlines. At first glance, it would appear that DEP’s archives would provide a primary source of information for the Chapter 91 mapping effort. However, upon review, many of them contain historical high and low water lines as they apply to a given project and often difficult to register to the project datum. Although these licensing plans are adequate for their intended purpose, using them to determine primitive shorelines would mean relying on the decisions and judgment of those preparing them. With no knowledge of the level of care or techniques used in determining these shorelines, it would not be appropriate to use these plans for this project. Instead, a research philosophy was developed that research should be performed at the “source level” to the greatest degree possible. In other words, instead of relying on the judgment of others to interpret historical documents and determine the locations of original tidal boundaries, BSC determined the most prudent course of action would be to focus research efforts on those plans that have been the source for licensing plans along with manuscripts that may have been overlooked by license petitioners. Potential Sources of Information Given the large number of repositories for relevant information, potential sources of information were organized into three categories. Primary, secondary, and tertiary classifications were developed to enable researchers to focus resources in locations that were most likely to produce results.

Commonwealth of Massachusetts Page 13 of 78 June 9, 2006 Chapter 91 Mapping Project BSC Group, Inc.
prepared by: BSC Group, Inc. 384 Washington Street
Norwell, MA 02061
Primary Data Repositories
• Department of Environmental Protection – Waterways Program
• Department of Environmental Management – Waterways Division
• Massachusetts Statehouse Library • Massachusetts State Archives
• National Ocean Survey, U.S. Coast & Geodetic Survey (NOAA)
• City of Boston Archives
• Massachusetts Archives • Peabody Essex Museum
• Boston Public Library • Specific court cases pertaining to historical tideland limits
• BSC’s in-house plan library • Metropolitan District Commission
• Boston Redevelopment Authority
Secondary Data Repositories
• Harvard Map Collection • U.S. Army Corps of Engineers
• Chapter 91 licenses and determination files
• Massport
• Massachusetts Highway Department • Massachusetts Geodetic Survey
• Boston Athenaeum • Woods Hole Oceanographic Institute
• CA/T project (Phase I only) • Local historical societies
Tertiary Data Repositories
• Boston College Library • Massachusetts Institute of Technology
• Mass Maritime Academy • Town Atlases – 19th Century
• Local libraries, historical societies, and town halls
• National Archives – Waltham
• Massachusetts Land Court • Registries of Deeds
• Local Engineering and Planning Departments
• Leventhal map collection
It should be noted that although county registries of deeds would appear, at first glance, to be valuable sources of information, a more careful inspection proved otherwise. Registries in

Commonwealth of Massachusetts Page 14 of 78 June 9, 2006 Chapter 91 Mapping Project BSC Group, Inc.
prepared by: BSC Group, Inc. 384 Washington Street
Norwell, MA 02061
general contain plans that are focused at a parcel, or real estate ownership level as opposed to larger geographic areas. Because of the difficulty in finding sufficient detail on most registry plans, registration to the project datum, where such plans were used, was often difficult. Furthermore, the nature of high and low water features, their origins, and manners in which they were compiled was not always clear or documented.
Similar issues exist with information recovered from the Massachusetts Land Court. Land Court was created in 1898, which was after much of the coastal alteration in developed areas was well under way. Typically, the Land Court has not adjudicated title or riparian/littoral ownership beyond high water as part of the land registration process. Coastal properties registered in Land Court, therefore, contain minimal quantifiable information related to tidal boundaries. Consequently, both Land Court and county registries were used as a tertiary source for researching specific problem areas, if research in other locations did not produce tangible results.
Research Methodology After likely repositories were identified, research crews reviewed individual plans and documents to identify potential sources of pertinent or useful information. The manner in which the search was performed depended upon the filing system used by the particular archive. In some cases, documents of interest were identified quickly through the use of card catalog systems, while in others, researchers had to inspect individual uncataloged plans stored in drawers or bound books. Given the volume of plans to be reviewed, research staff was trained to look for plans with certain characteristics deemed important or relevant to this project. For example, a plan that depicted a high or low water line, prepared by a cartographer known to have produced high quality coastal mapping in the past, or other similar attributes were often utilized as the keys that would trigger a more detailed inspection or inquiry. Further, research methodology was refined to include a preliminary assessment of those areas likely to contain filled tidelands, enabling researchers to focus efforts and resources. Where this assessment indicated a low likelihood of human alteration, the level of research effort was adjusted accordingly. For example, along ocean facing shores that have a documented record of erosion or where the character of a contemporary shoreline was visually determined to be an extensive bluff or rocky coastline typical of New England, it is unlikely that filling had occurred. Plan Reproduction Once a relevant historical document was found, reproducing it for use in the project could be difficult, especially in the case of rare or fragile documents. Many archivists or librarians are reluctant to allow researchers to touch, let alone remove documents for reproduction purposes. In general, reproduction issues can be generalized into two categories:
1) Physical reproduction constraints, and 2) Document access.
Most physical reproduction issues concern the size or fragility of the original document. For this project, BSC had access to the wide-format scanner of the DEP Waterways Program. With a 42” wide carriage, the wide-format scanner allowed for the direct scanning of documents up to 40” wide and any length. The wide-format scanner requires that a user feed a document between a

Commonwealth of Massachusetts Page 15 of 78 June 9, 2006 Chapter 91 Mapping Project BSC Group, Inc.
prepared by: BSC Group, Inc. 384 Washington Street
Norwell, MA 02061
rotating pinch roller and glass plates that houses the scanning device. The roller must make physical contact with the document to be scanned in order to feed the document forward. This direct contact with the document may be undesirable – especially if the document in question is fragile. To protect the document being scanned, BSC sandwiched the plan between two sheets of matte finish mylar. The finished surface of the matte mitigated glare associated with the scanning lamps and provided a protective surface for the plan. This process worked extremely well for plans that fit in the scanner and could be transported to DEP’s offices. For those plans that were bound in books, too big for the wide-format scanner, or that could not be removed from their archive location, a reproduction method other than the wide-format scanner was needed. BSC tried digital photography, with poor results. The resolution, contrast, and distortion of the resulting photographs produced images that were adequate for general review, but were too poor for use in production situations. Instead, BSC employed a new scanning product from Hewlett Packard – the HP Scanjet 4600 see-through scanner (see www.hp.com for specifications). The Scanjet 4600 is a 2400 by 2400 dpi scanner that quickly allows the user to scan plans in sections and “stitch” the individual scanned blocks together into an entire document. It should be recognized that although a small amount of the spatial integrity of a document scanned in this manner is compromised no economical alternative to this process was identified. If the operator is careful to obtain sufficient overlap between adjacent scans, the resultant composite scan is adequate. Most plans scanned in this manner were used to corroborate or further explain shoreline information appearing on other plans and not as primary source documents. BSC received favorable response to our request for access to documents at many collections and archives and was successful reproducing documents of interest. For example, BSC’s research staff was afforded access to the Massachusetts Archives at Columbia point and allowed to transport copies of documents to DEP for scanning. Other agencies such as the Massachusetts Statehouse Library and the National Atmospheric and Oceanic Administration were also very cooperative in lending their expertise and providing access to archived plans. General types of plans recovered The research program yielded plans that could generally be categorized as follows:
• T Sheets: T Sheets (or Topographic sheets) were the original working drafts from which U.S. Coast Survey charts were compiled. They were based on sound, accurate and reproducible surveying methodologies and provide significant planimetric information.
The T Sheets used for this project were produced between 1850 and mid 1900s at a scale of 1:10,000 (1”=830’±). These plans include great detail along the coast and tributaries. BSC, with CZM’s assistance, was able to acquire large format film diapositives of nearly all T Sheets for the Massachusetts Coastline. The diapositives were sent to a Massachusetts based photogrammetric consultant who scanned them at a 24-micron resolution (24 bit gray scale). This produced high-resolution digital copies of the T sheets showing great detail, including faint penciled field notes that would likely have been illegible with other scanning methods. Using a photogrammetric quality scanner, a minimum of distortion was introduced to the scanned image.

Commonwealth of Massachusetts Page 16 of 78 June 9, 2006 Chapter 91 Mapping Project BSC Group, Inc.
prepared by: BSC Group, Inc. 384 Washington Street
Norwell, MA 02061
T Sheets represent an important aspect of the Chapter 91 Mapping Project for several reasons. First, they were produced and updated over several common time frames: 1832-1867, 1868-1898, 1899-1938, and 1933-1954 allowing for a “snapshot” of the Massachusetts coastline at distinct times. Second, the surveyors and cartographers charged with preparation of T Sheets were subject to distinct protocols and instructions as to how the work was to be performed. This contributes to a uniformity in end products, in terms of known quality and cartographic representation, affording BSC’s surveyors the ability to interpret historical lines accurately and consistently. Finally, as discussed in detail later in this report, the T Sheets could be registered easily and reliably.
• H Sheets: H sheets (or Hydrographic sheets) were the offshore analog to the T Sheets and contained a significant amount of hydrographic data as well as historical bathymetry that typically included low water lines. As with the T-sheets, NOAA provided film diapositives of the H Sheets for high-resolution scanning by the photogrammetric sub consultant.
• Historical Plans: There clearly was significant interest in the mapping of Boston and other
active seaports prior to the onset of the Revolutionary War and immediately after. Although these plans are some of the earliest records of detailed mapping available, their spatial accuracy was hard to control because of limitations in surveying and mapping technology available at the time, rendering their use as a primary record of unaltered shoreline limited.
• Pre and post dredge plans: Most recovered plans associated with pre dredge surveys were
generated in the early to mid 1900’s and have limited utility except in certain areas. Post dredge plans were prepared after significant alteration had already occurred – especially below the low water mark.
• Harbor Line/Harbor and Land Commissioners Plans: These plans, generally produced in the
mid to latter 1800s were prepared to control or prevent the development of wharfing into navigational channels. Although such plans did prove helpful in certain circumstances, filling of coastline was already underway in many harbors by the time they were prepared, and the plans were generally of limited utility because they were usually prepared for specific sites.
• Property Line Plans: As mentioned before, most property boundary plans generally focus
on smaller, individual lots and therefore are very difficult to register to the project coordinate system because of lack of planimetric detail.
Given the tremendous volume of plans distributed throughout the State (and in certain instances, out of state), the goal of the research effort was to recover relevant plans and not necessarily every single shoreline plan. Guided by ongoing research efforts and associated plan analysis, the goal was refined to one that would ensure that those plans critical to the historical component of this mapping effort were identified and obtained, allowing BSC to accurately recreate shoreline conditions prior to human alteration. Frequently, as additional documents were identified as being important to the compilation work, this entailed return visits to archival repositories or revitalized efforts to locate less-known plans. Every effort was made to identify

Commonwealth of Massachusetts Page 17 of 78 June 9, 2006 Chapter 91 Mapping Project BSC Group, Inc.
prepared by: BSC Group, Inc. 384 Washington Street
Norwell, MA 02061
and obtain copies of all such plans in order that the database represent as complete a record of the evolution of the Massachusetts shoreline as possible. Based on this knowledge and the lack of a complete and comprehensive database of historical Massachusetts maps and plans, significant sources of information that could augment the results of this project may exist. With this understanding, BSC has prepared end products that can be updated in the future to accommodate additional relevant information. Archiving and Databasing To organize the tremendous amount of plan data recovered by researchers, BSC developed a database and archiving system that allowed researchers to quickly retrieve document information based on any one of a number of different attributes. Using Microsoft Access, the database form allowed researchers to make entries for each document recovered, keying each to a unique identification number.
Figure 1 - Sample database form Note: Each field of the database form corresponds to a searchable entry in the database
Scanned images were copied to a CD that was issued a unique index number. Each image on the CD was then printed on standard letter format paper, its information entered into the database (see Figure 1), and the printed copy bound into a three ring binder. The end result was a series of three ring binders that contained copies of each image cataloged along with the source CD’s. Although time-intensive, the cataloging procedure proved invaluable as plan compilation progressed. The availability of printed copies of each plan image allowed a person working on the plan compilation stages of this project to search the database, select plans of interest based on any of the database fields, identify a document ID number, and quickly retrieve and review the plan from the binder. If the retrieved plan proved to be of interest, its image could be retrieved from CD and registered to the project datum to assist with the identification of historical shorelines.

Commonwealth of Massachusetts Page 18 of 78 June 9, 2006 Chapter 91 Mapping Project BSC Group, Inc.
prepared by: BSC Group, Inc. 384 Washington Street
Norwell, MA 02061
4.0 Plan Qualification and Analysis Before registering plans to the project datum, all copies of maps and plans obtained and cataloged as part of the research work were reviewed and evaluated for potential usefulness in achieving project goals. Initially, plans in the database were sorted and grouped based on geographic area, and using professional judgment, examined closely and screened in accordance with the following criteria.
• Date plan was prepared or published
• Purpose of plan • Was plan based on actual survey or
compiled from other sources? • Name of surveyor or cartographer • What was compilation scale of data?
• What methods were used, or likely used to produce plan?
• Horizontal and/or vertical datums utilized to produce plan
• Registration potential (number, location, and quality of potential registration points)
• Quality/utility of plan and the information depicted on it
To assist with plan assessment and qualification, the most promising historic plans were typically subjected to a preliminary registration for initial evaluation utilizing the following:
A. Plots of contemporary high and low water lines superimposed on the historic plans to help identify areas of filled tidelands.
B. Approximate locations of the first public way in existence as of January 1, 1984 placed on the historic plans to identify potential areas of landlocked tidelands and to refine list of ways requiring confirmation of status (public vs. private) with Town/City Clerks or Engineering Departments.
C. Shorelines on historical plans compared to CZM’s Shoreline Change Project plans and reports to help identify those areas likely to contain filling and areas of natural accretion or erosion.
D. Historical, macro-scale shoreline maps/charts that, while perhaps not suitable for registration or difficult to use because of small scale, spatial anomalies, etc. were valuable as “screening” documents or to provide collateral plan evidence.
E. Traditionally accepted documentation on the type and extent of tidelands jurisdiction such as Baldwin’s survey for Lewis Wharf and other significant Chapter 91 licenses identified by DEP Waterways, etc.
F. Experience of project team
As discussed throughout this report, one of the most consistently useful types of plans recovered during the course of research were the T Sheets produced by the U.S. Coast Survey. T Sheets were the detailed functional worksheets of topographic surveys of the coastline and adjacent land

Commonwealth of Massachusetts Page 19 of 78 June 9, 2006 Chapter 91 Mapping Project BSC Group, Inc.
prepared by: BSC Group, Inc. 384 Washington Street
Norwell, MA 02061
areas from which the early U.S. Coast Survey charts were compiled. Because of their favorable scale (typically 1:10,000 or larger) and purpose, T Sheets have a high level of detail that many other plans of the early 19th century did not have. Furthermore, they were generated using consistent, state-of-the art survey techniques for the time period in which they were produced. After reviewing the high-resolution digital images of the T Sheet diapositives during the qualification stage, several unique characteristics were apparent. First, triangulation points utilized to control survey efforts were marked with clearly recognizable symbology (and in many cases the control point names). These control points proved significant in that when coordinate values were transformed mathematically, they allowed each T Sheet to be accurately registered to the project datum. Consequently, the historical shoreline position at the time of publication of the T sheet could be very accurately compared to the contemporary shoreline position to assess areas that had been filled. Second, T Sheets were produced utilizing consistent survey techniques and cartographic styles allowing for confident interpretation.
Figure 2 – Typical T Sheet Detail
Note triangulation control point on Weymouth Great Hill Third, an important characteristic of the T Sheet mapping is that it provides an almost seamless coverage of the entire coastline of Massachusetts, providing a homogeneous “snapshot” of shoreline conditions for particular time frames. Finally, although filling of tidelands in many areas was well under way by the mid 1800s, T Sheets can be used to develop early 19th century base maps. These base maps, in turn, were used to guide additional research efforts and, as discussed later, assist with the registration of early plans that depict period-specific and common geographic feature locations for which accurate contemporary spatial information may not be available. For these reasons, almost all T-sheets (and, in fact, most H-sheets) were selected for plan registration and further analysis.

Commonwealth of Massachusetts Page 20 of 78 June 9, 2006 Chapter 91 Mapping Project BSC Group, Inc.
prepared by: BSC Group, Inc. 384 Washington Street
Norwell, MA 02061
5.0 Registration Methodologies After completing the initial plan qualification and analysis, the most promising plans were selected for registration to the project datum. The first step to ensuring a successful mapping program on the scale of the Chapter 91 project is implementation of a comprehensive geodetic framework to which every feature is controlled. For this reason, 2001 MASSGIS color digital orthophotos were used as the project base map. The scale of the photography is 1:30,000, obtained at a flying height of 15,000 ft. using a calibrated mapping camera with forward motion compensation. All the images exceed National Map Accuracy Standards at the nominal output scale of 1:5,000 and were registered horizontally to the NAD ’83 datum in meters. Since the orthoimages were utilized as a base for this project, the native coordinate system (NAD83) was maintained as the project datum. An additional benefit to adopting the NAD ’83 datum for this project is the availability of data from agencies such as National Geodetic Survey. This project wide coordinate framework was also used to develop strategies enabling the accurate registration of historical plans to the NAD ’83 datum. Depending upon the content and level of detail of a particular plan, different methodologies were developed to achieve accurate registrations. During the course of plan registration, it was determined that there are prominent spatial features that enable accurate registration of historical plans:
• Triangulation stations: As discussed in previous sections, beginning in the 1840’s, the U.S. Coast Survey established an extensive survey triangulation network to control subsequent mapping efforts resulting in the preparation of T and H sheets. Many of these control points were plotted and labeled on the T/H sheets. Information for many of these early control points is available from National Geodetic Survey’s control datasheet web server (http://www.ngs.noaa.gov/cgi-bin/datasheet.prl). Furthermore, many of the coordinate values for the original triangulation control stations have been archived by National Ocean Survey (NOS) and are available from the National Geodetic Survey (NGS) with NAD ’83 coordinates, facilitating the direct referencing of T/H sheets to the project coordinate system – regardless of the original mapping datum utilized to produce the sheets. (See Appendix A for an overview of historical survey methods and horizontal datums in New England.)
• Latitude/longitude graticules: Often, T/H sheets have latitude/longitude (lat/lon) grid tics or
graticules marked on them. Occasionally, NAD ’27 grids had been added facilitating accurate and direct conversion to NAD ’83. More often the graticules depicted on early T/H sheets were related to one of the early survey datums and because of the difficulty associated with accurately converting geodetic coordinates referenced to obsolete regional or national datums to contemporary datums, they appeared initially to be of minimal use. Through discussions with National Geodetic Survey’s Chief Geodesist, David Doyle, however, a method was developed by which geographic transformations from obsolete datums, referred to the Bessels or Clarke ellipsoids, to the NAD ’83 project datum, referred to the mathematical ellipsoid - GRS 80, could be developed for individual T/H Sheets based on a statistical comparison of obsolete and NAD ‘83 coordinate values for the same points. These transformations were then applied to the grid tics to provide a registration framework for individual sheets.

Commonwealth of Massachusetts Page 21 of 78 June 9, 2006 Chapter 91 Mapping Project BSC Group, Inc.
prepared by: BSC Group, Inc. 384 Washington Street
Norwell, MA 02061
Depending on the nature of information presented on a given plan, both graticules and triangulation stations were used to register a plan to the NAD ’83 datum. Notwithstanding which method was used, it should be noted that points were distributed as evenly as possible throughout a given plan to ensure reliable plan registration with points at the extreme corners of a region being registered providing a stronger geometric solution than having a cluster of many points in a smaller area.
• Physical features: Where geodetic control points or graticules were not available, discrete
physical features such as church spires, monuments, road intersections, building corners, etc. were used as registration points. Two criteria were carefully observed in selecting physical features for use in registration: 1) The point must be visible on both the orthoimage (or, in the case of non-Coast survey plans, an accurately registered T-sheet) and the historical plan being registered, and 2) The user must be certain that location of the registration point hasn’t changed over time. Landforms, stream intersections, or other natural features are not adequate for registration purposes because of their propensity to change over time due to natural changes or man made intervention.
Mathematical Transformations Mathematically, there are several registration transformations available to assist in registering scanned historical plans to the project coordinate system. The transformation used (or not used) depended upon several factors. The scanned image file format, quality of scan, and plan accuracy are important factors to consider when determining the appropriate registration method. Following are descriptions of commonly utilized transformations considered for this project:
• Two point conformal transformation: The two point conformal transformation
utilizes two known control points (common to both the historical plan image and the reference coordinate system) to determine the change in scale, rotation, and translation required to register the historical plan to the reference coordinate system.
o Appropriate use: The conformal transformation would be appropriate in circumstances when plan distortions introduced by reprographic processes are minimal, mapping is very accurate from a spatial standpoint, and the two required registration points were extremely accurate. The two point conformal transformation was primarily used to “pre register” a potentially useful plan to allow for a more rigorous analysis. If the plan looked promising, it was then registered utilizing the non-linear transformation described below. The conformal transformation was also best employed on large scale, geographically localized plans with few registration points.
o Pros & Cons: The conformal transformation preserves the spatial relationship between mapped features with no introduced distortion. Sometimes the only method for approximate registration of plans with few discrete control points.
o Sources of Error and Constraints on use: Should only be utilized with mapping that is spatially accurate with little source distortion. Generally not appropriate for early mapping efforts.
• Affine Transformation: An affine transformation is similar to the two point conformal
transformation with one distinction – where the conformal transformation utilizes a

Commonwealth of Massachusetts Page 22 of 78 June 9, 2006 Chapter 91 Mapping Project BSC Group, Inc.
prepared by: BSC Group, Inc. 384 Washington Street
Norwell, MA 02061
constant scale for both X and Y axes, the affine transformation utilizes different scales for X and Y axes. Translation and rotation are still present.
o Appropriate use: If it is suspected that scanning or reprographic efforts have “stretched” a document in one axis, then an affine transformation could provide an appropriate manner of registration. Similarly, if it were determined that a systematic scaling error existed in one direction, the affine transformation would be an appropriate tool for registration. Because of its limitations, the affine transformation was not employed to register plans.
o Pros & Cons: The affine transformation has a limited use since it is very difficult to determine if a systematic scale error exists in one axis. If such a condition is determined, however, the affine transformation will preserve the scale of the unaffected axis.
o Sources of Error and Constraints on use: Other than scenarios mentioned above, the affine transformation has few other applications in the context of this project. If utilized inappropriately, errors may be incorrectly introduced into one of the two plan axes.
• Non-Linear Transformation: Non-Linear Transformation is the common name of a
transformation process that involves stretching one data layer to meet another based on predefined control points of known locations. Ideally, these control (registration) points must be evenly distributed throughout the image of the historical plan, not grouped in one region. The process is non-linear in that not all reference points on the historical plan image move the same distance to achieve an accurate registration.
Most software packages (for this project, Autodesk’s Raster Design was utilized) will provide a statistical assessment of registration point accuracy prior to rectifying the historical image. Typically, this statistical assessment is expressed in individual residuals of registration points with an overall Root Mean Square (RMS) error. The individual residuals are used to assess the quality of each registration point and points not meeting a predefined accuracy limits can be removed. Table 1 summarizes residual results for a representative sampling of plans registered during the Phase 1 (Boston Harbor) analysis.

Commonwealth of Massachusetts Page 23 of 78 June 9, 2006 Chapter 91 Mapping Project BSC Group, Inc.
prepared by: BSC Group, Inc. 384 Washington Street
Norwell, MA 02061
Plan Type
Production
Period
Scale
Average Number
Registration Control Points
Average Residual (meters)
Maximum Residual (meters)
Minimum Residual (meters)
Standard Deviation
Individual Cartographers
Late 1700s
to 1840s
Varies
4-5
6.0
15.0
3.0
NA
United States Coast Survey
T – Sheets
1840s-60s
1:10,000
8
2.62
4.52
0.74
0.97
1870s-90s
1:10,000
6
2.40
3.05
2.07
0.38
United States Coast Survey H – Sheets
1860s-90s
1:5,000
to 1:20,000
8
3.05
4.94
1.32
1.25
Table 1
Summary of Phase 1 Residuals
Because of the variation in techniques and equipment that produced the historical plans used for this project, a maximum project wide residual was not established. BSC, therefore, employed best professional judgment and knowledge of historical mapping efforts to assess an allowable accuracy limit on a case by case basis. A large RMS error could indicate one of several conditions: 1) One or more of the registration points are not accurate; 2) The spatial accuracy of the entire sheet is suspect and Non-Linear Transformation is not an appropriate method of registration; or 3) the plan has been subjected to significant distortion during the reproduction process or has physical damage such as tearing that would compromise its integrity.
o Appropriate Use: The Non-Linear Transformation is best utilized on plans that
have a known spatial accuracy, but may be subject to small random inconsistencies. For example, the Coast Survey T and H sheets are a known quantity with respect to compilation scale and their accuracy, but may have small variations because of the cartographic techniques utilized in their preparation and unequal distortion of the source media over time. Registration to the project coordinate system would be an appropriate application of a non-linear transformation. Because of its ability to provide a statistical measure of the quality of a plan’s registration, the non-linear method was the preferred method of plan registration for this project.
o Pros & Cons: Non-Linear Transformation provides a method of mitigating small, random inconsistencies that may exist in a plan image. Conversely, if used inappropriately, Non-Linear Transformations may hide large errors in less accurate plans leading to a false sense of accuracy in the registration process.

Commonwealth of Massachusetts Page 24 of 78 June 9, 2006 Chapter 91 Mapping Project BSC Group, Inc.
prepared by: BSC Group, Inc. 384 Washington Street
Norwell, MA 02061
o Sources of Error and Constraints on use: As mentioned above, the Non-Linear Transformation will make any plan “fit” a set of given control points – regardless of the quality of the plan. Consequently, one must pay close attention to the statistical assessment resulting from the Non-Linear Transformation algorithm and refine or reject those registrations that don’t meet pre-defined criteria.
Independent Assessment of Plan Registration Although the Non-Linear Transformation process provides a quantitative measure of registration accuracy, a method of independent assessment of plan registration was developed as an additional measure of quality assurance. This independent check is simple and applicable to any registered historical plan in an efficient manner. After reviewing various statistical methods, the root mean square (RMS) error of a randomly selected set of points (independent of points utilized in the registration process) was calculated. RMS is defined to be the square root of the average of the squared discrepancies. In this case, the discrepancies are the differences in coordinate values of well-defined points on the registered plan and the coordinate values of the same points obtained from a source of higher accuracy. Smaller RMS error values indicate closer agreement between points on the historical image and their true position. To implement this testing process, a random selection of discrete points appearing on both the digital orthoimage and the historical image was selected (i.e. control points withheld from the registration process, church spires, road intersections, monuments, etc). Typically, a minimum of six to eight points was selected per sheet for testing. Coordinates for a given feature were extracted from both the historical image, and ground control coordinates provided by National Geodetic Survey sources or the orthoimage. The differences between known coordinate values and registration map values for the same point were calculated. This process was repeated for each tested point. RMS errors were then calculated from the extracted data set. Since the reported accuracy of the MASSGIS orthophotos exceeds NMAS at the nominal output scale of 1:5,000, when coordinate values were extracted from the orthoimage, they were assumed to be of higher accuracy than coordinate values extracted from the historical image.
The RMS for any coordinate comparison can be calculated by:
where (x-x1) is the difference between coordinate values (X,Y pairs) for a point between the orthoimage and the historical image and “n” is the number of sample points. Due to the number of historical maps utilized for this project, not every registration was subjected to this process. Instead, a representative sampling of T and/or H sheets (from different eras) and other critical plans was performed to establish a general assessment of registration quality. T Sheets tested under this process proved to be extremely accurate with RMS errors typically in the two (2) to five (5) meter range. In general, more recently prepared plans were
nxx
RMS ∑ −=
21)(
Commonwealth of Massachusetts Page 25 of 78 June 9, 2006 Chapter 91 Mapping Project BSC Group, Inc.
prepared by: BSC Group, Inc. 384 Washington Street
Norwell, MA 02061
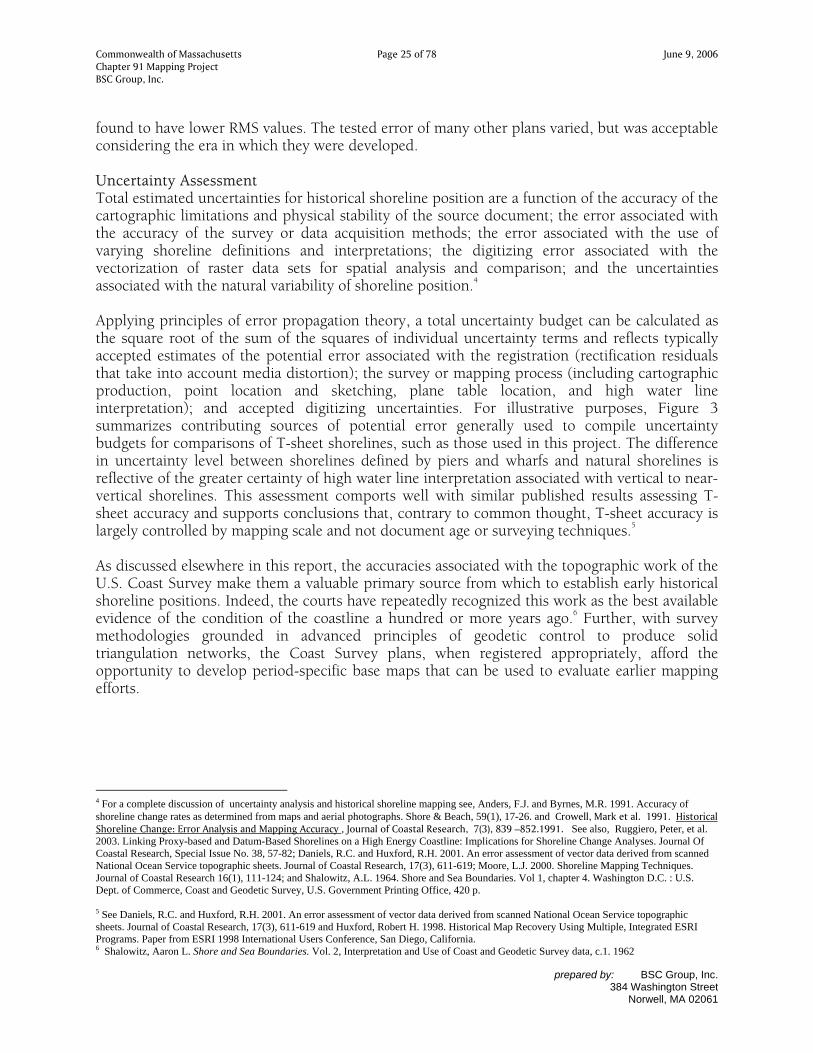
found to have lower RMS values. The tested error of many other plans varied, but was acceptable considering the era in which they were developed. Uncertainty Assessment Total estimated uncertainties for historical shoreline position are a function of the accuracy of the cartographic limitations and physical stability of the source document; the error associated with the accuracy of the survey or data acquisition methods; the error associated with the use of varying shoreline definitions and interpretations; the digitizing error associated with the vectorization of raster data sets for spatial analysis and comparison; and the uncertainties associated with the natural variability of shoreline position.4 Applying principles of error propagation theory, a total uncertainty budget can be calculated as the square root of the sum of the squares of individual uncertainty terms and reflects typically accepted estimates of the potential error associated with the registration (rectification residuals that take into account media distortion); the survey or mapping process (including cartographic production, point location and sketching, plane table location, and high water line interpretation); and accepted digitizing uncertainties. For illustrative purposes, Figure 3 summarizes contributing sources of potential error generally used to compile uncertainty budgets for comparisons of T-sheet shorelines, such as those used in this project. The difference in uncertainty level between shorelines defined by piers and wharfs and natural shorelines is reflective of the greater certainty of high water line interpretation associated with vertical to near-vertical shorelines. This assessment comports well with similar published results assessing T-sheet accuracy and supports conclusions that, contrary to common thought, T-sheet accuracy is largely controlled by mapping scale and not document age or surveying techniques.5 As discussed elsewhere in this report, the accuracies associated with the topographic work of the U.S. Coast Survey make them a valuable primary source from which to establish early historical shoreline positions. Indeed, the courts have repeatedly recognized this work as the best available evidence of the condition of the coastline a hundred or more years ago.6 Further, with survey methodologies grounded in advanced principles of geodetic control to produce solid triangulation networks, the Coast Survey plans, when registered appropriately, afford the opportunity to develop period-specific base maps that can be used to evaluate earlier mapping efforts.
4 For a complete discussion of uncertainty analysis and historical shoreline mapping see, Anders, F.J. and Byrnes, M.R. 1991. Accuracy of shoreline change rates as determined from maps and aerial photographs. Shore & Beach, 59(1), 17-26. and Crowell, Mark et al. 1991. Historical Shoreline Change: Error Analysis and Mapping Accuracy , Journal of Coastal Research, 7(3), 839 –852.1991. See also, Ruggiero, Peter, et al. 2003. Linking Proxy-based and Datum-Based Shorelines on a High Energy Coastline: Implications for Shoreline Change Analyses. Journal Of Coastal Research, Special Issue No. 38, 57-82; Daniels, R.C. and Huxford, R.H. 2001. An error assessment of vector data derived from scanned National Ocean Service topographic sheets. Journal of Coastal Research, 17(3), 611-619; Moore, L.J. 2000. Shoreline Mapping Techniques. Journal of Coastal Research 16(1), 111-124; and Shalowitz, A.L. 1964. Shore and Sea Boundaries. Vol 1, chapter 4. Washington D.C. : U.S. Dept. of Commerce, Coast and Geodetic Survey, U.S. Government Printing Office, 420 p. 5 See Daniels, R.C. and Huxford, R.H. 2001. An error assessment of vector data derived from scanned National Ocean Service topographic sheets. Journal of Coastal Research, 17(3), 611-619 and Huxford, Robert H. 1998. Historical Map Recovery Using Multiple, Integrated ESRI Programs. Paper from ESRI 1998 International Users Conference, San Diego, California. 6 Shalowitz, Aaron L. Shore and Sea Boundaries. Vol. 2, Interpretation and Use of Coast and Geodetic Survey data, c.1. 1962

Commonwealth of Massachusetts Page 26 of 78 June 9, 2006 Chapter 91 Mapping Project BSC Group, Inc.
prepared by: BSC Group, Inc. 384 Washington Street
Norwell, MA 02061
1:10,000 T SheetsPlane Table Aerial 1:5000 Orthos
1840s-1860s 1870s-1890s 1930s-1950s 2001Rectification/Registration Error 3 2.5 2.5
includes media distortion*
Reported Orthophoto Accuracy 4.25Survey/Cartographic Error Natural Beaches 8.6 8.6 7.7 3 Wharfs/Walls 8.0 8.0 5.9 1
Spatial Orientation**, includes: 3.5 3.5 3Inaccurate Control Pts.
Plane Table LocationShoreline Placement 5 5 5
Field Survey, includes: 5 5Point Location
Point SketchingHWL Interpretation***
natural beach 3.5 3.5 5 3wharfs/walls 1 1 1 1
Digitizing Uncertainties 3.3 3.3 3.3 1.40.30 mm line thickness 3 3 3
Digitizer accuracy 1 1 1 1Operator Error 1 1 1 1
Total Uncertainty (beaches) 1840s-1860s 1870s-1890s 1930s-1950s 2001meters 9.7 9.6 8.2 5.4
feet 31.9 31.4 26.9 17.7
Total Uncertainty (walls) 1840s-1860s 1870s-1890s 1930s-1950s 2001meters 9.1 9.0 7.2 4.6
feet 29.9 29.4 23.7 15.1
* Media distortion is dependent upon type of media, relative humidity, & direction of grain (non synthetic media) and accounted for in the rectification/registration process.** Consistent with random testing of well-defined points.***Shalowitz reports the approximate error in determination of high water line along natural shorelines by topographic field crews as approximately 3-4 meters. Uncertainty estimate for vertical to near-vertical walls estimated to be < 1 meter
Figure 3 Uncertainty Budgets

Commonwealth of Massachusetts Page 27 of 78 June 9, 2006 Chapter 91 Mapping Project BSC Group, Inc.
prepared by: BSC Group, Inc. 384 Washington Street
Norwell, MA 02061
Historical Base Map The ability to estimate potential uncertainties and the consistency of registration results associated with the Coast Survey’s T sheets contributed to the decision to develop a mid-1800s base map. This base map could then be used to help register earlier plans, particularly those depicting possible geographic registration points no longer appearing on contemporary maps, and against which further assessments could be made with respect to early coastal filling. Use of the T-sheets as a base map allowed these subsequent analyses to take advantage of the following characteristics of Coast Survey work, not universally encountered in other early mapping efforts.
1. Accuracy: The refinement of mapping techniques and equipment resulted in a spatially accurate historical base map. Manuals of instruction documenting Coast Survey work, methods, and standards supported product quality and consistency, independent of the individual surveyor or cartographer.
2. Geographic scope: T and H sheets were prepared for the entire coastline of Massachusetts.
3. Cartographic consistency: T and H Sheets exhibit a consistency of documented
cartographic styles that make identification and interpretation of coastline features less prone to error. Inspection of final charts prepared from T and H Sheets provided additional insight as to symbology displayed on T and H sheets.7
4. Legal recognition: T and H Sheets have been used in many court cases involving the
position of historical and shoreline features. The reliability of the mapping has continually been recognized by the courts in this matter. 8
5. Ease/accuracy of registration: Because original triangulation stations and latitude/longitude
tic marks are depicted, accurate and quantifiable registrations are facilitated.
Once pertinent T and H Sheets were registered in accordance with the procedures outlined above, attention was turned to Alternative Source Plans (or ASP’s which are described in further detail in Section 6.0 below) recovered from the project database. Because of the more localized geographic scope of most ASP’s, they likely did not contain geodetic control or graticules. Consequently, geodetic based methods of registration were not appropriate. Depending on when a particular ASP was published, they often depicted discrete points (i.e. road intersections, churches, etc.) that are also prominent on the registered T Sheet. These Points in Common (PIC’s) could then be utilized to register the ASP’s to the project datum. Figure 4 depicts a flow chart outlining the methodology followed for the registration of historical plans selected for this project.
7 As compilations and reductions of Coast Survey T and H sheet efforts, charts (constructed to serve the navigational needs of mariners) were not used as primary sources for historical line development. They did, however, serve as an extremely valuable source of information for the correct interpretation of t and H sheet symbology. 8 Aaron L. Shalowitz, Shore and Sea Boundaries, Volume 2, Publication 10-1, U.S. Department of Commerce, Chapter 1

Commonwealth of Massachusetts Page 28 of 78 June 9, 2006 Chapter 91 Mapping Project BSC Group, Inc.
prepared by: BSC Group, Inc. 384 Washington Street
Norwell, MA 02061
Figure 4 Flow chart for plan registration process developed for the Chapter 91 mapping project

Commonwealth of Massachusetts Page 29 of 78 June 9, 2006 Chapter 91 Mapping Project BSC Group, Inc.
prepared by: BSC Group, Inc. 384 Washington Street
Norwell, MA 02061
6.0 High and Low Water Determination Due to differences in surveying methods and cartographic styles employed by the multitude of surveyors producing plans and maps from the 16th to 20th centuries, one of the challenging aspects of this project proved to be the assessment and identification of historical high and low water lines depicted on historical documents. Differences in symbology, line weights, and line types all affect decisions regarding the correct interpretation of historical plans. With the exception of the Coast Survey’s T and H Sheets, wide variation in cartographic style and map presentation was encountered with many of the recovered documents. Consequently, a careful review of all elements of a historical map in context with other historical plans and charts, contemporary plans, and contemporary orthophotos was necessary to ensure that plan features were interpreted correctly in the determination of historical tidal boundaries. Before describing the high and low water determination process, the following two sections provide a brief background and discussion regarding the various sources, methodologies for obtaining, and interpretations of typical high and low water lines encountered while reviewing the historical plans. At a minimum, some familiarity with these characteristics is necessary to ensure proper feature (i.e., historical high or low water line) identification and selection. Historical High Water Lines Accurate assessment of pertinent elements of historical plans depicting the location of high and low water lines, requires a basic understanding of the underlying nature of the lines being depicted. The high water line on a map or plan represents the intersection of the land with the water surface at the elevation of high water. Land above the high water line is upland while land seaward of this line is subject to tidal action. From earliest times and until the advancement of the datum-referenced surveys of the mid- to late-19th century, the high water line has routinely been approximated from observations of visual cues such as wrack or seaweed lines and water staining. With regard to the early work of the U.S. Coast Survey, Shalowitz notes that “…the high water line is the only line of contact between land and water that is identifiable on the ground at all times and does not require the topographer being there at a specified time during the tidal cycle or the running of levels. The high water line can generally be closely approximated by noting the vegetation, driftwood, discoloration of rocks, or other visible signs of high tides”9 And further “ …the topographer, who is an expert in his field, familiarizes himself with the tide in the area, and notes the characteristics of the beach as to the relative compactness of the sand (the sand back of the high - water line is usually less compact and coarser), the difference in character and color of the sun cracks on mud flats, the discoloration of the grass on marshy areas, and the tufts of grass or other vegetation likely along the high-water line.”10 Notwithstanding the particular method used by individual Coast Survey topographers, it is clear from published Survey Instructions and reports that “…on all of our [U.S. Coast Survey] topographic surveys the intention was to delineate, as near as it was possible to determine without recourse to leveling, the line of mean high water.”11 For those interested, Shalowitz’s Shore and Sea Boundaries, Volume 2, chapter 4 contains an extensive discussion of high water,
9 Shalowitz, A. 1964 Shore and Sea Boundaries, Volume 2, page 172, U.S. Government Printing Office, Washington, D.C. 10 Ibid. 11 Ibid.

Commonwealth of Massachusetts Page 30 of 78 June 9, 2006 Chapter 91 Mapping Project BSC Group, Inc.
prepared by: BSC Group, Inc. 384 Washington Street
Norwell, MA 02061
its importance to mariners, and the manner in which it was located for T Sheets. Regardless of the cartographer, of all common tidal datums, high water proved to be relatively easy to identify and on most coastal maps was denoted clearly through the use of prominent line weights, line type, or notes. Historical Low Water Lines Low water boundaries present a different set of challenges and are one of the most uncertain and difficult features to delineate in the field and identify on historical plans. Indeed in many cases, the hydrographic and topographic surveys of the Coast Survey provided the only authentic evidence available. First, low water is only visible for two short periods during the day when the tide has ebbed to its lowest point. Since coastal surveyors functionally could not locate low water directly, it needed to be derived from other methods. The most commonly employed method, as evidenced by H Sheets, is the hydrographic survey. Depth measurements, or soundings, were taken from boats at regular intervals along the entire Massachusetts coastline. These soundings were reconciled with tidal data to produce discrete elevations (or depths) related to a particular datum. Low water lines were then interpolated from this data in a manner similar to the derivation of topographic contours. When compiling and comparing low water line data particular attention must be paid to the plane of reference to which the hydrographic work was related. Early hydrographic mapping was often related to one of the following datums:
• Low Water (LW) or Mean Low Water (MLW): The average of all low waters over a given period. Today, the accepted period over which tidal observation should be averaged has been established as the 19 year metonic cycle.
• Low Water Springs or Mean Low Water Springs (MLWS): The average of the lowest
point of all tidal cycles during the spring tide period when the tidal range (the difference between high and low water) is at its greatest.12
• (Mean) Lower Low Water (MLLW): There are two tidal cycles that occur every 24 hours.
(Mean) lower low water reflects the average of the lower of the two daily low tides over a period of time.
Careful examination of the notations on many of the H Sheets indicates that much of the earlier hydrographic work was routinely performed on a Low Water Springs datum. This follows from the chart based goals of these mapping efforts since a low water spring datum is functionally lower than a normal low water datum, representing a worst case in terms of reported water depths available for ships and navigation. Later, the standard datum for H Sheet production was shifted to MLW, a low water line that is comparatively higher, translating horizontally into a somewhat more landward line than that of the MLWS line. According to H Sheet 1960 (circa 1846-1853), the difference between MLW and MLWS for Boston Harbor was approximately 1.3 feet. Today for the same region, this difference has been determined to be 0.76’. (See Appendix A for an overview of historical survey methods and vertical datums in New England.)
12 Spring tides occur twice each mean around the times of the full and new moons.
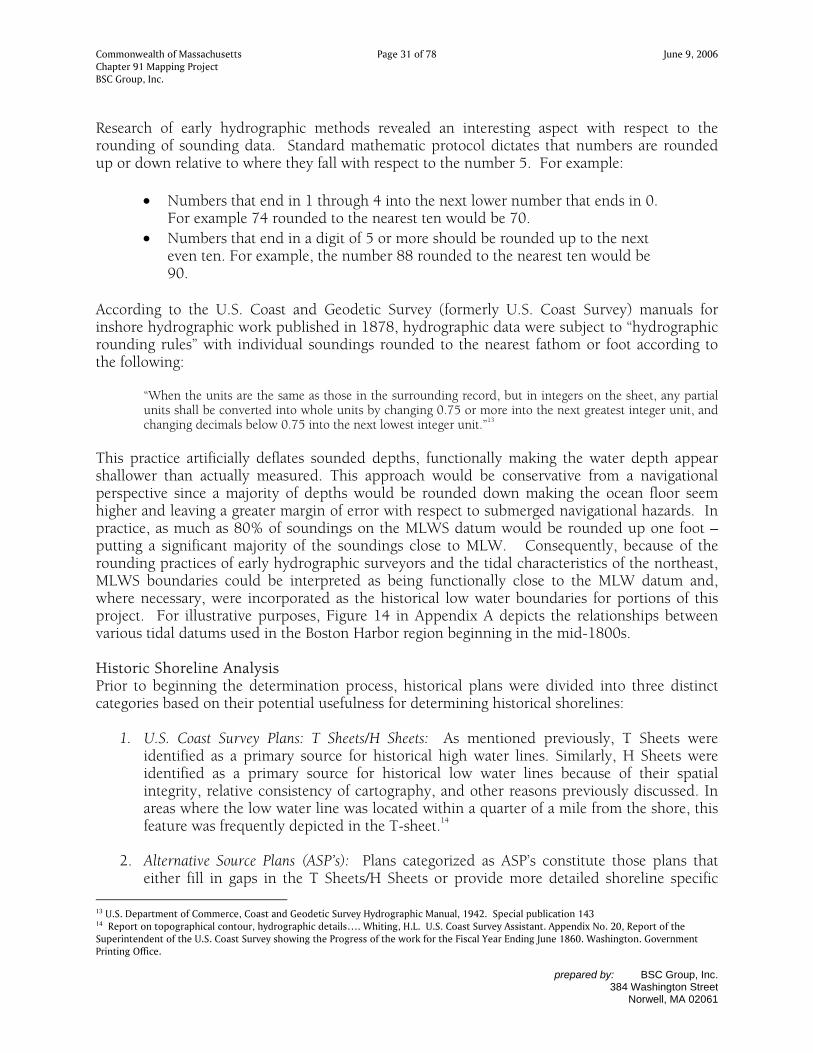
Commonwealth of Massachusetts Page 31 of 78 June 9, 2006 Chapter 91 Mapping Project BSC Group, Inc.
prepared by: BSC Group, Inc. 384 Washington Street
Norwell, MA 02061
Research of early hydrographic methods revealed an interesting aspect with respect to the rounding of sounding data. Standard mathematic protocol dictates that numbers are rounded up or down relative to where they fall with respect to the number 5. For example:
• Numbers that end in 1 through 4 into the next lower number that ends in 0.
For example 74 rounded to the nearest ten would be 70. • Numbers that end in a digit of 5 or more should be rounded up to the next
even ten. For example, the number 88 rounded to the nearest ten would be 90.
According to the U.S. Coast and Geodetic Survey (formerly U.S. Coast Survey) manuals for inshore hydrographic work published in 1878, hydrographic data were subject to “hydrographic rounding rules” with individual soundings rounded to the nearest fathom or foot according to the following:
“When the units are the same as those in the surrounding record, but in integers on the sheet, any partial units shall be converted into whole units by changing 0.75 or more into the next greatest integer unit, and changing decimals below 0.75 into the next lowest integer unit.”13
This practice artificially deflates sounded depths, functionally making the water depth appear shallower than actually measured. This approach would be conservative from a navigational perspective since a majority of depths would be rounded down making the ocean floor seem higher and leaving a greater margin of error with respect to submerged navigational hazards. In practice, as much as 80% of soundings on the MLWS datum would be rounded up one foot – putting a significant majority of the soundings close to MLW. Consequently, because of the rounding practices of early hydrographic surveyors and the tidal characteristics of the northeast, MLWS boundaries could be interpreted as being functionally close to the MLW datum and, where necessary, were incorporated as the historical low water boundaries for portions of this project. For illustrative purposes, Figure 14 in Appendix A depicts the relationships between various tidal datums used in the Boston Harbor region beginning in the mid-1800s. Historic Shoreline Analysis Prior to beginning the determination process, historical plans were divided into three distinct categories based on their potential usefulness for determining historical shorelines:
1. U.S. Coast Survey Plans: T Sheets/H Sheets: As mentioned previously, T Sheets were identified as a primary source for historical high water lines. Similarly, H Sheets were identified as a primary source for historical low water lines because of their spatial integrity, relative consistency of cartography, and other reasons previously discussed. In areas where the low water line was located within a quarter of a mile from the shore, this feature was frequently depicted in the T-sheet.14
2. Alternative Source Plans (ASP’s): Plans categorized as ASP’s constitute those plans that
either fill in gaps in the T Sheets/H Sheets or provide more detailed shoreline specific 13 U.S. Department of Commerce, Coast and Geodetic Survey Hydrographic Manual, 1942. Special publication 143 14 Report on topographical contour, hydrographic details…. Whiting, H.L. U.S. Coast Survey Assistant. Appendix No. 20, Report of the Superintendent of the U.S. Coast Survey showing the Progress of the work for the Fiscal Year Ending June 1860. Washington. Government Printing Office.

Commonwealth of Massachusetts Page 32 of 78 June 9, 2006 Chapter 91 Mapping Project BSC Group, Inc.
prepared by: BSC Group, Inc. 384 Washington Street
Norwell, MA 02061
information. These gaps can be either spatial gaps (i.e. no T Sheets exist in a given area) or temporal in nature. Where filling was identified prior to the mid-1800s, ASP’s in the database that could be registered were utilized to identify the most landward shoreline. In these instances, the research database was screened to recover plans produced prior to filling activities. Plans showing reconstructed shorelines were types of ASPs evaluated as part of this project and were helpful in areas, such as downtown Boston and Salem, where extensive filling and wharfing occurred prior to the production of the earliest T Sheets. Typically, in the case of reconstructed shorelines, the cartographer researched other sources of information such as property deeds, parole evidence, subsurface investigations, etc. to re-create the location of an unaltered shoreline.
A good example of a reconstructed shoreline is work performed by Ellis S. Chesbrough in the early 1850s. The “Joint Standing Committee on Boston Harbor” commissioned Chesbrough, the city engineer at the time, to investigate the extent of filling that had occurred in Boston Harbor to date and its effects on shipping. Chesbrough, applying his civil engineering expertise, conducted a careful study of extant historical maps and contemporary (i.e. 1850s) mapping information to determine the location the pre-fill shorelines for much of Boston and “Boston Neck”.15
3. Collateral Plans: Collateral Plans (CP’s) constitute plans that, although they couldn’t be
reliably registered, proved to be valuable to visually confirm and support conclusions drawn from T Sheets or ASP’s. This confirmation can be either a spatial confirmation such as an agreement with historical shorelines compiled from a primary source or confirmation of shoreline conditions. For example, where T sheet symbology indicated that a portion of a marsh area was located landward of the high water line, a CP with notes that the area was “dry at high water” or “covered at spring tides”, could be used to confirm the validity of the initial interpretation.
Remaining plans in the database were those determined to be of minimal use in the furtherance of project goals. For example, plans prepared long after filling occurred, plans with poor spatial quality, or plans with little or no detail were all categorized as being of minimal use and, while included in the database, were not registered to the project datum. Registration of all early T sheets produced a base map that was used for the purpose of historic shoreline analysis. As shown in Figure 4, subsequent comparisons between the T sheet shoreline and the contemporary (orthoimage) shoreline resulted in one of several possible scenarios:
• A strong correlation between the historical and contemporary coastlines exists, indicating
a “no fill” condition. Conclusion: Hold the contemporary coastline. This condition is particularly obvious in areas such as marshes, large coastal bluffs, and rocky coastlines.
15 Chesbrough, E., Report of the Joint Standing Committee on Boston Harbor for the Year 1852, 1853. City of Boston Archives and Records Management Division. See Appendix C for a copy of Chesbrough’s report containing background information describing the methods and analysis utilized in his historical reconstruction efforts.

Commonwealth of Massachusetts Page 33 of 78 June 9, 2006 Chapter 91 Mapping Project BSC Group, Inc.
prepared by: BSC Group, Inc. 384 Washington Street
Norwell, MA 02061
• There is a strong correlation between the historical and contemporary coastlines, however planimetric features exist on the plans indicating a strong possibility of filling that may have occurred prior to development of the T sheet. Evidence of filling would be the existence of piers, wharves, bulkheads and similar structures.
Conclusion: Review the recovered plan database to extract plans for the area of interest that were developed prior to the publication of the T Sheet, depict unaltered shorelines, and contain potential registration points.
• The contemporary coastline is seaward of the historical T sheet coastline, indicating that
filling may have occurred subsequent to development of the T Sheet.
Conclusion: Initially assume that the earliest T sheet shoreline represents the most landward shoreline, subject to refinement through Sequential Cartographic Analysis (SCA) as depicted in Figure 5 and discussed below.
• The historical T Sheet coastline is seaward of the contemporary coastline indicating the
possibility of dredging or coastal erosion.
Conclusion: In accordance with the c. 91 regulations, hold contemporary shoreline since it is more landward of the historic.
• The section of shoreline in question is depicted on the historic plan as either salt marsh
or as a naturally occurring and dynamic landform that appears to have been filled as shown on the contemporary plan.
Conclusion: For these areas, selecting the earliest shoreline may not be appropriate. For example, as mapping symbology evolved, areas of salt marsh formerly mapped as one unit were further refined to depict those areas of marshes that were mostly submerged at high water. For these cases, use of early mapping alone would not detect the more landward high water line in the marsh. Similarly, use of only early maps in areas of dynamic features located on sandy shores, such as barrier spits and inlets, could result in an incorrect shoreline selection that is the result of natural migration. For these cases, a more recent plan depicting the shoreline prior to human alteration was generally found to be more appropriate.
The results of this initial analysis were used to identify likely areas of filled tidelands as illustrated in Figure 6. Determination of final tidal boundaries (i.e., the most landward historical or contemporary boundaries) to be used in developing Chapter 91 Jurisdiction Plans was completed through the rigorous application of the Sequential Cartographic Analysis (SCA) process.

Commonwealth of Massachusetts Page 34 of 78 June 9, 2006 Chapter 91 Mapping Project BSC Group, Inc.
prepared by: BSC Group, Inc. 384 Washington Street
Norwell, MA 02061
Figure 4 Flow chart outlining process for determination of appropriate tidal boundaries

Commonwealth of Massachusetts Page 35 of 78 June 9, 2006 Chapter 91 Mapping Project BSC Group, Inc.
prepared by: BSC Group, Inc. 384 Washington Street
Norwell, MA 02061
Sequential Cartographic Analysis (SCA) As discussed above, the spatial reliability of the early T-sheets allowed for their use as a base map that provided a working plan of historical shoreline conditions for the 1840s and 1850s. Subsequently, shoreline conditions of the base map were compared with those of earlier plans to determine the presence of more landward shoreline(s), a condition typically indicating the placement of fill prior to the initial fieldwork of the Coast Survey. Recognizing that “the earliest plan” may not represent the most landward shoreline, shoreline conditions of the early T-sheet base map were also compared with later (i.e., more recent) T-sheets and ASPs. These iterative comparisons proved significant for several reasons:
• Sequential comparisons with more recent mapping efforts often revealed the existence of more recent and landward shoreline positions, the result of natural erosion, dredging, or upland excavation.
• Similarly, some comparative analyses with more recent maps indicated a more seaward or alternative shoreline position, the result of natural accretion or the natural movements of dynamic coastal landforms such as estuarine inlets, barrier spits and, and barrier beaches.
• Finally, sequential comparisons with more recent plans allowed reviewers to take advantage of the additional planimetric detail acquired through more sophisticated and standardized surveying and mapping techniques and evolving plan symbology. As discussed below, attention to the plan symbology and plan detail of more recent plans was particularly helpful with identifying the location of the high water line in areas of salt marsh filled after production of the early series T-sheets.
The process of comparing shoreline conditions of the early T-sheet base maps sequentially and iteratively to plans that pre- and post-date T-sheet fieldwork was termed Sequential Cartographic Analysis (SCA). SCA served as the organizing framework for conducting comprehensive and systematic plan-based inquiries into high and low water line determinations. Rigorous application of this process ensured that determinations were based on the best available information obtained during research, and reflected shoreline conditions that existed as close to the time of filling as possible (but still pre-dating it). Figure 5 depicts the detailed process of SCA and illustrates the importance of assessing the shoreline conditions depicted on both early and more recent plans when making high and low water determinations related to Chapter 91 jurisdiction.

Commonwealth of Massachusetts Page 36 of 78 June 9, 2006 Chapter 91 Mapping Project BSC Group, Inc.
prepared by: BSC Group, Inc. 384 Washington Street
Norwell, MA 02061
Figure 5 Detail of Sequential Cartographic Analysis (SCA)

Commonwealth of Massachusetts Page 37 of 78 June 9, 2006 Chapter 91 Mapping Project BSC Group, Inc.
prepared by: BSC Group, Inc. 384 Washington Street
Norwell, MA 02061
New England Salt Marshes and Sequential Cartographic Analysis The use of SCA was particularly helpful with the identification of the appropriate high water lines in areas of filled salt marsh. In general, salt marsh comprises land area that is located both above high water and below high water but above low water (i.e. only portions of the marsh are daily inundated by high tide). With respect to early T Sheets, the seaward edge of the marsh, and not a high water line within the marsh, was typically located and depicted. While topographers routinely located the inner and outer edges of marsh, absent additional information, all that can be inferred today is that the high water line in the marsh was located somewhere between these two lines. Shalowitz provides examples of forms of additional information that can shed light on determining the location of the high water line in salt marsh areas.
“In one of the great marsh expanses along the Massachusetts coast, much light was thrown on the interpretation of the outer marsh line by the statement that ‘while the outer edge of the marsh as shown on this sheet is a definite line at about half tide the line of demarcation between marsh and water at high tide is in most cases considerably further inshore and not well defined”
Similarly,
“If the records for the contemporary hydrographic survey showed that the sounding lines were run at high water or nearly high water and the lines stopped short of the outer edge of the marsh, it would be a strong indicator that the boat could not penetrate beyond the outer edge because there is not enough water to float it… which would throw additional light on the status of the marsh area”16
Salt marshes depicted on the historical base map generally do not show the location of the high water within the marsh but rather the seaward edge of marsh vegetation. Without supplemental information such as that provided by ASPs identified through the SCA process, therefore, it is often difficult to draw definitive conclusions regarding the location of the high water line in filled salt marshes. With the information provided by more recent ASPs, the analysis of salt marsh areas was further supplemented with the following observations.
• Frequently, a more landward location of the high water line could be identified in the SCA process. More sophisticated symbology and additional planimetric detail appearing on chronologically successive topographic and hydrographic surveys often revealed whether marsh areas were submerged or dry at high water. This information was used to confirm or modify the location of the high water line as shown on the historical base map. Where more recent plans failed to make a distinction regarding the disposition of a marsh, it was assumed that the entire marsh was above high water and the outer edge of the marsh was held as the historic high water boundary.
• Similarly, absent specific and conclusive plans depicting low water, salt marshes, with the
exception of some tidal creeks, were assumed to be located landward of the low water line in conformance with contemporary knowledge of New England salt marsh morphology
• The banks of tidal creeks were assumed to delineate the high water line. Shalowitz
discusses the benefits of considering later survey efforts when trying to define creeks 16 Shalowitz, A. 1964 Shore and Sea Boundaries, Volume 2, U.S. Government Printing Office, Washington, D.C.

Commonwealth of Massachusetts Page 38 of 78 June 9, 2006 Chapter 91 Mapping Project BSC Group, Inc.
prepared by: BSC Group, Inc. 384 Washington Street
Norwell, MA 02061
…[where] later topographic surveys may have shown.. all the waterways tributary to the main waterway… an earlier survey may have omitted them, thus lacking the detail of, the later survey.
• Where subsequent plans depicted fill or other alterations (such as buildings, roads,
railroads, wharfing, etc.) in the vicinity of marsh areas, the high and low water lines from the plan reflecting shoreline conditions just prior to filling was utilized.
As discussed above, over time the cartographic symbology used by the U.S. Coast Survey to depict salt marsh evolved to delineate those areas of marsh that were “mostly submerged at high water”. Further, as later field work built upon earlier work, additional detail was added to planimetric features, particularly in the area of salt marsh tidal creek networks and the definition of the seaward and upland marsh edges. These refinements are illustrated in the following examples shown on Figure 6, depicting the intersection of the Malden and Mystic Rivers approximately 50 years apart. A comparison of the areas within circles “A” and “a” provides an example of the evolving symbology and increased attention to tidal creek detail depicted on later series T-sheets. On T-233 (circa 1847) all marsh is depicted with a homogeneous symbology. No attempt was made by the cartographer to determine the high water mark within the marsh. If this plan were utilized to determine the extent of historic high water without regard for subsequent mapping, the seaward edge of the marsh would necessarily have been held as the historical limit of high water. However, careful examination of the same area as depicted on a later T Sheet, T-2156 (circa 1894), provides additional important information that supports a different conclusion. The later T sheet uses a more refined marsh symbology along the southeasterly bank of the Malden River that identifies an area of marsh that was routinely flooded or mostly submerged at high water (see red shoreline).

Commonwealth of Massachusetts Page 39 of 78 June 9, 2006 Chapter 91 Mapping Project BSC Group, Inc.
prepared by: BSC Group, Inc. 384 Washington Street
Norwell, MA 02061
Figure 6 Progression of marsh symbology on the Mystic River
Figure 6 also illustrates another example where the sequential comparison of maps helped to clarify the location of the high and low water lines in salt marsh areas. In this example, the marsh island depicted on T-233 within the circle denoted as “B” was refined and depicted as “mud and grass flats” for the same area (denoted as circle “b”) on T-2156. Also supported by the companion H sheet, the later mapping clearly shows that this marsh area, potentially indicated as above the high water elevation on the early T sheet, was in fact located entirely below high water and surrounded with a low water line. A similar refinement in the location of high and low water lines can be seen when the salt marsh areas denoted as “C” and “c” on T233 and T2156 respectively are compared.
“A” “a”
“B” “b”
“C” “c”
Commonwealth of Massachusetts Page 40 of 78 June 9, 2006 Chapter 91 Mapping Project BSC Group, Inc.
prepared by: BSC Group, Inc. 384 Washington Street
Norwell, MA 02061
7.0 Interpretation and Use of Chapter 91 Shoreline Maps and Jurisdiction
Plans Pursuant to Sections 5.0 and 6.0 of the RFR, two (2) different sets of plans were developed based on the final determinations of the appropriate high and low water lines in accordance with the methodology discussed above. Each set was produced at a scale of 1:5,000 using MASSGIS orthophotos as the base map and consists of over 510 sheets for the complete coverage of Phases 1 through 5. The first set of plans, prepared in accordance with the Technical Specifications and Requirements of the RFR, is entitled ”Chapter 91 Shorelines”. These plans depict those shorelines, whether historical or contemporary, used in the subsequent development of Jurisdiction Plans. As a plan-based methodology, all historical and contemporary streams, creeks, ponds, etc. that depicted a hydraulic connection to tidal waters were considered tidally influenced. More site specific research and, for the case of contemporary waterways that influence the final depiction of jurisdictional boundaries, field survey and tidal information, may result in modifications to the shorelines in these areas. The second set of plans are the “Jurisdiction Plans”, which depict presumptive lines of Chapter 91 jurisdiction using the same sheet layout and base map as the “Chapter 91 Shoreline Plans”. These plans were developed in accordance with the Technical Specifications and the requirements of the RFR. As discussed below, while the elevation of the present high and low water lines can be established as defined in 310 CMR 9.02, the horizontal locations of these lines can vary with time. Determinations of the extent and nature of jurisdiction in these areas must necessarily be finalized through contemporary surveys and tidal datum information submitted with individual project applications during the licensing process. Similarly, jurisdictional lines determined by the location of public ways in existence as of January 1, 1984 (in accordance with the provisions for Landlocked Tidelands at 310 CMR 9.02) must be established accurately with an appropriate level of project-specific survey work on the part of applicants as part of preparing and submitting license applications. It should be noted that, as discussed in Chapter 9.0 Summary of Deliverables, a companion digital product and interactive GIS data management tool was developed as part of this project. The ability to simultaneously view and compare the various lines, registered images, and base map developed and used for this project greatly enhances the utility of the product deliverables. While hard copy plans, stamped by a PLS, were provided as required by the RFR, it is anticipated that users will find use of the digital product more advantageous in terms of the re-creation of plan analyses used in final determinations, the reproduction of spatially correct line data sets, and the updating of datasets should it be desired to reflect future licensing determinations. Effective use of the map and database products of this project requires familiarity with the various line types developed as part of this project and an understanding of how these lines were derived from the source documents. Each line has unique qualities that in turn require specific considerations in context of this project and in advancing final jurisdictional determinations. This section summarizes important aspects of these lines as discussed and used throughout this document, including the pedigree of those lines created, used, and displayed in the final hard

Commonwealth of Massachusetts Page 41 of 78 June 9, 2006 Chapter 91 Mapping Project BSC Group, Inc.
prepared by: BSC Group, Inc. 384 Washington Street
Norwell, MA 02061
copy and digital mapping products. Where appropriate, further discussion of the proper application and interpretation of these data layers and data sets is also included. Chapter 91 Shoreline Plans and Digital Product The Chapter 91 Shoreline Plans depict and differentiate between those shorelines, both contemporary and historical, used in the development of the final Jurisdiction Plans and digital product. Lines depicted on these products are discussed in the following sections. Contemporary High Water Lines As discussed above, contemporary high water lines are shown in those areas where the contemporary shoreline is clearly the most landward shoreline or where the plan-based methodology revealed strong positional correlation between historical shoreline position and the contemporary shoreline position (e.g., stretches of high, rocky coastline or areas devoid of coastal development). For this project, the contemporary shoreline positions were developed from a variety of existing sources and recognizing their highly ambulatory nature, must be determined for license applications using present day tidal datum information and the results of topographic field surveys performed in accordance with contemporary standards of practice. For this project, the contemporary shoreline was not assessed for level of accuracy and no assumptions should be made as such. The contemporary shoreline was derived from one of several sources:
• Visual interpretation: The limits of contemporary shoreline were interpreted as the wet/dry interface on the digital orthoimagery and manually digitized.
• LIDAR: The National Oceanographic and Aeronautical Administration (NOAA) provides
access to LIDAR (LIght Detection And Ranging) data through their LIDAR data retrieval website for much of the Massachusetts coastline. Where available, datum referenced LIDAR data was the preferred method of depicting the contemporary coastline.
See for additional information:
http://www.csc.noaa.gov/cgi-bin/crs/tcm/ldart_start.pl
• NOAA high and medium resolution shorelines: NOAA has made contemporary shoreline data available using geo-referenced versions of current nautical charts. Although adequate for this project, the accuracy limitations associated with these shorelines required significant modification to make them aesthetically acceptable and, as with all contemporary project data, should not be considered accurate depictions of the shorelines for Chapter 91 purposes.
Contemporary Low Water Lines Due to a lack of data depicting contemporary low water lines, no such line was included as a data layer in any of the product deliverables. As with contemporary high water, the location of the present low water line, if necessary for jurisdictional determinations, must be determined through contemporary tidal information and hydrographic survey techniques.

Commonwealth of Massachusetts Page 42 of 78 June 9, 2006 Chapter 91 Mapping Project BSC Group, Inc.
prepared by: BSC Group, Inc. 384 Washington Street
Norwell, MA 02061
Contemporary Marsh Areas It should be noted that contemporary shoreline was divided into two distinct sub classifications, contemporary high water, discussed above, and contemporary marsh. Because of the extensive and transient nature of tidal tributaries that drain marsh areas, the delineation of all flowed salt marsh channels proved impractical. In order to better highlight these areas, the plans depict the approximate landward and seaward boundaries of marsh areas as depicted on MA DEP’s 1:12000 wetland data as provided by MaGIS. As with other contemporary features, the extent of flowed tidelands in marsh areas and any effect on jurisdiction must be determined through accepted survey practices conducted for the preparation of a license application. Inferred Contemporary Shoreline In certain cases, small segments of shoreline were not visible because of existing wharves, building overhangs, or bridges that obscured shoreline location. In these areas a line was constructed at the landward base of the structure to indicate that contemporary high water was not visually discernable. Accepted field survey techniques using contemporary tidal datum information will need to be employed to determine the actual location of contemporary high water in these instances. Historic High Water Lines In areas of filling, the most reliable landward shorelines prior to filling activities have been determined through the rigorous application of the plan-based methodologies developed for this project. An extensive discussion of the derivation of these boundaries has been presented in previous chapters of this document. Historic Low Water Lines As discussed previously, Historic Low Water was derived from various historical plans. U.S. Coast Survey H- Sheets (or T-sheets if located close to shore) were primary sources because of their reliance on actual sounding data. Every attempt was made to compile Historical Low Water lines wherever Historical High Water lines were depicted indicating the presence of fill. Where possible, the Historical Low Water line was also depicted along areas of contemporary shoreline. As discussed above, (and in more detail in Appendix A) various datums or planes of reference were used for early hydrographic work. Because of the hydrographer’s interest in minimum draft available for sailing vessels, early hydrographic efforts were often related to a Mean Low Water Springs datum. In certain cases, Mean Low Water Springs (MLWS) based soundings were the only information available (for example, see H-1960). After careful consideration, MLWS based low water boundaries were accepted in limited cases, for the following reasons:
• The plan represented the only (or only accurate) record of low water in a particular area • Because the MLWS datum is lower than Mean Low Water, it falls seaward of Mean Low
Water representing a slightly conservative representation of the low water presumptive line.

Commonwealth of Massachusetts Page 43 of 78 June 9, 2006 Chapter 91 Mapping Project BSC Group, Inc.
prepared by: BSC Group, Inc. 384 Washington Street
Norwell, MA 02061
In reviewing annual reports of the Coast Survey and other sources such as Shalowitz17 the general practice of the day was to round soundings to the nearest one-foot interval based on a cutoff 0.7’. In other words, the fractional part of a sounding (not elevation) that would fall between 0.0 and 0.7 would be rounded down to the nearest integer. Fractional portions that fell between 0.7 and up would be rounded up to the nearest integer. For example, if a sounding was found to be 10.6 feet, it would be rounded to 10 feet, not 11 feet in accordance with mathematical convention. This practice provided a conservative water depth to the mariner navigating with charts. For the purpose of this project, this practice functionally ensured that a majority of the soundings would be rounded down so their resultant elevations were actually more in line with the Mean Low Water datum.
Inferred Historical Shorelines Ancient wharves, bridges, roads, and other coastal structures presented a unique challenge for a plan-based approach. Although indicating the possibility of shoreline alterations (and indeed a strong likelihood of fill), these structures were constructed in advance of any reliable coastal mapping. Generally, these structures were small and built in a manner that would probably have required little coastal alteration outside of the structure itself. In cases where no reconstructed shoreline could be identified, a straight line was constructed across the base of the structure, connecting the shoreline on either side. Such lines are referred to as “inferred shoreline”. These lines represent the inferred location of the pre-alteration shoreline and were generally in agreement with anecdotal information gathered from Alternate Source Plans such as those prepared by DesBarres, underscoring the concept that while many early plans could not be registered accurately, such plans did play an important role confirming general shapes of and trends in shoreline conditions.
Jurisdiction Plans In addition to the Chapter 91 Shorelines discussed in the preceding section, the following lines and line types were used in the development of jurisdictional information for the hard copy and digital deliverables. Jurisdictional Boundaries Jurisdiction boundaries are generally derived directly from historical shorelines (to the point where landlocking provisions, discussed below, apply). Of particular interest are areas where jurisdictional boundaries (and therefore historical high water boundaries) intersect with contemporary high water shorelines. Because of the approximate nature of contemporary shorelines (including those found in marsh areas) it should be noted that determining the exact location of the intersection of contemporary and historical shorelines may require minor refinements based on the surveyed location of contemporary high water and low water. Where this is the case, historical lines can be extended by consulting the appropriately registered historical source document.
17 Shalowitz, A. 1964 Shore and Sea Boundaries, Volume 2, U.S. Government Printing Office, Washington, D.C.

Commonwealth of Massachusetts Page 44 of 78 June 9, 2006 Chapter 91 Mapping Project BSC Group, Inc.
prepared by: BSC Group, Inc. 384 Washington Street
Norwell, MA 02061
Contemporary Marsh Perimeter Areas of contemporary marsh are analogous to stretches of contemporary high water, with one exception. Because of the vast expanses of marshland that exist in certain regions, and the presence of ditching to facilitate mosquito control and the harvesting of marsh hay, not every single tributary was digitized. For this project, a different line type/color (or different layer in case of the CZMQuery Tool) was utilized to inform users that, in these areas, a careful field inspection, application of correct tidal datum values, and field survey information is required to determine the full extent of contemporary flowed tidelands and jurisdiction within the marsh area. Landlocked Tidelands Landlocked tidelands are portions of filled tidelands to which current waterways regulations may not apply. The boundaries of landlocked tidelands have been derived from historical high water boundaries developed using approximate boundaries of Designated Port Areas (DPA’s) provided by CZM, approximate locations of the contemporary shoreline, and the identification and approximate location of the lines of public ways (discussed below). In general, landlocked tidelands are those portions of filled tidelands that lie landward of:
• A line located 250 feet from contemporary high water boundaries, or • The seaward limit of the first public way (in existence prior to January 1, 1984)
encountered inland from contemporary high water
whichever is further from contemporary high water. There are no landlocked tidelands within the boundaries of Designated Port Areas (DPAs), therefore, all filled tidelands located within DPAs are subject to Chapter 91 jurisdiction. Note that for this project the lines that control depictions of landlocked tidelands (contemporary high water and/or the seaward limit of the first public way) have been either visually derived from MaGIS digital orthophotos or other sources. Since these boundaries are either ambulatory or have been approximated, their true locations must be determined through accepted survey practices in order to refine the locations of landlocked boundaries. Similarly, in certain circumstances, historic tidelands that otherwise may appear to be landlocked are not due to the presence of contemporary flowed tidelands located within 250 feet of historic tidelands. As discussed above, the actual location of these contemporary waterways must be determined through accepted survey practices. First Public Ways Recognizing their importance in defining landlocked tidelands, a list of public ways was requested from each town or city within the RFR boundaries. These lists were utilized to determine which roads might potentially create a landlocking boundary. Although every attempt was made to recover the status and acceptance date of each public way, not every municipality was able to provide acceptance dates. The status of all public and private ways should be confirmed with the municipalities. If a way was noted as public by the municipality, it was

Commonwealth of Massachusetts Page 45 of 78 June 9, 2006 Chapter 91 Mapping Project BSC Group, Inc.
prepared by: BSC Group, Inc. 384 Washington Street
Norwell, MA 02061
assumed to have been accepted prior to January 1, 1984 and its acceptance date should be confirmed through site-specific research. This may involve reviewing town meeting minutes, research at the Registry of Deeds or Land Court, or other more detailed methods. Furthermore, since road centerlines were used to show the approximate location of the public way, research and field survey efforts will be required to define the actual limits of the public way right of way prior to establishing the true location of landlocked tidelands. See Appendix D for a list of municipalities that did not provide acceptance dates of public ways. Designated Port Areas The DPA boundary lines included in the hard copy and digital deliverables have been provided by CZM and are to be considered approximate. CZM should be consulted for actual DPA boundary locations in the course of jurisdictional determinations for individual projects located within or proximate to DPAs.
Commonwealth of Massachusetts Page 46 of 78 June 9, 2006 Chapter 91 Mapping Project BSC Group, Inc.
prepared by: BSC Group, Inc. 384 Washington Street
Norwell, MA 02061
8.0 Deliverable Products
Two basic product platforms have been delivered through the Chapter 91 Mapping Project; 1) plotted hard copies of historical and jurisdiction plans affixed with the seal of a Professional Land Surveyor (PLS) licensed to perform work in the Commonwealth of Massachusetts; and 2) an ArcMAP based digital product. The ArcMAP product (referred to as the CZMQuery Tool) is based on a custom ArcGIS application designed and implemented by Geonetics, one of the BSC Companies. The CZMQuery Tool was designed to provide maximum flexibility and integrates the database records of recovered plans with textual and graphical information supporting decisions concerning the limits of historical tidelands and Chapter 91 jurisdiction by allowing the user to examine the following items:
• Images of those historical maps and plans that were registered to the project datum • Database information describing source maps • Shoreline vector data defining the presumptive limits of pre-alteration shorelines • Metadata outlining the reason(s) why certain decisions were made and particular plans
utilized • Limits of Chapter 91 jurisdiction, including limits of landlocked tidelands and centerlines
of pertinent public ways • Commentary outlining reasons for selection of a particular document as the best source
for a particular area The CZMQuery Tool is comprehensive in that it not only allows the user to determine limits of Chapter 91 jurisdiction, but review the research, analysis and reasoning that went into the decision. For example, if a user were to select a historical shoreline, the CZMQuery Tool returns the following data:
• A database record documenting the source of the line • A listing of all shorelines associated with that source • The registration RMS value for the source document • Commentary outlining reasons for selection of a particular document as the best source
for a particular area • The ability to search and view all registered plans (ASPs), whether used as a primary
source of historic lines or not. • Ability to search for collateral (i.e., non-registered) plans in the area by a number of
different search criteria.
Additionally, the user has the ability to bring the source document (e.g. a registered, scanned image) into ArcGIS to examine features from which historical shorelines were derived. Alternatively, the user could search the entire database to locate all recovered plans for an area and be directed to scanned images archived on indexed CD’s.

Commonwealth of Massachusetts Page 47 of 78 June 9, 2006 Chapter 91 Mapping Project BSC Group, Inc.
prepared by: BSC Group, Inc. 384 Washington Street
Norwell, MA 02061
Figure 7 CZMQuery Tool
When a historic shoreline is selected, the CZMQuery Tool returns information regarding the historic line as well as the source document and information supporting the decision to use that particular source. With respect to the coastline, the following information is displayed:
• Compilation Remarks: A description of the line including unique factors that went into decisions to hold the shoreline from a particular source, collateral plans, or other item of interest.
• Depicts: Notes whether historic line is high water or low water.
Additionally, information regarding the source image is displayed:
• Document ID: Unique identifier assigned to each image. Identifier corresponds to a single entry in the project database. The Document ID could then be used to retrieve the unregistered image from the proper CD.
• Project Volume: CD number where original unregistered image is archived. • Title: Title of the plan or chart. • Purpose Description: Purpose for which a document was prepared (i.e. T Sheet, pre-
dredge survey, Chapter 91 License plan, etc.).

Commonwealth of Massachusetts Page 48 of 78 June 9, 2006 Chapter 91 Mapping Project BSC Group, Inc.
prepared by: BSC Group, Inc. 384 Washington Street
Norwell, MA 02061
• Author: Name of the surveyor, hydrographer, or cartographer who produced the plan or chart.
• Agency: Name of agency commissioning the plan (i.e. Harbor and Lands Commission).
• Publish Date: The year in which the plan was published. • Registration Solution [Meters]: Overall Root Mean Square (RMS) error value resulting
from the plan registration process. The RMS represents a statistical assessment of registration point accuracy prior to performing the non-linear transformation of the plan image. For two point conformal transformations, “Two point conformal” will be displayed (see chapter 5.1).
• Scale: Compilation scale of the plan expressed as a ratio (i.e. 1:10,000). Note that even if the scale was originally noted in the form of 1”=X’ on a plan originally, the scale was converted to a ratio in the database for consistency.
• Waterway: Name of most adjacent waterway. • Doc Comment: Pertinent comments reflecting the unique aspects of a plan. • Image File Name: Unique file name of scanned image (typically in TIFF or JPEG
format). The file name would correlate to the unregistered image archived on CD.

Commonwealth of Massachusetts Page 49 of 78 June 9, 2006 Chapter 91 Mapping Project BSC Group, Inc.
prepared by: BSC Group, Inc. 384 Washington Street
Norwell, MA 02061
9.0 Summary of Deliverables The following items have been prepared as deliverables to be submitted under this project. For management purposes, the Massachusetts Coastline has been separated into five distinct Phases. General limits of each phase are as follows:
Phase Number
Phase Name
Northern Limit
Southern Limit
I Greater Boston Revere/Chelsea Border Hull/Cohasset Border
II North Shore Massachusetts/New Hampshire Border
Revere/Chelsea Border
III South Shore Hull/Cohasset Border North side of Cape Cod Canal (East end)
IV South Coast/Buzzards Bay North Side of Cape Cod Canal (West end)
Massachusetts/Rhode Island Border
V Cape Cod/Islands All of Cape Cod, Martha’s Vineyard, & Nantucket*
* Excluding Provincetown, Elizabeth Islands, and Cape Cod National Seashore
For each Phase, the following items have been delivered:
• Digital and hardcopies (8 ½” x 11” format) of all scanned images recovered in the course of research (two sets)
• Access database indexing all recovered documents • Hardcopy plots (30”x42”) of plans depicting historical shorelines for Phases I through V • Adobe PDF format files of historical shoreline plans for Phases I through V • Hardcopy plots (30”x42”) of plans depicting the limits of Chapter 91 jurisdiction for
Phases I through V • Adobe PDF format files of Jurisdiction plans for Phases I through V • ESRI ArcMap 9.0 product with CZMQuery Tool delivered on DVD(s) (including project
metadata in FGDC format, as applicable) • ESRI ArcReader product for all phases • Report outlining the results and finding of this project

Commonwealth of Massachusetts Page 50 of 78 June 9, 2006 Chapter 91 Mapping Project BSC Group, Inc.
prepared by: BSC Group, Inc. 384 Washington Street
Norwell, MA 02061
10.0 Phase Specific Notes The following sub-sections provide a brief discussion of each phase including its geographic limits, unique characteristics and specific challenges encountered, and approaches adopted to meet these generally phase-specific challenges. Each section concludes with a compilation of those plans identified as most useful in establishing historical shorelines for each phase. A complete cartobibliography and hard copy images of all plans recovered for each phase has been provided in the form of the electronic project database and project binders. All registered images used in the determination of historical shorelines for each phase can be identified and viewed with the assistance of the digital “QueryTool” developed for the project.
10.1 Phase I (Boston Harbor) Geographic Limits Phase I, centered about Boston Harbor, encompasses a region generally defined by the following limits:
• North of the Hull/Cohasset town line • South of the Revere/Chelsea town line • West of Greater Boston including portions of the Charles, Neponset, Mystic, Malden,
Weymouth Back, Fore, and Chelsea Rivers • Also includes smaller tributaries such as the Island End River, Town River, Muddy River,
and Miller’s River The most prominent feature distinguishing Phase I from other project phases is clearly the intensity of development encountered in Greater Boston and the surrounding towns. Additionally, areas north of the Mystic River (e.g., Medford, Everett, Chelsea) were dominated historically by significant areas of salt marsh and associated tidal creeks and tributaries. Over time many of these creeks and tributaries were straightened or otherwise relocated and significant expanses of marsh filled requiring careful application of the Sequential Cartographic Analysis (SCA) process to arrive at informed and supportable decisions relative to the location of early high water lines in these areas. Unique Phase I Attributes In Phase I, significant filling of tidelands began as early as the mid 1600’s.18 Much of this filling activity had begun in advance of any significant and coordinated mapping efforts. Leading up to the time of the Revolutionary War, military and commercial forces increased interest in both safe navigation and the development of waterfronts with wharves and piers in support of growing trade with Europe. Cartographers such as Joseph F.W. DesBarres, Lieutenant Page of His Majesty’s Corps of Engineers, and Osgood Carleton produced maps of Boston Harbor and surrounding areas. For reasons outlined in previous chapters, the degree of filling already present by the late 1700s and registration issues associated with many of the maps and plans developed in this time frame generally limited their use as primary sources for determining the
18 Seasholes, N. Gaining Ground, A History of Landmaking in Boston, First Edition, (Cambridge, Massachusetts, The MIT Press 2003)

Commonwealth of Massachusetts Page 51 of 78 June 9, 2006 Chapter 91 Mapping Project BSC Group, Inc.
prepared by: BSC Group, Inc. 384 Washington Street
Norwell, MA 02061
most landward shorelines (although many did contribute significantly as collateral plans). In addition, for sections of Phase I not even these maps pre-dated early filling activities. For these areas, careful evaluation and comparison of plans depicting reconstructions of early shorelines was determined to be the best method for selecting the most reliable record of pre-filling shoreline. The most prominent plans depicting reconstructed shorelines in the Boston Harbor region included Baldwin, Perkins, Clough, and Chesbrough. Chesbrough’s reconstruction, undertaken in 1852, is significant because of his accompanying report that provides valuable insight into the information and methods employed in production of his map. A similar effort was undertaken by Samuel Clough early in the 20th century utilizing deed research, City of Boston field engineering notes, and other available information. A comparison of Clough’s work with Chesbrough’s reveals general agreement between the two works. This comparison, Chesbrough’s report (see Appendix C for copy), and the registration qualities of his plan, support the reliance on Chesbrough’s work with respect to depicting pre-alteration shorelines in the Boston Harbor area. The combination of early filling activity and a relative scarcity of period-specific hydrographic data presented similar challenges with establishing the location of early low water lines. Where possible, plans depicting low water reconstructions were identified and evaluated such as the court-ordered plan prepared by George Baldwin for the area extending from Rowes Wharf northerly to Union Wharf. In 1846, Baldwin published a 1”=100’ scale plan “under order of the Supreme Judicial Court of Massachusetts” entitled “Plan of Part of the City and Harbor of Boston”... The purpose of the plan was to reconstruct “…the lines of high and low water determined from recent soundings, abstracts of deeds, plans, and other sources…” to establish the former shoreline position. Used most recently in the 1970s Supreme Judicial Court case involving the Lewis Wharf area, the mathematical integrity of the plan supported its selection as the best available information for this waterfront area. Another notable early plan utilized to determine Phase I locations of the historic low water, particularly in the area commonly referred to as the “South Boston Flats” is entitled “Chart of Boston Harbour Surveyed in 1817 by AlexR S Wadsworth U.S.N.”. A predecessor to the U.S. Coast Survey efforts, Wadsworth’s plan depicts soundings “…reduced to low water…”. Although valuable for its depiction of early low water, the plan does not cover all of Boston Harbor and in some areas post-dates waterfront filling. In the course of research efforts, an early plan was recovered that differed from other plans of the same era in that it contained significant sounding data in the areas of Back Bay, Fort Point Channel, and the tidelands in the vicinity of what is now the North End of Boston. This plan was also helpful in other areas of the Harbor with area-specific notations such as “Dry at low water” and “[salt marsh] covered at [spring tide]” – implying a salt marsh area that was not covered at normal tides – providing an excellent source upon which to confirm and supplement observations of early hydrographic data. This plan is untitled, however, it has been attributed as follows:

Commonwealth of Massachusetts Page 52 of 78 June 9, 2006 Chapter 91 Mapping Project BSC Group, Inc.
prepared by: BSC Group, Inc. 384 Washington Street
Norwell, MA 02061
“Boston Harbour, with the surroundings, &c.” Hills, John, surveyor 177-?] Scale ca. 1:24,000. Title from William Faden's Catalogue of a curious and valuable collection of original maps and plans. 1862. Manuscript, pen-and-ink and watercolor. Relief shown by shading and hachures. Depths shown by soundings. Oriented with north toward the upper left.”
The John Hills plan was also notable with respect to Boston Neck, where it was generally found to be more reliable spatially than other works of the same period, depicting enough detail to enable a reasonable registration. This work was utilized, therefore, to supplement areas such as Fort Point Channel and Back Bay where early hydrographic information was sparse. Specific Challenges Encountered in Phase I Fore River, Quincy: The earliest, reliable map that was recovered depicting the location of shorelines for the Fore River area was T-227 (1847). During the process of Sequential Cartographic Analysis, however, subsequent mapping indicated discrepancies with the spatial representation of a discrete area depicted on this early T-sheet. Comparisons with the location of Haywood’s Creek in the vicinity of the Quincy Shipyard as shown on T-2180 (1894) indicated an approximately 90 meter latitudinal difference in the location of the creek. Almost identical creek shapes depicted on both plans, however, indicated potential spatial issues with one of the plans and registration and inspection of additional recovered Alternative Source Plans (e.g., 1913 plan by Whitman and Howard) confirmed that T-2180 depicted the correct location of Haywood’s Creek. Island End River, Chelsea: The Island End River in Chelsea is typical of many of the former tidal salt marsh tributaries that once discharged into Boston Harbor. As with many marsh tributaries, early mapping did not differentiate between areas of marsh lying above high water and those lying below low water but rather defined an outer edge of vegetation. An Alternative Source Plan identified in the SCA process and prepared by the Harbor and Land Commission in 1908 contained significant topographic and hydrographic information that was related to the Mean Low Water plane. The detail of this plan and its relationship to a know tidal datum was used to clarify the locations of high and low water line within the salt marsh along the easterly bank of the Island End River. Cartobibliography The following plans represent a compilation of select plans used in the determination of historical shorelines in Phase I. See the project database and binders for a complete listing and hard copy of images of all plans recovered for Phase I. First Series T Sheets (circa 1832 - 1867)
T-227 T-230 T-233 T-237 T-228 T-232 T-234 T-832 T-229
Second Series T Sheets (circa 1868 – 1898)
T-2114 T-2146 T-2180 T-2197 T-2115 T-2154 T-2191 T-2204

Commonwealth of Massachusetts Page 53 of 78 June 9, 2006 Chapter 91 Mapping Project BSC Group, Inc.
prepared by: BSC Group, Inc. 384 Washington Street
Norwell, MA 02061
Third Series T Sheets (circa 1899 – 1938) T-5775 T-5776
H Sheets
H-850 H-2129 H-2163 H-2167 H-1960 H-2156 H-2161
• Plan of Part of the City and Harbor of Boston prepared by George Baldwin and dated 1846; Scale: 1”=100’ • Chart of Boston Harbor Surveyed in 1817 by Alexander Wadsworth, U.S.N: Scale 1”=1500’ • Untitled plan by J. Hills dated 1770’s • Map of Boston Harbor Showing Commissioners Lines, Wharves, Etc. prepared by E.S. Chesbrough and
dated 1852; Scale: 1”=1000’ • Map of the Town of Boston 1676 prepared by Samuel Clough, date unknown; Scale: 1”=200’ • Plan of the Inner Harbor of Boston Executed by the U.S. Coast Survey prepared by A.D. Bache and dated
April 1846. Scale: 1:5000 • Charles River Basin – Contour Map of Upper Basin made under the Supervision of John R. Freeman,
Engineer to the Committee on Charles River Dam and dated 1902; Scale: 1”=300’ • Gazetteer of Massachusetts map of Weymouth by Rev. Elias Nason dated 1873 • Plan to Accompany Petition of C.C. Hanley, Quincy, Mass. by H.G. Hunter, C.E. and dated 1899; Scale:
1:2000 • Plan of Land in Quincy, Mass. Owned by Fanny C. Adams by Ernest W. Branch and dated September 13,
1907; Scale: 1”=100’ • Plan of Land in the City of Quincy deeded…to Alfred W. Bennett by Frederick E. Tupper and dated
December 1910; Scale: 1”=50’ • Plan to Accompany Petition of Hanley Construction Co., Town River, Quincy, Mass. Dated 1901; Scale:
1:2000 • Plan of Neponset River and part of Dorchester Bay dated 1854; Scale: 1”=500’ • Proposed Sea Wall, Squantum and Dorchester Streets, Quincy, Mass. by Comm. Of Mass. – Department of
Public Works and dated July 15, 1920; Scale: 1”=50’ • Houghs Neck, Quincy by Department of Public Works of Massachusetts dated February 1934; Scale:
1”=50’ • Soundings in Neponset River Between Granite Avenue Bridge and Godfrey Coal Co’s Wharf, Dorchester
and Milton by Department of Public Works of Massachusetts dated July 1921; Scale: 1:1000 • Plan of Land at Hingham Harbor by William S. Crocker and dated Feb. 7, 1938; Scale: 1”=80’ • Weymouth Back River Massachusetts Surveyed in Accordance with Act of Congress under the direction of
Lieut. Col. S.M. Mansfield and dated November 1890; Scale: 1:4000 • Plan of Charles River from the Waltham Line to Boston Harbor prepared under the direction of the
Metropolitan Park Commission and the State Board of Health and dated April 1894; Scale: 1”=1000’ • Commonwealth of Massachusetts Harbor and Land Commissioner’s Office Plan of Island End River, East
Everett and Chelsea dated August 1908; Scale: 1:1000 • Plan of Land in Braintree – Land Court Plan No. 9099A by Hartley L. White dated November 1922; Scale:
1”=20’ • Atlantic Neptune prepared by J.W.F. DesBarres, ca. 1760 – 1775. • Map of Boston in the State of Massachusetts prepared by J.G. Hales Geographer and Surveyor and dated
1814; Scale: 1”=10 rods • Plan of the Harbour of Boston from Surveys made under the direction of the Commissioners. Appointed by
a Resolve of the Legislature passed March 5, 1835. Drawn by: G.P. Worcester. Scale 1”=200’. 1839. • Untitled Coast Survey worksheet for Quincy Bay and Hingham Bay from Squantum to Hull, ca. 1860’s • Commonwealth of Massachusetts Harbor and Land Commissioners’ Office Plan of Proposed Sea Wall,
Green Hill, Hull dated Aug. 1913; Scale: 1:500

Commonwealth of Massachusetts Page 54 of 78 June 9, 2006 Chapter 91 Mapping Project BSC Group, Inc.
prepared by: BSC Group, Inc. 384 Washington Street
Norwell, MA 02061
• Weymouth Fore River, Braintree & Weymouth prepared by the Department of Public Works of Massachusetts, Division of Waterways and dated June 1939; Scale: 1:1000
• Compiled Plan of Land of the Fore River Shipbuilding Corporation, Quincy, Mass. prepared by Whitman & Howard, dated June 7, 1913; Scale 1”=150’
• Fore River Shipbuilding Co., Quincy, Mass., Plan of Proposed Fill on the Company’s Property on Bents Creek, Weymouth Fore River dated Aug. 16, 1912; Scale: 1:360
• Plan of House Lots at Houghs Neck, Quincy, Mass. Owned by Wilton A. Dunham prepared by Ernest W. Branch, dated November 1910; Scale: 1”=40’
10.2 Phase II (North Shore) Geographic Limits Phase II, covering the North Shore of the Massachusetts Coast, is generally bounded by the following limits:
• North of the Chelsea/Revere line • To the Massachusetts/New Hampshire line • Includes portions of the Pines, Saugus and Annisquam Rivers
Unique Phase II Attributes Phase II is characterized by significant stretches of steep, rocky coastline as well as vast expanses of salt marsh such as that surrounding Plum Island in Newbury. Both naturally occurring features represent unique mapping challenges. Depictions of the high water lines along the rocky shorelines of coastal towns such as Marblehead and Beverly are typically generalized on both historical and contemporary shoreline maps owing to their highly irregular surfaces. Although in one respect the permanence of steep, rocky bluffs makes high water line mapping easier, the natural irregularity of the rock can complicate final determination, particularly in terms of its final depiction on drafted plans. Typically, early Coast Survey plans relied on a distinct symbology to depict such areas (see Figure 8). Careful examination of these areas revealed that the exact locations of historical high water lines were difficult to determine with precision. In such areas, historical mapping was carefully compared with more contemporary mapping and base map orthoimagery. Where little evidence of alteration could be detected through the SCA process, contemporary shorelines were held. For example, Figure 9 depicts the same area of coastline depicted in Figure 8 on the orthoimage. Note the high cliff face and minimal visual evidence of filling. The contemporary high water line (cyan line) was approximated as the change in coloration along the rock face. Finally, note the difference between the contemporary shoreline when overlaid with T-397 (Figure 10). For this case, if historical mapping was viewed without considering more contemporary evidence, the historical shoreline would have been held erroneously.

Commonwealth of Massachusetts Page 55 of 78 June 9, 2006 Chapter 91 Mapping Project BSC Group, Inc.
prepared by: BSC Group, Inc. 384 Washington Street
Norwell, MA 02061
Figure 8 Rocky Coastline as Depicted on T-397 (circa 1851)
Figure 9 Rocky coastline as visually interpreted from discoloration on rocks
Note existence of steep, rocky bluff
Note symbology denoting rocky coastline

Commonwealth of Massachusetts Page 56 of 78 June 9, 2006 Chapter 91 Mapping Project BSC Group, Inc.
prepared by: BSC Group, Inc. 384 Washington Street
Norwell, MA 02061
Figure 10 Contemporary Shoreline with Respect to T-397
Specific Challenges Encountered in Phase II Newburyport: A review of available maps and plans for this area documents that the downtown Newburyport waterfront was altered early in its development history. Plans recovered from the mid- to late 1700s clearly indicated that substantial wharfing had already occurred by this time and, although valuable from an anecdotal standpoint, as collateral plans they were not suitable for use in determining reliable locations of historical shorelines. With the support of these collateral plans, however, areas between the bases of wharfs depicted on later plans were held as the limits of high water and connected with inferred lines. Historical low water determinations in Newburyport presented similar issues since few early plans were recovered that supported the location of pre-alteration low water lines. The earliest available H Sheet (H-292, 1851) did, however, depict a two-fathom line (a line depicting existing depths of 12 feet below low water) that was generally at or within 30-40 meters of the ends of piers extant at that time. This hydrography indicated that at a minimum, low water extended as far landward as the ends of the 1851 piers. Further, in many areas low water lines were depicted as coincident with the sides and ends of piers, indicating that the areas between the piers were not dry at low water. This depiction was also encountered in areas of filled piers with vertical sides in other harbors of Phase 2 such as Gloucester, Beverly, Salem, and Lynn. For these cases low water was depicted as coincident, or nearly coincident, with high water.

Commonwealth of Massachusetts Page 57 of 78 June 9, 2006 Chapter 91 Mapping Project BSC Group, Inc.
prepared by: BSC Group, Inc. 384 Washington Street
Norwell, MA 02061
Salem Harbor: Salem Harbor, like Boston and Newburyport, was subjected to extensive early development requiring the use of plans depicting reconstructed shorelines to determine reliable locations of pre-alteration shorelines. Early T Sheets used to begin the SCA process, such as T-303, depict significant filling in the harbor as well as the North and South Rivers. For this case, project research recovered a plan entitled “Part of Salem in 1700 From the Researches of Sidney Perley” (scale 1”=400’) depicting a reconstructed shoreline for Salem Harbor. The plan contains the note:
“Precision: good. Perley’s property maps based on actual surveys and title deeds, though streets and houses generally not generally shown to scale. Data on streets and shoreline sometimes conflicting; harmonized with old Mass Atlas…”
After assessing spatial veracity through the registration process, Perley’s reconstructed shoreline was selected as the most reliable record of pre-alteration shoreline recovered during research. (Recovery of this plan resulted in a landward expansion of RFR boundaries in order to depict the shoreline in its entirety). Saugus River/Pines River: T Sheets work covering Phase II focused largely along coastal areas and rarely ventured inland significantly. Although this did not present a problem for coastal river mouths, some of the upper reaches of larger rivers were not mapped as part of these efforts. The extreme inland portions of the Pines River and Saugus River, although included within the RFR boundary for this project, did not benefit from T or H Sheet coverage. Additional research for Alternative Source Plans did not result in the recovery of useful sources of information in these instances. Orthoimages for these areas indicate the possibility of some filling in the form of roadway and railroad construction, but no reliable historical plans were recovered. Consequently, in such areas contemporary shorelines from the orthoimages were held with the exception of inferred contemporary shorelines in areas of infrastructure improvements and more localized and anecdotal research might be warranted. Cartobibliography The following plans represent a compilation of select plans used in the determination of historical shorelines in Phase II. See the project database and binders for a complete listing and hard copy of images of all plans recovered for Phase II. First Series T Sheets (circa 1832 - 1867)
T-234 T-305 T-396 T-556 T-235 T-340 T-397 T-559 T-303 T-341 T-467 T-835 T-304 T-355
Second Series T Sheets (circa 1868 – 1898)
T-2147 T-2603 T-3766 T-4393 T-2177 T-3764 T-3767 T-4396 T-2237 T-3765
Third Series T Sheets (circa 1899 – 1938)
T-4424 T-4426 T-9079 T-11150 T-11151 T-11153 T-11155 T-11156 T-11484 T-11486

Commonwealth of Massachusetts Page 58 of 78 June 9, 2006 Chapter 91 Mapping Project BSC Group, Inc.
prepared by: BSC Group, Inc. 384 Washington Street
Norwell, MA 02061
H Sheets H-284 H-292-C H-1069-B H-2198 H-2200 H-594-C H-2129D H-2197 H-2199
• Commissioners’ Map of Gloucester Harbor, Massachusetts prepared by A. Boschke, C.E. and dated April
28, 1862. Scale 1”=200’ • Lynn Harbor, Massachusetts prepared by A. Boschke and dated July/August 1866. Scale 1”=200’ • Plan of Gloucester Harbor prepared by John Mason and dated 1834. Scale 1”=100’ • Part of Salem in 1700 from the Researches of Sidney Perley prepared by William W.K. Freeman and dated
1933. Scale 1”=400’ • Location of the Eastern Railroad in the County of Essex prepared by J. M. Fessenden and dated 1857. Scale
1”=500’ • Plan of Pigeon Cove Harbour by William Pool, Surveyor, dated 1838; Scale: 1”=5 Rods • Plans Accompanying Petition of Beverly Commerce Park, Inc. to Maintain Existing Conditions of Shoe
Pond in Beverly, Massachusetts by Hancock Survey Associates, Inc. and dated December 9, 1997; Scale: 1”=400’
• Proposed Tidegate Dam to be Erected in Beverly, Mass., Petitioner, United Shoe Machinery Company dated June 11, 1903; Scale: 1”=100’
• Plan of a Proposed New Wharf in Long Cove – Rockport, Mass. To be Built by the Sandy Bay Pier Company dated August 1884; Scale: 1”=20’
• Salem Harbor & Approaches, Original Sounding Sheet by the U.S. Coast Survey, A.D. Bache, Superintendent, dated 1850; Scale: 1:10,000
10.3 Phase III (South Shore) Geographic Limits Phase III, covering the South Shore of the Massachusetts Coast, is generally bounded by the following limits:
• South of the Hull/Cohasset town line • North of the Cape Cod Canal in Bourne • Includes portions of the North, Jones, and South Rivers
Unique Phase III Attributes Based on a review of the historical plans recovered for this phase, it would appear that the South Shore and its harbors did not evolve in response to the intense development pressures experienced by waterfronts in other regions of the Commonwealth. Consequently, in general, there appeared to be less historical filling than encountered in other phases and fewer Alternative Source Plans were necessary for high and low water determinations for this phase. Specific Challenges Encountered in Phase III The most unique Phase III challenge was encountered in the area of the mouths of the North and South Rivers at the Marshfield/Scituate line. A major storm in the mid 1800’s significantly altered the shoreline and ultimately the mouth of the rivers in this area. Careful review of subsequent T Sheets led to the conclusion that the more recent T Sheets were required to determine the correct position of historical shorelines.

Commonwealth of Massachusetts Page 59 of 78 June 9, 2006 Chapter 91 Mapping Project BSC Group, Inc.
prepared by: BSC Group, Inc. 384 Washington Street
Norwell, MA 02061
Cartobibliography The following plans represent a compilation of select plans used in the determination of historical shorelines in Phase III. See the project database and binders for a complete listing and hard copy of images of all plans recovered for Phase III. First Series T Sheets (circa 1832 - 1867)
T-228 T-425 T-612 T-719 T-236 T-455-2
Second Series T Sheets (circa 1868 – 1898)
T-1062 T-1063 T-1530 T-2183 Third Series T Sheets (circa 1899 – 1955)
T-1062a T-1063a T-5611a T-9512 T-9513 T-11169 T-11170 T-11173 T-11174 T-11177 T-11178 T-11180 T-11182 T-11185
H Sheets
H-422 H-1035
• Plymouth Village by authors unknown circa 1830. Scale 1”=50 poles • Map of the Mile and a Half Tract of Plymouth Mass in 1701 by authors unknown. • Atlantic Neptune, J.F.W. DesBarres. Chart of Plymouth Bay. Scale-1:24,000. ca. 1775
10.4 Phase IV (Buzzards Bay) Geographic Limits Phase IV, covering an area commonly referred to as Buzzards Bay, is generally bounded by the following limits:
• Mount Hope Bay (Fall River) • Rhode Island/Westport, Massachusetts line east to the Cape Cod Canal • Includes portions of the Taunton, Westport, Acushnet, and Wareham Rivers
Unique Phase IV Attributes As with Phase III, with the exceptions of Fall River and New Bedford, plan research for this area did not reveal the presence of large areas of historical tidelands filling. Accordingly, fewer Alternative Source Plans were necessary for high and low water determinations for this phase. Specific Challenges Encountered in Phase IV Westport and Taunton Rivers: Similar to several areas with the Phase II RFR boundaries, the spatial coverage of Phase IV T Sheets was largely focused along coastal areas and rarely extended inland to any great extent. Although this did not present a problem for coastal river mouths, some of the upper reaches of larger rivers were not mapped as part of these early efforts. Specifically, the extreme inland portions of the Westport and Taunton Rivers, although included within the RFR boundary for this project, did not benefit from T or H Sheet coverage. Additional research for

Commonwealth of Massachusetts Page 60 of 78 June 9, 2006 Chapter 91 Mapping Project BSC Group, Inc.
prepared by: BSC Group, Inc. 384 Washington Street
Norwell, MA 02061
Alternative Source Plans did not result in the recovery of useful sources of information in these instances. Orthoimages for these areas indicate the possibility of some filling in the form of roadway and railroad construction, but no reliable historical plans were recovered. Consequently, in such areas contemporary shorelines from the orthoimages were held with the exception of inferred contemporary shorelines in areas of infrastructure improvements and more localized or anecdotal research may be warranted. Fall River/New Bedford: Similar to Newburyport, both Fall River and New Bedford were subjected to coastal alterations early in their development histories. Plans recovered from the mid- to late 1700s clearly indicated that substantial wharfing had already occurred by this time and, although valuable from an anecdotal standpoint as collateral plans, were not suitable for use in determining reliable locations of historical shorelines. Based on the information provided on these collateral plans, however, and the recovery of several Alternative Source Plans, T and H sheet depictions could be augmented to support holding the areas between the bases of wharfs as the limits of high water and, where necessary, connecting wharf bases with inferred lines. Cartobibliography The following plans represent a compilation of select plans used in the determination of historical shorelines in Phase IV. See the project database and binders for a complete listing and hard copy of images of all plans recovered for Phase IV. First Series T Sheets (circa 1832 - 1867)
T-183 T-194 T-196 T-193 T-195 T-884
Second Series T Sheets (circa 1868 – 1898)
T-1024 T-2212 T-2221 T-5610 T-1053 T-2215 T-2253 T-5750 T-1120 T-2216 T-5602 T-6120 T-1373 T-2217 T-5603 T-6357 T-1530 T-2220 T-5604 T-6358
Third Series T Sheets (circa 1899 – 1938)
T-11429 H Sheets
H-154 H-158 H-159 H-160A H-792 H-2250
• Map of Fall River in 1812 prepared from correct data by Cook Borden, Esq. and dated 1812. Scale 1”=1000’
• Map of Lands Belonging to Heirs of Samuel Rodman, Fall River, Mass prepared by unknown and dated 1837. Scale 1”=200’
• Map of the Harbor of New Bedford in the State of Massachusetts Surveyed by Calvin Staples and dated 1847. Scale estimated to be 1”=100’

Commonwealth of Massachusetts Page 61 of 78 June 9, 2006 Chapter 91 Mapping Project BSC Group, Inc.
prepared by: BSC Group, Inc. 384 Washington Street
Norwell, MA 02061
10.5 Phase V (Cape Cod, Martha’s Vineyard, Nantucket) Geographic Limits Phase V, covering an area commonly referred to as the Cape and Islands, is generally bounded by the following limits:
• All of Cape Cod east of the Cape Cod Canal excluding Provincetown, Elizabeth Islands, and the Cape Cod National Seashore
• The island of Nantucket • The island of Martha’s Vineyard
Unique Phase V Attributes Phase V shorelines, unlike previous phases, are characterized by large areas of dynamic coastal landforms such as eroding and accreting sandy dunes and scarps, estuarine inlets, barrier spits and beaches. As documented by CZM’s Shoreline Change Project, the Cape and Islands are areas that have historically been subject to significant natural change – especially along ocean- facing coastline. For example, a review of the CZM Shoreline Change Project datasets reveals erosion rates on the order of 10-12 feet per year in some locations along the south shores of Martha’s Vineyard and Nantucket. When shorelines from registrations of early T Sheets (compiled approximately 150 years ago) are compared to contemporary shoreline positions for the same area, natural shoreline retreat approaching a third of a mile is noted. Although of a lesser magnitude, similar areas of accretion resulting from the natural transportation and deposition of sand were also identified. Recognizing that the plan-based approach of this project was not intended to differentiate between natural and manmade alterations, in all but the most obvious areas of natural erosion or accretion, the SCA process was used to identify and select the most landward shorelines. Specific Challenges Encountered in Phase V
Coastal Ponds: The south coast of Cape Cod, Martha’s Vineyard, and Nantucket are populated with a number of large ponds situated adjacent to the shoreline. Historically, these ponds have been separated from the ocean by strips of upland. Sequential examination of T and H Sheets in these areas indicate that as the shoreline eroded over time, the barrier between many coastal ponds and the ocean “rolled back” in a landward direction. For example, Figures 11 & 12 depict the same region of coastline at two different times approximately 150 years apart. Although over time the shoreline eroded approximately 1,300 feet and into the coastal pond, no plan evidence was recovered to indicate that a tidal connection existed between the pond and the ocean. Point ‘A’ has been provided as a reference point between the two figures.

Commonwealth of Massachusetts Page 62 of 78 June 9, 2006 Chapter 91 Mapping Project BSC Group, Inc.
prepared by: BSC Group, Inc. 384 Washington Street
Norwell, MA 02061
Figure 11
Coastal Pond from T-205 (South Coast of Nantucket) circa 1850’s
Figure 12
Coastal Pond on South Shore of Nantucket (contemporary view) Groins: In an attempt to slow the effects of erosion along certain coastlines, many littoral landowners have constructed groins perpendicular to the shore. These structures function to interrupt sand transport, typically resulting in accretion immediately updrift and erosion immediately downdrift of the groin. Such areas were examined through the SCA process to identify the most landward shorelines that, where possible, pre-dated groin installation.
Contemporary Shoreline in Cyan
‘A’
‘A’
Contemporary Shoreline in Cyan

Commonwealth of Massachusetts Page 63 of 78 June 9, 2006 Chapter 91 Mapping Project BSC Group, Inc.
prepared by: BSC Group, Inc. 384 Washington Street
Norwell, MA 02061
Availability of ASP’s: Due to the relatively concentrated nature of coastal development prior to the early 1900s that resulted in minimal wide scale mapping efforts, the Coast Survey’s T and H sheets were determined to provide the best available sources of shoreline conditions for use in high and low water line determinations. This decision was further supported with the recognition that the dynamic nature of Phase V shorelines frequently rendered early shoreline plans obsolete in terms of determining the most landward shorelines. Consequently, with the exception of some of the more prominent harbors this phase utilized the three series of mapping efforts of the Coast Survey extensively as the best available sources of information. Dynamic Shorelines: As mentioned above, much of the Phase V coast is comprised of dynamic sandy shores and salt marsh. Consequently, shorelines are subject to significant change in response to natural events such as storms and coastal erosion. Although the plan-based approach of this project did not necessarily distinguish between natural and man-made shoreline changes, the SCA process was applied rigorously to ensure that, in filled areas, the most landward shoreline was identified.
Cartobibliography The following plans represent a compilation of select plans used in the determination of historical shorelines in Phase V. See the project database and binders for a complete listing and hard copy of images of all plans recovered for Phase V. First Series T Sheets (circa 1832 - 1867)
T-191 T-205 T-318 T-553 T-192 T-206 T-356 T-579 T-195 T-259 T-362 T-616 T-202 T-260 T-368 T-795 T-203 T-289 T-402 T-901 T-204 T-290 T-441
Second Series T Sheets (circa 1868 – 1898)
T-1077 T-1706 T-1982 T-2228 T-1078 T-1802 T-1997 T-2299 T-1085 T-1814 T-1998 T-2389 T-1088 T-1815 T-1999 T-2390 T-1530 T-1818 T-2039 T-2391 T-1705 T-1858 T-2227 T-2597
Third Series T Sheets (circa 1899 – 1938)
T-5609 T-5742 T-10642 T-11193 T-5610 T-5743 T-10643 T-11194 T-5611 T-5744 T-11175 T-11196 T-5731 T-6034 T-11176 T-11203 T-5732 T-6112 T-11179 T-11212 T-5733 T-6113 T-11181 T-11214 T-5734 T-6114 T-11183 T-11215 T-5735 T-6122 T-11186 T-11217 T-5738 T-9080 T-11187 T-11220 T-5739 T-9081 T-11188 T-11221 T-5740 T-9082 T-11189 T-11223 T-5741 T-10641 T-11192
Commonwealth of Massachusetts Page 64 of 78 June 9, 2006 Chapter 91 Mapping Project BSC Group, Inc.
prepared by: BSC Group, Inc. 384 Washington Street
Norwell, MA 02061
H Sheets H-160 H-293 H-1126 H-2210 H-181 H-378 H-1163 H-2272 H-182 H-387 H-1243 H-2273 H-184 H-445 H-2053 H-2312 H-222 H-570 H-2090 H-2316 H-245 H-751 H-2168 H-2317 H-249 H-1106 H-2209
• Plan of Proposed Pile Wharf and Solid Filling in Lake Anthony prepared by Harbor & Lands Commission
and dated October 1930. Scale 1”=100’ • Atlantic Neptune. Chart of Nantucket and the Eastern Half of Martha’s Vineyard. Prepared by J.F.W.
DesBarres and dated 1775. Approximate scale–1:51,000.
Commonwealth of Massachusetts Page 65 of 78 June 9, 2006 Chapter 91 Mapping Project BSC Group, Inc.
prepared by: BSC Group, Inc. 384 Washington Street
Norwell, MA 02061
Appendix A Historical Survey Methods and Datums Over time, improvements in survey techniques and equipment contributed to a measurable increase in the spatial accuracy of plans. Generally, the earlier a plan was produced, the more difficult the task of establishing reliable spatial orientations of plotted features and their true geographic locations. One of the major problems facing early coastal mapmakers was their ability to accurately determine geographic positions (at least by today’s standards). Latitudes, typically established by use of a sextant and celestial observations, were easily determined and relatively accurate. Longitudes presented an altogether different problem – there were no readily available celestial observations that facilitated accurate determinations of position on the face of the earth in an east/west direction. The longitude problem was partially solved by the introduction of the chronometer in the mid- 1800s. Basically, if one knew the longitude and time of noon of a beginning point and then kept time traveling east or west to a second point, the time of noon at the destination could be utilized to determine a longitudinal position. The difficulty associated with making such observations, coupled with equipment limitations of the time make geographic referencing earlier maps to contemporary datums difficult. Typically, registration of such early mapping efforts to a contemporary datum must be accomplished using prominent geographic features and local registration techniques tempered with the exercise of professional judgment to determine if a particular early map or chart is appropriate for use. By the mid 18th century, interest in coastal mapping of the Massachusetts coastline had increased largely in response to the rapidly expanding maritime commerce industry. During this time period, advances in surveying equipment and techniques led to increasingly accurate mapping. Introduction of and refinements to the theodolite and plane table not only allowed mapmakers to establish local or regional networks to control surveying efforts, these instruments facilitated a high level of detail that could be gathered accurately in a relatively short amount of time. Accordingly, the quality and accuracy of maps produced during the 18th century improved dramatically. Beginning around 1760 Joseph Frederick Wallet DesBarres, an army officer and one of the preeminent coastal mapmakers of his time, was commissioned by the British Navy to prepare charts of the eastern seaboard of America. Beginning in 1774, DesBarres’ Atlantic Neptune was published and quickly became recognized as the authority for navigating coastal waters. The following describes the techniques pioneered by DesBarres.
“…I measured a base of 350 fathoms along a plane on the western side of Exeter Harbour, and from its extreemities [sic], having, with a theodolite, taken the angles of visual rays to objects placed on the opposite shore, which being calculated trigonometrically and protracted in their proper bearings, on paper fixed upon a plain table, I then repeated, with the plain table, the same operations over again, and intersected the same objects from the same extreemities of the base line, by which and other intersections, or series of triangles, I had the distance between an object placed on Point Bulkeley and another on Newton Head; from whence, by further intersections performed in the same manner, I determined the true emplacement of Winter's Roger's and Barron's Islands, and of all the ledges; thence, repeating the former operations from all these islands, I found all the angles, and distances to agree with what I had layd down, from the above mentioned observations, before. From points as were most commodiously situated on those island, and head lands, I observed the distance head lands, bays island points, and other remarkable objects, as far as they could be distinguished. Next I went along shore, and

Commonwealth of Massachusetts Page 66 of 78 June 9, 2006 Chapter 91 Mapping Project BSC Group, Inc.
prepared by: BSC Group, Inc. 384 Washington Street
Norwell, MA 02061
reexamined the accuracy of every intersected object, delineated the true shape of every head land, island, point, bay, rock above water, etc., and every winding and irregularly of the rocks and breakers, determined from extent, as perfectly as I could. When the map of any part of the coast was completed in this manner, I provided immediately each craft with copys of it; The sloop was employed in beating off and on, upon the coast, to the distance of ten and twelve miles in the offing, laying down the soundings in their proper bearings and distance, remarking every where the quality of the bottom. The shallop was, in the meantime, kept busy in sounding, and remarking around the headlands, island, and rocks in the offing; and the boats within the indraught, upwards, to the heads of bays, harbors, etc….”19
The quality of DesBarres works for its time was exceptional (and became the standard against which future work was judged until the advent of the U.S. Coast Survey20), making Neptune charts excellent sources of 18th century corroborating information. For several reasons, however, direct incorporation of these maps, and similar efforts of this time period, into the Chapter 91 mapping project is difficult. Most importantly, these plans were created at a relatively small scale (e.g., the DesBarres map for Phase 1 covers from Lynn to Hull on one sheet) and depict few discrete geographic points that would allow for an accurate registration to the project coordinate system. Furthermore, although technology, methodology, and spatial accuracy had improved significantly over preceding works, the art and science of determining geographic position by latitude and longitude was still not of sufficient accuracy to support a more regional, geographic registration process to contemporary datums. These registration challenges are illustrated when the spatial patterns of Boston Harbor landforms and islands from DesBarres’ work in Boston Harbor are compared with the same landforms depicted on contemporary maps. If one were to divide Boston Harbor longitudinally roughly into thirds and compare the landforms within each third to those shown on the digital orthophotos, independent of the remaining two thirds, a respectable correlation exists between contemporary and historical landforms. The remaining two thirds, however, exhibit a distinct systematic shift – predominantly in the east/west direction. Although no definitive treatise analyzing the accuracy of mapping from this era was located, it would appear this systematic shift is the result of a series of initially independent base lines (from the outer harbor to inner harbor in the case of Boston) that were subsequently tied together to form a mapping network. In this way systematic errors could be introduced resulting in an accumulation of errors that would impact accuracy at a regional scale. Even though these plans were generally determined to be inadequate for use as a primary source of historical coastal information, they frequently provided a reliable source of anecdotal information on the nature of early shoreline conditions. A comprehensive discussion of early surveying instruments and techniques can be found at the following URL.
http://www.history.noaa.gov/stories_tales/geodetic1.html In 1807, President Thomas Jefferson signed into law an Act authorizing the formation of the United States Coast Survey. The U.S. Coast Survey was charged with preparing accurate charts of the entire coastline of the United States for the purposes of advancement of trade, commerce, science, and economic development. Ferdinand Hassler, a Swiss born geodesist and noted mathematician, directed the formative years of the Coast Survey. Hassler’s plan was to divide the
19 Library of Congress – Mapping the American Revolution http://memory.loc.gov/ammem/gmdhtml/armhtml/armessay.html 20 Guthorn, Peter J. United States Coastal Charts 1783 – 1861. Schiffer Publishing Limited. 1984. 224 pages

Commonwealth of Massachusetts Page 67 of 78 June 9, 2006 Chapter 91 Mapping Project BSC Group, Inc.
prepared by: BSC Group, Inc. 384 Washington Street
Norwell, MA 02061
Coast Survey into three distinct divisions, geodetic, topographic, and hydrographic. Of the three divisions, Hassler emphasized the importance of the geodetic branch; noting that if the initial control network was inaccurate, then the subsequent mapping and hydrographic efforts would be pointless. Consequently, the first action of the Coast Survey was to create an extensive geodetic control network along the entire coastline utilizing prominent physical features such as church spires, water towers, chimneys, and hilltops. From the primary control points, subsequent efforts focused on the expansion of the triangulation network to which plane table mapping and hydrographic soundings were mathematically tied. The Coast Survey performed its work in a manner similar to that of DesBarres. The significant differences, however, were the focus on larger mapping scales, an extensive geodetic control network and the dramatic improvement in survey equipment and theory that helped minimize the possibility of large errors. As mentioned in earlier chapters, the primary products of the Coast Survey were charts of large geographic areas typically produced at scales ranging from 1:20,000 to 1:80,000 with 1:40,000 being common. T and H Sheets, typically produced at larger scales of 1:10,000 and containing a significant amount of detail, were the source worksheets from which final Coast Survey charts were compiled. During the transition from T/H sheets to final charts, several important modifications were made:
• Geodetic control that was plotted on the T/H sheets was omitted from the final charts making registration of the final charts much more uncertain when compared to that of T/H Sheets.
• The production scale was the result of reductions from typical compilation scales of
1:10,000 for the T Sheets and 1:20,000 for H sheets to 1:40,000 or 1:80,000 for the final charts. This 400% to 800% decrease in compilation scale meant that compromises had to be made in the level of detail depicted on the final charts.
• Symbology was often homogenized by the cartographer to simplify the final chart
deleting sometimes significant planimetric and hydrographic features. Although the common symbology of Coast Survey charts makes them extremely useful as an overall reference for the interpretation of individual T and H sheet symbology, the original field sheets proved to be superior source of surveyed shoreline information because of the factors listed above. Indeed, according to Shalowitz, “These surveys were executed by competent and careful engineers and were practically all based on a geodetic network, which minimized the possibility of large errors being introduced. They therefore represent the best evidence available of the condition of our coastline a hundred or more years ago, and the courts have repeatedly recognized their competency in this respect”. 21 As time progressed, more advanced technologies were introduced that further increased accuracy and efficiency in mapping. The advent of stadia measurements, photogrammetric mapping techniques, and contemporary GPS and LIDAR technology have enabled modern surveyors and cartographers to efficiently produce extremely accurate maps that contain tremendous amounts 21 Aaron L. Shalowitz, Shore and Sea Boundaries, Volume 2, Publication 10-1, U.S. Department of Commerce, Chapter 1. Pg. 79

Commonwealth of Massachusetts Page 68 of 78 June 9, 2006 Chapter 91 Mapping Project BSC Group, Inc.
prepared by: BSC Group, Inc. 384 Washington Street
Norwell, MA 02061
of detail. Although these mapping methods were introduced after a significant amount of coastal filling had already occurred it is significant to note that even with increased accuracy, they still represent shoreline positions for only discrete points in time. As mapping techniques advanced, so did the refinements to horizontal geodetic datums and coordinate systems upon which mapping efforts were referenced. Surveys pre-dating the U.S. Coastal Survey’s efforts were most likely referenced to a Mercator conformal projection. Since early coastal surveys were predominantly concerned with maritime navigation, use of the Mercator conformal projection avoided distorting angles or bearings using a common map scale in the cardinal directions to make the charting of a ship’s course simpler. Additionally, meridians are depicted as parallel lines making the measurement of angles and plotting of straight course lines easier for navigators. The prime meridian of early mapping was typically Greenwich, although some used Paris or London or in some instances, a local meridian. Horizontal Datums The first task of the newly formed U.S. Coast Survey was to create a highly accurate survey control network throughout the United States. It was recognized early on that a project of this magnitude would have to be founded in sound geodetic principals if map accuracy goals were to be achieved and maintained as mapping efforts expanded geographically. Consequently, a national geodetic (horizontal) datum was defined. Early work of the Coast Survey, until the 1870s, was based on local astronomical datums and the Bessel’s Ellipsoid of 1841. The first official horizontal datum developed to support the U.S. Coast Survey was referred to as the New England Datum. Originally based on surveys performed in the northeastern region of the country, the New England Datum, established in 1879, referenced the Clarke ellipsoid of 1866. The New England Datum network was eventually expanded to the west coast and south to the Gulf of Mexico without a major readjustment. In 1901, the New England Datum was renamed the United States Standard Datum and its origin moved to Meades Ranch, Kansas. Eventually, an agreement was reached between the United States, Canada, and Mexico to adopt a comprehensive horizontal datum that encompassed all three countries. This newly adopted datum was renamed the North American Datum. As the North American Datum was densified and new control points were added, it became apparent that systematic errors were creeping into the network causing a degradation of accuracy. To combat the propagation of error, the entire network including that portion of the network that originally comprised the New England datum, was readjusted during the period of time between 1927 through 1932. The newly adjusted datum was then renamed the North American Datum of 1927 and still referenced to the Clarke’s Ellipsoid. Ultimately, the North American Datum of 1927 (NAD ’27) was subjected to a readjustment and refinement and became the North American Datum of 1983 (NAD ’83) using the mathematical ellipsoid, GRS 80. With each major modification or adjustment to the mapping datum, coordinates for existing control points must be adjusted accordingly and for many geographic areas changed significantly. Consequently, when comparing work from different periods in time, coordinates must be converted to a common coordinate system. If one were to closely examine the 24 micron T/H Sheet scans recovered during the course of this project, they would notice faint coordinate tics or grid lines. Depending on the era during which the survey was performed,

Commonwealth of Massachusetts Page 69 of 78 June 9, 2006 Chapter 91 Mapping Project BSC Group, Inc.
prepared by: BSC Group, Inc. 384 Washington Street
Norwell, MA 02061
these grid marks could be related to the Bessel’s 1841 or Clarke 1866 ellipsoids and reference the New England Datum, North American Datum of 1927, or North American Datum of 1983. The National Geodetic Survey and U.S. Army Corps of Engineers have produced several tools and methods for converting horizontal coordinates between NAD ’27 and NAD ’83. Unfortunately, no such tools exist for the direct and accurate conversion of geodetic coordinates from earlier datums to NAD ’27 (or NAD ’83). While there are well documented geodetic coordinate transformation algorithms such as the Molodensky or Helmert, all have inherent limitations that prevent these transformations from returning accurate results with respect to modern day mapping datums. Differences in ellipsoids and in the orientation of axes between reference ellipsoids introduces a potentially significant error that often prevents the user from utilizing these transformation routines to accurately register historical plans to a modern coordinate system. Section 5.0 discusses the strategy developed as part of this project to capitalize on the historical triangulation network points displayed on T and H sheets and the methods used to ensure accurate plan registration. Vertical Datums With the extension and densification of the nationwide horizontal geodetic datum, an effort was also underway to create a nationwide vertical datum based on differential leveling. The first published nationwide vertical geodetic datum was termed the National Geodetic Vertical Datum of 1929 (NGVD29). It was derived from a general adjustment of first-order leveling nets, holding mean sea level fixed as observed at 21 United States (including Boston) and 5 Canadian tide stations. Recognizing that the relationship between a fixed geodetic datum and mean sea level is not consistent from one location to another, this vertical network has been superceded by the North American Vertical Datum of 1988 (NAVD ’88). NAVD88 held fixed the height of the primary tidal benchmark, referenced to the new International Great Lakes Datum of 1985 local mean sea level height value, at Father Point/Rimouski, Quebec, Canada. Additional tidal bench mark elevations were not used due to the demonstrated variations in sea surface topography, i.e., the fact that mean sea level is not the same equipotential surface at all tidal bench marks.22 Because of the potentially tremendous variation in tidal levels from region to region (from nearly 20 feet in Eastport, Maine to approximately 4 feet at Half Moon Island in Florida), a nationally based vertical datum could not adequately represent features below the high water mark because of the gross variations in tidal ranges from region to region. Tidal Datums Since tidal boundaries such as mean high, low, and lower low waters have legal significance with respect to riparian owner’s rights, local vertical reference datums (often tied to a geodetic datum) are typically used to control hydrographic surveys. Today, these datums are determined based on an average of tidal ranges over a 6939.6 day (18.6 years) Metonic cycle. Specific 19-year periods, termed National Tidal Datum Epochs (NTDE), are periodically updated, adopted, and published by the National Ocean Survey (NOS) as the official time segment over which tide observations are taken and reduced to obtain mean values for tidal datums. The current NTDE, published in April 2003, is 1983-2001.
22 "Results of the General Adjustment of the North American Datum of 1988," Surveying and Land Information Systems Vol. 52, No. 3, 1992 pp. 133-149)

Commonwealth of Massachusetts Page 70 of 78 June 9, 2006 Chapter 91 Mapping Project BSC Group, Inc.
prepared by: BSC Group, Inc. 384 Washington Street
Norwell, MA 02061
The semi-diurnal tides of the east coast exhibit a distinctly sinusoidal pattern with generally two high and two low tides per day. Mean tidal ranges (calculated as the difference between mean high and mean low waters) for Massachusetts vary from one to three feet along southerly shores to upwards of nine to ten feet along northerly shores. According to the National Atmospheric and Oceanic Administration (NOAA), the contemporary definitions of Mean High Water (MHW) and Mean Low Water (MLW) are as follows:
• Mean High Water (MHW)... a tidal datum calculated as the average of all the high water heights observed over the National Tidal Datum Epoch.
• Mean Low Water (MLW) ... a tidal datum calculated as the average of all the low water heights observed over the National Tidal Datum Epoch.
Additional tidal datums commonly encountered include Mean Lower Low Water (MLLW) and Mean Higher High Water (MHHW), which are determined by averaging the highest (or lowest) of the two daily tides over the National Tidal Datum Epoch. Early tidal datums typically were derived for a particular region by averaging short series (weeks or months) of tidal readings observed as part of the on-going topographic or hydrographic work. Although several early observation-based tidal datums were used for mapping work in Boston Harbor by the early 1800s, the first official U.S. Coast Survey tidal datum for Massachusetts was not established until 1846, well after completion of the Charlestown Navy Yard dry dock.23 The first continuously monitored tidal station was installed at the dry dock in 1847 and although the location of the station was moved periodically, observations continued at the Navy Yard until the 1900s. Planes of Reference Recognizing the goal of early cartographers to ensure safe navigation, a local datum referred to as Extreme Low Water (ELW) is frequently encountered on many early maps and charts. ELW refers to the lowest elevation reached by the sea as recorded over a particular period. As the lowest observed tide level, ELW was of particular interest to mariners and hydrographers because it represents a worst case when the shallowest depths would be available for ships. Consequently, many early hydrographic charts depicted or were referenced to ELW. Extreme Low Water can be thought of as a single occurrence or a “worst case event”. A more common tidal occurrence is referred to as Mean Low Water Springs (MLWS). MLWS is a tidal datum (lower than MLW) determined from the arithmetic mean of the low water heights occurring at the time of spring tides observed over a continuous period of time (today, over the National Tidal Datum Epoch). Because the low water component of spring tides is typically lower than Mean Low Water over the Metonic cycle, it represents an annual occurrence of periodically lower tides. Again, because of potential effect on navigation of ships, the MLWS datum is of interest to mariners and formed the vertical reference datum for many early hydrographic sheets (H Sheets) prepared by the U.S. Coast Survey. One should note that although the MLWS datum is of navigational interest, it has little bearing on present legal
23 Dry dock construction was completed in the mid-1830’s and most work of the period references the coping at the dry dock as a local datum. The well-known Boston City Base also appears to be related to this dry dock datum.

Commonwealth of Massachusetts Page 71 of 78 June 9, 2006 Chapter 91 Mapping Project BSC Group, Inc.
prepared by: BSC Group, Inc. 384 Washington Street
Norwell, MA 02061
boundaries of property ownership, which are typically referenced to MLW, -nor should it be confused with the MLLW datum used to construct federal and/or state boundaries. Another common plane of reference for much early hydrographic work was low water springs (LWS). Much of the hydrographic work supervised by DesBarres was thought to have been referenced to this datum defined as the “lower of the two [spring lows] occurring in each moon.”24 The first series of H Sheets produced by the U.S. Coast Survey were referenced to MLWS, as were significant hydrographic survey works produced by Alex Wadsworth (circa 1817) and Ellis Chesbrough (circa 1852). Unless conversions were noted, there is no simple, direct manner by which to convert from MLWS datums to MLW datum. As a result, because a MLWS datum is lower relative to MLW datum, lines defining MLWS will be seaward of MLW lines a distance proportional to the tidal range and near shore slope. For comparative purposes, Figure 13 depicts the differences between contemporary tidal datums for Boston Harbor as referenced to the current NTDE. For comparative purposes, Figure 14 depicts the differences between historical tidal datums.
Figure 13 Relationship of contemporary tidal datums for Boston Harbor
24 Notes Concerning Alleged Changes in the Relative Elevations of Land and Sea. Mitchell, Henry, U.S. Coast Survey Assistant. Appendix No. 8, Report of the Superintendent of the U.S. Coast Survey showing the Progress of the work for the Fiscal Year Ending June 1877. Washington. Government Printing Office. 1880
Tidal datums at BOSTON, BOSTON HARBOR based on: LENGTH OF SERIES: 19 Years TIME PERIOD: January 1983 - December 2001 TIDAL EPOCH: 1983-2001 CONTROL TIDE STATION:
Elevations of tidal datums referred to Mean Lower Low Water (MLLW), in METERS: HIGHEST OBSERVED WATER LEVEL (02/07/1978) = 4.601 (15.10’) MEAN HIGHER HIGH WATER (MHHW) = 3.131 (10.27’) MEAN HIGH WATER (MHW) = 2.996 (9.82’) NORTH AMERICAN VERTICAL DATUM-1988 (NAVD) = 1.678 (5.50’) MEAN SEA LEVEL (MSL) = 1.585 (5.20’) MEAN TIDE LEVEL (MTL) = 1.550 (5.09’) MEAN LOW WATER (MLW) = 0.103 (0.34’) MEAN LOWER LOW WATER (MLLW) = 0.000 LOWEST OBSERVED WATER LEVEL (03/24/1940) = -1.135 (-3.72’)

Commonwealth of Massachusetts Page 72 of 78 June 9, 2006 Chapter 91 Mapping Project BSC Group, Inc.
prepared by: BSC Group, Inc. 384 Washington Street
Norwell, MA 02061
Figure 14
Relationship of historical tidal datums in Boston Harbor Because of their importance in defining low water lines for the Chapter 91 mapping project, knowledge of differences in tidal datums and how they are and were established is essential in order to accurately assess plans depicting low water lines and their relevancy to Chapter 91. Chapter 6.0 discusses further how tidal datums were used in early mapping efforts and their influence on subsequent low water line determinations.

Commonwealth of Massachusetts Page 73 of 78 June 9, 2006 Chapter 91 Mapping Project BSC Group, Inc.
prepared by: BSC Group, Inc. 384 Washington Street
Norwell, MA 02061
Appendix B
310 CMR 9.00: WATERWAYS Jurisdiction
9.01: Authority and Purpose
(1) Authority. 310 CMR 9.00 is adopted by the Commissioner of the Department of Environmental Protection (DEP) under the authority of M.G.L. c. 91A, 18 to establish procedures, criteria, and standards for uniform and coordinated administration of the provisions of M.G.L. c. 91, 1 through 63 and M.G.L. c. 21A, 2, 4, 8 and 14. 310 CMR 9.00 also form part of the Massachusetts Coastal Zone Management (CZM) Program, established by M.G.L. c. 21A, 4A, and codified at 301 CMR 20.00 and as may be amended hereafter. The interpretation and application of 310 CMR 9.00 shall be consistent with the policies of the CZM Program, 301 CMR 20.05(3), to the maximum extent permissible by law.
(2) Purpose. 310 CMR 9.00 is promulgated by the Department to carry out its statutory obligations and the responsibility of the Commonwealth for effective stewardship of trust lands, as defined in 310 CMR 9.02. The general purposes served by 310 CMR 9.00 are to:
(a) protect and promote the public's interest in tidelands, Great Ponds, and non-tidal rivers and streams in accordance with the public trust doctrine, as established by common law and codified in the Colonial Ordinances of 1641-47 and subsequent statutes and case law of Massachusetts;
(b) preserve and protect the rights in tidelands of the inhabitants of the Commonwealth by ensuring that the tidelands are utilized only for water-dependent uses or otherwise serve a proper public purpose;
(c) protect the public health, safety, and general welfare as it may be affected by any project in tidelands, great ponds, and non-tidal rivers and streams;
(d) support public and private efforts to revitalize unproductive property along urban waterfronts, in a manner that promotes public use and enjoyment of the water; and
(e) foster the right of the people to clean air and water, freedom from excessive and unnecessary noise, and the natural, scenic, historic, and esthetic qualities of their environment under Article XCVII of the Massachusetts Constitution.
9.02: Definitions
Commonwealth Tidelands means tidelands held by the Commonwealth, or by its political subdivisions or a quasi-public agency or authority, in trust for the benefit of the public; or tidelands held by a private person by license or grant of the Commonwealth subject to an express or implied condition subsequent that it be used for a public purpose. In applying this definition, the Department shall act in accordance with the following provisions:
(a) the Department shall presume that tidelands are Commonwealth tidelands if they lie seaward of the historical low water mark or of a line running 100 rods (1650 feet) seaward of the historical high water mark, whichever is farther landward; such presumption may be overcome only if the Department issues a written determination based upon a final judicial decree concerning the tidelands in question or other conclusive legal documentation establishing that, notwithstanding the Boston Waterfront decision of the Supreme Judicial Court, such tidelands are unconditionally free of any proprietary interest in the Commonwealth;
(b) the Department shall presume that tidelands are not Commonwealth tidelands if they lie landward of the historical low water mark or of a line running 100 rods (1650 feet) seaward of the historical high water mark, whichever if farther landward; such presumption may be overcome only upon a showing that such tidelands, including but not limited to those in certain portions of the Town of Provincetown, are not held by a private person.
Commonwealth of Massachusetts Page 74 of 78 June 9, 2006 Chapter 91 Mapping Project BSC Group, Inc.
prepared by: BSC Group, Inc. 384 Washington Street
Norwell, MA 02061
Fill means any unconsolidated material that is confined or expected to remain in place in a waterway, except for: material placed by natural processes not caused by the owner or any predecessor in interest; material placed on a beach for beach nourishment purposes; and dredged material placed below the low water mark for purposes of subaqueous disposal. Filled Tidelands means former submerged lands and tidal flats which are no longer subject to tidal action due to the presence of fill. Flowed Tidelands means present submerged lands and tidal flats which are subject to tidal action.
Great Pond means any pond which contained more than ten acres in its natural state, as calculated based on the surface area of lands lying below the natural high water mark. The title to such lands is held by the Commonwealth in trust for the public, subject to any rights which the applicant demonstrates have been granted by the Commonwealth. The Department shall presume that any pond presently larger then ten acres is a Great Pond, unless the applicant presents topographic, historic, or other information demonstrating that the original size of the pond was less than ten acres, prior to any alteration by damming or other human activity. Harbor Line means any line established by the legislature pursuant to M.G.L. c. 91, 34.
High Water Mark means:
(a) for tidelands, the present mean high tide line, as established by the present arithmetic mean of the water heights observed at high tide over a specific 19-year Metonic Cycle (the National Tidal Datum Epoch), and shall be determined using hydrographic survey data of the National Ocean Survey of the U.S. Department of Commerce; and
(b) for Great Ponds, rivers, and streams, the present arithmetic mean of high water heights observed over a one year period using the best available data as determined by the Department.
Historical High Water Mark means the high water mark, which existed prior to human alteration of the shoreline by filling, dredging, excavating, impounding, or other means. In areas where there is evidence of such alteration by fill, the Department shall presume the historical high water mark is the farthest landward former shoreline which can be ascertained with reference to topographic or hydrographic surveys, previous license plans, and other historical maps or charts, which may be supplemented as appropriate by soil logs, photographs, and other documents, written records, or information sources of the type on which reasonable persons are accustomed to rely in the conduct of serious business affairs. Such presumption may be overcome by a clear showing that a seaward migration of such shoreline occurred solely as a result of natural accretion not caused by the owner or any predecessor in interest. For Great Ponds, the historical high water mark is synonymous with the natural high water mark. Historical Low Water Mark means the low water mark which existed prior to human alteration of the shoreline by filling, dredging, excavating, impounding or other means. In areas where there is evidence of such alteration by fill, the Department shall make its determination of the position of the historical low water mark in the same manner as described above in the definition of historical high water mark.
Landlocked Tidelands means any filled tidelands which on January 1, 1984 were entirely separated by a public way or interconnected public ways from any flowed tidelands, except for that portion of such filled tidelands which are presently located:
(a) within 250 feet of the high water mark, or (b) within any Designated Port Area. Said public way or ways shall also be defined as landlocked
tidelands, except for any portion thereof which is presently within 250 feet of the high water mark.
Low Water Mark means the present mean low tide line, as established by the present arithmetic mean of water heights observed at low tide over a specific 19-year Metonic Cycle (the National Tidal Datum Epoch), and shall be determined using hydrographic survey data of the National Ocean Survey of the U.S. Department of Commerce.

Commonwealth of Massachusetts Page 75 of 78 June 9, 2006 Chapter 91 Mapping Project BSC Group, Inc.
prepared by: BSC Group, Inc. 384 Washington Street
Norwell, MA 02061
Natural High Water Mark means the historical high water mark of a Great Pond. Present means contemporaneous with the review of an application, request for determination of applicability, or other action by the Department.
Private Tidelands means tidelands held by a private person subject to an easement of the public for the purposes of navigation and free fishing and fowling and of passing freely over and through the water. In accordance with the Colonial Ordinances of 1641-47, the Department shall presume that tidelands are private tidelands if they lie landward of the historical low water mark or of a line running 100 rods (1650 feet) seaward of the historical high water mark, whichever is farther landward; such presumption may be overcome upon a showing that such tidelands, including but not limited to those in certain portions of the Town of Provincetown, are not held by a private person or upon a final judicial decree that such tidelands are not subject to said easement of the public.
Project Shoreline means the high water mark, or the perimeter of any pier, wharf, or other structure supported by existing piles or to be replaced pursuant to 310 CMR 9.32(1)(a)4., whichever is farther seaward.
Public Way means a road, street, or highway for vehicular use open to the public at large and for which a public agency is responsible for maintenance and repair.
Structure means any man-made object which is intended to remain in place in, on, over, or under tidelands, Great Ponds, or other waterways. Structure shall include, but is not limited to, any pier, wharf, dam, seawall, weir, boom, breakwater, bulkhead, riprap, revetment, jetty, piles (including mooring piles), line, groin, road, causeway, culvert, bridge, building, parking lot, cable, pipe, pipeline, conduit, tunnel, wire, or pile-held or other permanently fixed float, barge, vessel or aquaculture gear. Structure does not include any mooring, float, or raft which has been authorized by annual permit of a harbormaster, in accordance with M.G.L. c. 91, 10A and with 310 CMR 9.07; nor any weir, pound net, or fish trap which has been authorized in tidewater by permit of the municipal official and approved by the Department and the Division of Marine Fisheries, in accordance with M.G.L. c. 130, 29. Any such mooring, float, raft, weir, pound net, or fish trap, which has not been so authorized shall be considered a structure under 310 CMR 9.00.
Tidelands means present and former submerged lands and tidal flats lying between the present or historical high water mark, whichever is farther landward, and the seaward limit of state jurisdiction. Tidelands include both flowed and filled tidelands, as defined herein.
Trust Lands means present and former waterways in which the fee simple, any easement, or other proprietary interest is held by the Commonwealth in trust for the benefit of the public. All geographic areas subject to the jurisdiction of M.G.L. c. 91, as specified in 310 CMR 9.04, are generally considered to be trust lands.
Waterway means any area of water and associated submerged land or tidal flat lying below the high water mark of any navigable river or stream, any Great Pond, or any portion of the Atlantic Ocean within the Commonwealth, which is subject to 310 CMR 9.04.
9.03: Scope of Jurisdiction
(1) Authorization of Projects By the Department. Written authorization in the form of a license, permit, or amendment thereto must be obtained from the Department before the commencement of one or more activities specified in 310 CMR 9.03(2) and (3) or 310 CMR 9.05 and located in one or more geographic areas specified in 310 CMR 9.04, unless the legislature has specifically exempted any such activity(ies) from Department jurisdiction under M.G.L. c. 91.
(2) Oversight of Certain Work Authorized By the Legislature. In accordance with M.G.L. c. 91, 20, no person shall undertake any work authorized by the legislature and subject to M.G.L. c. 91 in accordance with 310 CMR 9.03(1), until said person has given written notice thereof to the Department, in the form of a license or permit application, and has submitted plans for such work

Commonwealth of Massachusetts Page 76 of 78 June 9, 2006 Chapter 91 Mapping Project BSC Group, Inc.
prepared by: BSC Group, Inc. 384 Washington Street
Norwell, MA 02061
which conform with the application requirements of 310 CMR 9.00. The Department may alter such plans and impose conditions in the license or permit, which shall be consistent with the legislative authorization and issued in accordance with 310 CMR 9.00 310 CMR 9.31(4). All work so authorized shall conform with the plans and conditions contained in said license or permit, and shall not commence until said license or permit has been issued.
In accordance with the Boston Waterfront decision of the Supreme Judicial Court, grants by the legislature of tidelands below the historical low water mark are subject to a condition subsequent that such tidelands be used for the public purpose for which they were granted, and the rights of the grantee to those tidelands are ended when that purpose is extinguished. If the present use of such tidelands has changed from the public purpose for which they were granted, authorization shall be obtained from the Department, in the form of a license pursuant to 310 CMR 9.00, in order to establish that such change of use serves a proper public purpose.
9.04: Geographic Areas Subject to Jurisdiction
The following geographic areas, generally considered "trust lands", are subject to licensing and permitting by the Department under 310 CMR 9.00:
(1) all waterways, including all flowed tidelands and all submerged lands lying below the high water mark of: (a) Great Ponds; (b) the Connecticut River; (c) the section of the Westfield River in the Towns of West Springfield and Agawam lying
between the confluence of said river with the Connecticut River and the bridge across said river at Suffield Street in said Town of Agawam;
(d) the non-tidal portion of the Merrimack River; and (e) any non-tidal river or stream on which public funds have been expended for stream
clearance, channel improvement, or any form of flood control or prevention work, either upstream or downstream within the river basin, except for any portion of any such river or stream which is not normally navigable during any season, by any vessel including canoe, kayak, raft, or rowboat; the Department may publish, after opportunity for public review and comment, a list of navigable streams and rivers; and
(2) all filled tidelands, except for landlocked tidelands, and all filled lands lying below the natural high water mark of Great Ponds.

Commonwealth of Massachusetts Page 77 of 78 June 9, 2006 Chapter 91 Mapping Project BSC Group, Inc.
prepared by: BSC Group, Inc. 384 Washington Street
Norwell, MA 02061
Appendix C
City Document No. 60
Report of the Joint Standing Committee on Boston Harbor For the Year 1852
Prepared by
E.S. Chesbrough

Commonwealth of Massachusetts Page 78 of 78 June 9, 2006 Chapter 91 Mapping Project BSC Group, Inc.
prepared by: BSC Group, Inc. 384 Washington Street
Norwell, MA 02061
Appendix D Towns Not Providing Acceptance
Dates for Public Ways Phase I
Boston Hull Brookline Cambridge Malden Winthrop Medford
Phase II
Revere Nahant Lynn Swampscott Marblehead Salem Beverly Manchester Gloucester Peabody
Rockport Salem Salisbury Saugus Danvers Open
Phase III
Marshfield Kingston
Phase IV
New Bedford Rochester Marion Dartmouth Somerset Wareham Fall River
Phase V
Chatham Truro (partial) West Tisbury Tisbury Falmouth Barnstable Brewster Orleans Wellfleet