excise duty evasion on cotton textil fabrice s · excise duty evasion on cotton textil fabrice s...
TRANSCRIPT
Excise Duty Evasion on Cotton Textile Fabrics M G o v i n d a R a o
Gopinath Pradhan The few studies that exist of tax evasion in India have been largely confined to direct4taxes, particularly per-
sonal income-tax, and there is hardly any empirical study of evasion of commodity taxes. Given that commodity taxes predominate in the government's tax revenues, this is an obvious, lacuna.
Study of excise duty evasion is especially opportune now for many reasons. First, the needs of resource mobilisa-tion for the Seventh Plan call for minimising such evasion. Further, there is a belief that Central excise duties are better administered than states' sales taxes and this argument is sometimes extended to suggest expansion of the list of items covered under additional excise duties. It would, therefore, be interesting to examine the extent of tax evasion In respect of a commodity on which the states have surrendered the right to levy sales tax in lieu of additional excise duties.
ALTHOUGH tax evasion is a universal phenomenon, it is of particular concern to policy-makers in developing countries. In these countries, the pressing need for mobilising savings and attempts to combine multiple objectives in the tax laws have enor-mously complicated the tax structure. The resulting high and differential tax rates with varied exemptions and deductions open up numerous avenues of evasion and the ex-istence of large unorganised factor and pro-duct markets and low levels of monetisation render evasion easier, thereby making the problem more serious. As in other develop-ing countries, in India too the issue is of im-mense relevance to the larger task of socio-economic development.
In spite of the importance of the subject in policy making, very few studies have been conducted in India on tax evasion. Further the few studies that exist have been largely confined to the evasion of direct taxes, par-ticularly the personal income tax, and hardly is there any important empirical study on the evasion of commodity taxes. Given that the yield of commodity taxes predominates in the tax revenues of the developing coun-tries, this is an obvious lacuna. It is hoped that this study of excise duty evasion in cot-ton textile fabrics would partially fill the gap.
The study of excise duty evasion in India is opportune now for many reasons. First-ly, the needs of resource mobilisation to finance the Seventh Five-Year Plan call for minimising evasion and unintended avoidance. While the attempt towards ra-tionalisation of direct taxes has been made to some extent in the last budget, indirect taxes continue to be riddled with complex-ities. It is hoped that rationalisation attempt in respect of indirect taxes would be forth-coming in the long-term fiscal policy expected to be announced shortly.
Estimation of evasion of excise duty on cotton textiles assumes special importance for an additional reason. There is a belief that Central excise duties are better ad ministered than the states' sales taxes. Sometimes, this argument is extended to argue for expansion of the list of items covered tnder additional excise duties, jt would therefore be interesting'to examine the extent of evasion in respect of a commodity on which the states have surrendered the
right to levy sales tax in lieu of additional excise duties.
COTTON T E X T I L E INDUSTRY: IMPORTANT Features
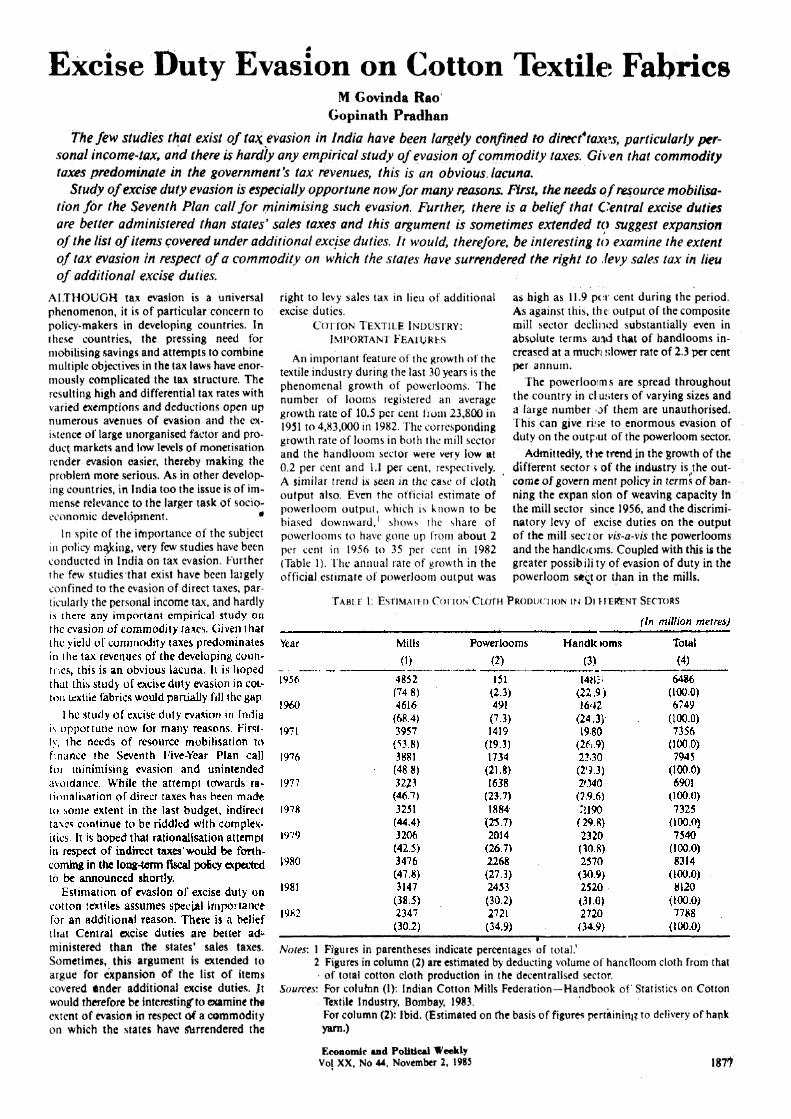
An important feature of the growth of the textile industry during the last 30 years is the phenomenal growth of powerlooms. The number of looms registered an average growth rate of 10.5 per cent from 23,800 in 1951 to 4,83,000 in 1982. The corresponding growth rate of looms in both the mill sector and the handloom sector were very low at 0.2 per cent and 1,1 per cent, respectively. A similar trend is seen in the ease of cloth output also. Even the official estimate of powerloom output, which is known to be biased downward,1 shows the share of powcrlooms to have gone up from about 2 per cent in 1956 to 35 per cent in 1982 (Table 1). The annual rate of growth in the official estimate of powerloom output was
as high as 11.9 per cent during the period. As against this, th e output of the composite mill sector declined substantially even in absolute terms ajtyi that of handlooms in-creased at a much slower rate of 2.3 per cent per annum.
The powerlooims are spread throughout the country in cl usters of varying sizes and a large number of them are unauthorised. This can give rise to enormous evasion of duty on the output of the powerloom sector.
Admittedly, t he trend in the growth of the different sectors of the industry is the out-come of govern ment policy in terms of ban-ning the expan sion of weaving capacity In the mill sector since 1956, and the discrimi-natory levy of excise duties on the output of the mill sec tor vis-a-vis the powerlooms and the handlooms. Coupled with this is the greater possibility of evasion of duty in the powerloom sector than in the mills.
T A B L E 1: Estimated C a t I O N CLOTH PRODUCTION IN Di H e r E N T SECTORS
Notes: 1 Figures in parentheses indicate percentages of total.4
2 Figures in column (2) arc estimated by deducting volume of handloom cloth from that of total cotton cloth production in the decentralised sector.
Sources: For coluton (1): Indian Cotton Mills Federation—Handbook of' Statistics on Cotton Textile Industry, Bombay, 1983. For column (2): Ibid. (Estimated on the basis of figures pertaining to delivery of hank yarn.)
Economic and Political Weekly Vol XX, No 44, November 2, 1985
November 2, 1985 ECONOMIC AND POLITICAL WEEKLY
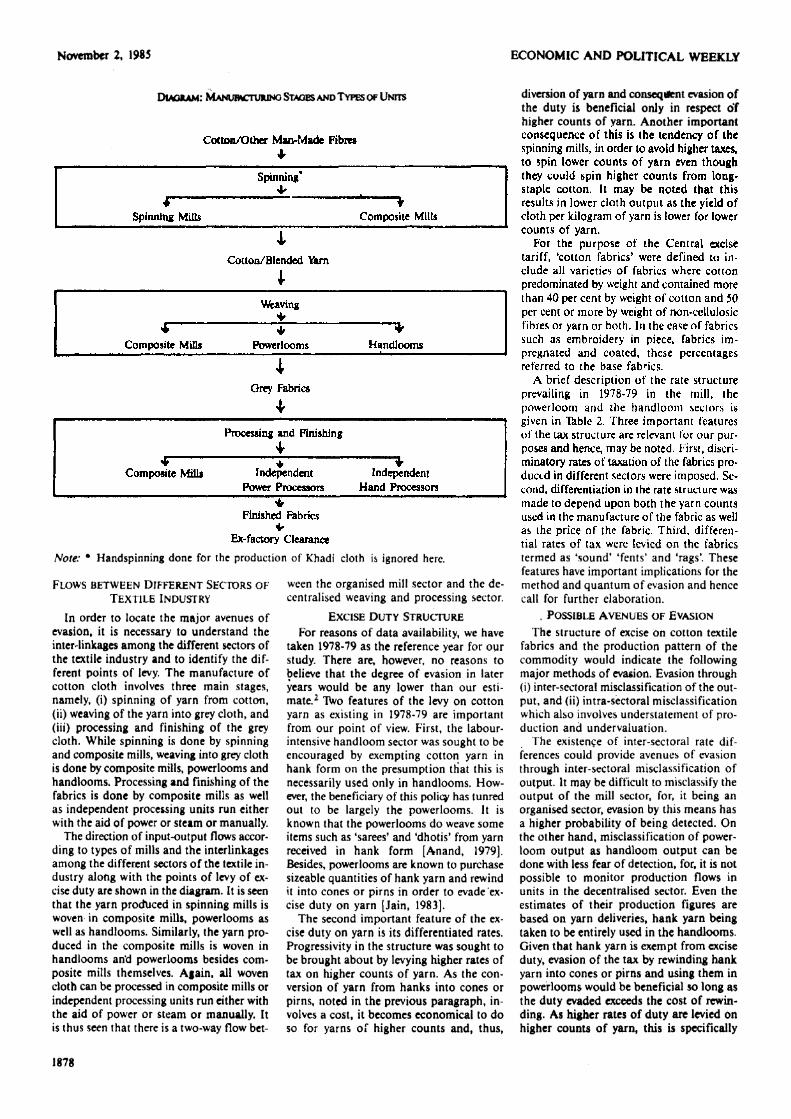
Diagram: MANUFACTURING STAGES AND TYPES OF UNITS
Note: * Handspinning done for the production of Khadi cloth is ignored here.
FLOWS BETWEEN DIFFERENT SECTORS OF TEXTILE INDUSTRY
In order to locate the major avenues of evasion, it is necessary to understand the inter-linkages among the different sectors of the textile industry and to identify the dif-ferent points of levy. The manufacture of cotton cloth involves three main stages, namely, (i) spinning of yarn from cotton, (ii) weaving of the yarn into grey cloth, and (iii) processing and finishing of the grey cloth. While spinning is done by spinning and composite mills, weaving into grey cloth is done by composite mills, powerlooms and handlooms. Processing and finishing of the fabrics is done by composite mills as well as independent processing units run either with the aid of power or steam or manually.
The direction of input-output flows accor-ding to types of mills and the interlinkages among the different sectors of the textile in-dustry along with the points of levy of ex-cise duty are shown in the diagram. It is seen that the yarn produced in spinning mills is woven in composite mills, powerlooms as well as handlooms. Similarly, the yarn pro-duced in the composite mills is woven in handlooms arid powerlooms besides com-posite mills themselves. Again, all woven cloth can be processed in composite mills or independent processing units run either with the aid of power or steam or manually. It is thus seen that there is a two-way flow bet-
ween the organised mill sector and the de-centralised weaving and processing sector.
EXCISE DUTY STRUCTURE
For reasons of data availability, we have taken 1978-79 as the reference year for our study. There are, however, no reasons to believe that the degree of evasion in later years would be any lower than our esti-mate.2 Two features of the levy on cotton yarn as existing in 1978-79 are important from our point of view. First, the labour-intensive handloom sector was sought to be encouraged by exempting cotton yam in hank form on the presumption that this is necessarily used only in handlooms. How-ever, the beneficiary of this policy has tunred out to be largely the powerlooms. It is known that the powerlooms do weave some items such as 'sarees' and 'dhotis' from yarn received in hank form [Anand, 1979]. Besides, powerlooms are known to purchase sizeable quantities of hank yarn and rewind it into cones or pirns in order to evade ex-cise duty on yarn [Jain, 1983].
The second important feature of the ex-cise duty on yarn is its differentiated rates. Progressivity in the structure was sought to be brought about by levying higher rates of tax on higher counts of yarn. As the con-version of yarn from hanks into cones or pirns, noted in the previous paragraph, in-volves a cost, it becomes economical to do so for yarns of higher counts and, thus,
diversion of yarn and consequent evasion of the duty is beneficial only in respect of higher counts of yarn. Another important consequence of this is the tendency of the spinning mills, in order to avoid higher taxes, to spin lower counts of yarn even though they could spin higher counts from long-staple cotton. It may be noted that this results in lower cloth output as the yield of cloth per kilogram of yarn is lower for lower counts of yarn.
For the purpose of the Central excise tariff, 'cotton fabrics' were defined to in-clude all varieties of fabrics where cotton predominated by weight and contained more than 40 per cent by weight of cotton and 50 per cent or more by weight of non-cellulosic fibres or yarn or both. In the case of fabrics such as embroidery in piece, fabrics im-pregnated and coated, these percentages referred to the base fabrics.
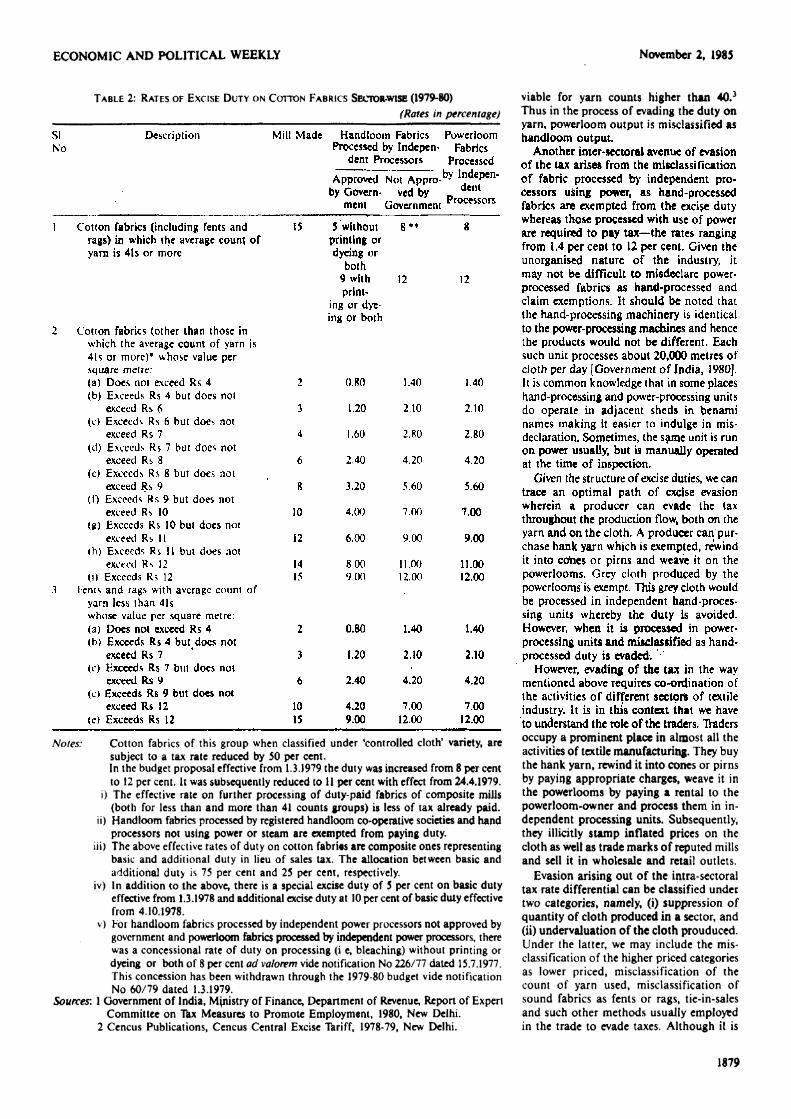
A brief description of the rate structure prevailing in 1978-79 in the mill, the powerloom and the handloom sectors is given in Table 2. Three important features of the tax structure are relevant for our pur-poses and hence, may be noted. First, discri-minatory rates of taxation of the fabrics pro-duced in different sectors were imposed. Se-cond, differentiation in the rate structure was made to depend upon both the yarn counts used in the manufacture of the fabric as well as the price of the fabric. Third, differen-tial rates of tax were levied on the fabrics termed as 'sound' 'fents' and 'rags'. These features have important implications for the method and quantum of evasion and hence call for further elaboration.
. POSSIBLE AVENUES OF EVASION
The structure of excise on cotton textile fabrics and the production pattern of the commodity would indicate the following major methods of evasion. Evasion through (i) inter-sectoral misclassification of the out-put, and (ii) intra-sectoral misclassification which also involves understatement of pro-duction and undervaluation.
The existence of inter-sectoral rate dif-ferences could provide avenues of evasion through inter-sectoral misclassification of output. It may be difficult to misclassify the output of the mill sector, for, it being an organised sector, evasion by this means has a higher probability of being detected. On the other hand, misclassification of power-loom output as handloom output can be done with less fear of detection, for, it is not possible to monitor production flows in units in the decentralised sector. Even the estimates of their production figures are based on yarn deliveries, hank yarn being taken to be entirely used in the handlooms. Given that hank yarn is exempt from excise duty, evasion of the tax by rewinding hank yarn into cones or pirns and using them in powerlooms would be beneficial so long as the duty evaded exceeds the cost of rewin-ding. As higher rates of duty are levied on higher counts of yarn, this is specifically
1878
ECONOMIC AND POLITICAL WEEKLY November 2, 1985
TABLE 2 : RATES OF EXCISE DUTY ON COTTON FABRICS SEctor-wise ( 1 9 7 9 - 8 0 )
(Rates in percentage)
Notes: Cotton fabrics of this group when classified under 'controlled cloth* variety, are subject to a tax rate reduced by 50 per cent. In the budget proposal effective from 1.3.1979 the duty was increased from 8 per cent to 12 per cent. It was subsequently reduced to 11 per cent with effect from 24.4.1979.
i) The effective rate on further processing of duty-paid fabrics of composite mills (both for less than and more than 41 counts groups) is less of tax already paid.
ii) Handloom fabrics processed by registered handloom co-operative societies and hand processors not using power or steam are exempted from paying duty.
in) The above effective rates of duty on cotton fabries are composite ones representing basic and additional duty in lieu of sales tax. The allocation between basic and additional duty is 75 per cent and 25 per cent, respectively.
iv) In addition to the above, there is a special excise duty of 5 per cent on basic duty effective from 1.3.1978 and additional excise duty at 10 per cent of basic duty effective from 4.10.1978.
v) For handloom fabrics processed by independent power processors not approved by government and powerloom fabrics processed by independent power processors, there was a concessional rate of duty on processing (i e, bleaching) without printing or dyeing or both of 8 per cent ad valorem vide notification No 226/77 dated 15,7.1977. This concession has been withdrawn through the 1979-80 budget vide notification No 60/79 dated 1.3.1979.
Sources: 1 Government of India, Ministry of Finance, Department of Revenue, Report of Expert Committee on "Tax Measures to Promote Employment, 1980, New Delhi.
2 Cencus Publications, Cencus Central Excise Tariff, 1978-79, New Delhi.
viable for yarn counts higher than 40.3
Thus in the process of evading the duty on yarn, powerloom output is misclassified as handloom output.
Another inter-sectoral avenue of evasion of the tax arises from the misclassification of fabric processed by independent pro-cessors using power, as hand-processed fabrics are exempted from the excise duty whereas those processed with use of power are required to pay tax—the rates ranging from 1.4 per cent to 12 per cent. Given the unorganised nature of the industry, it may not be difficult to misdeclare power-processed fabrics as hand-processed and claim exemptions. It should be noted that the hand-processing machinery is identical to the power-processing machines and hence the products would not be different. Each such unit processes about 20,000 metres of cloth per day [Government of India, 1980], It is common knowledge that in some places hand-processing and power-processing units do operate in adjacent sheds in benami names making it easier to indulge in mis-declaration, Sometimes, the same unit is run on power usually, but is manually operated at the time of inspection.
Given the structure of excise duties, we can trace an optimal path of excise evasion wherein a producer can evade the tax throughout the production flow, both on the yarn and on the cloth. A producer can pur-chase hank yarn which is exempted, rewind it into comes or pirns and weave it on the powerlooms. Grey cloth produced by the powerlooms is exempt. This grey cloth would be processed in independent hand-proces-sing units whereby the duty is avoided. However, when it is processed in power-processing units and misclassified as hand-processed duty is evaded;
However, evading of the tax in the way mentioned above requires co-ordination of the activities of different sectors of textile industry. It is in this context that we have to understand the role of the traders. Traders occupy a prominent place in almost all the activities of textile manufacturing. They buy the hank yarn, rewind it into cones or pirns by paying appropriate charges, weave it in the powerlooms by paying a rental to the powerloom-owner and process them in in-dependent processing units. Subsequently, they illicitly stamp inflated prices on the cloth as well as trade marks of reputed mills and sell it in wholesale and retail outlets.
Evasion arising out of the intra-sectoral tax rate differential can be classified under two categories, namely, (i) suppression of quantity of cloth produced in a sector, and (ii) undervaluation of the cloth prouduced. Under the latter, we may include the mis-classification of the higher priced categories as lower priced, misclassification of the count of yarn used, misclassification of sound fabrics as fents or rags, tie-in-sales and such other methods usually employed in the trade to evade taxes. Although it is
1879
November 2. ECONOMIC AND POLITICAL WEEKLY

A N D P O L I T I C A L W E E K L Y November 2, 1985
possible, it may hot be very probable that the mill sector evades taxes by suppressing the quantity of output. The probability of getting detected by suppressing output in the organised sector would be high and therefore employment 6f this method to evade taxes may not be frequent. On the contrary, given the graded nature of the tax structure, the evasion of the tax through undervaluation could be sizeable.
EVASION THROUGH INTER-SECTORAL MlSCLASSIFICATION
Evasion of Duty on Yarn We have already mentioned that the ex-
emption of hank yarn from excise duty leads
TABLE 3; Mis-classified HANDLOOM Cloth, 1978-79 metres)
TO evasion or the yarn duty through illicit rewinding of hank yarn into cones or pirns and weaving them on powerlootm. As the rate of duty is higher on the higher counts of yarn, tax evasion on such yarn becomes specially tempting. Subsequently, as the of-ficial estimates of handloom and powerloom production depend of the yarn deliveries in hank and non-hank form, respectively, due to the diversion the official estimate of handloom production is overstated and powerloom production estimates are under stated.
A Planning Commission Study fAnand, 1979] places the misdassification at 500 million metres for the year 1975. Jain (1983) similarly estimates that 840 million metres of powerloom cloth would have been mis-classified us handloom cloth in 1981. The Mill Owners' Association places the mis-classified quantity of cloth at 600 million metres in 1981. It thus seems thaf the diver-sion of hank yarn and the consequent eva-sion of yarn duty arising therefrom is considerable.
We have attempted to estimate the amount of yarn diversion and cloth misdassification by independently estimating the product ion figures. An estimate of production is arrived
at by adding the consumption of handloom cloth to the exports of such cloth; Estimates of household consumption of handlooms are available in "Consumer Purchase of Tex-tiles", an annual publication of the Textile Committee Market Research Wing, Ministry of Commerce. We have adjusted calendar year data given in this publication propor-tionately to correspond to the fiscal year 1978-79. Adjustments had to be made in the reported export figures also, for, although data on the export of handloom cloth are available in both quantities and values, data on t he export of handloom manufactures are available only in value terms Assuming the price per metre of the latter, we have esti-mated the quantity of handloom manu-factures.
The estimated misclassification -of yarn is presented in Table 3. It is seen that total household consumption of handloom cot-ton cloth in 1978-79 'amounted to 962.59 million metres "Consumer Purchases of Textiles" [Government of India, 1979] gives us the estimated non-household consump-tion of cotton fabrics, but the handloom component is not separatdy available. However, the Planning Commission's Study [Anand, 1979] estimates non-household con-
T A B l e 4: Estimate of YARN Diversion anD EVASION of Duty (1978 79)
Notes: 1 We have assumed that the yarn upto 20 counts will not be diverted and hence our estimates and the estimates based on yarn deliveries has been distributed among the different count groups in proportion to the estimated production of cloth of different counts derived from yarn delivery figures.
2 The figures in column (2) which represent the hank yarn delivery according to fiscal year 1978-79 adjusted from the calendar year data given in the Indian Cotton Mills' Federation, Handbook of Statistics on Cotton lextile on Cotton Industry, Bombay.
3 The information on Cloth Produceablc per kg of yarn given in column (3) is taken from Mazumdar (1984).
TAble 5; 1: EVASION of Exelf Duty on Misclassified CLOth
Notes On the basis of a survey, we found that the average width of the doth is 1.0498 metres, Source: For Col (3): Government of India, Ministry of Finance, Department of Revenue, Report of the Expert Committee on Tax Measures
to Promote Employment (1980), p 83.
1881
November 2, 1985 ECONOMIC AND POLITICAL WEEKLY
sumption of handloom for the year 1975 at 300 million metres which in that year formed 63.5 per cent of total non-household con-sumption (institutional purchases). Assum-ing the proportion to remain the same in 1978-79, we have estimated the non-house-hold consumption of handloom in the year at 520.19 million metres. The estimated total consumption of handloom in 1978-79, thus, is placed at 1482.78 million metres.
During the year, the export of handloom cotton cloth was 84.6 million metres having a value of Rs 628 million. Besides this, handloom manufactures worth Rs 289.1 million were also exported. If the price per metre of cloth of the former (Rs 7.42) is assumed, the exported quantity of cotton
manufactures would amount to 38.95 million metres.
By adding the estimated consumption to estimated exports, we get an estimate of the production of cloth which comes to 1606.33 million metres for the year 1978-79. Estima-tion made on the basis of hank yarn deli-veries, however, places handloom production at 2119.23 million metres. Thus, 512.91 million metres of powerloom cloth seem to have been misclassified as handloom cloth.
To arrive at the amount of duty loss due to yarn diversion, we have to estimate the diversion of cloth and yarn of various counts. However, certain assumptions are called for as the data in the required dis-aggregation are not available. We have
assumed that there would be no misclassifi-cation of cloth through the diversion of yarn for cloth upto 20 counts because for such cloth the cost of rewinding the yarn would far exceed the benefit from excise evasion. Further, it is assumed that the misclassifica-tion of cloth of the remaining count groups would be proportional to the estimated pro-duction of cloth (derived on the basis of yarn deliveries).4 By applying an appropriate cloth-yarn conversion ratio to the mis-classified cloth production estimates we have obtained an estimate of yarn diversion in dif-ferent count groups (Table 4). By applying appropriate rates of duty on the diverted yarn, the amount of duty evaded can easily be derived. As seen in the Tfeble, the duty thus evaded amounts to Rs 6.92 crore which forms about 8 per cent of the actual collec-tions. Collection of this amount would have resulted in the total excise collection from yarn of Rs 94.79 crore and evasion on this account as a proportion of the total works out to 7.3 per cent.
Evasion of Duty on Cloth As stated earlier, the diversion of hank
yarn to evade yarn duty also results in 'the evasion of duty on cloth. We have already estimated above that about 513 million metres of powerloom cloth were misclassi-fied as handloom cloth in 1978-79. There is no reason to expect that excise duty would have been paid on this cloth.
Basically, evasiog of the cloth duty can be included in a more general form of evasion—misclassifying power-processed fabrics manufactured in powerlooms as hand-processed. This, as we have already mentioned earlier, leads to enormous mis-classification of power-processed fabrics as hand-processed and hence evasion of duty.
We do not have any estimate of the mis-classfication of powerloom cloth processed by processors using power or steam as
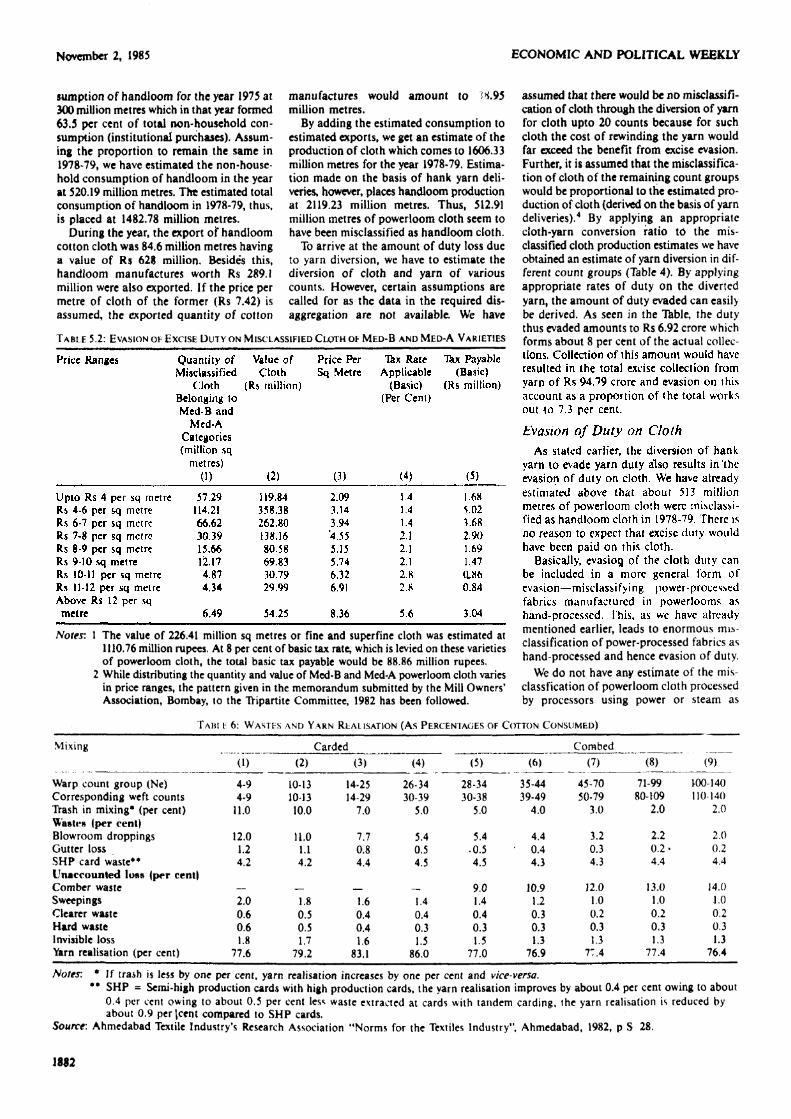
T A B L E 5 . 2 : EVASION O F E X C I S E D U T Y ON M I S C L A S S I F I E D C L O T H OF M E D - B AND M E D - A V A R I E T I E S
Notes: 1 The value of 226.41 million sq metres or fine and superfine cloth was estimated at 1110.76 million rupees. At 8 per cent of basic tax rate, which is levied on these varieties of powerloom cloth, the total basic tax payable would be 88.86 million rupees.
2 While distributing the quantity and value of Med-B and Med-A powerloom cloth varies in price ranges, the pattern given in the memorandum submitted by the Mill Owners' Association, Bombay, to the TYipartite Committee, 1982 has been followed.
T A B l e : 6 : W A S T E S AND Y A R N REALISATION ( A S P E R C E N T A G E S OF C O T T O N C O N S U M E D )
Notes: * If trash is less by one per cent, yarn realisation increases by one per cent and vice-versa. ** SHP = Semi-high production cards with high production cards, the yarn realisation improves by about 0.4 per cent owing to about
0.4 per cent owing to about 0.5 per cent less waste extracted at cards with tandem carding, the yarn realisation is reduced by about 0.9 per (cent compared to SHP cards.
Source: Ahmedabad Textile Industry's Research Association "Norms for the Textiles Industry", Ahmedabad, 1982, p S 28.
1882
ECONOMIC AND POLITICAL WEEKLY November 2, 1985
having been hand-processed. Therefore, although we believe that the tax evasion under this category would be considerable, we are unable to estimate it.
In any case, there is no reason to believe that on the misclassified powerloom cloth, duty would have been paid. Further, given that these are likely to be passed on to con-sumers as mill fabrics, one may presume that they would have been processed by power but misclassified as hand-processed. Duty loss on account of this has been estimated by using the information on prices as given in the Dandekar Committee and price range-
T A B L E 7 : E X P E C T E D C O N S U M P T I O N O F C O T T O N
wise distribution as given by the Mill Owners' Association. The computations detailed in Tables 5,1 and 5.2 show that ag-gregate loss of duty on account of mis-classification of the cloth amounts to Rs 12.66 crore. These form 8.71 per cent of the actual collection of excise duty on cot-ton textile fabrics.
Basically, evasion of excise duty arising from the intra-sectoral tax differences is con-fined to the composite mill sector. As men-tioned earlier, we can identify two broad types of evasion under this category, namely, (i) evasion through suppression or under-
JN S P I N N I N G A N D C O M P O S I T E M I L L S ( 1 9 7 8 - 7 9 )
statement of the quantity of cloth pro-duced; and
(ii) evasion through undervaluation of fabrics; under the latter, we may include, besides direct undervaluation, methods such as misclassification of count groups, price groups and sounds into fents and rags, tie-in-sales and such other methods usually employed to understate the value of the cloth.
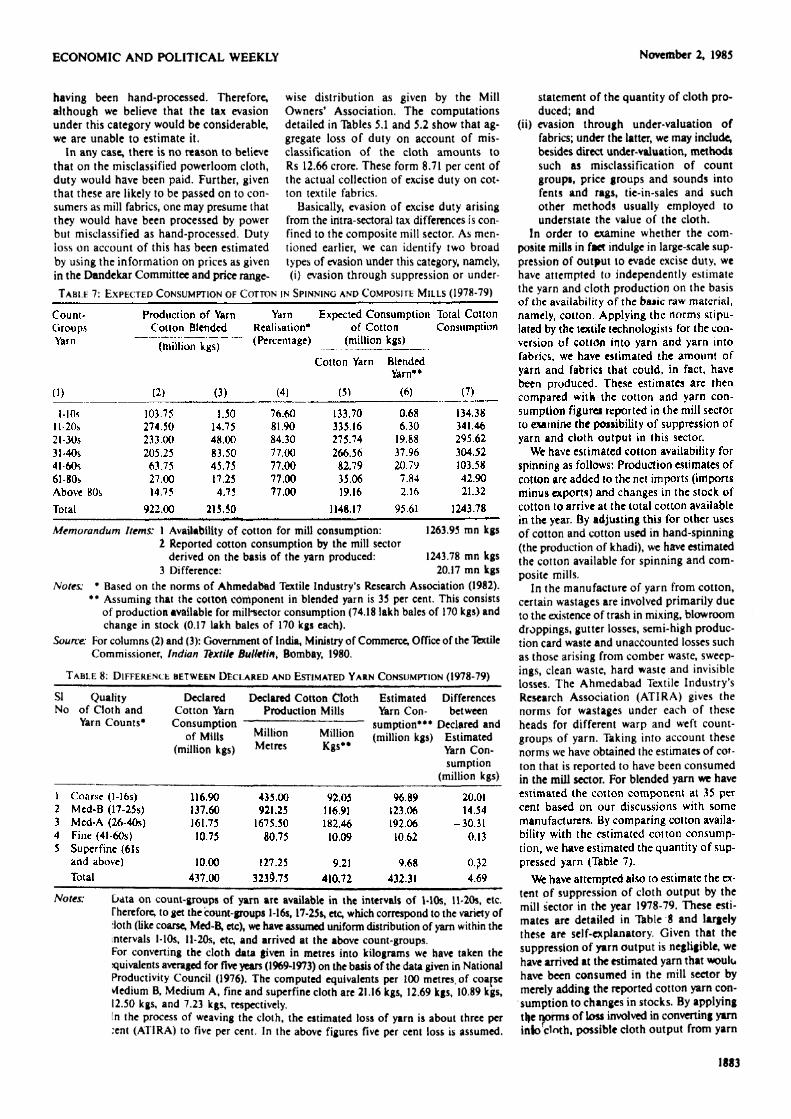
In order to examine whether the com-posite mills in fact indulge in large-scale sup-pression of output to evade excise duty, we have attempted to independently estimate the yarn and cloth production on the basis of the availability of the basic raw material, namely, cotton. Applying the norms stipu-lated by the textile technologists for the con-version of cotton into yarn and yarn into fabrics, we have estimated the amount of yarn and fabrics that could, in fact, have been produced. These estimates are then compared with the cotton and yarn con-sumption figures reported in the mill sector to examine the possibility of suppression of yarn and cloth output in this sector.
We have estimated cotton availability for spinning as follows: Production estimates of cotton are added to the net imports (imports minus exports) and changes in the stock of cotton to arrive at the total cotton available in the year. By adjusting this for other uses of cotton and cotton used in hand-spinning (the production of khadi), we have estimated the cotton available for spinning and com-posite mills.
In the manufacture of yarn from cotton, certain wastages are involved primarily due to the existence of trash in mixing, blowroom droppings, gutter losses, semi-high produc-tion card waste and unaccounted losses such as those arising from comber waste, sweep-ings, clean waste, hard waste and invisible losses. The Ahmedabad Textile Industry's Research Association (ATIRA) gives the norms for wastages under each of these heads for different warp and weft count-groups of yarn. Taking into account these norms we have obtained the estimates of cot-ton that is reported to have been consumed in the mill sector. For blended yarn we have estimated the cotton component at 35 per cent based on our discussions with some manufacturers. By comparing cotton availa-bility with the estimated cotton consump-tion, we have estimated the quantity of sup-pressed yarn (Table 7).
We have attempted also to estimate the ex-tent of suppression of cloth output by the mill sector in the year 1978-79. These esti-mates are detailed in Table 8 and largely these are self-explanatory. Given that the suppression of yarn output is negligible, we have arrived at the estimated yarn that would have been consumed in the mill sector by merely adding the reported cotton yarn con-sumption to changes in stocks. By applying the norms of loss involved in converting yarn into cloth , possible cloth output from yarn
Memorandum Items: I Availability of cotton for mill consumption: 1263.95 mn kgs 1 Reported cotton consumption by the mill sector
derived on the basis of the yarn produced: 1243.78 mn kgs 3 Difference: 20.17 mn kgs
Notes: * Based on the norms of Ahmedabad Textile Industry's Research Association (1982). ** Assuming that the cotton component in blended yarn is 35 per cent. This consists
of production available for milteector consumption (74.18 lakh bales of 170 kgs) and change in stock (0.17 lakh bales of 170 kgs each).
Source' For columns (2) and (3): Government of India, Ministry of Commerce, Office of the Ttxtile Commissioner, Indian Textile Bulletin, Bombay, 1980.
T A B L E 8: D I F F E R E N C E BETWEEN D E C L A R E D AND ESTIMATED Y A R N C O N S U M P T I O N (1978-79)
SI Quality Declared Declared Cotton Cloth Estimated Differences No of Cloth and Cotton Yarn Production Mills Yarn Con- between
Yarn Counts* Consumption — - sumption*** Declared and of Mills M l l l l 0 n M l U i o n (million kgs) Estimated
(million kgs) M e t r c s Yarn Con-sumption
(million kgs)
Notes: Data on count-groups of yarn are available in the intervals of MOs, ll*20s, etc. Therefore, to get the count-groups l-16s, 17-25S, etc, which correspond to the variety of :loth (like coarse, Med-B, etc), we have assumed uniform distribution of yarn within the intervals MOs, ll-20s, etc, and arrived at the above count-groups. For converting the cloth data given in metres into kilograms we have taken the jquivalents averaged for five years (1969-1973) on the basis of the data given in National Productivity Council (1976). The computed equivalents per 100 metres, of coarse Medium B, Medium A, fine and superfine cloth are 21.16 kgs, 12.69 kgs, 10.89 kgs, 12.50 kgs, and 7.23 kgs, respectively. [n the process of weaving the cloth, the estimated loss of yarn is about three per :ent (ATIRA) to five per cent. In the above figures five per cent loss is assumed.
1883

1884
ECONOMIC AND POLITICAL WEEKLY November 2, 1985
availability is estimated. According to the AT1RA norms, the losses
involved in weaving yarn at winding, warp-ing, sizing and other stages should aggregate about 3 per cent. This, however, is the minimum wastage involved and, in actuality, the wastage could indeed be higher. On the basis of our discussion with textile techno-logists we have taken the wastage at 5 per cent and estimated the expected consump-tion of yarn. The difference between the yarn that would have been consumed and the ac-tual consumption indicates the extent of understatement of cloth production.
Our estimates as may be seen from the Table do not indicate significant understate-ment of cloth output. The underestimation seems to be of the order of only LOO per cent
of the cloth production. This again cannot definitively be attributed to tax evasion as our assumption regarding the cotton con-tent in blended fabrics and the wastage norms may be subject to some margins of error.
Undervaluation and Evasion of Duty Undervaluation for evasion of the excise
duty can be done in many ways. Given that the tax rates levied on the fabrics are graded in terms of counts of fabrics and their prices, undervaluation can easily be done by both misclassifying the fabric count and the price of the fabric. Other methods of undervalua-tion brought to our notice include tie-in-sales/ and misdassification of 'sound' fabrics as Tents' and 'rags'. Again, there can also be understatement of the manufactur-ing sale price/' As it may not be possible to monitor the distributive channels as much as the production flows, the probability of detecting evasion would be lower when these methods are employed and, therefore, we have hypothesised that, under this method,
the evasion could indeed be significant. To estimate the extent of evasion, we have
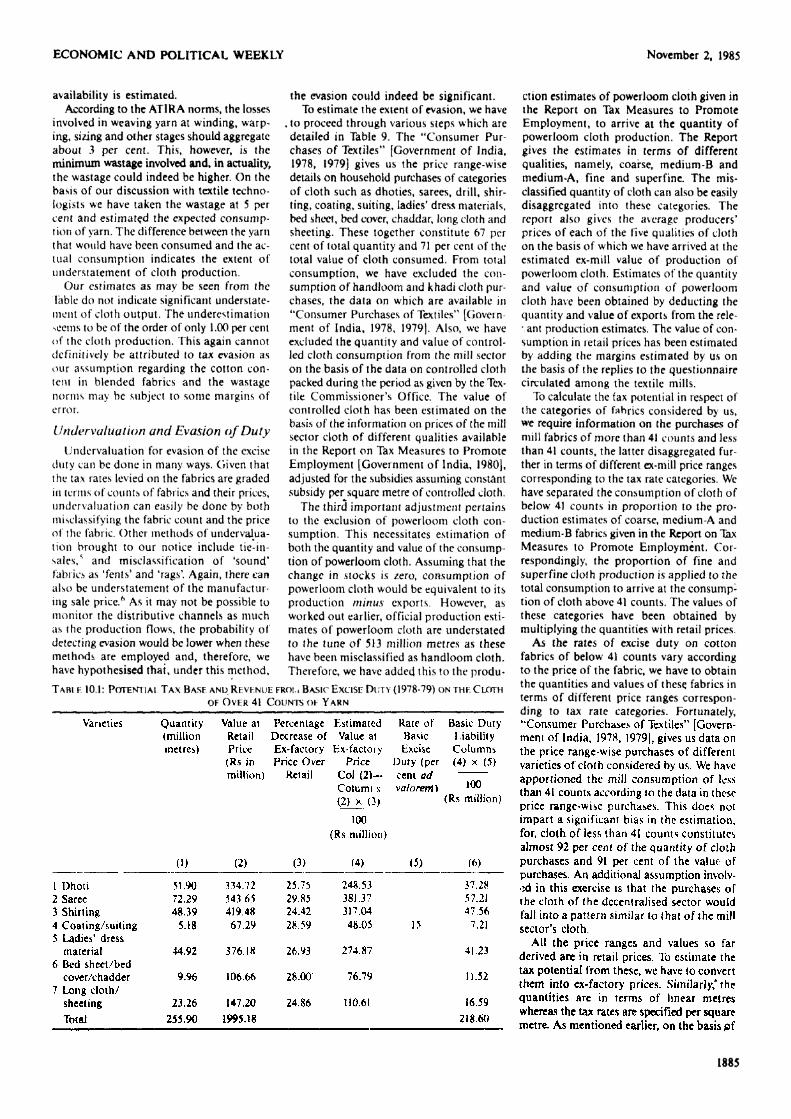
, to proceed through various steps which are detailed in Table 9. The "Consumer Pur-chases of Textiles" [Government of India, 1978, 1979] gives us the price range-wise details on household purchases of categories of cloth such as dhoties, sarees, drill, shir-ting, coating, suiting, ladies' dress materials, bed sheet, bed cover, chaddar, long cloth and sheeting. These together constitute 67 per cent of total quantity and 71 per cent of the total value of cloth consumed. From total consumption, we have excluded the con-sumption of handloom and khadi cloth pur-chases, the data on which are available in "Consumer Purchases of Textiles" [Govern ment of India, 1978, 1979). Also, we have excluded the quantity and value of control-led cloth consumption from the mill sector on the basis of the data on controlled cloth packed during the period as given by the Tex-tile Commissioner's Office, The value of controlled doth has been estimated on the basis of the information on prices of the mill sector cloth of different qualities available in the Report on "fax Measures to Promote Employment [Government of India, 1980], adjusted for the subsidies assuming constant subsidy per square metre of controlled cloth.
The third important adjustment pertains to the exclusion of powerloom cloth con-sumption. This necessitates estimation of both the quantity and value of the consump-tion of powerloom doth. Assuming that the change in stocks is zero, consumption of powerloom cloth would be equivalent to its production minus exports. However, as worked out earlier, official production esti-mates of powerloom cloth are understated to the tune of 513 million metres as these have been misclassified as handloom cloth. Therefore, we have added this to the produ-
ction estimates of powerloom cloth given in the Report on "fax Measures to Promote Employment, to arrive at the quantity of powerloom doth production. The Report gives the estimates in terms of different qualities, namely, coarse, medium-B and medium-A, fine and superfine. The mis-classified quantity of cloth can also be easily disaggregated into these categories. The report also gives the average producers' prices of each of the five qualities of cloth on the basis of which we have arrived at the estimated ex-mill value of production of powerloom cloth. Estimates of the quantity and value of consumption of powerloom cloth have been obtained by deducting the quantity and value of exports from the rele-vant production estimates. The value of con-sumption in retail prices has been estimated by adding the margins estimated by us on the basis of the replies to the questionnaire circulated among the textile mills.
To calculate the fax potential in respect of the categories of fabrics considered by us, we require information on the purchases of mill fabrics of more than 41 counts and less than 41 counts, the latter disaggregated fur-ther in terms of different ex-mill price ranges corresponding to the tax rate categories. We have separated the consumption of doth of below 41 counts in proportion to the pro-duction estimates of coarse, medium-A and medium-B fabrics given in the Report on Tax Measures to Promote Employment. Cor-respondingly, the proportion of fine and superfine cloth production is applied to the total consumption to arrive at the consump1
tion of cloth above 41 counts. The values of these categories have been obtained by multiplying the quantities with retail prices.
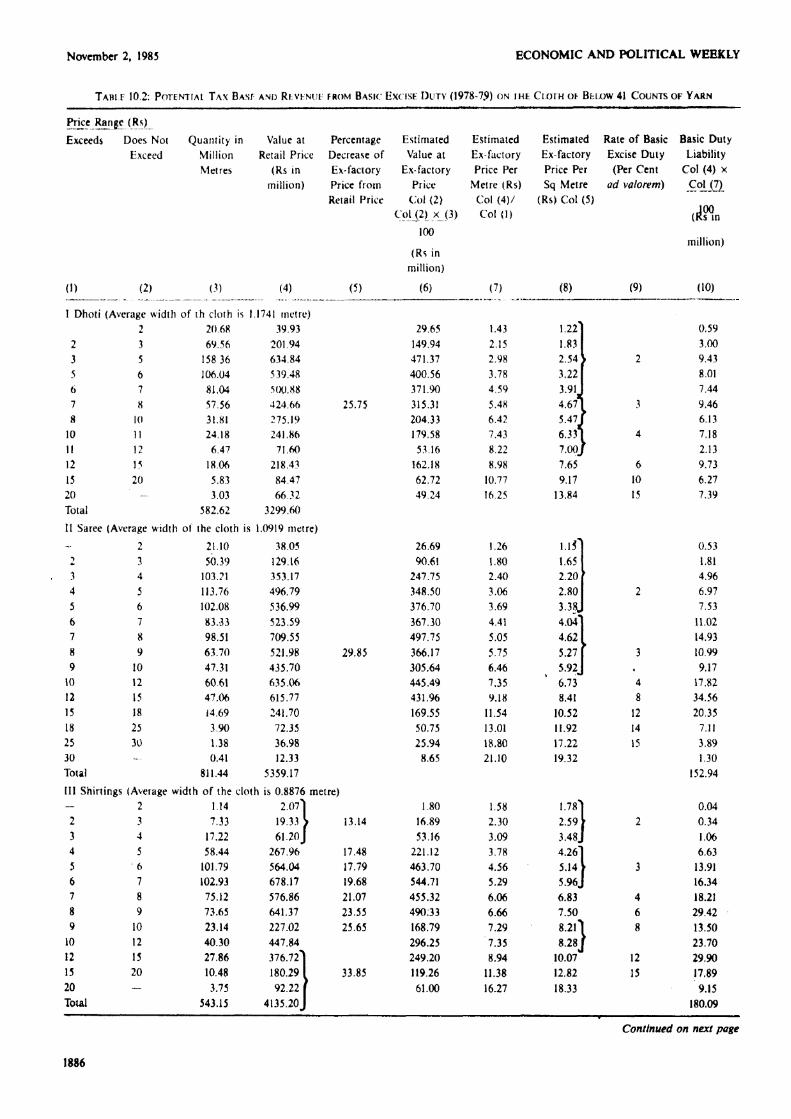
As the rates of excise duty on cotton fabrics of below 41 counts vary according to the price of the fabric, we have to obtain the quantities and values of these fabrics in terms of different price ranges correspon-ding to tax rate categories. Fortunately, "Consumer Purchases of Textiles" [Govern-ment of India, 1978, 1979], gives us data on the price range-wise purchases of different varieties of cloth considered by us. We have apportioned the mill consumption of less than 41 counts according to the data in these price range-wise purchases. This does not impart a significant bias in the estimation, for, cloth of less than 41 counts constitutes almost 92 per cent of the quantity of cloth purchases and 91 per cent of the value of purchases. An additional assumption involv-ed in this exercise is that the purchases of the cloth of the decentralised sector would fall into a pattern similar to that of the mill sector's cloth.
All the price ranges and values so far derived are in retail prices. To estimate the tax potential from these, we have to convert them into ex-factory prices. Similarly',the quantities are in terms of linear metres whereas the tax rates are specified per square metre. As mentioned earlier, on the basis of
1885
T A B L E 10.1: POTENTIAL T A X BASE AND REVFNUE FROM BASIC EXCISE DUTY ( 1 9 7 8 - 7 9 ) ON THE CLOTH
OF O V E R 41 C O U N T S O F Y A R N
November 2, 1985 ECONOMIC AND POLITICAL WEEKLY
T A B l e 10.2: POTENTIAL T A X BAST AND Revenue FROM BASic: EXCISE D U T Y (1978-79) ON the C L O T H OF Below 4 1 C O U N T S O F Y A R N
Continued on next page
1886
ECONOMIC AND POLITICAL WEEKLY November 2, 1985
T A B L E 1 0 . 2 : POTENTIAL T A X BASE AND R E V E N U E FROM BASIC EXCISE D U T Y ( 1 9 7 8 - 7 9 ) ON THE CLOTH OF BELOW 41 C O U N T S OF Y A R N ( C O N H N U E D )
1887
November 2, 1985 ECONOMIC AND POLITICAL WEEKLY
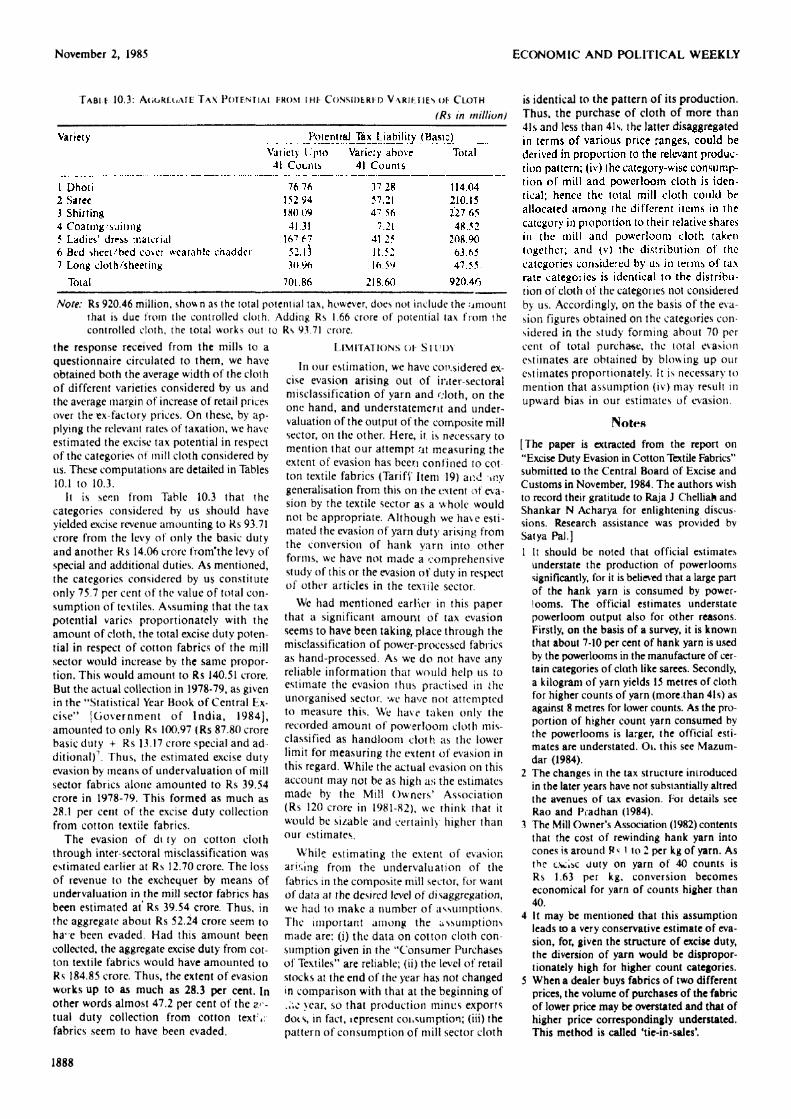
TABLE 10 .3 : AGGREGATE T A X POTENTIAL FROM the CONSIDERED VARIETIES OF CLOTH
(Rs in million)
Note: Rs 920.46 million, shown as the total potential tax, however, does not include the amount that is due from the controlled cloth. Adding Rs 1.66 crore of potential tax from the controlled cloth, the total works out to Rs 9171 crore.
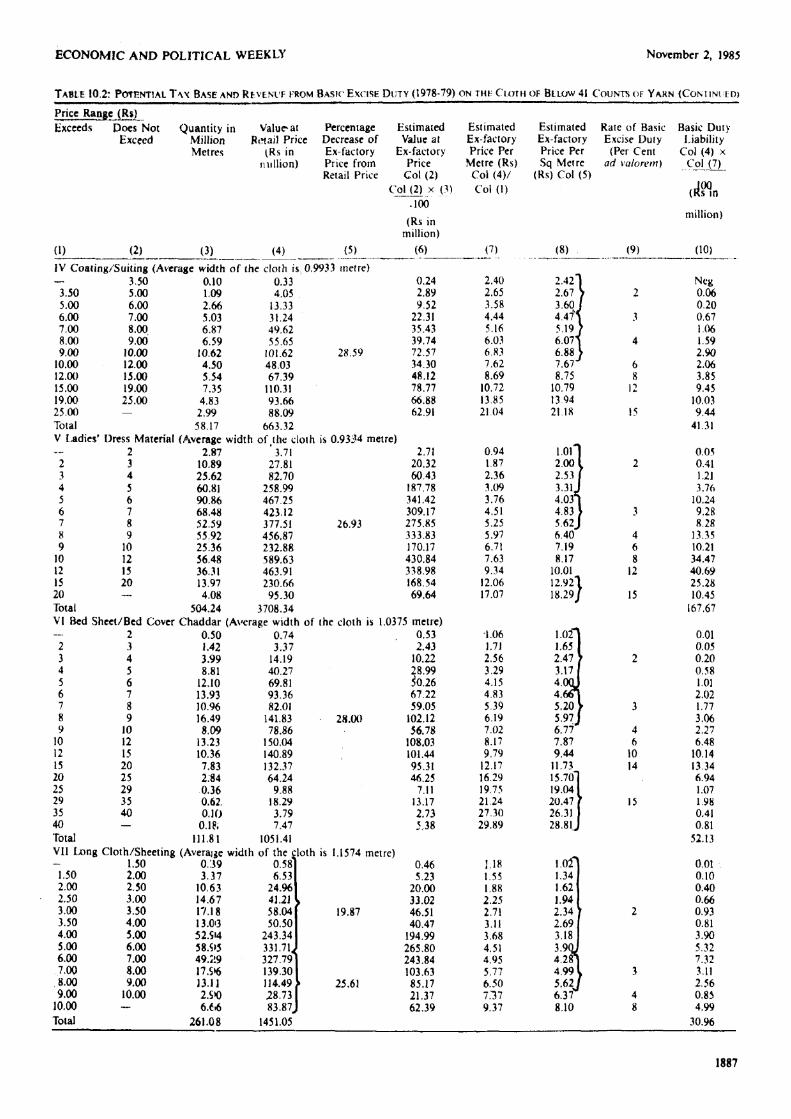
the response received from the mills to a questionnaire circulated to them, we have obtained both the average width of the cloth of different varieties considered by us and the average margin of increase of retail prices over the ex-factory prices. On these, by ap-plying the relevant rates of taxation, we have estimated the excise tax potential in respect of the categories of mill cloth considered by us. These computations arc detailed in Tables 10.1 to 10.3.
It is seen from Table 10,3 that the categories considered by us should have yielded excise revenue amounting to Rs 93.71 crore from the levy of only the basic duty and another Rs 14.06 crore from'the levy of special and additional duties. As mentioned, the categories considered by us constitute only 75.7 per cent of the value of total con-sumption of textiles. Assuming that the tax potential varies proportionately with the amount of cloth, the total excise duty poten-tial in respect of cotton fabrics of the mill sector would increase by the same propor-tion. This would amount to Rs 140.51 crore. But the actual collection in 1978-79, as given in the "Statistical Year Book of Central Ex-cise'* [Government of India, 1984], amounted to only Rs 100.97 (Rs 87.80 crore basic duty + Rs 13.17 crore special and ad ditional)7. Thus, the estimated excise duty evasion by means of undervaluation of mill sector fabrics alone amounted to Rs 39.54 crore in 1978-79. This formed as much as 28.1 per cent of the excise duty collection from cotton textile fabrics.
The evasion of di ty on cotton cloth through inter-sectoral misdassification was estimated earlier at Rs 12.70 crore. The loss of revenue to the exchequer by means of undervaluation in the mill sector fabrics has been estimated at' Rs 39.54 crore. Thus, in the aggregate about Rs 52.24 crore seem to ha- e been evaded. Had this amount been collected, the aggregate excise duty from cot-ton textile fabrics would have amounted to Rs 184.85 crore. Thus, the extent of evasion works up to as much as 28.3 per cent. In other words almost 47.2 per cent of the ac-tual duty collection from cotton text fabrics seem to have been evaded.
L I M I T A T I O N S O F S T U D Y
In our estimation, we have considered ex-cise evasion arising out of inter-sectoral misdassification of yarn and cloth, on the one hand, and understatement and under-valuation of the output of the composite mill sector, on the other. Here, it is necessary to mention that our attempt at measuring the extent of evasion has been confined to cot ton textile fabrics (TarifV Item 19) and »nv generalisation from this on the extent of eva-sion by the textile sector as a whole would not be appropriate. Although we have esti-mated the evasion of yarn duty arising from the conversion of hank yarn into other forms, we have not made a comprehensive study of this or the evasion of duty in respect of other articles in the textile sector.
We had mentioned earlier in this paper that a significant amount of tax evasion seems to have been taking, place through the misdassification of power-processed fabrics as hand-processed. As we do not have any reliable information that would help us to estimate the evasion thus practised in ihe unorganised sector, we have not attempted to measure this. We have taken only the recorded amount of powerloom cloth mis-classified as handloom cloth as the lower limit for measuring the extent of evasion in this regard. While the actual evasion on this account may not be as high as the estimates made by the Mill Owners' Association (Rs 120 crore in 1981-82), we think that it would be si/able and certainly higher than our estimates.
While estimating the extent of evasion arising from the undervaluation of the fabrics in the composite mill sector, for want of data at the desired level of di saggregation, we had to make a number of assumptions. The important among the assumptions made are; (i) the data on cotton cloth con-sumption given in the ''Consumer Purchases of Textiles" are reliable; (ii) the level of retail stocks at the end of the year has not changed in comparison with that at the beginning of
year, so that production minus exports dots, in fact, iepresent consumption; (iii) the pattern of consumption of mill sector cloth
is identical to the pattern of its production. Thus, the purchase of cloth of more than 41s and less than 41s, the latter disaggregated in terms of various price ranges, could be derived in proportion to the relevant produc-tion pattern; (iv) the category-wise consump-tion of mill and powerloom cloth is iden-tical; hence the total mill cloth could be allocated among the different items in the category in proportion to their relative shares in the mill and powerloom cloth taken together; and (v) the distribution of the categories considered by us in terms of tax rate categories is identical to the distribu-tion of cloth of the categories not considered by us. Accordingly, on the basis of the eva-sion figures obtained on the categories con-sidered in the study forming about 70 per cent of total purchase, the total evasion estimates are obtained by blowing up our estimates proportionately. It is necessary to mention that assumption (iv) may result in upward bias in our estimates of evasion.
Notes [The paper is extracted from the report on "Excise Duty Evasion in Cotton Textile Fabrics" submitted to the Central Board of Excise and Customs in November, 1984. The authors wish to record their gratitude to Raja J Chelliah and Shankar N Acharya for enlightening discus-sions. Research assistance was provided bv Satya Pal.] 1 It should be noted that official estimates
understate the production of powerlooms significantly, for it is believed that a large pan of the hank yarn is consumed by power-looms. The official estimates understate powerloom output also for other reasons. Firstly, on the basis of a survey, it is known that about 7-10 per cent of hank yarn is used by the powerlooms in the manufacture of cer-tain categories of cloth like sarees. Secondly, a kilogram of yarn yields 15 metres of cloth for higher counts of yarn (more-than 41s) as against 8 metres for lower counts. As the pro portion of higher count yarn consumed by the powerlooms is larger, the official esti-mates are understated. Oi. this see Mazum-dar (1984).
2 The changes in the tax structure introduced in the later years have not substantially altred the avenues of tax evasion. Foi details see Rao and Pradhan (1984).
3 The Mill Owner's Association (1982) contents that the cost of rewinding hank yarn into cones is around I to 2 per kg of yarn. As the excise duty on yarn of 40 counts is Rs 1,63 per kg, conversion becomes economical for yarn of counts higher than 40.
4 It may be mentioned that this assumption leads to a very conservative estimate of eva-sion, for, given the structure of excise duty, the diversion of yarn would be dispropor-tionately high for higher count categories.
5 When a dealer buys fabrics of two different prices, the volume of purchases of the fabric of lower price may be overstated and that of higher price correspondingly understated. This method is called 'tie-in-sales'.
1888
6 It is very difficult to draw a distinction bet-ween evasion and avoidance in such cases. It is well known that the invoice price of the cloth is generally almost 15 to 25 per cent lower than the stamped price. While the retailer recovers the sale margins at various stages of the transaction added to the stamped price including the excise duty thereon from the consumer, the government receives a much lower amount of excise revenue.
7 Again, it should be noted that taking actual collections rather than the duty liability from declared production makes an implicit assumption that the amount oT arrears in the year has not changed from the previous year
R e f e r e n c e s
Anand, Ritu (1979): "Choice of Technology in textile Industry", Government of India, Planning Commission, Project Appraisal Division, 1978-79
Ahmedabad Textile Industry's Research Asso-ciation (1982); "Norms fcr the Textile In-dustry", ATIRA, Ahmedabad.
Desai, Ashok V (1981): "Technology, and
Market under Government Regulation" (mimeo), National Council of Applied Economic Research, New Delhi,
Government of India (1976); The Report of the Expert Group on Textiles, Collectorate of Excise, Bombay.
— (1978): Market Research Wing, Textile Com-mittee, Ministry of Commerce, "Consumer Purchases of Textiles", Bombay.
— (1978): Market Research Wing, Textile Com-mittee, Ministry of Commerce, Consumer Purchases and Price Trends of Textiles, Monthly Bulletin, Nos 88-99, Bombay.
— (1979): Market Research Wing, Textile Com-mittee, Ministry of Commerce, "Consumer Purchases of Textiles", Bombay.
— (1979): Market Research Wing, Textile Com-mittee, Ministry of Commerce, Consumer Purchases and Price Thends of Textiles, Monthly Bulletin, Nos 88-99, Bombay. (1980): Ministry of Commerce, Report of ihe Working Group on Hand-Printing In dustry and Hand-Processing Industry, New Deihi
— (1980): Ministry of Finance, Department of Revenue, Report of the Expert Committee
on Tax Measures to Promote Employment, New Delhi.
— (1980a): Office of the Textile Commissioner Ministry of Commerce, Indian textile Bulletin, Annual Number, Vol XXVI, No 5, Bombay.
— (1984): Dirctorate of Statistics and In-telligence, Central Excise & Customs, "Statistical Year Book, Central Excise", Vol 1, New Delhi.
Jain, L C (1983): "Handlooms Face Liquida-tion", Economic and Political Weekly, Vol XVIII No 35.
Mazumdar Dipak (1984): "The Issue of Small versus Large in the Indian Textile Industry—An Analytical and Historical Survey", World Bank Staff Working Papers, No 645,
Mill Owner's Association (1982): Memorandum Submitted by the Millowners' Association, Bombay, to Tripartite Committee, Bombay.
National Productivity Council (1976); "Produc-tive y Heads in Cotton Textile Industry in India", New Delhi.
Rao, M G and Pradhan, G (1984): "Excise Duty Evasion in Cotton Textile Fabrics", NIPFP. New Delhi.
On Financial Innovations and Credit Market Evolution
V V Bhatt The role of the introduction and diffusion of innovations in the process of economic development has been
well recognised in the literature since the seminal works of Marx, Schumpeter and Kuznets. However, little attention is paid to the significance of social innovations—and in particular; financial and fiscal innovations. It is the broad theme of this paper that financial innovations tend to reduce transaction costs and risk—both subjective and objective—and as a result bring about widening, deepening and integration of capital markets; such financial development accelerates the pace of economic development through its favourable impact on saving, investment and output.
The relationship between finance and development and the precise role of financial innovations are discussed in Section I, while Section II deals with the nature and characteristics of financial innovations. The concluding section indicates the role of policy intervention in quickening the pace of financial development.
I
F i n a n c e and D e v e l o p m e n t
THE pace and pattern of economic develop-ment are a function, as Adam Smith very perceptively observed two centuries ago, of the sequential and circular relationship bet-ween the growth of (a) division of labour and (b) the extent of the market for real goods and services. The innovations of money and finance tend to increase the size and extent of exchange relationships or markets and thus promote division of labour, leading to increasing returns to scale and technical change.
Money as a unit of account and medium of exchange reduces the transaction and search costs involved in barter transactions. Money as a store of value provides time for making purchase decisions, thus reducing the risk of ill-formed and hasty decisions. Thus, through reduction of transaction costs and risk, money tends to enlarge the size of the market for real goods and services and
hence the possibility of division of labour— the two interacting mutually reinforcing forces that account for a process of sustained economic development.
Just as money reduces transaction costs and risk for contemporary exchanges across space, credit or financial instruments reduce costs of transactions and risk for inter temporal exchanges of goods and services. It is thus that the existence of a credit or a capital market enlarges the market for real goods and services. The impact of money and capital markets on the market for real goods and services is similar to that of reduction of transport costs on trade or exchanges across space.
Unlike the market for real goods and ser-vices, credit or capital markets are inherently imperfect in the sense that there is no cer-tainty about the completion of a credit tran-saction, A credit transaction involves a rela-tionship between a lender and a borrower in time and hence in the context of uncer-tainty. A credit transaction is completed only
when the borrower repays the amount bor rowed; and there can be no certainty about this repayment.
First, there is the borrower's risk; the ex-pected excess income required for repayment may or may not materialise. But, in addition, there is the lender's risk, which has two elements. One relates to the same risk with which the borrower is faced; but the lender may have a different perception of the same risk. The other element relates to the bor-rower's willingness to repay; even if he is able to repay, he may not actually repay. Both lender's as well as borrower's expectations with regard to the outcome in time -their perceptions of the riskiness of their ventures—are of necessity subjective, based, of course, on whatever data and information are available to each one of them and each one's ability to interpret them.
It may be observed that there is double counting of one part of the risk. Borrower has a certain perception of the risk he faces with regard to, say, his investment project.
Economic and Political Weekly Vol XX, No 44, November 2, 1985 1889