exchange rate volatility and spanish-american commodity trade flows
TRANSCRIPT
Economic Systems xxx (2014) xxx–xxx
G Models
ECOSYS-458; No. of Pages 18
Contents lists available at ScienceDirect
Economic Systems
journal homepage: www.elsevier.com/locate/ecosys
Exchange rate volatility and Spanish-Americancommodity trade flows
Mohsen Bahmani-Oskooee a,*, Hanafiah Harvey b,Scott W. Hegerty c
a Department of Economics and Center for Research on International Economics,University of Wisconsin-Milwaukee, Milwaukee, WI 53201, United Statesb Department of Economics, Penn State University, Mont Alto, PA 17237, United Statesc Department of Economics, Northeastern Illinois University, Chicago, IL 60625, United States
A R T I C L E I N F O
Article history:
Received 4 March 2013
Received in revised form 21 August 2013
Accepted 22 August 2013
JEL classification:
F31
Keywords:
Exchange rate volatility
Industry data
Spain
United States
Bounds testing
A B S T R A C T
A number of recent studies have tested the impact of exchange rate
volatility on trade flows, particularly for individual commodities,
for various country pairs. These have found that risk can increase as
well as decrease trade, but that oftentimes industries are not
affected. This study examines trade between the United States and
Spain over the period from 1962 to 2009, for 131 U.S. export
industries and 88 import industries. We find that exchange rate
volatility has short-run and long-run effects in only a fraction of the
cases, but that exports respond more to increased uncertainty than
imports do. In all, only 35 of the 74 U.S. export industries are
affected (11 positive, 24 negative), whilst only three out of 37
import industries have positive coefficients and 11 have negative
ones. We find no evidence that durable or nondurable goods are
more likely to respond to volatility, whilst small industries or
specialized goods might show more of a positive response.
� 2013 Elsevier B.V. All rights reserved.
1. Introduction
Exchange rate volatility, like any type of risk, can hinder economic activity and reduce trade flows.Exporters or importers, unsure of the domestic value of their costs or revenues, might be unwilling totake part in risky international transactions. At the same time, ‘‘locked in’’ contracts might mean that
* Corresponding author.
E-mail address: [email protected] (M. Bahmani-Oskooee).
Please cite this article in press as: Bahmani-Oskooee, M., et al., Exchange rate volatility andSpanish-American commodity trade flows. Econ. Syst. (2014), http://dx.doi.org/10.1016/j.ecosys.2013.08.002
0939-3625/$ – see front matter � 2013 Elsevier B.V. All rights reserved.
http://dx.doi.org/10.1016/j.ecosys.2013.08.002
M. Bahmani-Oskooee et al. / Economic Systems xxx (2014) xxx–xxx2
G Models
ECOSYS-458; No. of Pages 18
traders are able to adjust their behaviour only after a period of time. As a result, it is important toestimate the role of exchange rate volatility on international commerce for the short run as well as thelong run. These empirical tests would need to be done for any country pair and for any commodity thatis traded internationally. In this study, we estimate this trade between the United States and Spain for131 U.S. export industries and 88 import industries.
According to the U.S. census, U.S. exports to Spain were $9.5 billion in 2012, and imports from Spaintotalled 11.8 billion. This is four times the nominal 1985 value and greater than the 2012 values forSouth Africa, for example. As such, this trade partnership is an important one. In addition, Spanishtrade has made up a steady share of the U.S. total. For example, in 1990, Spain was the destination of1.5% of U.S. exports and the source of 0.7% of U.S. imports; the corresponding figures in 2012 were 0.6%and 0.5%, respectively.
Studying Spanish trade with non-Euro nations is also important, because a reduction in riskmight aid exports and help bring the Spanish economy out of recession. This would thus providefurther incentive for bringing the Euro crisis under control. In our analysis, we find that our resultsare mixed, as are those of many earlier studies in this branch of the literature. In particular,specialized industries seem to be more likely to respond positively to risk than other types ofcommodities.
This literature has been thoroughly reviewed by McKenzie (1999) and Bahmani-Oskooee andHegerty (2007). This later study, in particular, notes that there are theoretical justifications forexchange rate variability having a positive effect on trade flows, or even no effect at all. ‘‘Risk loving’’traders might be willing to make money off of exchange rate variability, or risk management mightresult in there being little, if any, impact. Recent attempts have been made to ‘‘uncover’’ the effects ofexchange rate volatility by disaggregating trade data to the industry level. Since the effects of riskmight vary by industry, they might be obscured in an aggregate trade flow series. Many empiricalpapers do indeed show evidence of mixed effects.
As these review papers also show, there are relatively few analyses of the specific case of bilateraltrade between the United States and Spain, particularly at the commodity level. A few older, aggregatestudies include Thursby and Thursby (1985), who examine a number of countries, but find nosignificant results for Spain, and Arize (1998), who uses cointegration analysis to show that exchangerate volatility reduces Spanish aggregate imports.
These mixed results are no surprise. But there is clearly room in the literature for a comprehensivestudy of the role of exchange rate risk on Spain’s industry-level trade flows. This paper provides such astudy, using cointegration analysis to estimate short- and long-run effects for Spanish-U.S. trade for anumber of export and import industries. This study proceeds as follows: Section 2 outlines theeconometric methodology. Section 3 describes the results, and Section 4 concludes. Data are describedin Appendix.
2. Methodology
In our investigation of United States trade with Spain, we use annual data for 131 U.S. exportindustries and 88 import industries. These are disaggregated to the SITC 3-digit level and span theperiod from 1962 to 2009. We use a reduced-form model in which each trade flow is a function of thepurchasing country’s GDP, the real Spanish/U.S. exchange rate, and a measure of volatility. Thesevariables are explained in Appendix. Each industry’s real export and/or import flow is estimatedindividually, for a total of 219 separate sets of results.
Because our focus is on the short run as well as the long run—to capture the effects of volatility bothbefore and after adjustment occurs—and because our dataset may contain a mixture of stationary andnonstationary variables, we use a methodology that is commonly applied in this branch of theliterature: the autoregressive distributed lag (ARDL) approach of Pesaran et al. (2001). This single-equation methodology provides short-run and long-run coefficient estimates simultaneously. Inaddition, the long-run coefficients also form the basis of a cointegration test, and the method is able toincorporate stationary as well as I(1) variables.1
1 Nonlinear methods may provide a useful extension to our analysis, but we have not employed them here.
Please cite this article in press as: Bahmani-Oskooee, M., et al., Exchange rate volatility andSpanish-American commodity trade flows. Econ. Syst. (2014), http://dx.doi.org/10.1016/j.ecosys.2013.08.002
M. Bahmani-Oskooee et al. / Economic Systems xxx (2014) xxx–xxx 3
G Models
ECOSYS-458; No. of Pages 18
Following Bahmani-Oskooee and Hegerty (2009a), our export and import specifications are as in(1) and (2) for each industry:
DlnVXt ¼ a0 þXn1
j¼1
b jDlnVXt� j þXn2
j¼0
g jDlnYS paint� j þ
Xn3
j¼0
d jDlnREXt� j þXn4
j¼0
k jDlnVOLt� j
þ u1lnVXt�1 þ u2lnYS paint�1 þ u3lnREXt�1 þ u4lnVOLt�1 þ et (1)
and
DlnVMt ¼ a2 þXn5
j¼1
f jDlnVMt� j þXn6
j¼0
’ jDlnYU:S:t� j þ
Xn7
j¼0
p jDlnREXt� j þXn8
j¼0
# jDlnVOLt� j
þ u5lnVXt�1 þ u6lnYU:S:t�1 þ u7lnREXt�1 þ u8lnVOLt�1 þ et (2)
where VX is the export volume of an industry by the U.S. to Spain; YSpain is Spanish income; REX is thereal exchange rate between U.S. dollar and Spanish peso; VM is the volume of import of the sameindustry by the U.S. from Spain; YU.S. is U.S. income; and VOL is a measure of exchange-rateuncertainty. The exact definition of each variable appears in Appendix.
Eqs. (1) and (2) are error-correction models that include short-run dynamics to estimate the long-run effects. The lag lengths n are chosen from a maximum of four by minimizing the AkaikeInformation Criterion. Once an optimum model is selected, short-run effects are inferred by thecoefficient estimates of first-differenced variables. Long-run effects are inferred by the estimates ofcoefficients attached to lagged-level variables only after normalization.2 Cointegration is alsoestablished based on these long-run coefficients by conducting an F-test for their joint significance.This ‘‘bounds testing’’ approach uses a set of critical values, calculated for large samples by Pesaranet al. (2001) and for small samples by Narayan (2005). If the F-statistic is above the upper-boundcritical value, then we can say that there exists a long-run relationship among the variables. If it isbelow the lower-bound value, then we must conclude that the variables are not cointegrated. Forintermediate values, we conduct an auxiliary test as explained below.3
In our specifications, U.S. exports to Spain are expected to respond positively to an increase inSpanish income, and negatively to a peso depreciation (an increase in REX, based on the number ofunits of Spanish currency per dollar). At the same time, U.S. imports should increase with bothAmerican income and a dollar appreciation, so the corresponding long-run coefficients should bepositive. Based on the literature, the anticipated sign for VOL is ambiguous in all specifications. Thesecoefficients are the focus of our study.
3. Results
The first step in our analysis is to test for cointegration (using the F test) among the variables in allof our export and import specifications. These results are provided in Table 1. We begin with UnitedStates exports to Spain. Of the 131 industries, 46 have F-statistics above the upper-bound critical valueof 3.973. These industries can thus be considered to be cointegrated. For a further 56 industries, the F-statistic is below the lower bound of 2.873; these industries are not cointegrated. For the 29 industrieswith F-statistics that lie in the intermediate range, we perform an auxiliary test by grouping all of theestimates of the lagged long-run variables into a single fitted value, which we label ECMt�1. Replacingthe lagged level variables in Eq. (1) or (2) with these single lagged error-correction terms, we then re-estimate the equations. If the coefficient on this new variable is significantly negative, we can say thatthere is a long-run relationship among the variables, since they move together in the oppositedirection of a shock (Bahmani-Oskooee and Tanku, 2008). Of these 29 industries, four are shown to be
2 For details of normalization, see Bahmani-Oskooee and Tanku (2008).3 For other applications of the bounds testing approach see Bahmani-Oskooee et al. (2005), Halicioglu (2007), Narayan et al.
(2007), Tang (2007), Mohammadi et al. (2008), Wong and Tang (2008), De Vita and Kyaw (2008), Payne (2008), Bahmani-
Oskooee and Gelan (2009), and Chen et al. (2012).
Please cite this article in press as: Bahmani-Oskooee, M., et al., Exchange rate volatility andSpanish-American commodity trade flows. Econ. Syst. (2014), http://dx.doi.org/10.1016/j.ecosys.2013.08.002
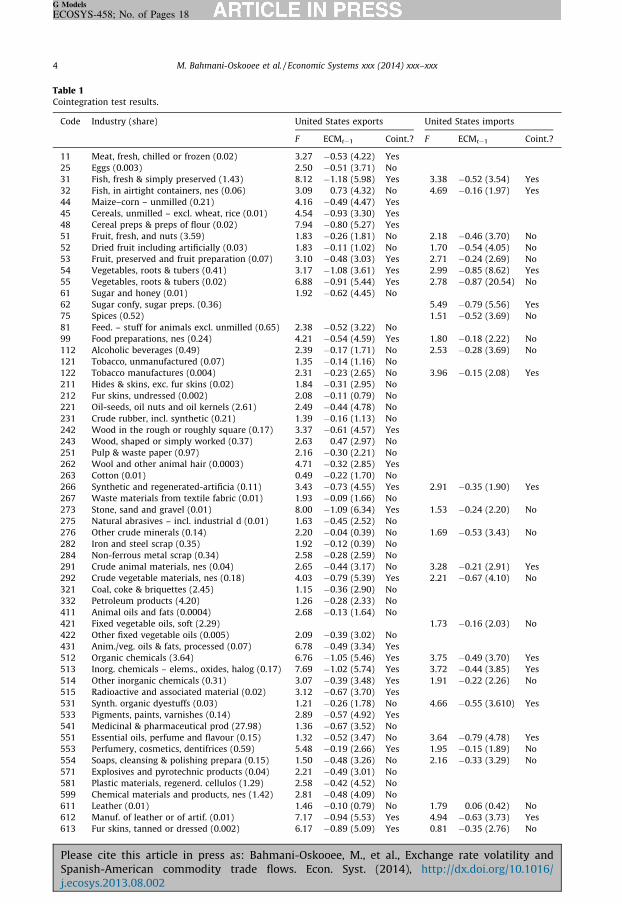
Table 1Cointegration test results.
Code Industry (share) United States exports United States imports
F ECMt�1 Coint.? F ECMt�1 Coint.?
11 Meat, fresh, chilled or frozen (0.02) 3.27 �0.53 (4.22) Yes
25 Eggs (0.003) 2.50 �0.51 (3.71) No
31 Fish, fresh & simply preserved (1.43) 8.12 �1.18 (5.98) Yes 3.38 �0.52 (3.54) Yes
32 Fish, in airtight containers, nes (0.06) 3.09 0.73 (4.32) No 4.69 �0.16 (1.97) Yes
44 Maize–corn – unmilled (0.21) 4.16 �0.49 (4.47) Yes
45 Cereals, unmilled – excl. wheat, rice (0.01) 4.54 �0.93 (3.30) Yes
48 Cereal preps & preps of flour (0.02) 7.94 �0.80 (5.27) Yes
51 Fruit, fresh, and nuts (3.59) 1.83 �0.26 (1.81) No 2.18 �0.46 (3.70) No
52 Dried fruit including artificially (0.03) 1.83 �0.11 (1.02) No 1.70 �0.54 (4.05) No
53 Fruit, preserved and fruit preparation (0.07) 3.10 �0.48 (3.03) Yes 2.71 �0.24 (2.69) No
54 Vegetables, roots & tubers (0.41) 3.17 �1.08 (3.61) Yes 2.99 �0.85 (8.62) Yes
55 Vegetables, roots & tubers (0.02) 6.88 �0.91 (5.44) Yes 2.78 �0.87 (20.54) No
61 Sugar and honey (0.01) 1.92 �0.62 (4.45) No
62 Sugar confy, sugar preps. (0.36) 5.49 �0.79 (5.56) Yes
75 Spices (0.52) 1.51 �0.52 (3.69) No
81 Feed. – stuff for animals excl. unmilled (0.65) 2.38 �0.52 (3.22) No
99 Food preparations, nes (0.24) 4.21 �0.54 (4.59) Yes 1.80 �0.18 (2.22) No
112 Alcoholic beverages (0.49) 2.39 �0.17 (1.71) No 2.53 �0.28 (3.69) No
121 Tobacco, unmanufactured (0.07) 1.35 �0.14 (1.16) No
122 Tobacco manufactures (0.004) 2.31 �0.23 (2.65) No 3.96 �0.15 (2.08) Yes
211 Hides & skins, exc. fur skins (0.02) 1.84 �0.31 (2.95) No
212 Fur skins, undressed (0.002) 2.08 �0.11 (0.79) No
221 Oil-seeds, oil nuts and oil kernels (2.61) 2.49 �0.44 (4.78) No
231 Crude rubber, incl. synthetic (0.21) 1.39 �0.16 (1.13) No
242 Wood in the rough or roughly square (0.17) 3.37 �0.61 (4.57) Yes
243 Wood, shaped or simply worked (0.37) 2.63 0.47 (2.97) No
251 Pulp & waste paper (0.97) 2.16 �0.30 (2.21) No
262 Wool and other animal hair (0.0003) 4.71 �0.32 (2.85) Yes
263 Cotton (0.01) 0.49 �0.22 (1.70) No
266 Synthetic and regenerated-artificia (0.11) 3.43 �0.73 (4.55) Yes 2.91 �0.35 (1.90) Yes
267 Waste materials from textile fabric (0.01) 1.93 �0.09 (1.66) No
273 Stone, sand and gravel (0.01) 8.00 �1.09 (6.34) Yes 1.53 �0.24 (2.20) No
275 Natural abrasives – incl. industrial d (0.01) 1.63 �0.45 (2.52) No
276 Other crude minerals (0.14) 2.20 �0.04 (0.39) No 1.69 �0.53 (3.43) No
282 Iron and steel scrap (0.35) 1.92 �0.12 (0.39) No
284 Non-ferrous metal scrap (0.34) 2.58 �0.28 (2.59) No
291 Crude animal materials, nes (0.04) 2.65 �0.44 (3.17) No 3.28 �0.21 (2.91) Yes
292 Crude vegetable materials, nes (0.18) 4.03 �0.79 (5.39) Yes 2.21 �0.67 (4.10) No
321 Coal, coke & briquettes (2.45) 1.15 �0.36 (2.90) No
332 Petroleum products (4.20) 1.26 �0.28 (2.33) No
411 Animal oils and fats (0.0004) 2.68 �0.13 (1.64) No
421 Fixed vegetable oils, soft (2.29) 1.73 �0.16 (2.03) No
422 Other fixed vegetable oils (0.005) 2.09 �0.39 (3.02) No
431 Anim./veg. oils & fats, processed (0.07) 6.78 �0.49 (3.34) Yes
512 Organic chemicals (3.64) 6.76 �1.05 (5.46) Yes 3.75 �0.49 (3.70) Yes
513 Inorg. chemicals – elems., oxides, halog (0.17) 7.69 �1.02 (5.74) Yes 3.72 �0.44 (3.85) Yes
514 Other inorganic chemicals (0.31) 3.07 �0.39 (3.48) Yes 1.91 �0.22 (2.26) No
515 Radioactive and associated material (0.02) 3.12 �0.67 (3.70) Yes
531 Synth. organic dyestuffs (0.03) 1.21 �0.26 (1.78) No 4.66 �0.55 (3.610) Yes
533 Pigments, paints, varnishes (0.14) 2.89 �0.57 (4.92) Yes
541 Medicinal & pharmaceutical prod (27.98) 1.36 �0.67 (3.52) No
551 Essential oils, perfume and flavour (0.15) 1.32 �0.52 (3.47) No 3.64 �0.79 (4.78) Yes
553 Perfumery, cosmetics, dentifrices (0.59) 5.48 �0.19 (2.66) Yes 1.95 �0.15 (1.89) No
554 Soaps, cleansing & polishing prepara (0.15) 1.50 �0.48 (3.26) No 2.16 �0.33 (3.29) No
571 Explosives and pyrotechnic products (0.04) 2.21 �0.49 (3.01) No
581 Plastic materials, regenerd. cellulos (1.29) 2.58 �0.42 (4.52) No
599 Chemical materials and products, nes (1.42) 2.81 �0.48 (4.09) No
611 Leather (0.01) 1.46 �0.10 (0.79) No 1.79 0.06 (0.42) No
612 Manuf. of leather or of artif. (0.01) 7.17 �0.94 (5.53) Yes 4.94 �0.63 (3.73) Yes
613 Fur skins, tanned or dressed (0.002) 6.17 �0.89 (5.09) Yes 0.81 �0.35 (2.76) No
M. Bahmani-Oskooee et al. / Economic Systems xxx (2014) xxx–xxx4
G Models
ECOSYS-458; No. of Pages 18
Please cite this article in press as: Bahmani-Oskooee, M., et al., Exchange rate volatility andSpanish-American commodity trade flows. Econ. Syst. (2014), http://dx.doi.org/10.1016/j.ecosys.2013.08.002

Table 1 (Continued )
Code Industry (share) United States exports United States imports
F ECMt�1 Coint.? F ECMt�1 Coint.?
621 Materials of rubber (0.11) 1.45 �0.30 (2.89) No
629 Articles of rubber, nes (0.16) 3.03 �0.66 (3.96) Yes 5.89 �0.42 (10.45) Yes
631 Veneers, plywood boards & other wood (0.28) 1.59 �0.06 (0.39) No 2.31 �0.23 (2.49) No
632 Wood manufactures, nes (0.10) 4.34 �0.56 (4.60) Yes 2.79 �0.29 (3.49) No
633 Cork manufactures (0.13) 2.74 �0.17 (2.47) No
641 Paper and paperboard (1.08) 2.32 �0.25 (2.28) No 2.24 �0.51 (3.30) No
642 Articles of paper, pulp, paperboard (0.11) 2.10 �0.39 (3.28) No 1.89 �0.24 (3.30) No
651 Textile yarn and thread (0.07) 3.36 �0.48 (3.59) Yes 2.23 �0.88 (6.42) No
652 Cotton fabrics, woven ex. narrow (0.01) 1.35 �0.39 (3.19) No 0.91 0.04 (0.31) No
653 Text fabrics woven ex narrow (0.05) 2.84 �0.22 (1.01) No 3.89 �0.27 (3.04) Yes
654 Tulle, lace, embroidery, ribbons, t (0.003) 2.54 �0.72 (3.51) No 2.53 �0.49 (3.51) No
655 Special textile fabrics and related (0.16) 4.07 �0.48 (3.83) Yes 1.82 �0.47 (4.18) No
656 Made-up articles, wholly or chiefly (0.06) 1.03 �0.18 (1.52) No 1.97 �0.04 (0.52) No
657 Floor coverings, tapestries, etc. (0.01) 9.50 �1.08 (6.35) Yes 2.03 �0.17 (2.61) No
661 Lime, cement & fabr. bldg. (0.005) 4.46 �0.59 (4.27) Yes 1.11 �0.17 (1.18) No
662 Clay and refractory construction (0.04) 1.47 �0.73 (2.72) No 1.60 �0.26 (2.04) No
663 Mineral manufactures, nes (0.37) 4.72 �0.56 (5.23) Yes 3.95 �0.18 (2.67) Yes
664 Glass (0.37) 4.84 �0.39 (2.03) Yes 1.62 �0.27 (2.46) No
665 Glassware (0.06) 5.41 �0.59 (2.80) Yes 1.31 �0.21 (2.13) No
666 Pottery (0.01) 8.22 �0.98 (5.99) Yes 5.12 0.14 (2.39) Yes
667 Pearls and precious and semi-precious (0.05) 1.28 �0.32 (2.08) No
671 Pig iron, spiegeleisen, sponge iron (0.03) 7.13 �1.01 (6.45) Yes
673 Iron and steel bars, rods, angles (0.05) 2.09 �0.61 (4.33) No 7.82 �0.21 (2.96) Yes
674 Universals, plates and sheets of iron (0.16) 1.94 �0.62 (3.76) No
677 Iron and steel wire, excluding wire (0.003) 1.29 �0.19 (1.19) No
678 Tubes, pipes and fittings of iron ore (0.17) 3.15 �0.15 (1.76) Yes
679 Iron steel castings forgings unwork (0.07) 6.49 �0.44 (4.04) Yes
682 Copper (0.05) 4.85 �0.70 (5.15) Yes
683 Nickel (0.02) 3.90 �0.67 (4.60) Yes
684 Aluminium (0.10) 5.11 �0.71 (5.28) Yes 4.65 �0.52 (4.13) Yes
689 Miscell. non-ferrous base metals (0.32) 3.04 �0.56 (3.99) Yes 1.34 �0.37 (2.15) No
691 Finished structural parts (0.13) 5.34 �0.85 (4.81) Yes
692 Metal containers for storage (0.06) 5.07 �0.68 (4.44) Yes 1.68 �0.37 (1.85) No
693 Wire products (0.01) 4.65 �0.63 (4.51) Yes
694 Nails, screws, nuts, bolts, rivets and (0.10) 7.51 �1.13 (7.30) Yes 1.87 �0.17 (2.63) No
695 Tools for use in the hand or in machine (0.16) 3.67 �0.41 (3.67) Yes 4.48 �0.39 (3.73) Yes
696 Cutlery (0.01) 3.43 �0.66 (4.66) Yes 2.44 �0.12 (1.71) No
697 Household equipment of base metals (0.04) 4.65 �0.20 (2.03) Yes 3.24 �0.27 (2.98) Yes
698 Manufactures of metal, nes (0.51) 3.01 �0.52 (4.08) Yes 5.62 �0.40 (2.75) Yes
711 Power generating machinery (2.50) 2.43 �0.45 (3.54) No 1.98 �0.12 (0.97) No
712 Agricultural machinery and implem (0.43) 5.50 �0.69 (5.07) Yes
714 Office machines (1.16) 3.58 �0.11 (1.45) No 3.25 �0.53 (3.46) Yes
715 Metalworking machinery (0.18) 6.37 �0.94 (5.21) Yes 6.24 �0.39 (4.19) Yes
717 Textile and leather machinery (0.06) 3.11 �0.35 (2.67) Yes 6.44 �0.62 (6.36) Yes
718 Machines for special industries (0.93) 3.36 �0.46 (3.98) Yes 3.75 �0.75 (4.29) Yes
719 Machinery and appliances – non electr (4.20) 5.77 �0.58 (5.89) Yes 3.44 �0.42 (3.61) Yes
722 Electric power machinery and switch (2.27) 5.07 �0.78 (5.87) Yes 2.53 �0.37 (5.19) No
723 Equipment for distributing electric (0.18) 2.92 �0.33 (2.71) Yes 3.00 �0.44 (3.76) Yes
724 Telecommunications apparatus (1.49) 5.32 �0.53 (4.48) Yes 1.78 �0.79 (4.40) No
725 Domestic electrical equipment (0.17) 4.43 �0.47 (4.45) Yes 14.39 �0.38 (7.11) Yes
726 Elec. apparatus for medic. purp., radi (1.19) 3.57 �0.70 (5.30) Yes
729 Other electrical machinery (1.63) 2.05 �0.22 (1.64) No 4.49 �0.50 (3.62) Yes
731 Railway vehicles (0.03) 2.11 �0.17 (1.57) No
732 Road motor vehicles (1.69) 3.14 �0.40 (3.49) Yes 2.27 �0.11 (1.11) No
733 Road vehicles other than motor vehicles (0.12) 4.39 �0.46 (3.64) Yes 6.36 �0.53 (5.02) Yes
734 Aircraft (1.24) 8.58 �0.96 (6.68) Yes
735 Ships and boats (0.39) 3.13 �0.44 (3.25) Yes 2.21 �0.94 (4.16) No
812 Sanitary, plumbing, heating & lighting (0.06) 1.91 �0.68 (3.42 No 1.66 �0.14 (2.02) No
821 Furniture (0.16) 1.45 �0.23 (2.19) No 1.51 �0.28 (3.84) No
831 Travel goods, handbags and similar (0.03) 1.84 �0.73 (4.49) No 2.63 �0.36 (5.02) No
841 Clothing except fur clothing (0.13) 2.25 �0.09 (1.06) No 4.82 �0.25 (3.78) Yes
M. Bahmani-Oskooee et al. / Economic Systems xxx (2014) xxx–xxx 5
G Models
ECOSYS-458; No. of Pages 18
Please cite this article in press as: Bahmani-Oskooee, M., et al., Exchange rate volatility andSpanish-American commodity trade flows. Econ. Syst. (2014), http://dx.doi.org/10.1016/j.ecosys.2013.08.002

Table 1 (Continued )
Code Industry (share) United States exports United States imports
F ECMt�1 Coint.? F ECMt�1 Coint.?
842 Fur clothing and articles of artifi (0.003) 7.98 �1.09 (5.71) Yes 2.28 �0.14 (1.47) No
851 Footwear (0.01) 3.39 �0.10 (1.14) No 10.47 �0.19 (5.43) Yes
861 Scientific, medical, optical, meas./co (3.49) 1.64 �0.30 (2.78) No 0.84 �0.11 (1.45) No
862 Photographic and cinematographic (0.08) 5.38 �0.38 (3.44) Yes 1.69 �0.27 (2.33) No
863 Developed cinematographic film (0.001) 4.04 �0.39 (3.32) Yes 2.25 �0.46 (3.47) No
864 Watches and clocks (0.07) 3.23 �0.42 (3.48) Yes 3.73 �0.42 (2.34) Yes
891 Musical instruments, sound recorders (0.39) 3.23 �0.09 (1.66) No 1.68 �0.53 (3.29) No
892 Printed matter (0.24) 4.95 �0.50 (4.12) Yes 2.10 �0.17 (1.77) No
893 Articles of artificial plastic mate (0.37) 3.85 �0.79 (4.47) Yes 5.21 �0.58 (4.59) Yes
894 Perambulators, toys, games and sporti (0.48) 5.04 �0.35 (4.39) Yes 2.27 �0.22 (1.89) No
895 Office and stationery supplies, nes (0.03) 1.67 �0.26 (2.58) No
896 Works of art, collectors pieces and (0.83) 3.97 �0.75 (4.66) Yes 4.32 �0.56 (3.03) Yes
897 Jewellery and gold/silver-smiths wa (0.13) 5.06 �0.61 (3.77) Yes 3.72 �0.15 (1.66) Yes
899 Manufactured articles, nes (1.08) 0.79 �0.21 (1.15) No 5.22 �0.37 (4.20) Yes
951 Firearms of war and ammunition ther (0.56) 1.34 �0.34 (2.44) No
Note: the upper bound critical value for the F-statistic with unrestricted intercept and no trend at the 10% level of significance is
2.873. The lower bound critical value is 3.973. This comes from Narayan (2005), with k=3 and 50 observations.
The trade share for each industry is defined as the ratio of each industry’s exports as a percent of total US exports to Spain which
includes even industries for which no data were available. These shares are only for 2009. For example, the share of first
industry, 011 – meat, fresh, chilled or frozen 0.02% and not 2%.
nes=Not elsewhere specified.
M. Bahmani-Oskooee et al. / Economic Systems xxx (2014) xxx–xxx6
G Models
ECOSYS-458; No. of Pages 18
uncointegrated and 25 cointegrated when this test is applied. In total, then, 74 export industries can besaid to be cointegrated.
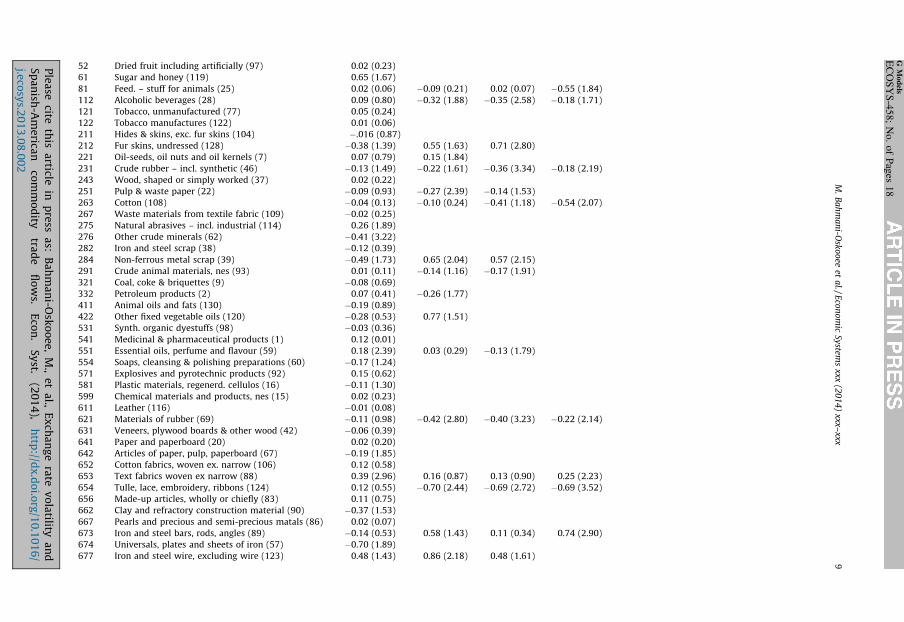
Whilst we provide short-run coefficient estimates for all 131 industries, we provide long-runanalysis only for these 74 industries. These results are provided in Table 2. We first look at the short-run estimates; in the interest of space, we only show those for exchange rate volatility. For U.S. exportsto Spain, only about half of the industries (67 out of 131) have at least one significant short-runcoefficient. For those industries, the signs can be positive or negative, or even both (at different lags).This is our first sign that exchange rate volatility has a relatively weak effect; in fact, it is rather lessthan that has been found for other countries. For example, Bahmani-Oskooee and Hegerty (2009a) andBahmani-Oskooee and Hegerty (2009b) find that, in the specific cases of U.S.–Mexico and U.S.–Japantrade (respectively), a majority of industries respond to exchange rate volatility in the short run even iflong-run effects are less common.
Table 2 also provides the long-run results for the 74 cointegrated industries. Spanish income hasthe expected significantly positive coefficient for 49 industries, or the majority of the cases. Likewise,the real exchange rate has a significantly negative coefficient (meaning that a dollar appreciation hurtsU.S. exports) for 38 of the commodities. In addition, a total of 35 of 74 industries are significantlyaffected by exchange rate uncertainty. These are mixed in sign, but most (24 in all) are negative,supporting the conjecture that exchange rate risk generally reduces trade. The remaining 11 havepositive coefficients. Nevertheless, the vast majority of industries register no effect. We will examinewhether any industrial characteristics might explain these results below.
Next, we turn to the results for United States imports from Spain. These differ from the exportresults in a number of ways. As we see early on, fewer show evidence of cointegration, and for thosethat do, the explanatory variables are significant in fewer cases. Of the 88 industries in our sample,only 21 have F-statistics above the upper-bound critical value, whilst 51 have values below the lowerbound. The cointegration results are shown in Table 1. Seventeen industries lie in the intermediaterange, all of which show cointegration via the auxiliary test. In all, a total of 37 industries arecointegrated, whilst 51 are not.
The short-run volatility coefficients, provided in Table 3, are significant in fewer cases than wastrue for the export specification. Here, 39 of the 88 industries show significant short-run effects. Again,the signs can be positive, negative, or mixed. Turning our attention to the 37 cointegrated industries,U.S. income is significant in a little more than half the cases (22 in all). The real exchange rate has lesseffect, however, it is significantly positive in only nine industries.
Please cite this article in press as: Bahmani-Oskooee, M., et al., Exchange rate volatility andSpanish-American commodity trade flows. Econ. Syst. (2014), http://dx.doi.org/10.1016/j.ecosys.2013.08.002
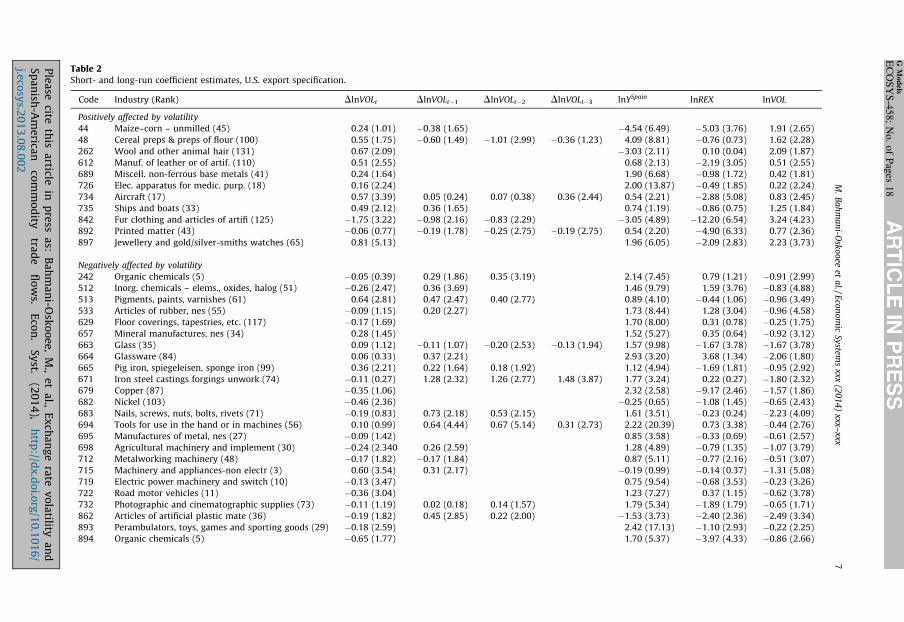
Table 2Short- and long-run coefficient estimates, U.S. export specification.
Code Industry (Rank) DlnVOLt DlnVOLt�1 DlnVOLt�2 DlnVOLt�3 lnYSpain lnREX lnVOL
Positively affected by volatility
44 Maize–corn – unmilled (45) 0.24 (1.01) �0.38 (1.65) �4.54 (6.49) �5.03 (3.76) 1.91 (2.65)
48 Cereal preps & preps of flour (100) 0.55 (1.75) �0.60 (1.49) �1.01 (2.99) �0.36 (1.23) 4.09 (8.81) �0.76 (0.73) 1.62 (2.28)
262 Wool and other animal hair (131) 0.67 (2.09) �3.03 (2.11) 0.10 (0.04) 2.09 (1.87)
612 Manuf. of leather or of artif. (110) 0.51 (2.55) 0.68 (2.13) �2.19 (3.05) 0.51 (2.55)
689 Miscell. non-ferrous base metals (41) 0.24 (1.64) 1.90 (6.68) �0.98 (1.72) 0.42 (1.81)
726 Elec. apparatus for medic. purp. (18) 0.16 (2.24) 2.00 (13.87) �0.49 (1.85) 0.22 (2.24)
734 Aircraft (17) 0.57 (3.39) 0.05 (0.24) 0.07 (0.38) 0.36 (2.44) 0.54 (2.21) �2.88 (5.08) 0.83 (2.45)
735 Ships and boats (33) 0.49 (2.12) 0.36 (1.65) 0.74 (1.19) �0.86 (0.75) 1.25 (1.84)
842 Fur clothing and articles of artifi (125) �1.75 (3.22) �0.98 (2.16) �0.83 (2.29) �3.05 (4.89) �12.20 (6.54) 3.24 (4.23)
892 Printed matter (43) �0.06 (0.77) �0.19 (1.78) �0.25 (2.75) �0.19 (2.75) 0.54 (2.20) �4.90 (6.33) 0.77 (2.36)
897 Jewellery and gold/silver-smiths watches (65) 0.81 (5.13) 1.96 (6.05) �2.09 (2.83) 2.23 (3.73)
Negatively affected by volatility
242 Organic chemicals (5) �0.05 (0.39) 0.29 (1.86) 0.35 (3.19) 2.14 (7.45) 0.79 (1.21) �0.91 (2.99)
512 Inorg. chemicals – elems., oxides, halog (51) �0.26 (2.47) 0.36 (3.69) 1.46 (9.79) 1.59 (3.76) �0.83 (4.88)
513 Pigments, paints, varnishes (61) 0.64 (2.81) 0.47 (2.47) 0.40 (2.77) 0.89 (4.10) �0.44 (1.06) �0.96 (3.49)
533 Articles of rubber, nes (55) �0.09 (1.15) 0.20 (2.27) 1.73 (8.44) 1.28 (3.04) �0.96 (4.58)
629 Floor coverings, tapestries, etc. (117) �0.17 (1.69) 1.70 (8.00) 0.31 (0.78) �0.25 (1.75)
657 Mineral manufactures, nes (34) 0.28 (1.45) 1.52 (5.27) 0.35 (0.64) �0.92 (3.12)
663 Glass (35) 0.09 (1.12) �0.11 (1.07) �0.20 (2.53) �0.13 (1.94) 1.57 (9.98) �1.67 (3.78) �1.67 (3.78)
664 Glassware (84) 0.06 (0.33) 0.37 (2.21) 2.93 (3.20) 3.68 (1.34) �2.06 (1.80)
665 Pig iron, spiegeleisen, sponge iron (99) 0.36 (2.21) 0.22 (1.64) 0.18 (1.92) 1.12 (4.94) �1.69 (1.81) �0.95 (2.92)
671 Iron steel castings forgings unwork (74) �0.11 (0.27) 1.28 (2.32) 1.26 (2.77) 1.48 (3.87) 1.77 (3.24) 0.22 (0.27) �1.80 (2.32)
679 Copper (87) �0.35 (1.06) 2.32 (2.58) �9.17 (2.46) �1.57 (1.86)
682 Nickel (103) �0.46 (2.36) �0.25 (0.65) �1.08 (1.45) �0.65 (2.43)
683 Nails, screws, nuts, bolts, rivets (71) �0.19 (0.83) 0.73 (2.18) 0.53 (2.15) 1.61 (3.51) �0.23 (0.24) �2.23 (4.09)
694 Tools for use in the hand or in machines (56) 0.10 (0.99) 0.64 (4.44) 0.67 (5.14) 0.31 (2.73) 2.22 (20.39) 0.73 (3.38) �0.44 (2.76)
695 Manufactures of metal, nes (27) �0.09 (1.42) 0.85 (3.58) �0.33 (0.69) �0.61 (2.57)
698 Agricultural machinery and implement (30) �0.24 (2.340 0.26 (2.59) 1.28 (4.89) �0.79 (1.35) �1.07 (3.79)
712 Metalworking machinery (48) �0.17 (1.82) �0.17 (1.84) 0.87 (5.11) �0.77 (2.16) �0.51 (3.07)
715 Machinery and appliances-non electr (3) 0.60 (3.54) 0.31 (2.17) �0.19 (0.99) �0.14 (0.37) �1.31 (5.08)
719 Electric power machinery and switch (10) �0.13 (3.47) 0.75 (9.54) �0.68 (3.53) �0.23 (3.26)
722 Road motor vehicles (11) �0.36 (3.04) 1.23 (7.27) 0.37 (1.15) �0.62 (3.78)
732 Photographic and cinematographic supplies (73) �0.11 (1.19) 0.02 (0.18) 0.14 (1.57) 1.79 (5.34) �1.89 (1.79) �0.65 (1.71)
862 Articles of artificial plastic mate (36) �0.19 (1.82) 0.45 (2.85) 0.22 (2.00) �1.53 (3.73) �2.40 (2.36) �2.49 (3.34)
893 Perambulators, toys, games and sporting goods (29) �0.18 (2.59) 2.42 (17.13) �1.10 (2.93) �0.22 (2.25)
894 Organic chemicals (5) �0.65 (1.77) 1.70 (5.37) �3.97 (4.33) �0.86 (2.66)
M.
Ba
hm
an
i-Osk
oo
eeet
al./E
con
om
icSy
stems
xxx(2
01
4)
xxx–xxx
7
GM
od
els
EC
OS
YS
-45
8;
No
.o
fP
ages
18
Ple
ase
citeth
isa
rticlein
pre
ssa
s:B
ah
ma
ni-O
sko
oe
e,
M.,
et
al.,
Ex
cha
ng
era
tev
ola
tilitya
nd
Sp
an
ish-A
me
rican
com
mo
dity
trad
efl
ow
s.E
con
.S
yst.
(20
14
),h
ttp://d
x.d
oi.o
rg/1
0.1
01
6/
j.eco
sys.2
01
3.0
8.0
02
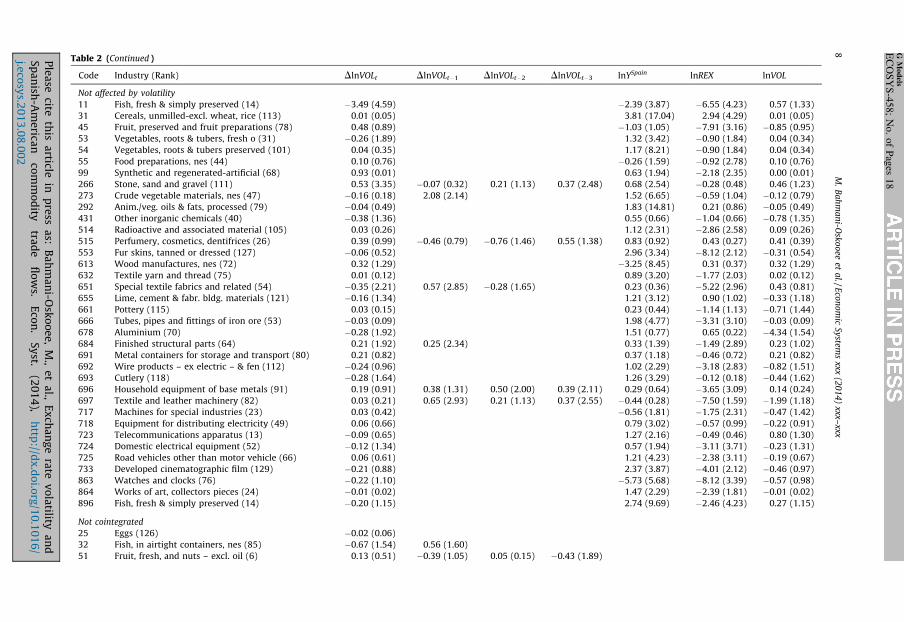
Table 2 (Continued )
Code Industry (Rank) DlnVOLt DlnVOLt�1 DlnVOLt�2 DlnVOLt�3 lnYSpain lnREX lnVOL
Not affected by volatility
11 Fish, fresh & simply preserved (14) �3.49 (4.59) �2.39 (3.87) �6.55 (4.23) 0.57 (1.33)
31 Cereals, unmilled-excl. wheat, rice (113) 0.01 (0.05) 3.81 (17.04) 2.94 (4.29) 0.01 (0.05)
45 Fruit, preserved and fruit preparations (78) 0.48 (0.89) �1.03 (1.05) �7.91 (3.16) �0.85 (0.95)
53 Vegetables, roots & tubers, fresh o (31) �0.26 (1.89) 1.32 (3.42) �0.90 (1.84) 0.04 (0.34)
54 Vegetables, roots & tubers preserved (101) 0.04 (0.35) 1.17 (8.21) �0.90 (1.84) 0.04 (0.34)
55 Food preparations, nes (44) 0.10 (0.76) �0.26 (1.59) �0.92 (2.78) 0.10 (0.76)
99 Synthetic and regenerated-artificial (68) 0.93 (0.01) 0.63 (1.94) �2.18 (2.35) 0.00 (0.01)
266 Stone, sand and gravel (111) 0.53 (3.35) �0.07 (0.32) 0.21 (1.13) 0.37 (2.48) 0.68 (2.54) �0.28 (0.48) 0.46 (1.23)
273 Crude vegetable materials, nes (47) �0.16 (0.18) 2.08 (2.14) 1.52 (6.65) �0.59 (1.04) �0.12 (0.79)
292 Anim./veg. oils & fats, processed (79) �0.04 (0.49) 1.83 (14.81) 0.21 (0.86) �0.05 (0.49)
431 Other inorganic chemicals (40) �0.38 (1.36) 0.55 (0.66) �1.04 (0.66) �0.78 (1.35)
514 Radioactive and associated material (105) 0.03 (0.26) 1.12 (2.31) �2.86 (2.58) 0.09 (0.26)
515 Perfumery, cosmetics, dentifrices (26) 0.39 (0.99) �0.46 (0.79) �0.76 (1.46) 0.55 (1.38) 0.83 (0.92) 0.43 (0.27) 0.41 (0.39)
553 Fur skins, tanned or dressed (127) �0.06 (0.52) 2.96 (3.34) �8.12 (2.12) �0.31 (0.54)
613 Wood manufactures, nes (72) 0.32 (1.29) �3.25 (8.45) 0.31 (0.37) 0.32 (1.29)
632 Textile yarn and thread (75) 0.01 (0.12) 0.89 (3.20) �1.77 (2.03) 0.02 (0.12)
651 Special textile fabrics and related (54) �0.35 (2.21) 0.57 (2.85) �0.28 (1.65) 0.23 (0.36) �5.22 (2.96) 0.43 (0.81)
655 Lime, cement & fabr. bldg. materials (121) �0.16 (1.34) 1.21 (3.12) 0.90 (1.02) �0.33 (1.18)
661 Pottery (115) 0.03 (0.15) 0.23 (0.44) �1.14 (1.13) �0.71 (1.44)
666 Tubes, pipes and fittings of iron ore (53) �0.03 (0.09) 1.98 (4.77) �3.31 (3.10) �0.03 (0.09)
678 Aluminium (70) �0.28 (1.92) 1.51 (0.77) 0.65 (0.22) �4.34 (1.54)
684 Finished structural parts (64) 0.21 (1.92) 0.25 (2.34) 0.33 (1.39) �1.49 (2.89) 0.23 (1.02)
691 Metal containers for storage and transport (80) 0.21 (0.82) 0.37 (1.18) �0.46 (0.72) 0.21 (0.82)
692 Wire products – ex electric – & fen (112) �0.24 (0.96) 1.02 (2.29) �3.18 (2.83) �0.82 (1.51)
693 Cutlery (118) �0.28 (1.64) 1.26 (3.29) �0.12 (0.18) �0.44 (1.62)
696 Household equipment of base metals (91) 0.19 (0.91) 0.38 (1.31) 0.50 (2.00) 0.39 (2.11) 0.29 (0.64) �3.65 (3.09) 0.14 (0.24)
697 Textile and leather machinery (82) 0.03 (0.21) 0.65 (2.93) 0.21 (1.13) 0.37 (2.55) �0.44 (0.28) �7.50 (1.59) �1.99 (1.18)
717 Machines for special industries (23) 0.03 (0.42) �0.56 (1.81) �1.75 (2.31) �0.47 (1.42)
718 Equipment for distributing electricity (49) 0.06 (0.66) 0.79 (3.02) �0.57 (0.99) �0.22 (0.91)
723 Telecommunications apparatus (13) �0.09 (0.65) 1.27 (2.16) �0.49 (0.46) 0.80 (1.30)
724 Domestic electrical equipment (52) �0.12 (1.34) 0.57 (1.94) �3.11 (3.71) �0.23 (1.31)
725 Road vehicles other than motor vehicle (66) 0.06 (0.61) 1.21 (4.23) �2.38 (3.11) �0.19 (0.67)
733 Developed cinematographic film (129) �0.21 (0.88) 2.37 (3.87) �4.01 (2.12) �0.46 (0.97)
863 Watches and clocks (76) �0.22 (1.10) �5.73 (5.68) �8.12 (3.39) �0.57 (0.98)
864 Works of art, collectors pieces (24) �0.01 (0.02) 1.47 (2.29) �2.39 (1.81) �0.01 (0.02)
896 Fish, fresh & simply preserved (14) �0.20 (1.15) 2.74 (9.69) �2.46 (4.23) 0.27 (1.15)
Not cointegrated
25 Eggs (126) �0.02 (0.06)
32 Fish, in airtight containers, nes (85) �0.67 (1.54) 0.56 (1.60)
51 Fruit, fresh, and nuts – excl. oil (6) 0.13 (0.51) �0.39 (1.05) 0.05 (0.15) �0.43 (1.89)
M.
Ba
hm
an
i-Osk
oo
eeet
al./E
con
om
icSy
stems
xxx(2
01
4)
xxx–xxx
8 GM
od
els
EC
OS
YS
-45
8;
No
.o
fP
ages
18
Ple
ase
citeth
isa
rticlein
pre
ssa
s:B
ah
ma
ni-O
sko
oe
e,
M.,
et
al.,
Ex
cha
ng
era
tev
ola
tilitya
nd
Sp
an
ish-A
me
rican
com
mo
dity
trad
efl
ow
s.E
con
.S
yst.
(20
14
),h
ttp://d
x.d
oi.o
rg/1
0.1
01
6/
j.eco
sys.2
01
3.0
8.0
02
52 Dried fruit including artificially (97) 0.02 (0.23)
61 Sugar and honey (119) 0.65 (1.67)
81 Feed. – stuff for animals (25) 0.02 (0.06) �0.09 (0.21) 0.02 (0.07) �0.55 (1.84)
112 Alcoholic beverages (28) 0.09 (0.80) �0.32 (1.88) �0.35 (2.58) �0.18 (1.71)
121 Tobacco, unmanufactured (77) 0.05 (0.24)
122 Tobacco manufactures (122) 0.01 (0.06)
211 Hides & skins, exc. fur skins (104) �.016 (0.87)
212 Fur skins, undressed (128) �0.38 (1.39) 0.55 (1.63) 0.71 (2.80)
221 Oil-seeds, oil nuts and oil kernels (7) 0.07 (0.79) 0.15 (1.84)
231 Crude rubber – incl. synthetic (46) �0.13 (1.49) �0.22 (1.61) �0.36 (3.34) �0.18 (2.19)
243 Wood, shaped or simply worked (37) 0.02 (0.22)
251 Pulp & waste paper (22) �0.09 (0.93) �0.27 (2.39) �0.14 (1.53)
263 Cotton (108) �0.04 (0.13) �0.10 (0.24) �0.41 (1.18) �0.54 (2.07)
267 Waste materials from textile fabric (109) �0.02 (0.25)
275 Natural abrasives – incl. industrial (114) 0.26 (1.89)
276 Other crude minerals (62) �0.41 (3.22)
282 Iron and steel scrap (38) �0.12 (0.39)
284 Non-ferrous metal scrap (39) �0.49 (1.73) 0.65 (2.04) 0.57 (2.15)
291 Crude animal materials, nes (93) 0.01 (0.11) �0.14 (1.16) �0.17 (1.91)
321 Coal, coke & briquettes (9) �0.08 (0.69)
332 Petroleum products (2) 0.07 (0.41) �0.26 (1.77)
411 Animal oils and fats (130) �0.19 (0.89)
422 Other fixed vegetable oils (120) �0.28 (0.53) 0.77 (1.51)
531 Synth. organic dyestuffs (98) �0.03 (0.36)
541 Medicinal & pharmaceutical products (1) 0.12 (0.01)
551 Essential oils, perfume and flavour (59) 0.18 (2.39) 0.03 (0.29) �0.13 (1.79)
554 Soaps, cleansing & polishing preparations (60) �0.17 (1.24)
571 Explosives and pyrotechnic products (92) 0.15 (0.62)
581 Plastic materials, regenerd. cellulos (16) �0.11 (1.30)
599 Chemical materials and products, nes (15) 0.02 (0.23)
611 Leather (116) �0.01 (0.08)
621 Materials of rubber (69) �0.11 (0.98) �0.42 (2.80) �0.40 (3.23) �0.22 (2.14)
631 Veneers, plywood boards & other wood (42) �0.06 (0.39)
641 Paper and paperboard (20) 0.02 (0.20)
642 Articles of paper, pulp, paperboard (67) �0.19 (1.85)
652 Cotton fabrics, woven ex. narrow (106) 0.12 (0.58)
653 Text fabrics woven ex narrow (88) 0.39 (2.96) 0.16 (0.87) 0.13 (0.90) 0.25 (2.23)
654 Tulle, lace, embroidery, ribbons (124) 0.12 (0.55) �0.70 (2.44) �0.69 (2.72) �0.69 (3.52)
656 Made-up articles, wholly or chiefly (83) 0.11 (0.75)
662 Clay and refractory construction material (90) �0.37 (1.53)
667 Pearls and precious and semi-precious matals (86) 0.02 (0.07)
673 Iron and steel bars, rods, angles (89) �0.14 (0.53) 0.58 (1.43) 0.11 (0.34) 0.74 (2.90)
674 Universals, plates and sheets of iron (57) �0.70 (1.89)
677 Iron and steel wire, excluding wire (123) 0.48 (1.43) 0.86 (2.18) 0.48 (1.61)
M.
Ba
hm
an
i-Osk
oo
eeet
al./E
con
om
icSy
stems
xxx(2
01
4)
xxx–xxx
9
GM
od
els
EC
OS
YS
-45
8;
No
.o
fP
ages
18
Ple
ase
citeth
isa
rticlein
pre
ssa
s:B
ah
ma
ni-O
sko
oe
e,
M.,
et
al.,
Ex
cha
ng
era
tev
ola
tilitya
nd
Sp
an
ish-A
me
rican
com
mo
dity
trad
efl
ow
s.E
con
.S
yst.
(20
14
),h
ttp://d
x.d
oi.o
rg/1
0.1
01
6/
j.eco
sys.2
01
3.0
8.0
02

Table 2 (Continued )
Code Industry (Rank) DlnVOLt DlnVOLt�1 DlnVOLt�2 DlnVOLt�3 lnYSpain lnREX lnVOL
711 Power generating machinery (8) �0.13 (1.36)
714 Office machines (19) �0.06 (0.79) �0.24 (2.52) �0.27 (3.52)
729 Other electrical machinery and apparatus (12) 0.02 (0.33)
731 Railway vehicles (95) �0.07 (0.28) �0.67 (3.09)
812 Sanitary, plumbing, heating (81) 0.04 (0.28) �0.11 (0.47) �0.32 (1.89) �0.30 (2.40)
821 Furniture (58) 0.06 (0.49)
831 Travel goods, handbags and similar (96) �0.32 (1.53) �0.46 (2.31)
841 Clothing except fur clothing (63) 0.41 (3.19) �0.36 (2.39) �0.44 (3.96)
851 Footwear (107) �0.03 (0.20)
861 Scientific, medical, optical, meas./co (4) 0.03 (0.46) �0.23 (2.31) �0.28 (3.56) �0.16 (2.57)
891 Musical instruments, sound recorders (32) 0.07 (0.98) �0.24 (2.74) �0.28 (4.02) �0.12 (2.18)
895 Office and stationery supplies, nes (94) �0.19 (1.84)
899 Manufactured articles, nes (21) 0.11 (0.98)
Note: (1) the absolute values of the t-ratios are in parentheses. (2) Industries are ranked in terms of 2009 trade share, with 1 representing the largest industry and 131 representing the
smallest.
nes=Not elsewhere specified.
M.
Ba
hm
an
i-Osk
oo
eeet
al./E
con
om
icSy
stems
xxx(2
01
4)
xxx–xxx
10
GM
od
els
EC
OS
YS
-45
8;
No
.o
fP
ages
18
Ple
ase
citeth
isa
rticlein
pre
ssa
s:B
ah
ma
ni-O
sko
oe
e,
M.,
et
al.,
Ex
cha
ng
era
tev
ola
tilitya
nd
Sp
an
ish-A
me
rican
com
mo
dity
trad
efl
ow
s.E
con
.S
yst.
(20
14
),h
ttp://d
x.d
oi.o
rg/1
0.1
01
6/
j.eco
sys.2
01
3.0
8.0
02
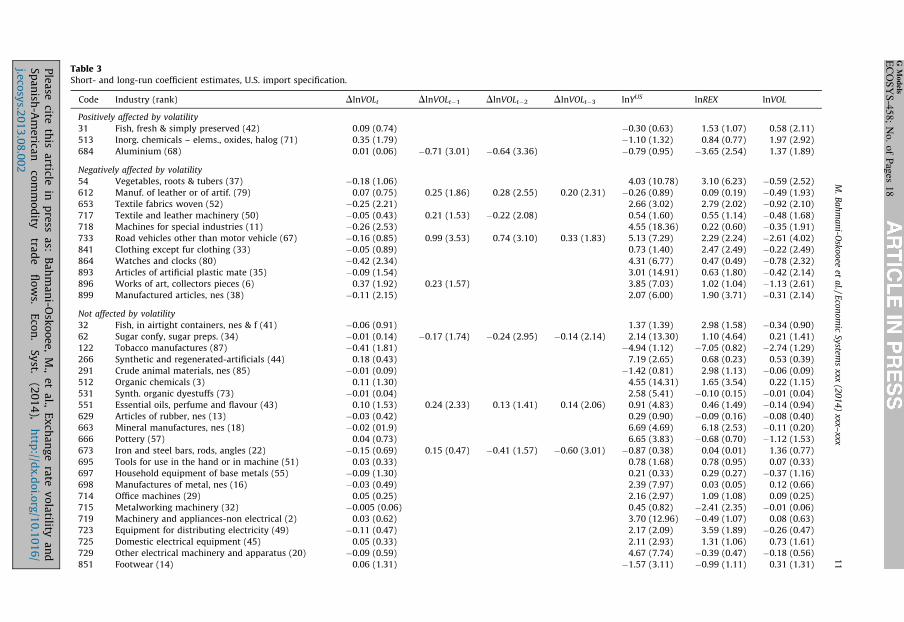
Table 3Short- and long-run coefficient estimates, U.S. import specification.
Code Industry (rank) DlnVOLt DlnVOLt�1 DlnVOLt�2 DlnVOLt�3 lnYUS lnREX lnVOL
Positively affected by volatility
31 Fish, fresh & simply preserved (42) 0.09 (0.74) �0.30 (0.63) 1.53 (1.07) 0.58 (2.11)
513 Inorg. chemicals – elems., oxides, halog (71) 0.35 (1.79) �1.10 (1.32) 0.84 (0.77) 1.97 (2.92)
684 Aluminium (68) 0.01 (0.06) �0.71 (3.01) �0.64 (3.36) �0.79 (0.95) �3.65 (2.54) 1.37 (1.89)
Negatively affected by volatility
54 Vegetables, roots & tubers (37) �0.18 (1.06) 4.03 (10.78) 3.10 (6.23) �0.59 (2.52)
612 Manuf. of leather or of artif. (79) 0.07 (0.75) 0.25 (1.86) 0.28 (2.55) 0.20 (2.31) �0.26 (0.89) 0.09 (0.19) �0.49 (1.93)
653 Textile fabrics woven (52) �0.25 (2.21) 2.66 (3.02) 2.79 (2.02) �0.92 (2.10)
717 Textile and leather machinery (50) �0.05 (0.43) 0.21 (1.53) �0.22 (2.08) 0.54 (1.60) 0.55 (1.14) �0.48 (1.68)
718 Machines for special industries (11) �0.26 (2.53) 4.55 (18.36) 0.22 (0.60) �0.35 (1.91)
733 Road vehicles other than motor vehicle (67) �0.16 (0.85) 0.99 (3.53) 0.74 (3.10) 0.33 (1.83) 5.13 (7.29) 2.29 (2.24) �2.61 (4.02)
841 Clothing except fur clothing (33) �0.05 (0.89) 0.73 (1.40) 2.47 (2.49) �0.22 (2.49)
864 Watches and clocks (80) �0.42 (2.34) 4.31 (6.77) 0.47 (0.49) �0.78 (2.32)
893 Articles of artificial plastic mate (35) �0.09 (1.54) 3.01 (14.91) 0.63 (1.80) �0.42 (2.14)
896 Works of art, collectors pieces (6) 0.37 (1.92) 0.23 (1.57) 3.85 (7.03) 1.02 (1.04) �1.13 (2.61)
899 Manufactured articles, nes (38) �0.11 (2.15) 2.07 (6.00) 1.90 (3.71) �0.31 (2.14)
Not affected by volatility
32 Fish, in airtight containers, nes & f (41) �0.06 (0.91) 1.37 (1.39) 2.98 (1.58) �0.34 (0.90)
62 Sugar confy, sugar preps. (34) �0.01 (0.14) �0.17 (1.74) �0.24 (2.95) �0.14 (2.14) 2.14 (13.30) 1.10 (4.64) 0.21 (1.41)
122 Tobacco manufactures (87) �0.41 (1.81) �4.94 (1.12) �7.05 (0.82) �2.74 (1.29)
266 Synthetic and regenerated-artificials (44) 0.18 (0.43) 7.19 (2.65) 0.68 (0.23) 0.53 (0.39)
291 Crude animal materials, nes (85) �0.01 (0.09) �1.42 (0.81) 2.98 (1.13) �0.06 (0.09)
512 Organic chemicals (3) 0.11 (1.30) 4.55 (14.31) 1.65 (3.54) 0.22 (1.15)
531 Synth. organic dyestuffs (73) �0.01 (0.04) 2.58 (5.41) �0.10 (0.15) �0.01 (0.04)
551 Essential oils, perfume and flavour (43) 0.10 (1.53) 0.24 (2.33) 0.13 (1.41) 0.14 (2.06) 0.91 (4.83) 0.46 (1.49) �0.14 (0.94)
629 Articles of rubber, nes (13) �0.03 (0.42) 0.29 (0.90) �0.09 (0.16) �0.08 (0.40)
663 Mineral manufactures, nes (18) �0.02 (01.9) 6.69 (4.69) 6.18 (2.53) �0.11 (0.20)
666 Pottery (57) 0.04 (0.73) 6.65 (3.83) �0.68 (0.70) �1.12 (1.53)
673 Iron and steel bars, rods, angles (22) �0.15 (0.69) 0.15 (0.47) �0.41 (1.57) �0.60 (3.01) �0.87 (0.38) 0.04 (0.01) 1.36 (0.77)
695 Tools for use in the hand or in machine (51) 0.03 (0.33) 0.78 (1.68) 0.78 (0.95) 0.07 (0.33)
697 Household equipment of base metals (55) �0.09 (1.30) 0.21 (0.33) 0.29 (0.27) �0.37 (1.16)
698 Manufactures of metal, nes (16) �0.03 (0.49) 2.39 (7.97) 0.03 (0.05) 0.12 (0.66)
714 Office machines (29) 0.05 (0.25) 2.16 (2.97) 1.09 (1.08) 0.09 (0.25)
715 Metalworking machinery (32) �0.005 (0.06) 0.45 (0.82) �2.41 (2.35) �0.01 (0.06)
719 Machinery and appliances-non electrical (2) 0.03 (0.62) 3.70 (12.96) �0.49 (1.07) 0.08 (0.63)
723 Equipment for distributing electricity (49) �0.11 (0.47) 2.17 (2.09) 3.59 (1.89) �0.26 (0.47)
725 Domestic electrical equipment (45) 0.05 (0.33) 2.11 (2.93) 1.31 (1.06) 0.73 (1.61)
729 Other electrical machinery and apparatus (20) �0.09 (0.59) 4.67 (7.74) �0.39 (0.47) �0.18 (0.56)
851 Footwear (14) 0.06 (1.31) �1.57 (3.11) �0.99 (1.11) 0.31 (1.31)
M.
Ba
hm
an
i-Osk
oo
eeet
al./E
con
om
icSy
stems
xxx(2
01
4)
xxx–xxx
11
GM
od
els
EC
OS
YS
-45
8;
No
.o
fP
ages
18
Ple
ase
citeth
isa
rticlein
pre
ssa
s:B
ah
ma
ni-O
sko
oe
e,
M.,
et
al.,
Ex
cha
ng
era
tev
ola
tilitya
nd
Sp
an
ish-A
me
rican
com
mo
dity
trad
efl
ow
s.E
con
.S
yst.
(20
14
),h
ttp://d
x.d
oi.o
rg/1
0.1
01
6/
j.eco
sys.2
01
3.0
8.0
02
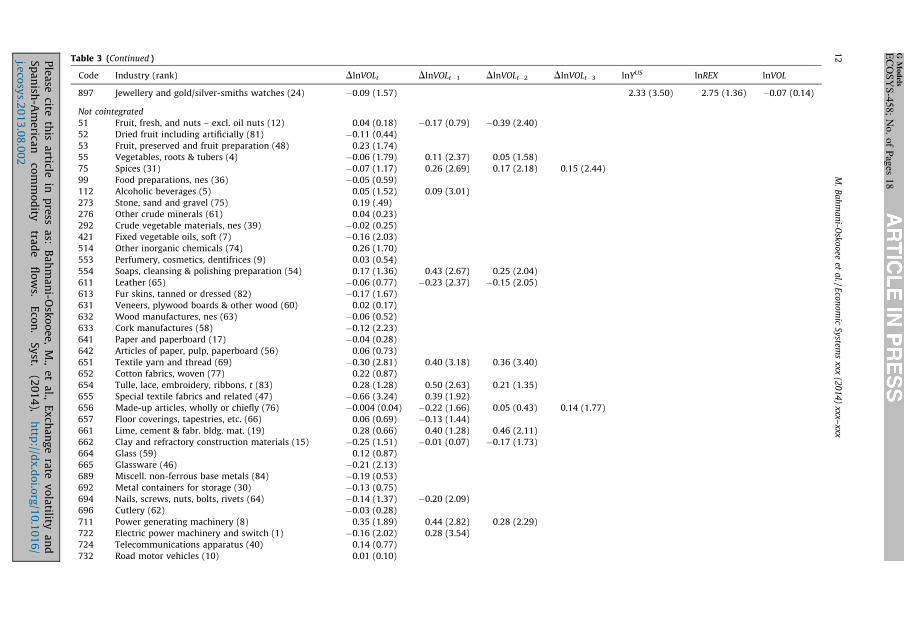
Table 3 (Continued )
Code Industry (rank) DlnVOLt DlnVOLt�1 DlnVOLt�2 DlnVOLt�3 lnYUS lnREX lnVOL
897 Jewellery and gold/silver-smiths watches (24) �0.09 (1.57) 2.33 (3.50) 2.75 (1.36) �0.07 (0.14)
Not cointegrated
51 Fruit, fresh, and nuts – excl. oil nuts (12) 0.04 (0.18) �0.17 (0.79) �0.39 (2.40)
52 Dried fruit including artificially (81) �0.11 (0.44)
53 Fruit, preserved and fruit preparation (48) 0.23 (1.74)
55 Vegetables, roots & tubers (4) �0.06 (1.79) 0.11 (2.37) 0.05 (1.58)
75 Spices (31) �0.07 (1.17) 0.26 (2.69) 0.17 (2.18) 0.15 (2.44)
99 Food preparations, nes (36) �0.05 (0.59)
112 Alcoholic beverages (5) 0.05 (1.52) 0.09 (3.01)
273 Stone, sand and gravel (75) 0.19 (.49)
276 Other crude minerals (61) 0.04 (0.23)
292 Crude vegetable materials, nes (39) �0.02 (0.25)
421 Fixed vegetable oils, soft (7) �0.16 (2.03)
514 Other inorganic chemicals (74) 0.26 (1.70)
553 Perfumery, cosmetics, dentifrices (9) 0.03 (0.54)
554 Soaps, cleansing & polishing preparation (54) 0.17 (1.36) 0.43 (2.67) 0.25 (2.04)
611 Leather (65) �0.06 (0.77) �0.23 (2.37) �0.15 (2.05)
613 Fur skins, tanned or dressed (82) �0.17 (1.67)
631 Veneers, plywood boards & other wood (60) 0.02 (0.17)
632 Wood manufactures, nes (63) �0.06 (0.52)
633 Cork manufactures (58) �0.12 (2.23)
641 Paper and paperboard (17) �0.04 (0.28)
642 Articles of paper, pulp, paperboard (56) 0.06 (0.73)
651 Textile yarn and thread (69) �0.30 (2.81) 0.40 (3.18) 0.36 (3.40)
652 Cotton fabrics, woven (77) 0.22 (0.87)
654 Tulle, lace, embroidery, ribbons, t (83) 0.28 (1.28) 0.50 (2.63) 0.21 (1.35)
655 Special textile fabrics and related (47) �0.66 (3.24) 0.39 (1.92)
656 Made-up articles, wholly or chiefly (76) �0.004 (0.04) �0.22 (1.66) 0.05 (0.43) 0.14 (1.77)
657 Floor coverings, tapestries, etc. (66) 0.06 (0.69) �0.13 (1.44)
661 Lime, cement & fabr. bldg. mat. (19) 0.28 (0.66) 0.40 (1.28) 0.46 (2.11)
662 Clay and refractory construction materials (15) �0.25 (1.51) �0.01 (0.07) �0.17 (1.73)
664 Glass (59) 0.12 (0.87)
665 Glassware (46) �0.21 (2.13)
689 Miscell. non-ferrous base metals (84) �0.19 (0.53)
692 Metal containers for storage (30) �0.13 (0.75)
694 Nails, screws, nuts, bolts, rivets (64) �0.14 (1.37) �0.20 (2.09)
696 Cutlery (62) �0.03 (0.28)
711 Power generating machinery (8) 0.35 (1.89) 0.44 (2.82) 0.28 (2.29)
722 Electric power machinery and switch (1) �0.16 (2.02) 0.28 (3.54)
724 Telecommunications apparatus (40) 0.14 (0.77)
732 Road motor vehicles (10) 0.01 (0.10)
M.
Ba
hm
an
i-Osk
oo
eeet
al./E
con
om
icSy
stems
xxx(2
01
4)
xxx–xxx
12
GM
od
els
EC
OS
YS
-45
8;
No
.o
fP
ages
18
Ple
ase
citeth
isa
rticlein
pre
ssa
s:B
ah
ma
ni-O
sko
oe
e,
M.,
et
al.,
Ex
cha
ng
era
tev
ola
tilitya
nd
Sp
an
ish-A
me
rican
com
mo
dity
trad
efl
ow
s.E
con
.S
yst.
(20
14
),h
ttp://d
x.d
oi.o
rg/1
0.1
01
6/
j.eco
sys.2
01
3.0
8.0
02
735 Ships and boats (70) 0.04 (0.11)
812 Sanitary, plumbing, heating (53) �0.06 (1.23)
821 Furniture (28) �0.02 (0.40)
831 Travel goods, handbags and similar (25) �0.01 (0.18) 0.13 (1.50) 0.15 (2.11) 0.12 (2.19)
842 Fur clothing (86) �0.13 (0.79) 0.09 (0.37) 0.38 (1.88) 0.30 (1.99)
861 Scientific, medical, optical, meas./co (21) �0.12 (0.92)
862 Photographic and cinematographic supplies (78) 0.24 (1.36)
863 Developed cinematographic film (88) �0.45 (1.63)
891 Musical instruments, sound recorders (72) �0.21 (1.47)
892 Printed matter (26) �0.07 (1.28) �0.05 (0.72) �0.03 (0.42) 0.10 (2.03)
894 Perambulators, toys, games and sporting goods (23) 0.03 (0.74)
951 Firearms of war and ammunition (27) 0.25 (1.98) 0.19 (1.63)
Note: (1) the absolute values of the t-ratios are in parentheses. (2) Industries are ranked in terms of 2009 trade share, with 1 representing the largest industry and 88 representing the
smallest.
nes=Not elsewhere specified.
M.
Ba
hm
an
i-Osk
oo
eeet
al./E
con
om
icSy
stems
xxx(2
01
4)
xxx–xxx
13
GM
od
els
EC
OS
YS
-45
8;
No
.o
fP
ages
18
Ple
ase
citeth
isa
rticlein
pre
ssa
s:B
ah
ma
ni-O
sko
oe
e,
M.,
et
al.,
Ex
cha
ng
era
tev
ola
tilitya
nd
Sp
an
ish-A
me
rican
com
mo
dity
trad
efl
ow
s.E
con
.S
yst.
(20
14
),h
ttp://d
x.d
oi.o
rg/1
0.1
01
6/
j.eco
sys.2
01
3.0
8.0
02
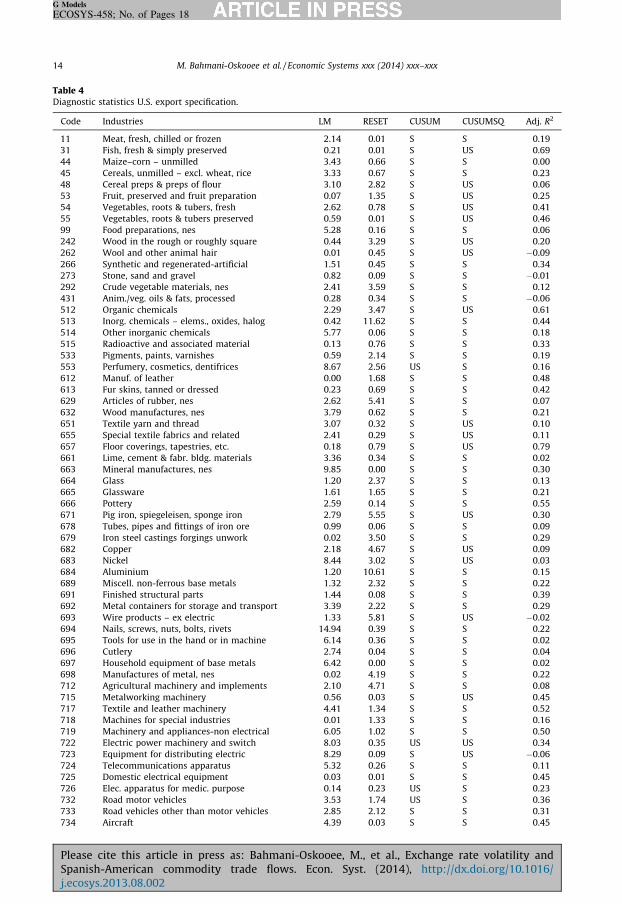
Table 4Diagnostic statistics U.S. export specification.
Code Industries LM RESET CUSUM CUSUMSQ Adj. R2
11 Meat, fresh, chilled or frozen 2.14 0.01 S S 0.19
31 Fish, fresh & simply preserved 0.21 0.01 S US 0.69
44 Maize–corn – unmilled 3.43 0.66 S S 0.00
45 Cereals, unmilled – excl. wheat, rice 3.33 0.67 S S 0.23
48 Cereal preps & preps of flour 3.10 2.82 S US 0.06
53 Fruit, preserved and fruit preparation 0.07 1.35 S US 0.25
54 Vegetables, roots & tubers, fresh 2.62 0.78 S US 0.41
55 Vegetables, roots & tubers preserved 0.59 0.01 S US 0.46
99 Food preparations, nes 5.28 0.16 S S 0.06
242 Wood in the rough or roughly square 0.44 3.29 S US 0.20
262 Wool and other animal hair 0.01 0.45 S US �0.09
266 Synthetic and regenerated-artificial 1.51 0.45 S S 0.34
273 Stone, sand and gravel 0.82 0.09 S S �0.01
292 Crude vegetable materials, nes 2.41 3.59 S S 0.12
431 Anim./veg. oils & fats, processed 0.28 0.34 S S �0.06
512 Organic chemicals 2.29 3.47 S US 0.61
513 Inorg. chemicals – elems., oxides, halog 0.42 11.62 S S 0.44
514 Other inorganic chemicals 5.77 0.06 S S 0.18
515 Radioactive and associated material 0.13 0.76 S S 0.33
533 Pigments, paints, varnishes 0.59 2.14 S S 0.19
553 Perfumery, cosmetics, dentifrices 8.67 2.56 US S 0.16
612 Manuf. of leather 0.00 1.68 S S 0.48
613 Fur skins, tanned or dressed 0.23 0.69 S S 0.42
629 Articles of rubber, nes 2.62 5.41 S S 0.07
632 Wood manufactures, nes 3.79 0.62 S S 0.21
651 Textile yarn and thread 3.07 0.32 S US 0.10
655 Special textile fabrics and related 2.41 0.29 S US 0.11
657 Floor coverings, tapestries, etc. 0.18 0.79 S US 0.79
661 Lime, cement & fabr. bldg. materials 3.36 0.34 S S 0.02
663 Mineral manufactures, nes 9.85 0.00 S S 0.30
664 Glass 1.20 2.37 S S 0.13
665 Glassware 1.61 1.65 S S 0.21
666 Pottery 2.59 0.14 S S 0.55
671 Pig iron, spiegeleisen, sponge iron 2.79 5.55 S US 0.30
678 Tubes, pipes and fittings of iron ore 0.99 0.06 S S 0.09
679 Iron steel castings forgings unwork 0.02 3.50 S S 0.29
682 Copper 2.18 4.67 S US 0.09
683 Nickel 8.44 3.02 S US 0.03
684 Aluminium 1.20 10.61 S S 0.15
689 Miscell. non-ferrous base metals 1.32 2.32 S S 0.22
691 Finished structural parts 1.44 0.08 S S 0.39
692 Metal containers for storage and transport 3.39 2.22 S S 0.29
693 Wire products – ex electric 1.33 5.81 S US �0.02
694 Nails, screws, nuts, bolts, rivets 14.94 0.39 S S 0.22
695 Tools for use in the hand or in machine 6.14 0.36 S S 0.02
696 Cutlery 2.74 0.04 S S 0.04
697 Household equipment of base metals 6.42 0.00 S S 0.02
698 Manufactures of metal, nes 0.02 4.19 S S 0.22
712 Agricultural machinery and implements 2.10 4.71 S S 0.08
715 Metalworking machinery 0.56 0.03 S US 0.45
717 Textile and leather machinery 4.41 1.34 S S 0.52
718 Machines for special industries 0.01 1.33 S S 0.16
719 Machinery and appliances-non electrical 6.05 1.02 S S 0.50
722 Electric power machinery and switch 8.03 0.35 US US 0.34
723 Equipment for distributing electric 8.29 0.09 S US �0.06
724 Telecommunications apparatus 5.32 0.26 S S 0.11
725 Domestic electrical equipment 0.03 0.01 S S 0.45
726 Elec. apparatus for medic. purpose 0.14 0.23 US S 0.23
732 Road motor vehicles 3.53 1.74 US S 0.36
733 Road vehicles other than motor vehicles 2.85 2.12 S S 0.31
734 Aircraft 4.39 0.03 S S 0.45
M. Bahmani-Oskooee et al. / Economic Systems xxx (2014) xxx–xxx14
G Models
ECOSYS-458; No. of Pages 18
Please cite this article in press as: Bahmani-Oskooee, M., et al., Exchange rate volatility andSpanish-American commodity trade flows. Econ. Syst. (2014), http://dx.doi.org/10.1016/j.ecosys.2013.08.002
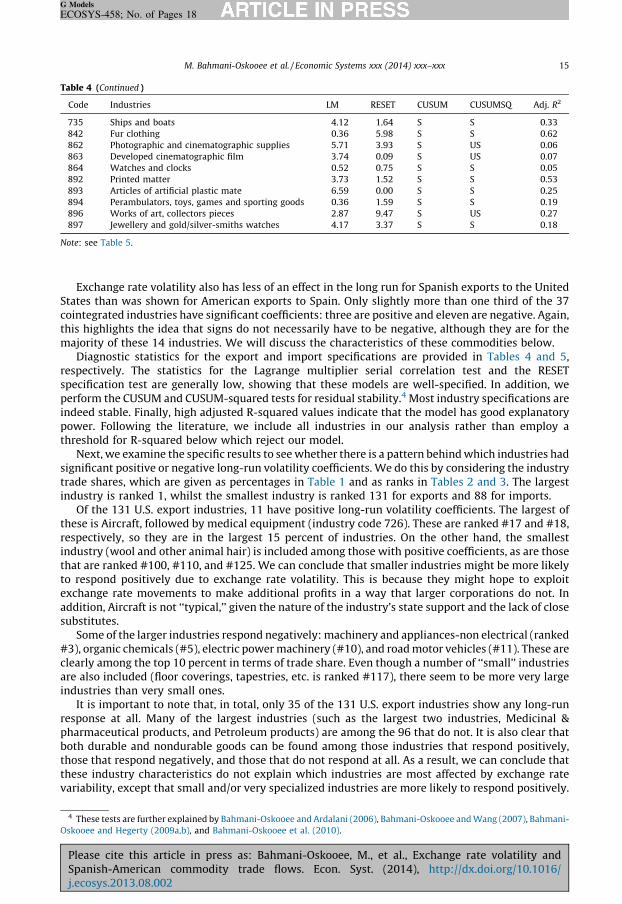
Table 4 (Continued )
Code Industries LM RESET CUSUM CUSUMSQ Adj. R2
735 Ships and boats 4.12 1.64 S S 0.33
842 Fur clothing 0.36 5.98 S S 0.62
862 Photographic and cinematographic supplies 5.71 3.93 S US 0.06
863 Developed cinematographic film 3.74 0.09 S US 0.07
864 Watches and clocks 0.52 0.75 S S 0.05
892 Printed matter 3.73 1.52 S S 0.53
893 Articles of artificial plastic mate 6.59 0.00 S S 0.25
894 Perambulators, toys, games and sporting goods 0.36 1.59 S S 0.19
896 Works of art, collectors pieces 2.87 9.47 S US 0.27
897 Jewellery and gold/silver-smiths watches 4.17 3.37 S S 0.18
Note: see Table 5.
M. Bahmani-Oskooee et al. / Economic Systems xxx (2014) xxx–xxx 15
G Models
ECOSYS-458; No. of Pages 18
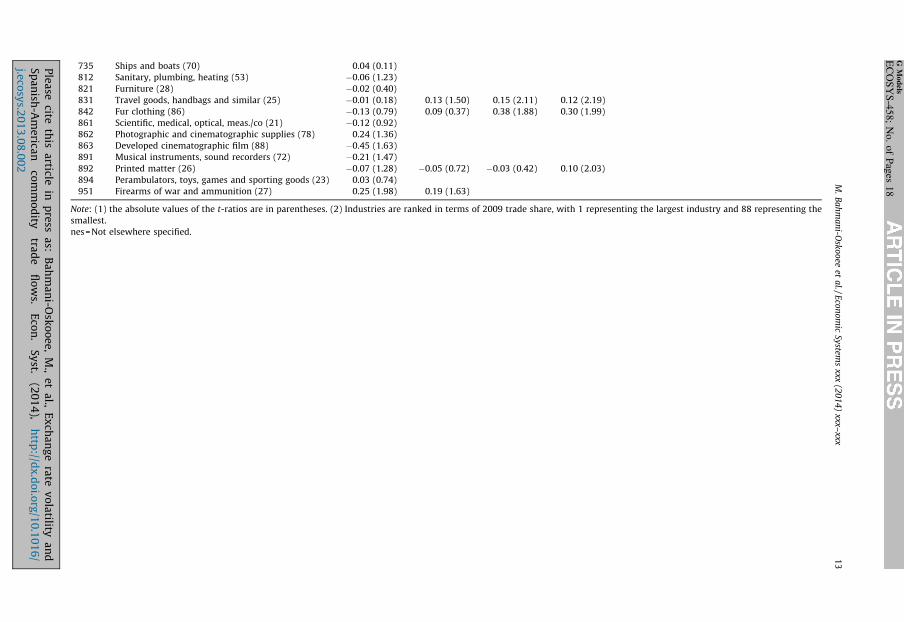
Exchange rate volatility also has less of an effect in the long run for Spanish exports to the UnitedStates than was shown for American exports to Spain. Only slightly more than one third of the 37cointegrated industries have significant coefficients: three are positive and eleven are negative. Again,this highlights the idea that signs do not necessarily have to be negative, although they are for themajority of these 14 industries. We will discuss the characteristics of these commodities below.
Diagnostic statistics for the export and import specifications are provided in Tables 4 and 5,respectively. The statistics for the Lagrange multiplier serial correlation test and the RESETspecification test are generally low, showing that these models are well-specified. In addition, weperform the CUSUM and CUSUM-squared tests for residual stability.4 Most industry specifications areindeed stable. Finally, high adjusted R-squared values indicate that the model has good explanatorypower. Following the literature, we include all industries in our analysis rather than employ athreshold for R-squared below which reject our model.
Next, we examine the specific results to see whether there is a pattern behind which industries hadsignificant positive or negative long-run volatility coefficients. We do this by considering the industrytrade shares, which are given as percentages in Table 1 and as ranks in Tables 2 and 3. The largestindustry is ranked 1, whilst the smallest industry is ranked 131 for exports and 88 for imports.
Of the 131 U.S. export industries, 11 have positive long-run volatility coefficients. The largest ofthese is Aircraft, followed by medical equipment (industry code 726). These are ranked #17 and #18,respectively, so they are in the largest 15 percent of industries. On the other hand, the smallestindustry (wool and other animal hair) is included among those with positive coefficients, as are thosethat are ranked #100, #110, and #125. We can conclude that smaller industries might be more likelyto respond positively due to exchange rate volatility. This is because they might hope to exploitexchange rate movements to make additional profits in a way that larger corporations do not. Inaddition, Aircraft is not ‘‘typical,’’ given the nature of the industry’s state support and the lack of closesubstitutes.
Some of the larger industries respond negatively: machinery and appliances-non electrical (ranked#3), organic chemicals (#5), electric power machinery (#10), and road motor vehicles (#11). These areclearly among the top 10 percent in terms of trade share. Even though a number of ‘‘small’’ industriesare also included (floor coverings, tapestries, etc. is ranked #117), there seem to be more very largeindustries than very small ones.
It is important to note that, in total, only 35 of the 131 U.S. export industries show any long-runresponse at all. Many of the largest industries (such as the largest two industries, Medicinal &pharmaceutical products, and Petroleum products) are among the 96 that do not. It is also clear thatboth durable and nondurable goods can be found among those industries that respond positively,those that respond negatively, and those that do not respond at all. As a result, we can conclude thatthese industry characteristics do not explain which industries are most affected by exchange ratevariability, except that small and/or very specialized industries are more likely to respond positively.
4 These tests are further explained by Bahmani-Oskooee and Ardalani (2006), Bahmani-Oskooee and Wang (2007), Bahmani-
Oskooee and Hegerty (2009a,b), and Bahmani-Oskooee et al. (2010).
Please cite this article in press as: Bahmani-Oskooee, M., et al., Exchange rate volatility andSpanish-American commodity trade flows. Econ. Syst. (2014), http://dx.doi.org/10.1016/j.ecosys.2013.08.002
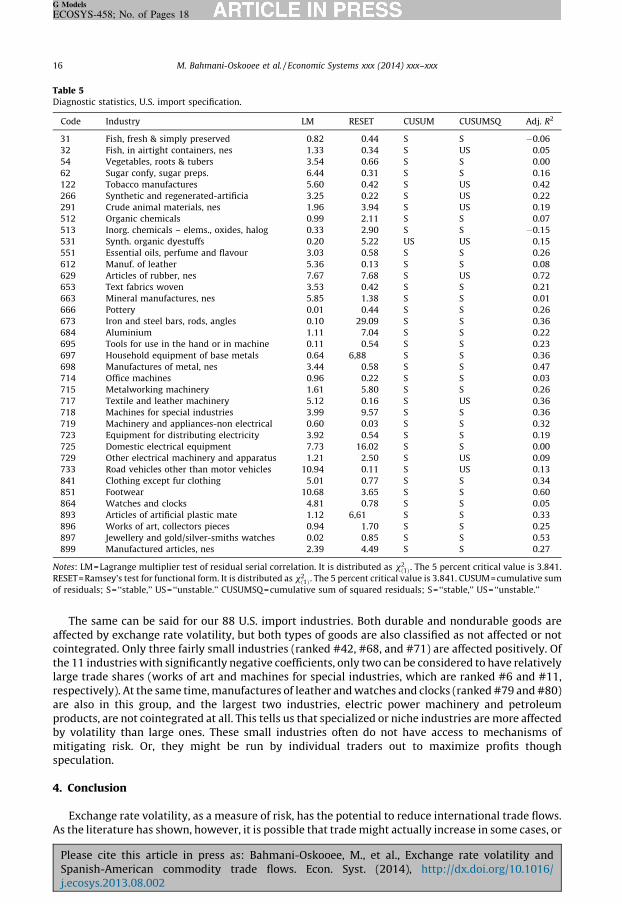
Table 5Diagnostic statistics, U.S. import specification.
Code Industry LM RESET CUSUM CUSUMSQ Adj. R2
31 Fish, fresh & simply preserved 0.82 0.44 S S �0.06
32 Fish, in airtight containers, nes 1.33 0.34 S US 0.05
54 Vegetables, roots & tubers 3.54 0.66 S S 0.00
62 Sugar confy, sugar preps. 6.44 0.31 S S 0.16
122 Tobacco manufactures 5.60 0.42 S US 0.42
266 Synthetic and regenerated-artificia 3.25 0.22 S US 0.22
291 Crude animal materials, nes 1.96 3.94 S US 0.19
512 Organic chemicals 0.99 2.11 S S 0.07
513 Inorg. chemicals – elems., oxides, halog 0.33 2.90 S S �0.15
531 Synth. organic dyestuffs 0.20 5.22 US US 0.15
551 Essential oils, perfume and flavour 3.03 0.58 S S 0.26
612 Manuf. of leather 5.36 0.13 S S 0.08
629 Articles of rubber, nes 7.67 7.68 S US 0.72
653 Text fabrics woven 3.53 0.42 S S 0.21
663 Mineral manufactures, nes 5.85 1.38 S S 0.01
666 Pottery 0.01 0.44 S S 0.26
673 Iron and steel bars, rods, angles 0.10 29.09 S S 0.36
684 Aluminium 1.11 7.04 S S 0.22
695 Tools for use in the hand or in machine 0.11 0.54 S S 0.23
697 Household equipment of base metals 0.64 6,88 S S 0.36
698 Manufactures of metal, nes 3.44 0.58 S S 0.47
714 Office machines 0.96 0.22 S S 0.03
715 Metalworking machinery 1.61 5.80 S S 0.26
717 Textile and leather machinery 5.12 0.16 S US 0.36
718 Machines for special industries 3.99 9.57 S S 0.36
719 Machinery and appliances-non electrical 0.60 0.03 S S 0.32
723 Equipment for distributing electricity 3.92 0.54 S S 0.19
725 Domestic electrical equipment 7.73 16.02 S S 0.00
729 Other electrical machinery and apparatus 1.21 2.50 S US 0.09
733 Road vehicles other than motor vehicles 10.94 0.11 S US 0.13
841 Clothing except fur clothing 5.01 0.77 S S 0.34
851 Footwear 10.68 3.65 S S 0.60
864 Watches and clocks 4.81 0.78 S S 0.05
893 Articles of artificial plastic mate 1.12 6,61 S S 0.33
896 Works of art, collectors pieces 0.94 1.70 S S 0.25
897 Jewellery and gold/silver-smiths watches 0.02 0.85 S S 0.53
899 Manufactured articles, nes 2.39 4.49 S S 0.27
Notes: LM=Lagrange multiplier test of residual serial correlation. It is distributed as x2ð1Þ . The 5 percent critical value is 3.841.
RESET=Ramsey’s test for functional form. It is distributed as x2ð1Þ . The 5 percent critical value is 3.841. CUSUM=cumulative sum
of residuals; S= ‘‘stable,’’ US=‘‘unstable.’’ CUSUMSQ=cumulative sum of squared residuals; S= ‘‘stable,’’ US=‘‘unstable.’’
M. Bahmani-Oskooee et al. / Economic Systems xxx (2014) xxx–xxx16
G Models
ECOSYS-458; No. of Pages 18
The same can be said for our 88 U.S. import industries. Both durable and nondurable goods areaffected by exchange rate volatility, but both types of goods are also classified as not affected or notcointegrated. Only three fairly small industries (ranked #42, #68, and #71) are affected positively. Ofthe 11 industries with significantly negative coefficients, only two can be considered to have relativelylarge trade shares (works of art and machines for special industries, which are ranked #6 and #11,respectively). At the same time, manufactures of leather and watches and clocks (ranked #79 and #80)are also in this group, and the largest two industries, electric power machinery and petroleumproducts, are not cointegrated at all. This tells us that specialized or niche industries are more affectedby volatility than large ones. These small industries often do not have access to mechanisms ofmitigating risk. Or, they might be run by individual traders out to maximize profits thoughspeculation.
4. Conclusion
Exchange rate volatility, as a measure of risk, has the potential to reduce international trade flows.As the literature has shown, however, it is possible that trade might actually increase in some cases, or
Please cite this article in press as: Bahmani-Oskooee, M., et al., Exchange rate volatility andSpanish-American commodity trade flows. Econ. Syst. (2014), http://dx.doi.org/10.1016/j.ecosys.2013.08.002

M. Bahmani-Oskooee et al. / Economic Systems xxx (2014) xxx–xxx 17
G Models
ECOSYS-458; No. of Pages 18
that there might be no impact at all. As a result, it is necessary to test these effects empirically, and anumber of recent studies have done so for various country pairs—particularly for individualcommodities. This study adds to this branch of the literature by examining trade between the UnitedStates and Spain, for 131 U.S. export industries and 88 import industries.
Applying cointegration analysis to a dataset that spans the period from 1962 to 2009, we test eachindustry’s exports and/or imports individually and arrive at a number of interesting results. First,exchange rate volatility has significant short-run effects in roughly half of the industries, which isfewer than has been found for some other country pairs. The long-run effects are weaker as well:cointegration is established for only 74 of 131 export industries and 37 of 88 import industries. Ofthose that do show evidence of a long-run relationship among the explanatory variables (income, thereal exchange rate, and volatility), income and the relative price are significant and of the expectedsign in about half the cases. Secondly, U.S. exports seem to show more of a response to exchange ratevolatility than do Spanish exports.
The long-run impact of exchange rate volatility—the main focus of our study—is in line with theresults of earlier industry-level studies. Of the 74 cointegrated U.S. export industries, 11 have positivecoefficients, whilst 24 respond negatively. The remaining majority are not affected. Likewise, we findthree positive coefficients and 11 negative ones out of 37 cointegrated import industries. Thisconfirms the idea that volatility effects are not uniformly negative.
We then consider whether two types of industry characteristics—durable vs. nondurable goods andrelative industry trade share—might help explain which industries have which effect. We see no clearevidence for the former, since both durable and nondurable goods show widely varying responses.There may be some support for the finding that smaller industries might be more likely to respondpositively to exchange rate volatility, however. This suggests that specialized or ‘‘niche’’ goods mightsee trade flows increase in the face of exchange rate uncertainty.
Appendix. Data definitions and sources
All data are annual (1962–2009) and are collected from the following sources:
(a) T
PlSpj.e
he World Bank.
(b) T he International Financial Statistics of the IMF.Variables (all in natural logs):VX=For each industry i, VX is defined as the (log) volume of U.S. exports to Spain. Export value data
in U.S. dollars for each commodity come from source a. In the absence of annual price levels for eachcommodity, we follow Bahmani-Oskooee and Hegerty (2009a) and deflate each industry’s trade valueby the U.S. export unit value (source b).
VM=For each industry i, VM is defined as the (log) volume of U.S. imports from Spain. Import valuedata in U.S. dollars for each commodity comes from source a. Again, in the absence of annual price levelsfor each commodity, we deflate each industry’s trade value by Spain’s import unit value (source b).
YSpain =Spanish real GDP. The data come from source b.YUS =U.S. real GDP, source b.
REX=real bilateral exchange rate between the Spanish peseta and the dollar, defined asCPIS pain�NEX
CPIUS
� �, where CPI is the Consumer Price Index. NEX is the nominal bilateral exchange rate
defined as number of pesetas per dollar. Thus, an increase in REX reflects a real depreciation of Spain’scurrency. Beginning in 1999, the Euro/dollar nominal rate is converted to pesetas at the rate of 166.386pesetas per Euro. All these variables come from source b.
VOL=volatility measure of the real bilateral exchange rate (REX). Following Bahmani-Oskooee andHegerty (2009a), it is the (log) standard deviation of the 12 monthly real exchange rate (REX) valueswithin that year. Monthly CPI and nominal exchange rate data come from source b.
ease cite this article in press as: Bahmani-Oskooee, M., et al., Exchange rate volatility andanish-American commodity trade flows. Econ. Syst. (2014), http://dx.doi.org/10.1016/cosys.2013.08.002
M. Bahmani-Oskooee et al. / Economic Systems xxx (2014) xxx–xxx18
G Models
ECOSYS-458; No. of Pages 18
References
Arize, A.C., 1998. The long-run relationship between import flows and real exchange-rate volatility: the experience of eightEuropean economies. International Review of Economics and Finance 7 (4) 417–435.
Bahmani-Oskooee, M., Ardalani, Z., 2006. Exchange rate sensitivity of US trade flows: evidence from industry data. SouthernEconomic Journal 72, 542–559.
Bahmani-Oskooee, M., Hegerty, S.W., 2007. Exchange rate volatility and trade flows: a review article. Journal of EconomicStudies 34, 211–255.
Bahmani-Oskooee, M., Wang, Y., 2007. Impact of exchange rate volatility on commodity trade between U.S. and China.Economic Issues 12, 31–54.
Bahmani-Oskooee, M., Tanku, A., 2008. The black market exchange rate vs. the official rate in testing PPP: which rate fosters theadjustment process. Economics Letters 99, 40–43.
Bahmani-Oskooee, M., Gelan, A., 2009. How stable is the demand for money in African countries. Journal of Economic Studies 36,216–235.
Bahmani-Oskooee, M., Hegerty, S.W., 2009a. The effects of exchange-rate volatility on commodity trade between the U. S. andMexico. Southern Economic Journal 79, 1019–1044.
Bahmani-Oskooee, M., Hegerty, S.W., 2009b. Exchange-rate risk and U.S.–Japan trade: evidence from industry level data. Journalof the Japanese and International Economies 22 (4) 518–534.
Bahmani-Oskooee, M., Economidou, C., Goswami, G.G., 2005. How sensitive are Britain’s inpayments and outpayments to thevalue of the British pound. Journal of Economic Studies 32, 455–467.
Bahmani-Oskooee, M., Ardalani, Z., Bolhassani, M., 2010. Exchange-rate volatility and U.S. commodity trade with the rest of theworld. International Review of Applied Economics 24, 511–532.
Chen, S.-W., Chen, T.-C., 2012. Untangling the non-linear causal nexus between exchange rates and stock prices: new evidencefrom the OECD countries. Journal of Economic Studies 39, 231–259.
De Vita, G., Kyaw, K.S., 2008. Determinants of capital flows to developing countries: a structural VAR analysis. Journal ofEconomic Studies 35, 304–322.
Halicioglu, F., 2007. The J-curve dynamics of Turkish bilateral trade: a cointegration approach. Journal of Economic Studies 34,103–119.
McKenzie, M.D., 1999. The impact of exchange rate volatility on international trade flows. Journal of Economic Surveys 13, 71–104.
Mohammadi, H., Cak, M., Cak, D., 2008. Wagner’s hypothesis: new evidence from Turkey using the bounds testing approach.Journal of Economic Studies 35, 94–106.
Narayan, P.K., 2005. The saving and investment nexus for China: evidence from cointegration tests. Applied Economics 37,1979–1990.
Narayan, P.K., Narayan, S., Prasad, B.C., Prasad, A., 2007. Export-led growth hypothesis: evidence from Papua New Guinea andFiji. Journal of Economic Studies 34, 341–351.
Payne, J.E., 2008. Inflation and inflation uncertainty: evidence from the Caribbean region. Journal of Economic Studies 35, 501–511.
Pesaran, M.H., Shin, Y., Smith, R.J., 2001. Bounds testing approaches to the analysis of level relationships. Journal of AppliedEconometrics 16, 289–326.
Tang, T.C., 2007. Money demand function for Southeast Asian countries: an empirical view from expenditure components.Journal of Economic Studies 34, 476–496.
Thursby, J.G., Thursby, M., 1985. The uncertainty effects of floating exchange rates: empirical evidence on international tradeflows. In: Arndt, S.W., Sweeney, R.J., Willett, T.D. (Eds.), Exchange Rates, Trade and the US Economy. Ballinger, Cambridge,MA.
Wong, K.N., Tang, T.C., 2008. The effects of exchange rate variability on Malaysia’s disaggregated electrical exports. Journal ofEconomic Studies 35, 154–169.
Please cite this article in press as: Bahmani-Oskooee, M., et al., Exchange rate volatility andSpanish-American commodity trade flows. Econ. Syst. (2014), http://dx.doi.org/10.1016/j.ecosys.2013.08.002