excellence mapping: bibliometric study of the productivity ... · 6.3.3 results for the indicator...
TRANSCRIPT

A2 – Planning, Evaluation and Knowledge Management Unit Page 1
EUROPEAN COMMISSION JOINT RESEARCH CENTRE Policy Support Coordination
Planning, Evaluation and Knowledge Management
Excellence Mapping:
Bibliometric study of the productivity and the impact of scientific publications of the JRC
Mapping of scientific areas and application areas
Volume 1
General analysis and benchmarking Report prepared by: Mihaela Bobeica, Guy Bordin, Grazia Federico, Mayya Hristova and Vera Calenbuhr; JRC.A2 Planning, Evaluation and Knowledge Management October 2014

A2 – Planning, Evaluation and Knowledge Management Unit Page 2
Table of Contents 1 Executive Summary ................................................................................................................ 4
2 Introduction ........................................................................................................................... 7
3 General methodological notes ................................................................................................ 8
4 General overview of JRC publication and citation statistics .................................................... 10
5 JRC publication and citation statistics according to scientific area (level 2) and JRC Multi-
Annual Work Programme project cluster ...................................................................................... 13
5.1 Results: Number of publications and citations per scientific area ....................................... 13
5.2 JRC publication statistics according to the JRC Multi-Annual Work Programme project
clusters .............................................................................................................................................. 14
5.2.1 Specific methodological notes ...................................................................................... 14
5.2.2 Results ........................................................................................................................... 15
5.3 JRC publication statistics according to scientific area (level 2) and JRC MAWP project
cluster 16
5.3.1 Specific methodological notes ...................................................................................... 16
5.3.2 Results ........................................................................................................................... 16
6 Benchmarking of institutions according to scientific area ...................................................... 21
6.1 Specific methodological notes .............................................................................................. 21
6.1.1 Indicators to be used .................................................................................................... 21
6.1.2 The choice of the reference sample of organisations ................................................... 23
6.1.3 The choice of relevance levels ...................................................................................... 24
6.2 Procedure of the benchmarking analysis .............................................................................. 25
6.3 Level 2 benchmarking results ............................................................................................... 26
6.3.1 Results for the indicator 'Number of citations per publication' ................................... 26
6.3.2 Results for the indicator 'Cited publications (in percent)' ............................................ 26
6.3.3 Results for the indicator 'Field-weighted citation impact' ............................................ 27
6.3.4 Results for the indicator 'Publications in the top 10% of the most cited publications' 28
6.3.5 Results for the indicator Publications in the top 10% of the most cited journals ........ 29
6.4 Level 2 normalised benchmarking results ............................................................................ 30
6.5 Summary of level 2 benchmarking results ............................................................................ 36
6.5.1 Summary of level 2 benchmarking results against world average ............................... 36
6.5.2 Summary of level 2 benchmarking results against Top-15 ........................................... 38
6.5.3 Global summary of level 2 benchmarking results against world average and Top-15
organisations ................................................................................................................................. 41
6.6 Level 3 benchmarking results ............................................................................................... 42
A2 – Planning, Evaluation and Knowledge Management Unit Page 3
6.6.1 Specific methodological notes ...................................................................................... 42
7 Acknowledgements ............................................................................................................... 44
8 Sources ................................................................................................................................. 44
9 Literature .............................................................................................................................. 44
10 Annex 1: Comparison of the Thomson Reuters Report and the Excellence Mapping .............. 45
11 Annex 2: Further graphs for the analysis of JRC publication statistics according to scientific
areas (level 2) and JRC MAWP project clusters .............................................................................. 47
12 Annex 3: Data for level 2 benchmarking ................................................................................ 51
13 Annex 4: Further graphs for level 2 benchmarking results ..................................................... 77
14 Annex 5: Further graphs of level 2 normalised benchmarking results..................................... 79
15 Annex 6: Further graphs for level 3 benchmarking results ..................................................... 83
A2 – Planning, Evaluation and Knowledge Management Unit Page 4
1 Executive Summary
The present report analyses the productivity and the impact of the JRC in specific scientific areas by
means of 'publications-' and 'citations-' analysis in order to identify and map areas of excellence. The
excellence mapping is part of a wider effort to produce the evidence base for the following
purposes:
- the ex-post evaluation of the Framework Programme (FP) 7 (both nuclear and non-nuclear);
- strategic work programme planning (e.g. input for ex-ante evaluation thereby closing the
annual planning, reporting and evaluation cycle) ;
- the design of a long term JRC scientific strategy
The report builds on and complements internal publication impact- and collaboration- studies
carried out in 2013 as well as a bibliometric study of JRC results carried out by Thomson Reuter in
2014. With the present report the JRC proposes a study of an analytic scope and depth
unprecedented so far for the organisation.
The Excellence Mapping is structured in two volumes, with the first volume concentrating on
benchmarking of scientific publications and the second on aspects of scientific collaboration.
The report provides the reader with answers to the following questions:
1. What is the number of publications, by scientific area/sub-area produced by the JRC in the
period 2009-2013 and the number of citations received by these publications: Chapter 4 and
Section 5.1;
2. What are the number and proportion of publications for the period 2009-2013, by scientific
area and by JRC Multi-Annual Work Programme cluster: Sections 5.2 and 5.3;
3. How does the JRC compare with peer institutions, in terms of citations numbers i.e. impact
in each scientific area/sub-area. The results of this benchmarking are presented in three
different perspectives in Chapter 6.
The JRC's evaluation portfolio has well developed analyses of policy-support productivity and impact
as well as of scientific productivity. Results are obtained annually through the Periodic Action Review
and published in the JRC Productivity and Impact Review. This report complements these analyses
with the first in-depth assessment of JRC's scientific impact.
The principal data sources for the excellence mapping are Elsevier's Scopus® database and the
associated analytical tool SciVal®. Scopus/SciVal® is the largest available citations and abstract
database of peer-reviewed scientific literature. The Scopus/SciVal® database and analytical tool
group results into scientific areas: articles published in a journal that belongs to a particular scientific
area are considered to be an article in this specific scientific area. Moreover, journals can belong to
more than one scientific area, and hence, an article can also belong to more than one scientific area.
Thus, statistics in this report may have a total greater than 100%.
Scopus/SciVal® use three hierarchical levels for the scientific areas of which the levels 2 (with 27
scientific areas) and 3 (334 scientific areas) are relevant for the present analysis. These scientific
areas are widely used in an international context, allowing the comparison and benchmarking of JRC
scientific performance.

A2 – Planning, Evaluation and Knowledge Management Unit Page 5
The general analysis in this report focuses on level 2 (see Chapter 5). Levels 2 and 3 are used in the
context of the benchmarking and collaboration analysis (see Chapter 6, Annexes 3-6 and volume 2).
In the scientific areas that were selected for the level 2 analysis, the JRC has produced at least 100
publications between 2009-2013.
The analyses are performed for the JRC publications as a whole, as well as broken down according to
scientific areas of the 2nd and 3rd levels on the one hand, and JRC MAWP clusters on the other hand.
This allows the identification of areas of excellence, to be understood as scientific areas and areas of
application with high publication activity and/or citations. This topical approach reveals the most
cited scientific topics by virtue of their appreciation in the scientific community.
In the period 2009-2013, the JRC has produced nearly 5000 publications out of which around two
thirds are articles, whereas the other one third contains book chapters, books, reports, etc.,
following an increasing trend (see Figure 1). Both, numbers and trend are comparable to the
numbers derived from PUBSY.
Generally, not more than three percent of JRC publications per year belong to the top 1% most cited
publications. Yet, between 40% and 50% of the JRC publications per year belong to the top 25%
most cited publications.
The ten most important JRC scientific areas in terms of absolute citations are 'Environmental
Science', 'Earth and Planetary Science', 'Physics and Astronomy', 'Agricultural and Biological
Sciences', 'Engineering', 'Chemistry', 'Energy', 'Material Science', 'Pharmacology, Toxicology and
Pharmaceutics', and 'Biochemistry, Genetics and Molecular Biology' (see e.g. Section 5.1).
Around every second peer-reviewed article relates to one of the seven clusters 'EC support
programme to IAEA safeguards', 'Biodiversity and ecosystem services', 'Education and training', 'EU
Reference Laboratories and EU Reference Centres – quality of measurements and standardisation',
'Climate change impacts, vulnerability and adaptation', 'Nuclear emergency preparedness and
response', 'Exposure and risk assessment – human and environmental toxicology' (see Figure 6 and
Figure 7).
For the benchmarking of JRC's publication impact, five indicators based on citations and size-
independent metrics were used:
- Average number of citations per publication;
- Cited publications (in percent);
- Field-weighted citation impact;
- Publications (in percent) in the top 10% of the most cited publications;
- Publications (in percent) in the top 10% of the most cited journals.
On the basis of these indicators, the JRC's citation performance has been benchmarked against the
Top-15 organisations world-wide having the highest number in a given scientific area, and against
the world average. The purpose of this report was to map JRC's scientific excellence. The concept of
'map' is appropriate since there are no simple results. To appreciate, both the complexity and the
detail of JRC's scientific excellence one needs to appreciate the richness of the graphs in the report

A2 – Planning, Evaluation and Knowledge Management Unit Page 6
in the benchmarking Chapter 6. Nevertheless, there are some conclusions to be drawn from this
mapping exercise.
The absolute number of JRC's publication in a given scientific area is comparatively low. Yet,
looking at the impact of JRC's scientific work using citations in size-independent metrics, shows
that the JRC is amongst the best of the world in many scientific areas.
In most of the 17 scientific areas of level 2 in which the JRC had more than 100 publications
between 2009-2013 the JRC's performance is equal to or better than the world average. In many
of these areas the indicator values for JRC are in the range of the Top-15 organisations and for a
few scientific areas the JRC arrives at the top (see Table 4). For example, in the scientific area of
'Pharmacology, Toxicology and Pharmaceutics', the JRC's ‘Average number of citations per
publication’ is number one in the Top-15 reference set. Same for the scientific area of
'Agriculture and Biological Sciences' where the JRC's value of the 'Field-weighted citation impact'
is first rank of the Top-15 reference organisations.
There are scientific areas where the JRC produces a relatively low number of publications, but
these publications have a high impact. For example, in the area of 'Pharmacology, Toxicology
and Pharmaceutics', the JRC produced 251 publications, which ranks 595 out of 4301
institutions. However, in terms of 'Average number of citations per publication' (Section 6.3.1)
and 'Cited publications' (Section 6.3.2) the JRC has values above the Top-15 reference set. For
the scientific areas 'Medicine' and 'Biochemistry, Genetics and Molecular Biology' the JRC values
of the latter indicator exceeds the ones of any of the Top-15 reference organisations as well.
If the JRC compares overall with the best in the world in a given scientific areas of level 2, there
may still be one or even a few scientific sub-areas at more detailed level 3, where the JRC is less
strong and may have a performance below world average.
The Excellence Mapping and the Thomson Reuters study are complementary, with the former
one going more into an in-depth analysis and the later one with a broader scope including also
patents and social media analysis. Both have an overlapping time window of analysis, i.e. 2009-
2013 and 2007-2013, respectively, where the shorter time span for the excellence mapping is
due to the current design of Scopus/SciVal®. Where comparison is possible, the results of both
studies are coherent.

A2 – Planning, Evaluation and Knowledge Management Unit Page 7
2 Introduction
The present report analyses the productivity and the impact of the JRC in specific scientific areas by
means of 'publications-' and 'citations-' analysis in order to identify and map areas of excellence. The
excellence mapping is part of a wider effort to produce the evidence base for the following
purposes:
- the ex-post evaluation of the Framework Programme (FP) 7 (both nuclear and non-nuclear);
- strategic work programme planning (e.g. input for ex-ante evaluation thereby closing the
annual planning, reporting and evaluation cycle) ;
- the design of a long term JRC scientific strategy
The report builds on and complements internal publication impact1- and collaboration2- studies
carried out in 2013 as well as a bibliometric study of JRC results carried out by Thomson Reuter3 in
2014. With the present report the JRC proposes a study of an analytic scope and depth
unprecedented so far for the organisation.
The Excellence Mapping is structured in two volumes, with the first volume concentrating on
benchmarking of scientific publications and the second on aspects of scientific collaboration.
Information provided by the report: Each chapter of the present analysis provides the reader with
answers to one or several of the following questions:
1. What is the number of publications, by scientific area/sub-area produced by the JRC in the
period 2009-2013 and the number of citations received by these publications: Chapter 4 and
Section 5.1;
2. What are the number and proportion of publications for the period 2009-2013, by scientific
area and by JRC Multi-Annual Work Programme cluster: Sections 5.2 and 5.3;
3. How does the JRC compare with peer institutions, in terms of citations numbers i.e. impact
in each scientific area/sub-area. The results of this benchmarking are presented in three
different perspectives in Chapter 6.
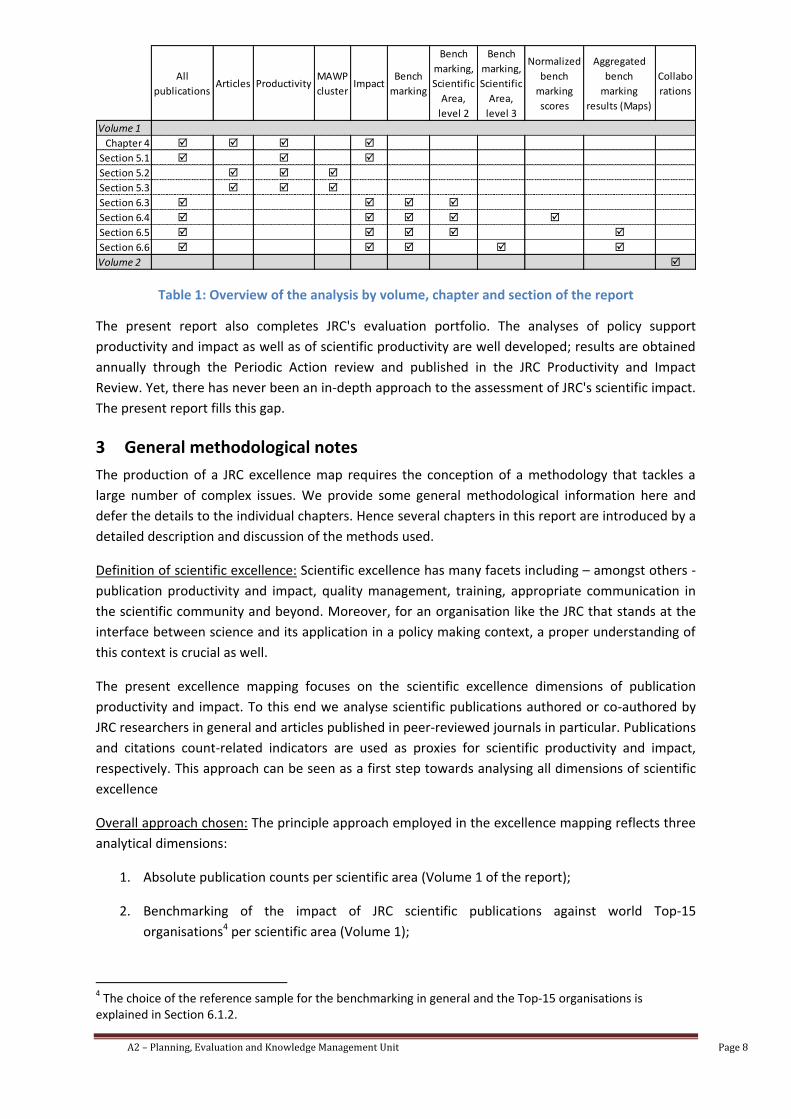
The following Table 1 displays an overview of the analysis performed by volume, chapter and section
of the report.
1 Dissemination of JRC scientific results. European Commission – Joint Research Centre. 2013 2 JRC collaborations with universities from EU-28 Member States at the level of co-authored scientific peer reviewed
articles. .European Commission – Joint Research Centre. 2013 3 Evaluation of the Research Performance of the Joint Research Centre of the European Commission during the 7th Framework Programme (2007-2013). Thomson Reuter, 2014
A2 – Planning, Evaluation and Knowledge Management Unit Page 8
Table 1: Overview of the analysis by volume, chapter and section of the report
The present report also completes JRC's evaluation portfolio. The analyses of policy support
productivity and impact as well as of scientific productivity are well developed; results are obtained
annually through the Periodic Action review and published in the JRC Productivity and Impact
Review. Yet, there has never been an in-depth approach to the assessment of JRC's scientific impact.
The present report fills this gap.
3 General methodological notes
The production of a JRC excellence map requires the conception of a methodology that tackles a
large number of complex issues. We provide some general methodological information here and
defer the details to the individual chapters. Hence several chapters in this report are introduced by a
detailed description and discussion of the methods used.
Definition of scientific excellence: Scientific excellence has many facets including – amongst others -
publication productivity and impact, quality management, training, appropriate communication in
the scientific community and beyond. Moreover, for an organisation like the JRC that stands at the
interface between science and its application in a policy making context, a proper understanding of
this context is crucial as well.
The present excellence mapping focuses on the scientific excellence dimensions of publication
productivity and impact. To this end we analyse scientific publications authored or co-authored by
JRC researchers in general and articles published in peer-reviewed journals in particular. Publications
and citations count-related indicators are used as proxies for scientific productivity and impact,
respectively. This approach can be seen as a first step towards analysing all dimensions of scientific
excellence
Overall approach chosen: The principle approach employed in the excellence mapping reflects three
analytical dimensions:
1. Absolute publication counts per scientific area (Volume 1 of the report);
2. Benchmarking of the impact of JRC scientific publications against world Top-15
organisations4 per scientific area (Volume 1);
4 The choice of the reference sample for the benchmarking in general and the Top-15 organisations is explained in Section 6.1.2.
All
publicationsArticles Productivity
MAWP
clusterImpact
Bench
marking
Bench
marking,
Scientific
Area,
level 2
Bench
marking,
Scientific
Area,
level 3
Normalized
bench
marking
scores
Aggregated
bench
marking
results (Maps)
Collabo
rations
Volume 1
Chapter 4
Section 5.1
Section 5.2
Section 5.3
Section 6.3
Section 6.4
Section 6.5
Section 6.6
Volume 2

A2 – Planning, Evaluation and Knowledge Management Unit Page 9
3. A collaboration analysis addressing the questions to what degree the JRC works with the
best organisations world-wide (Volume 2).
For the benchmarking and the collaborations analysis citations are the main criterion.
Data sources: The principal data sources for the excellence mapping are Elsevier's Scopus database
and the associated analytical tool SciVal®. Scopus is the largest available citations and abstract
database of peer-reviewed scientific literature.
The bibliometric study performed by Thomson Reuters (see introduction) used the Thomson Reuters
database underlying the Thomson Reuters Web of Science research platform - one of the largest
scientific databases. Most publications including the JRC's are present in both systems, i.e. Web of
Science and Scopus/SciVal®. Yet, the thematic structure of the information is different. The
complementarities between the present excellence mapping and the Thomson Reuters report are
discussed in Annex 1.
Scientific areas and areas of application: The JRC works and publishes in a large number of scientific
disciplines, often in an inter-disciplinary manner. Since, publication and citation statistics differ
widely according to scientific disciplines, the JRC's wide range of research and publication activities
poses constraints on the interpretation of results. The present study surmounts this challenge by
using a 'topical approach' based on the scientific areas according to which Elsevier's Scopus/SciVal®
database and analytical tool group results: in essence, articles published in a journal that belongs to
the scientific area 'Materials Science' are considered to be an article on 'Materials Science'.
Moreover, journals can belong to more than one scientific area, and hence, an article can also
belong to more than one scientific area. This means that statistics in this report may have a total
greater than 100%.
Scopus/SciVal® use three hierarchical levels for the scientific areas. The first level includes the four
overarching scientific areas, Life Sciences, Social Sciences, Physical Sciences and Health Sciences. The
second level has 27 scientific areas, which are broken down further into 334 scientific areas of the
third level.
These scientific areas are widely used in an international context, allowing the comparison and
benchmarking of JRC scientific performance.
Since the four level-1 scientific areas are considered too broad, the general analysis in this report will
focus on level 2 (see Chapter 5). Levels 2 and 3 will be used in the context of the benchmarking and
collaboration analysis (see Chapter 6, Annexes 3-6 and volume 2).
Besides the scientific areas, a further concept structuring data will be used: application areas. The
concept of application area relates to JRC categories such as the clusters of the new JRC Multi-
annual Work Programme (MAWP).
In this report, the analysis is performed for the JRC publications as a whole, as well as broken down
according to scientific areas of the 2nd and 3rd levels on the one hand, and JRC MAWP clusters on
the other hand. This way, areas of excellence to be understood as scientific areas and areas of
application with high publication activity and/or citations can be identified. Based on this topical
approach, the analysis presented here identifies the most cited scientific topics by virtue of their
appreciation in the scientific community.
A2 – Planning, Evaluation and Knowledge Management Unit Page 10
Levels of relevance: The JRC publishes in 26 out of the 27 scientific areas of level 2 and in many of
the level 3 (235 out of 334 in total). However, and in particular at the level 3, the number of
publications in a given scientific area may be very small. As is explained below (Chapter 6), relevance
thresholds were introduced in order to be able to focus on scientific areas in which the JRC is most
active. Since a given publication can generally be found in more than one scientific area, this
approach does not constrain the scope of the analysis.
Document types analysed: Scopus/SciVal® considers the following types of publications: peer-
reviewed journals, conference papers, books, trade publications.
'Articles' as defined in the JRC core indicator 'Peer-reviewed article' are a sub-type of 'publications'
and they represent over two thirds of the entire 'publications' population of the present analysis.
Yet, the expression 'peer-reviewed article' as such does not exist in Scopus/SciVal®.
Data extraction: Data for the analysis have been extracted from Scopus database and SciVal®
(accessible from http://www.scopus.com and https://scival.com/home) during the months of June-
September 2014. The analysis covers publications and citations during the period 2009-2013
resulting in a total of almost 5000 publications. This time window covers five out of seven years of
the duration of FP7, and its use is due to the fact that Elsevier's analytical tool SciVal® provides the
required citation information as well as certain statistical tools and indicators only for the
abovementioned period.
Further methodological information will be provided in the respective chapters below.
4 General overview of JRC publication and citation statistics
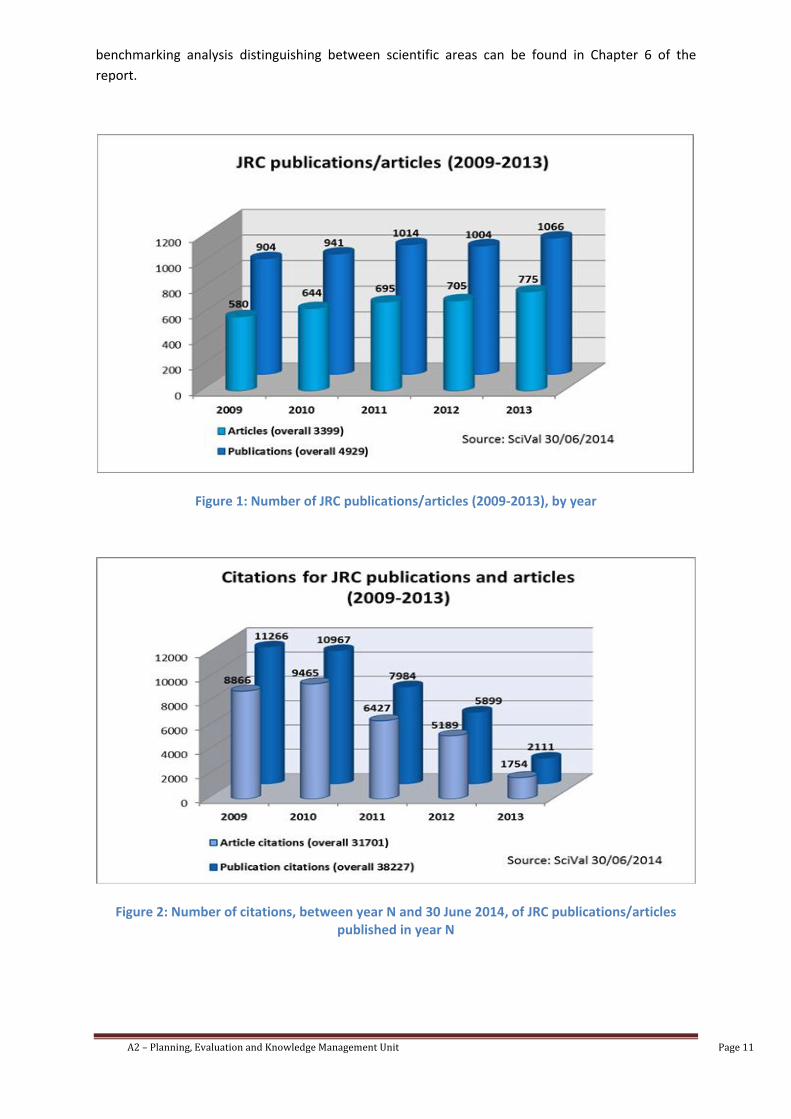
In the period 2009-2013, the JRC has produced nearly 5000 publications out of which roughly two
thirds are articles, whereas the other third contains book chapters, books, reports, etc., following an
increasing trend (see Figure 1). Both, numbers and trend are comparable to the numbers derived
from PUBSY5.
Figure 2 displays the total number of citations received since publication, up to the date of this
analysis (i.e. the export of the data from Scopus in June 2014). It can be noted that older
publications tend logically to have more citations than newer publications, reflecting the fact that
they had the possibility to be quoted during a longer time span compared to more recent
publications. This figure also displays clearly that articles are by far much more cited than the other
scientific publications and should then further develop as main channel for diffusing scientific results
to the research community.
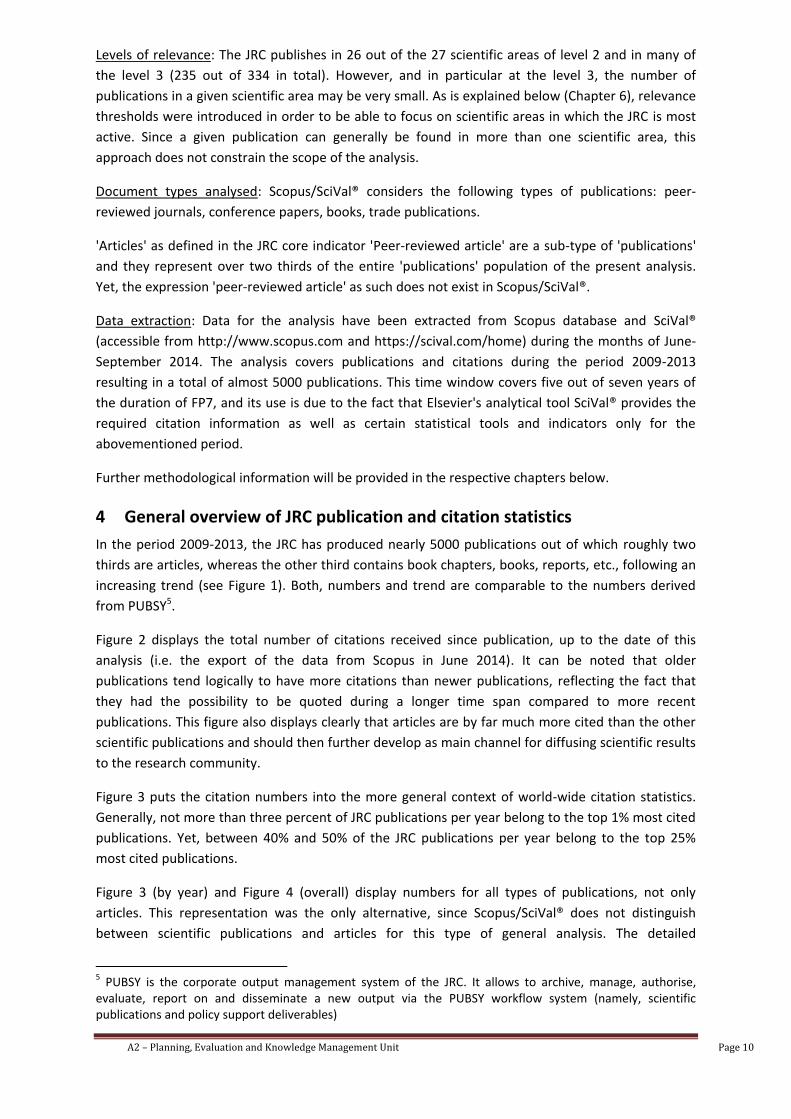
Figure 3 puts the citation numbers into the more general context of world-wide citation statistics.
Generally, not more than three percent of JRC publications per year belong to the top 1% most cited
publications. Yet, between 40% and 50% of the JRC publications per year belong to the top 25%
most cited publications.
Figure 3 (by year) and Figure 4 (overall) display numbers for all types of publications, not only
articles. This representation was the only alternative, since Scopus/SciVal® does not distinguish
between scientific publications and articles for this type of general analysis. The detailed
5 PUBSY is the corporate output management system of the JRC. It allows to archive, manage, authorise, evaluate, report on and disseminate a new output via the PUBSY workflow system (namely, scientific publications and policy support deliverables)
A2 – Planning, Evaluation and Knowledge Management Unit Page 11
benchmarking analysis distinguishing between scientific areas can be found in Chapter 6 of the
report.
Figure 1: Number of JRC publications/articles (2009-2013), by year
Figure 2: Number of citations, between year N and 30 June 2014, of JRC publications/articles published in year N

A2 – Planning, Evaluation and Knowledge Management Unit Page 12
Figure 3: Number and share of JRC publications within top 1%, 5%, 10% and 25% most cited in the world during the years 2009-2013, by year
Figure 4: Number and share of JRC publications within top 1%, 5%, 10% and 25% most cited in the world during the period 2009-2013
0 100 200 300 400 500 600
2009
%
2010
%
2011
%
2012
%
2013
%
13
1,4
23
2,4
28
2,8
27
2,7
32
3
82
9,1
88
9,4
113
11,1
118
11,8
175
16,4
177
19,6
178
18,9
222
21,9
229
22,8
331
31,1
368
40,7
391
41,6
458
45,2
474
47,2
530
49,7
Numbers and share of publications at the JRC that are within the top 1%, 5%, 10% and 25 most cited publications
worldwide (trend 2009-2013/year)
Publications in top 25% mostcited
Publications in top 10% mostcited
Publications in top 5% mostcited
Publications in top 1% mostcited
Source: Scopus/SciVal, 24-06-2014

A2 – Planning, Evaluation and Knowledge Management Unit Page 13
5 JRC publication and citation statistics according to scientific area (level 2)
and JRC Multi-Annual Work Programme project cluster
5.1 Results: Number of publications and citations per scientific area
The number of publications6 and citations are identified for Scopus/SciVal® scientific areas (level 2)
and ranked according to their importance in terms of citations see Figure 5, below.
Figure 5: JRC publications and citations (2009-2013) by scientific areas, level 2
6 Covering all types of publication

A2 – Planning, Evaluation and Knowledge Management Unit Page 14
The ten most important JRC scientific areas in terms of citations are 'Environmental Science', 'Earth
and Planetary Science', 'Physics and Astronomy', 'Agricultural and Biological Sciences', 'Engineering',
'Chemistry', 'Energy', 'Material Science', 'Pharmacology, Toxicology and Pharmaceutics', and
'Biochemistry, Genetics and Molecular Biology'. Note, the ranking in terms of publication counts is
slightly different from the ranking in terms of citations as the average number of citations per
publication is far from being homogeneous among all scientific area (see e.g. Section 6.3.1)
The JRC has no activities as such in fields such as 'Psychology' or 'Arts and Humanities'. The fact that
the JRC nevertheless appears with some publications/citations in those areas is a side effect of the
journal classification system of Elsevier.
5.2 JRC publication statistics according to the JRC Multi-Annual Work
Programme project clusters
5.2.1 Specific methodological notes
The next level of analysis aims to identify the number of publications made in the different parts of
the current Multi-Annual Work Programme (MAWP) of the JRC (i.e. application areas).
Methodologically, this analysis represents a challenge, since past results (i.e. publications resulting
from FP7 and their citations) have to be linked to today's Work Programme (WP) structure. Strictly
speaking, this is of little relevance. However, given that the JRC WP content changes relatively slowly
over the years, we will make the working hypothesis that work in a certain area will produce, in the
future, a comparable number of publications to the numbers in the past. This is corroborated by the
fact that the total number of publications only changes slowly as well. Nevertheless, all results
presented have to be considered in view of these limitations.
In order to link publication and citation numbers from Scopus/SciVal® to the JRC Work Programme
structure, here clusters, the following approach was chosen:
1. Export from Scopus/SciVal® of all JRC publications published in the reporting period (2009-
2013), whose corresponding journals are labelled with information on scientific areas
(information not present in PUBSY) and the DOI number - a unique ID of each publication;
2. Export of JRC publications from PUBSY, which contain WP-related information via the
associated FP7 Action numbers and the DOI number;
3. Identification of a common set of publications in Scopus/SciVal® and PUBSY by matching the
DOI number. This way a reference sample of publications present in both PUBSY and
Scopus/SciVal® was created. Each publication included in this common set of publications
contains both information about scientific areas and JRC MAWP structure. This final set
contains about 2700 publications, out of which 2660 publications were categorized in PUBSY
as 'peer-reviewed articles';
4. Association (to the extent possible) of JRC FP7 scientific actions with today's WP clusters
(version of May 2014). This information was linked to the common set of publications;
5. On the basis of the common set of publications, various statistical analyses were performed.
Since publications can be related to more than one scientific area and more than one cluster, the
total sum in the figures below exceeds 100%. The distribution of FP7 Actions against the new

A2 – Planning, Evaluation and Knowledge Management Unit Page 15
clusters must be considered with great caution. This list of clusters used was that distributed at the
end of May 2014, labelled as not yet fully stabilized. The 36 clusters do not cover all the JRC
activities, so in order not to leave any Action outside of the analysis, one had to slightly 'force' the
matching. Hence this distribution must only be seen as a rough estimate of the correspondence of
FP7 Actions and the new WP structure.
5.2.2 Results
Figure 6 below presents the share of peer-reviewed articles associated with WP clusters in
decreasing order out of the 2660 articles of the common set of publications as described in 5.2.1
above.
Roughly 50% of these peer-reviewed articles relate to the seven clusters 'EC support programme to
IAEA safeguards', 'Biodiversity and ecosystem services', 'Education and training', 'EU Reference
Laboratories and EU Reference Centres – quality of measurements and standardisation', 'Climate
change impacts, vulnerability and adaptation', 'Nuclear emergency preparedness and response',
'Exposure and risk assessment – human and environmental toxicology'.
No link to resources involved is made due to the methodological limitations.
Figure 6: Share of peer-reviewed articles by MAWP project clusters in decreasing order (clockwise)
A2 – Planning, Evaluation and Knowledge Management Unit Page 16
5.3 JRC publication statistics according to scientific area (level 2) and JRC
MAWP project cluster
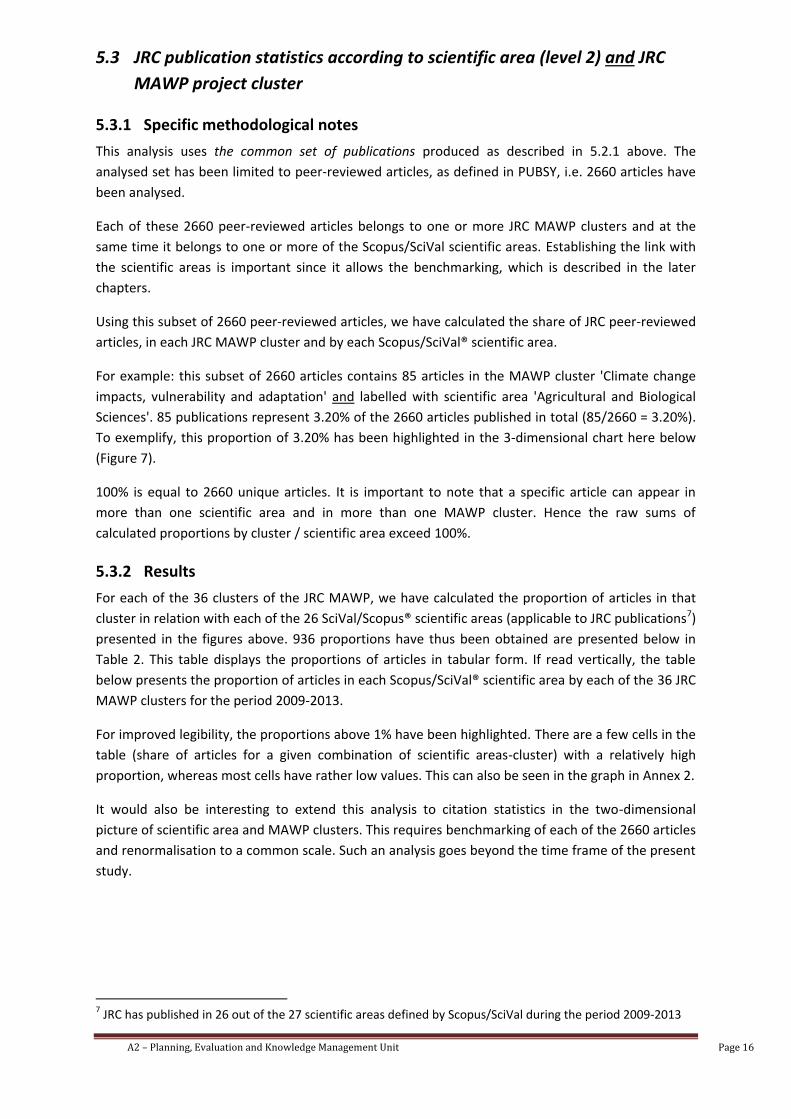
5.3.1 Specific methodological notes
This analysis uses the common set of publications produced as described in 5.2.1 above. The
analysed set has been limited to peer-reviewed articles, as defined in PUBSY, i.e. 2660 articles have
been analysed.
Each of these 2660 peer-reviewed articles belongs to one or more JRC MAWP clusters and at the
same time it belongs to one or more of the Scopus/SciVal scientific areas. Establishing the link with
the scientific areas is important since it allows the benchmarking, which is described in the later
chapters.
Using this subset of 2660 peer-reviewed articles, we have calculated the share of JRC peer-reviewed
articles, in each JRC MAWP cluster and by each Scopus/SciVal® scientific area.
For example: this subset of 2660 articles contains 85 articles in the MAWP cluster 'Climate change
impacts, vulnerability and adaptation' and labelled with scientific area 'Agricultural and Biological
Sciences'. 85 publications represent 3.20% of the 2660 articles published in total (85/2660 = 3.20%).
To exemplify, this proportion of 3.20% has been highlighted in the 3-dimensional chart here below
(Figure 7).
100% is equal to 2660 unique articles. It is important to note that a specific article can appear in
more than one scientific area and in more than one MAWP cluster. Hence the raw sums of
calculated proportions by cluster / scientific area exceed 100%.
5.3.2 Results
For each of the 36 clusters of the JRC MAWP, we have calculated the proportion of articles in that
cluster in relation with each of the 26 SciVal/Scopus® scientific areas (applicable to JRC publications7)
presented in the figures above. 936 proportions have thus been obtained are presented below in
Table 2. This table displays the proportions of articles in tabular form. If read vertically, the table
below presents the proportion of articles in each Scopus/SciVal® scientific area by each of the 36 JRC
MAWP clusters for the period 2009-2013.
For improved legibility, the proportions above 1% have been highlighted. There are a few cells in the
table (share of articles for a given combination of scientific areas-cluster) with a relatively high
proportion, whereas most cells have rather low values. This can also be seen in the graph in Annex 2.
It would also be interesting to extend this analysis to citation statistics in the two-dimensional
picture of scientific area and MAWP clusters. This requires benchmarking of each of the 2660 articles
and renormalisation to a common scale. Such an analysis goes beyond the time frame of the present
study.
7 JRC has published in 26 out of the 27 scientific areas defined by Scopus/SciVal during the period 2009-2013

A2 – Planning, Evaluation and Knowledge Management Unit Page 17

A2 – Planning, Evaluation and Knowledge Management Unit Page 18
Table 2: Proportion of JRC peer-reviewed articles by MAWP cluster and scientific area, level 2

A2 – Planning, Evaluation and Knowledge Management Unit Page 19
Figure 7 presents an 'excellence map' of the MAWP clusters (x-axis) and the 'proportions of JRC
peer-reviewed articles for the period 2009-2013 by level 2 scientific area and MAWP cluster (y-axis)'.
The proportions for the scientific areas are represented by different colours of the peaks. While the
x-axis represents the nominal list of clusters not having a scale, the y-axis on the contrary does have
a linear scale.
The cluster in relation to which the JRC is publishing the most is 'EC-Support programme to IAEA
safeguards', followed by 'Biodiversity and ecosystem services', 'Education and training', etc., which is
in line with Figure 6 above, which displays the proportion of unique articles published in a MAWP
cluster independent from the scientific area in which articles could be classified.

A2 – Planning, Evaluation and Knowledge Management Unit Page 20
Figure 7: Proportions of JRC peer-reviewed articles by MAWP cluster and scientific area, level2

A2 – Planning, Evaluation and Knowledge Management Unit Page 21
6 Benchmarking of institutions according to scientific area
6.1 Specific methodological notes
The focus of publication-impact benchmarking depends on the specific research interest/question
and can be performed in a number of ways, e.g.:
- Benchmarking of organisations in general;
- Benchmarking of organisations in their respective scientific areas;
- Benchmarking against world average;
- Benchmarking of specific articles;
- Benchmarking of individual scientists;
- Benchmarking of specific research groups, teams, consortia;
The research focus of the present excellence mapping is on how the JRC's citation statistics compare
to those of the best organisations in the world, in a given scientific area of level 2 and 3. The
following sections describe the elements of the benchmarking analysis:
- The indicators that are used to perform the benchmarking (Section 6.1.1);
- The approach chosen for selecting the reference sample of organisations against which the
JRC is benchmarked (Section 6.1.2) and
- The steps of the benchmarking analysis on the basis of the chosen indicators and according
to the respective scientific areas (Section 6.2).
6.1.1 Indicators to be used
The comparison of the impact of the publications of various institutions, i.e. the benchmarking is
performed on the basis of a set of five indicators, each representing a specific benchmarking
perspective. Together they provide a multi-dimensional (but not exhaustive) benchmarking
perspective.
Number of citations per publications
The indicator 'Number of citations per publication' represents the average number of citations per
publication of a given scientific organisation. It provides a mean value and a first impression of the
impact of a research organisation. Yet, it does not provide any information about the distribution of
citations per publications.
Cited publications (in percent)
There might be a few publications with a very high number of citations, while the other publications
are either not cited very much or not at all. The indicator 'Cited publications (in percent)' provides
information of the proportion of those publications of a given organisation that have been cited.
Hence, this indicator complements the previous one, 'Number of citations per publication'.

A2 – Planning, Evaluation and Knowledge Management Unit Page 22
Field-weighted citation impact
While the rankings based on the two previous indicators can be compared between scientific areas,
the actual numbers of the indicators cannot. The reason is that the publication and citation
characteristics differ widely from one scientific area to another. While in some areas, say 10 citations
might be a lot, the same number of citations in another area might not be an impressive result at all.
The 'Field-weighted citation impact' overcomes this difficulty. In short, the world average for the
number of citations is defined as '1' and can be used to put the actual results of each organisation
into perspective.
Hence, the 'Field-weighted citation impact' indicates how the number of citations received by an
entity’s publications compares with the average number of citations received by all other similar
publications in the data universe:
- A 'Field-weighted citation impact' of 1.00 indicates that the entity’s publications have been
cited exactly as would be expected based on the global average for similar publications; the
'Field-weighted citation impact' of 'World', or the entire Scopus database, is 1.00
- A 'Field-weighted citation impact' of more than 1.00 indicates that the entity’s publications
have been cited more than would be expected based on the global average for similar
publications; for example, 2.11 means 111% more cited than world average
- A 'Field-weighted citation impact' of less than 1.00 indicates that the entity’s publications
have been cited less than would be expected based on the global average for similar
publications; for example, 0.87 means 13% less cited than world average.
Publications in the top 10% of the most cited publications
Outputs in top percentiles in Scopus/SciVal® indicate the extent to which an entity’s publications are
present in the most-cited percentiles of a data universe: how many publications are in the top 10%
of the most-cited publications.
Hence, this indicator aims at identifying the proportion of publications having a world-class impact.
Publications in the top 10% of the most cited journals
Publications in top journal percentiles in Scopus/SciVal® indicate the extent to which an entity’s
publications are present in the most-cited journals in the data universe, i.e. how many publications
are in the top 10% of the most-cited journals indexed by Scopus.
In essence, this indicator aims at identifying the proportion of an entity's publication in top journals.
The criterion for deciding what a top-journal is involves the SNIP-concept. SNIP is the 'Source-
Normalized Impact per Paper', and it is defined as a ratio between the 'Raw Impact per Paper', a
type of 'Citations per publication' calculation, actually received by the journal, compared to the
'Citation potential', or expected 'Citations per publication', of that journal’s field. SNIP takes
differences in disciplinary characteristics into account, and can be used to compare journals in
different fields. The average SNIP value for all journals in Scopus is 1.000.

A2 – Planning, Evaluation and Knowledge Management Unit Page 23
6.1.2 The choice of the reference sample of organisations
The purpose of benchmarking is to find out whether a given organisation compares with the best
organisations regarding certain criteria. This in turn requires that one knows which are the
comparators, i.e. the best organisations.
For finding the 'best' organisations one could take the Top-15 organisations regarding any of the five
indicators presented above. As an example, Table 3 below displays the results for the indicator
'Citations per publications' in the scientific area 'Environmental Science'. Some results are
noteworthy: 1) Compared to the JRC, the top organisation (Max Planck Institut für Mathematik) has
received 10-times more citations per publication (although the JRC has more than 100 times more
citations in total). 2) However, the top institution has only one single publication in the given
scientific area. 3) The number of publications of all the Top-15 organisations regarding the indicator
'Citations per publication' have roughly one tenth of the number of publications of the JRC.
One could also question, whether these 15 organisations are really to be considered the 'best' in
their field. Clearly, they have produced the papers with very high impact. Yet, is it meaningful to
consider '(part of) the best in the field' an organisation that has produced only one or a very small
number of publications? This is most likely not the case.
This result can be explained by looking in detail at some of the publications underlying the statistics.
Many of them are on the list, because scientists of these organisations have published in a journal
that happens to be part of the catalogue 'Environmental Sciences'. Generally speaking, the top
organisation has, by far, more publications in journals that are found in scientific areas closer to
what the name of the organisations suggests. The same is true for the other organisations, and the
result is valid for the other indicators as well. For instance anyone would most likely agree with the
conclusion that, although its five publications have been abundantly cited, Mitsubishi Chemical
Corporation is not a top organisation in 'Environmental Science'.
Top 15 institutions (in terms of N of citations per
publication)Country Publications Citations
Citations
per
Publication
Rank among
4 589
institutions
that
published in
the field
Max Planck Institut fur Mathematik Germany 1 96 96 1
Central Institute of Mental Health Germany 1 84 84 2
Hospital Juan Canalejo Spain 1 71 71 3
AT&t United States 5 342 68.4 4
St. Elizabeth's Medical Center United States 2 109 54.5 5
Burnham Institute for Medical Research United States 7 371 53 6
Max Planck Institute for Infection Biology Germany 2 97 48.5 7
Children's Hospital of Wisconsin Wauwatosa United States 4 187 46.8 8
CHU de Nice France 2 91 45.5 9
Fujian Institute of Research on the Structure of
Matter Chinese Academy of Sciences China 13 578 44.5 10
Mitsubishi Chemical Corporation Japon 5 184 36.8 11
Institute of Applied Mathematics, AMSS, CAS China 2 73 36.5 12
Westat United States 16 577 36.1 13
Max-Planck-Institut fur Kohlenforschung Germany 36 1,285 35.7 14
University of Lubeck Germany 5 176 35.2 15
Top 15 institutions (total) 102 4,321 42.4
JRC 1,294 12,491 9.7 616
World 562,040 2,939,069 5.2
Table 3: Top-15 organisations in terms of number of Citations per publication in the scientific area 'Environmental Science'

A2 – Planning, Evaluation and Knowledge Management Unit Page 24
This implies that in order to be considered a top organisation one would require from any
organisation to publish a lot and at the same time to be cited a lot. But how many publications and
citations are enough to be considered a top organisation?
This is complicated by the fact that bigger organisations tend to publish more and that more
publications tend to lead to more citations.
To overcome these complications, it is necessary to base the analysis on size-independent metrics.
The approach chosen for benchmarking the JRC involves the following:
- The reference sample against which the JRC is benchmarked is based on the Top-15
organisations having the largest number of citations in total in a given scientific area. Since
the total number of citations is to a certain degree dependent on the size of the
organisation, size-independency is introduced by
- Performing the analysis on the basis of the five indicators described above, all of which
represent size-independent metrics.
6.1.3 The choice of relevance levels
The key question here is: For which scientific areas of levels 2 and 3, respectively, do we need to
perform the benchmarking analysis?
There are typically between 3000 and 5000 organisations publishing in each of the 27 scientific areas
of level 2. In terms of the total numbers of publications and of citations, the JRC plays a relatively
minor role. For example the JRC's highest rank in terms of total publication counts is 80 (out of 4497
institutions) with 1294 publications in the scientific area 'Environmental Science'. Its lowest
publication count (for scientific areas with at least 100 publications between 2009 and 2013) can be
found in the scientific area of 'Business, Management and Accounting' with rank 743 (out of 3492
institutions) and 104 publications. The absolute lowest rank is in the scientific area 'Nursing' with
rank 2979 (out of 3593 institutions), and with just two publications (see also Figure 5, in Section 5.1
above).
In order to limit the analysis and to avoid analysing JRC's performance and impact in scientific areas
such as 'Nursing', 'Psychology', 'Veterinary' and 'Arts and Humanities' only those scientific areas are
analysed in the benchmarking of level 2 for which the JRC has at least 100 publications in total for
the period 2009-2013. There are 17 areas in this situation.
Limiting ourselves to those scientific areas above the 100-publications-threshold does not lead to
distortions, since most publications that were published in journals of the scientific areas below 100-
publications-threshold can also be found in other scientific areas above the threshold.
For the scientific areas of level 3, a different approach was chosen. For level 3 the 2-4 scientific areas
having the most publications plus those whose denomination bears a resemblance to well-known
JRC WP categories were chosen for the analysis. In total, about 80 scientific areas of level 3 are
analysed.

A2 – Planning, Evaluation and Knowledge Management Unit Page 25
6.2 Procedure of the benchmarking analysis
The benchmarking analysis for each scientific area of level 2 is performed according to the following
three steps:
2. Identification of the reference sample of the Top-15 organisations: The reference sample for
the benchmarking comprising the group of 15 organisations that have the highest number
of total citations per given scientific area is formed. For example in the scientific area of
'Environmental Science', the top organisation world-wide in terms of total citations is the US
Department of Agriculture with 47027 citations in the period from 2009-2013. Rank 15 in
this reference sample is Harvard University with 19995 citations during the same period. The
JRC's rank is 64th with 11888 citations.
3. Benchmarking of the JRC to the Top-15 organisations and to the world average: The JRC's
rank is compared to the reference set on the basis of the five size-independent indicators
presented earlier and reminded here::
- Number of citations per publication;
- Cited publications (in percent);
- Field-weighted citation impact;
- Publications (in percent) in the top 10% of the most cited publications;
- Publications (in percent) in the top 10% of the most cited journals.
4. Presentation of the results as follows:
- Quantitative results for each benchmarking indicator for all 17 scientific areas of
level 2 are displayed graphically (Sections 6.3.1 - 6.3.5 and Annex 4)8. Annex 3
presents the results, as well as all raw data for the statistical analysis in tabular form;
- Summary of normalised quantitative results for all indicators and per scientific area,
level 2 (Section 6.4 and Annex 5)8;
- Excellence maps summarizing the JRC's relative distance to highest and lowest value
among the Top-15 organisations and to world average for each indicator in all
scientific areas are presented in Section 6.5.3;
- The complete set of raw data used and of statistical results plus further detailed
graphical representations regarding scientific area level 2 can also be found online9
(draft versions).
8 For better readability reasons, only the top 10 scientific areas (in terms of number of JRC publications) are
displayed in the core of the report. The remaining 7 are shown in the annex. 9 http://wcmcom-www-cc-cec-wip.wcm3vue.cec.eu.int:8080/dgintranet/jrc/intranet/km/bibliometrics/index_en.htm

A2 – Planning, Evaluation and Knowledge Management Unit Page 26
6.3 Level 2 benchmarking results
6.3.1 Results for the indicator 'Number of citations per publication'
In terms of 'Number of citations per publication', and for almost all scientific areas above the 100-
publications threshold the indicator value for the JRC is equivalent to the one for organisations
within the Top-15, see Figure 8 and Annex 4. In all areas, the JRC value is above world mean value.
For the scientific area of 'Pharmacology, Toxicology and Pharmaceutics', the JRC's Number of
citations per publication is higher than the one of the organisation that ranks 1st in the Top-15
reference set.
Figure 8: 'Number of citations per publication' in ten scientific areas, level 2
6.3.2 Results for the indicator 'Cited publications (in percent)'
Regarding the proportion of 'Cited publications (in percent)', the JRC has values that lie above, within
or near the Top-15 for all scientific areas, and always above world average, see Figure 9 and Annex 4.
Another interesting result is that there are areas, where the JRC produces a comparatively low
number of publications, yet these publications have a high impact. For example, in the area of
'Pharmacology, Toxicology and Pharmaceutics', the JRC has produced 251 publications, which ranks
595 out of 4301 institutions. Nevertheless, in terms of 'Citations per publication' (Section 6.3.1) and
'Cited publications' the JRC has values above the Top-15 reference set. For the scientific areas
'Medicine' and 'Biochemistry, Genetics and Molecular Biology' the JRC values of the indicator
exceeds the ones of any of the Top-15 reference organisations as well.
For more information see the tables online.

A2 – Planning, Evaluation and Knowledge Management Unit Page 27
Figure 9: 'Cited publications (in percent)' in ten scientific areas, level 2
6.3.3 Results for the indicator 'Field-weighted citation impact'
For this indicator, the JRC value lies within or near the values of the Top-15 for all scientific areas,
and much above the world mean value (except for 'Chemistry'), see Figure 10 and Annex 4. For the
scientific area of 'Agriculture and Biological Sciences' the JRC value is higher than the value
corresponding to the first rank of the Top-15 reference organisations.

A2 – Planning, Evaluation and Knowledge Management Unit Page 28
Figure 10: 'Field-weighted citation impact' in ten scientific areas, level 2
6.3.4 Results for the indicator 'Publications in the top 10% of the most cited
publications'
For this indicator, the JRC value lies within or near values of the Top-15 for most scientific areas, see
Figure 11 and Annex 4. For the scientific areas of 'Pharmacology, Toxicology and Pharmaceutics' and
'Social Sciences' the JRC's proportion of publications in the top 10% of the most cited publications is
higher than for the first rank of the Top-15 reference organisations in the respective scientific area.
However, in 'Materials Science' and 'Physics and Astronomy', the JRC's values are slightly lower than
the world averages.

A2 – Planning, Evaluation and Knowledge Management Unit Page 29
Figure 11: 'Proportion of the Publications in the top 10% of the most-cited publications' in ten
scientific areas, level 2
6.3.5 Results for the indicator Publications in the top 10% of the most cited
journals
For this indicator the JRC value exceeds the value of the top organisation in the scientific area of 'Energy', and is also far above the world average, meaning that the JRC has a very good proportion of publications in the most cited journals. For most other scientific areas, the JRC value lies in the range of the values of the Top-15 organisations except for 'Pharmacology, Toxicology and Pharmaceutics', 'Biochemistry, Genetics and Molecular Biology', 'Economics, Econometrics and Finance', 'Business, Management and Accounting' and 'Medicine'.

A2 – Planning, Evaluation and Knowledge Management Unit Page 30
Figure 12:' Proportion of the Publications in the top 10% of the most-cited publications' in ten
scientific areas, level 2
6.4 Level 2 normalised benchmarking results
This section presents the results of Section 6.3 in a different way. For each scientific area in which
the JRC has more than 100 publications during 2009-2013 benchmarking results are presented by
- scientific area and
- grouping the results of all five benchmarking indicators in one diagram.
To allow better comparability, the axes in the graphs have been normalised: for each dimension
(indicator) the best value among the Top-15 reference institutions is set at 100. All other values are
put in proportion to the best one. This way, all axes can be compared with each other irrespective of
the original scale and dimension.
This information is the basis for the creation of excellence maps displayed in Section 6.5 below.
To illustrate this graphical representation, Figure 13 presents the results for the scientific area
'Environmental Science', in which the JRC has published the most during 2009-2013. This view
exemplifies the strength of the JRC in this area, whether it is compared to the Top-15 organisations
or to the world average. The graphs for the other top nine scientific areas follow, while the
remaining seven in which the JRC had more than 100 publications between 2009 and 2013 are
displayed in Annex 5. This shows that every area has a very specific imprint in term of scientific
impact.

A2 – Planning, Evaluation and Knowledge Management Unit Page 31
Figure 13: Normalised set of five benchmarking indicators for scientific area 'Environmental Science'
Figure 14: Normalised set of five benchmarking indicators for scientific area 'Earth and Planetary Sciences'

A2 – Planning, Evaluation and Knowledge Management Unit Page 32
Figure 15: Normalised set of five benchmarking indicators for scientific area 'Physics and Astronomy'
Figure 16: Normalised set of five benchmarking indicators for scientific area 'Agricultural and Biological Sciences'

A2 – Planning, Evaluation and Knowledge Management Unit Page 33
Figure 17: Normalised set of five benchmarking indicators for scientific area 'Engineering'
Figure 18: Normalised set of five benchmarking indicators for scientific area 'Chemistry'

A2 – Planning, Evaluation and Knowledge Management Unit Page 34
Figure 19: Normalised set of five benchmarking indicators for scientific area 'Energy'
Figure 20: Normalised set of five benchmarking indicators for scientific area 'Material Science'

A2 – Planning, Evaluation and Knowledge Management Unit Page 35
Figure 21: Normalised set of five benchmarking indicators for scientific area 'Pharmacology, Toxicology & Pharmaceuticals'
Figure 22: Normalised set of five benchmarking indicators for scientific area Biochemistry, Genetics & Molecular Biology

A2 – Planning, Evaluation and Knowledge Management Unit Page 36
6.5 Summary of level 2 benchmarking results
The results presented in Sections 6.3 and 6.4 provide a detailed view of the following perspectives:
- by indicator for each scientific area, or
- by scientific area for all indicators.
It is also desirable to further reduce complexity and to aggregate results (thereby losing some
detail). Based on the results presented in Section 6.4, this section presents the results at a higher
order of aggregation, by drawing excellence maps that put JRC's citation performance in relation to:
- the world average by scientific area for level 2 taking into account the distance between JRC
and world average values (Section 6.5.1);
- the best and the lowest in the group of Top-15 organisations for level 2 and level 3, taking
into account the distance between JRC values and those of its comparators (Section 6.5.2),
and to
- all three comparators (i.e. world-average, best of Top-15, lowest of Top-15), not taking into
account the distance between JRC values and those of the comparators, but providing a
synthetic picture of the JRC's behaviour when combining the five indicators, the three
comparators and the scientific areas of level 2 (see Section 6.5.3).
6.5.1 Summary of level 2 benchmarking results against world average
In the following distance-to-world-average maps (Figure 23), the darker the green, the better the
JRC's citation performance compared to the world average. In the case where the JRC's citation
statistics are equal to, or below, the world average, white and pink, respectively are used for the
map.
This way, benchmarked citation performance, and hence benchmarked scientific impact become
transparent.
It would be potentially interesting to further reduce the complexity by mapping the results for the
five indicators onto one composite indicator. Since the indicators are not statistically independent,
this is not possible.
Another option would be to aggregate the information of the five indicators into one single number
attributing weights. A priori, these indicators are equally important. Nevertheless, the attribution of
weights appears to be arbitrary, and therefore such analysis is not undertaken.

A2 – Planning, Evaluation and Knowledge Management Unit Page 37
Figure 23: Excellence map benchmarking JRC's citation statistics based on the five indicators against the world average for all 17 scientific areas, level 2
Criterion Environmental ScienceEarth & Planetary
SciencesPhysics & Astronomy
Agriculture &
Biological SciencesEngineering Chemistry Energy Material Science
Pharmacology,
Toxicology &
Pharmaceutics
Biochemistry, Genetics
& Molecular Biology
Citations per publication +++ ++++ + +++ ++++ = +++ ++ ++++ +
Cited publications (%) + ++ = + ++ + ++ + ++ +
Field-weighted citation
impact++++ ++++ ++ ++++ ++++ = ++++ ++++ +++ ++
Publications in the top
10% of the most-cited
publications (%)++++ +++++ = +++++ ++++ = ++ - ++++ ++
Publications in the top
10% of the most-cited
journals (%)++ +++ ++ ++++ ++++ ++ +++ ++++ + ++
Criterion Medicine Computer Science Social Sciences Chemical Engineering Mathematics
Economics,
Econometrics &
Finance
Business, Management
& Accounting
Citations per publication +++ ++ ++++ + ++ +++ ++++
Cited publications (%) ++ + ++ + + ++ +++
Field-weighted citation
impact++++ ++ ++++ ++ ++ ++++ ++++
Publications in the top
10% of the most-cited
publications (%)++++ ++++ +++++ + ++++ +++++ +++++
Publications in the top
10% of the most-cited
journals (%)= ++ +++ = +++ = +++
- JRC value lower than world average value by -10 to -30% = JRC value equal to JRC world average value (+/- 10%)
JRC value higher than world average value by + 10-30% ++ 30-70% +++ 70-100% ++++ 100-150% +++++ >150%

A2 – Planning, Evaluation and Knowledge Management Unit Page 38
6.5.2 Summary of level 2 benchmarking results against Top-15
A similar aggregation as in the previous section is provided in Figure 24 and Figure 25. These
distance-to-rank maps benchmark JRC's values for the five bibliometric indicators against the Top-15
ones in the ten and seven, respectively, scientific areas of level 2 where the JRC published more than
100 publications in the 2009-2013 period. The aim of these bubble graphs is not only to compare the
JRC's performance with the best institution among the Top-15 (i.e. highest value recorded for a
specific indicator in a specific area) but also to the least well performing one among the Top-15
(lowest value recorded for a specific indicator in a specific area). For this purpose, two ratios are
defined in the following way: JRC's value for a specific indicator in a specific area is divided by 1) the
highest value among the Top-15 and then multiplied by 100 and also by 2) the lowest value among
the Top-15 and then multiplied by 100.
The first ratio determines the vertical position of the bubble. If JRC has the same value for a given
indicator as the best organisation among the Top-15, then the ratio is equal to 100 and the bubble is
situated at the red line. Bubbles above the red line imply that JRC performs better than the number
one among the Top-15 and similarly bubbles below the red line indicate that JRC performs worse.
E.g. a ratio of 120 means that JRC's value (for a given indicator and a scientific area) is 20% higher
than the one of the best organisation among the Top-15 or a ratio of 80 that JRC's value is 20 lower
than the one for the best Top-15 organisation.
The size of the bubble is determined by the second type of ratio. If the JRC has the same value for a
given indicator as the lowest value recorded among the Top-15 organisations, then the ratio is equal
to 100 and the bubble is as big as the red circle indicated at the bottom of the graph. All bubbles
bigger than that, i.e. ratios higher than 100, imply that JRC is in the Top-15 range or in other words
JRC's value is bigger than the lowest value among the Top-15 organisations. Bubbles smaller than the
reference size indicated at the bottom of the graph, i.e. ratios lower than 100, mean that the JRC
falls outside of the Top-15 range and that its value for a given indicator is lower than the smallest
value among the Top-15 organisations.

A2 – Planning, Evaluation and Knowledge Management Unit Page 39
Figure 24: Excellence map benchmarking JRC's citation statistics based on the five indicators against the lowest and highest value among the Top-15 organisations in ten scientific areas, level 2

A2 – Planning, Evaluation and Knowledge Management Unit Page 40
Figure 25: Excellence map benchmarking JRC's citation statistics based on the five indicators against the lowest and highest value among the Top-15 organisations in seven scientific areas, level 2
A2 – Planning, Evaluation and Knowledge Management Unit Page 41
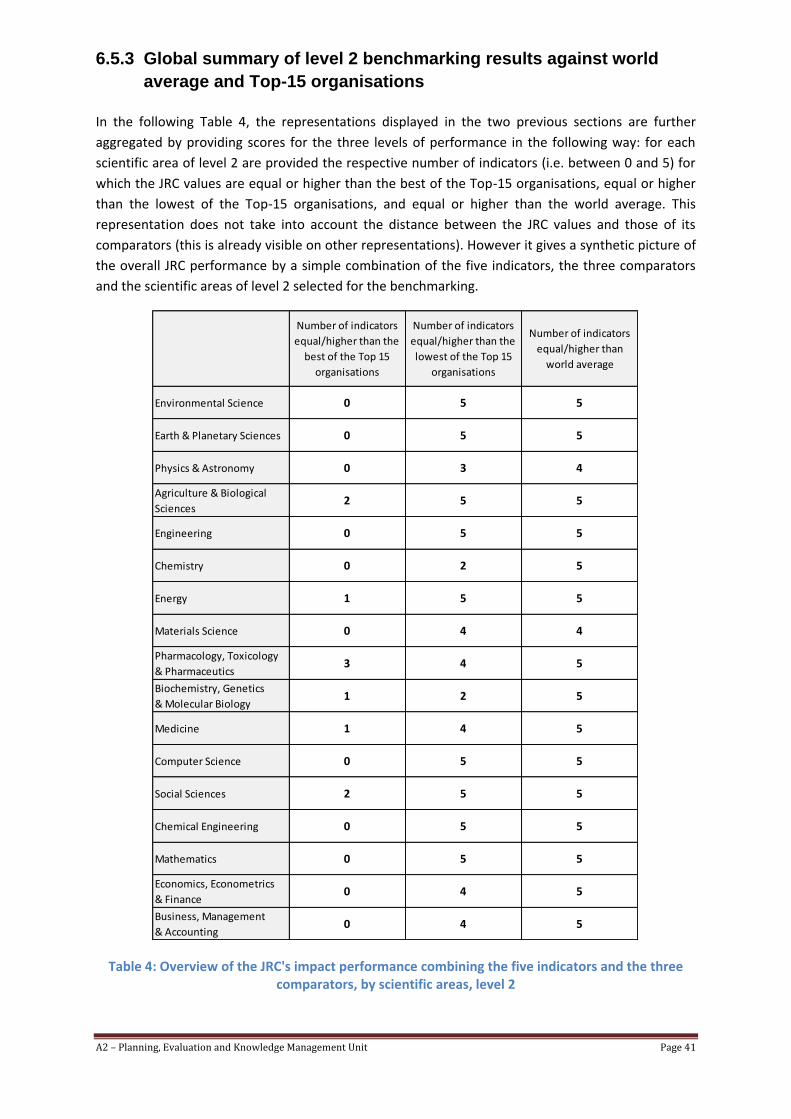
6.5.3 Global summary of level 2 benchmarking results against world
average and Top-15 organisations
In the following Table 4, the representations displayed in the two previous sections are further
aggregated by providing scores for the three levels of performance in the following way: for each
scientific area of level 2 are provided the respective number of indicators (i.e. between 0 and 5) for
which the JRC values are equal or higher than the best of the Top-15 organisations, equal or higher
than the lowest of the Top-15 organisations, and equal or higher than the world average. This
representation does not take into account the distance between the JRC values and those of its
comparators (this is already visible on other representations). However it gives a synthetic picture of
the overall JRC performance by a simple combination of the five indicators, the three comparators
and the scientific areas of level 2 selected for the benchmarking.
Table 4: Overview of the JRC's impact performance combining the five indicators and the three comparators, by scientific areas, level 2
Number of indicators
equal/higher than the
best of the Top 15
organisations
Number of indicators
equal/higher than the
lowest of the Top 15
organisations
Number of indicators
equal/higher than
world average
Environmental Science 0 5 5
Earth & Planetary Sciences 0 5 5
Physics & Astronomy 0 3 4
Agriculture & Biological
Sciences2 5 5
Engineering 0 5 5
Chemistry 0 2 5
Energy 1 5 5
Materials Science 0 4 4
Pharmacology, Toxicology
& Pharmaceutics3 4 5
Biochemistry, Genetics
& Molecular Biology1 2 5
Medicine 1 4 5
Computer Science 0 5 5
Social Sciences 2 5 5
Chemical Engineering 0 5 5
Mathematics 0 5 5
Economics, Econometrics
& Finance0 4 5
Business, Management
& Accounting 0 4 5

A2 – Planning, Evaluation and Knowledge Management Unit Page 42
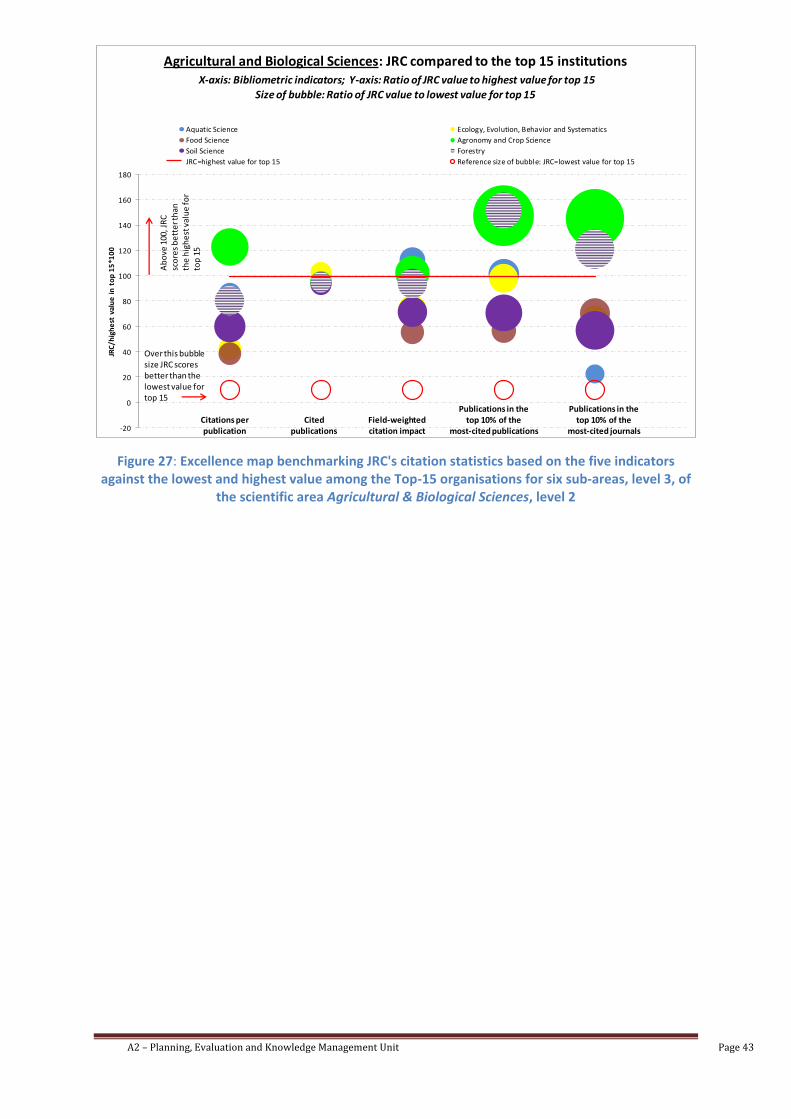
6.6 Level 3 benchmarking results
6.6.1 Specific methodological notes
This chapter presents the results of the benchmarking analysis of JRC vs. the world average and vs.
the Top-15 organisations regarding the total number of citations for some 80 scientific areas of level
3, on the basis of the same five benchmarking indicators and the sampling technique used for level 2
analysis (see Section 6.1).
Results for the benchmarking against the world-average are displayed using distance-to-world-
average level maps, see Figure 26. Results for the benchmarking vs. the Top-15 organisations are
presented using bubble graphs, Figure 27. For readability, the results of the six level 3 scientific areas
belonging to the level 2 scientific area 'Agricultural & Biological Sciences' are presented in this
section. Benchmarking vs. the Top-15 organisations bubble graphs of the other level 3 scientific
areas can be found in Annex 6 and online. Moreover, further distance-to-world-average level maps
can be found online.
The benchmarking of level 3 scientific areas is instructive, since within each large scientific area of
level 2, the analysis at level 3 provides more detailed information of the performance in terms of
citations impact. E.g., within a level 2 area performing well overall, there might be sub-areas doing
better than others. This is clearly seen in the example displayed below in Figure 26 (benchmarking
against the world-average) and in Figure 27 (benchmarking vs. the Top-15 organisations) for the
scientific area 'Agricultural & Biological Sciences' and six of its sub-areas.
Figure 26: Excellence map benchmarking JRC's citation statistics based on the five indicators against the world average for six sub-areas, level 3, of the scientific area Agricultural & Biological
Sciences, level 2
Criterion Aquatic Science
Ecology,
Evolution,
Behavior &
Systematics
Food ScienceAgronomy &
Crop ScienceSoil Science Forestry
Citations per publication +++ +++ ++ +++++ +++++ +++++
Cited publications (%) + + + ++ + ++
Field-weighted citation
impact++++ ++++ ++ +++++ ++++ +++++
Publications in the top
10% of the most-cited
publications (%)+++++ +++++ +++ +++++ +++++ +++++
Publications in the top
10% of the most-cited
journals (%)-- +++ ++ +++++ +++++ +++++
JRC value lower than world average value by - -10 to -30% - - -30 to -70% - - - -70 to -100% = JRC value equal to JRC world average value (+/- 10%) JRC value higher than world average value by + 10-30% ++ 30-70% +++ 70-100% ++++ 100-150% +++++ >150%
A2 – Planning, Evaluation and Knowledge Management Unit Page 43
Figure 27: Excellence map benchmarking JRC's citation statistics based on the five indicators against the lowest and highest value among the Top-15 organisations for six sub-areas, level 3, of
the scientific area Agricultural & Biological Sciences, level 2
Citations per publication
Cited publications
Field-weighted citation impact
Publications in the top 10% of the
most-cited publications
Publications in the top 10% of the
most-cited journals-20
0
20
40
60
80
100
120
140
160
180
JRC
/hig
he
st v
alu
e i
n t
op
15
*10
0
Agricultural and Biological Sciences: JRC compared to the top 15 institutionsX-axis: Bibliometric indicators; Y-axis: Ratio of JRC value to highest value for top 15
Size of bubble: Ratio of JRC value to lowest value for top 15
Aquatic Science Ecology, Evolution, Behavior and Systematics
Food Science Agronomy and Crop Science
Soil Science Forestry
JRC=highest value for top 15 Reference size of bubble: JRC=lowest value for top 15A
bo
ve 1
00, J
RC
sc
ore
s b
ett
er t
han
th
e h
igh
est
val
ue
for
top
15
Over this bubble size JRC scores better than the lowest value for top 15

A2 – Planning, Evaluation and Knowledge Management Unit Page 44
7 Acknowledgements
The authors of the report would like to thank M G. Merlo of the JRC as well as M G. Warnan of
Elsevier for many useful discussions and in particular technical suggestions.
8 Sources
Scopus/SciVal database & analytic tools
JRC PUBSY database
9 Literature
- 'Dissemination of JRC scientific results'. European Commission – Joint Research Centre. 2013 -' JRC collaborations with universities from EU-28 Member States at the level of co-authored scientific peer reviewed articles'. European Commission – Joint Research Centre. 2013
- 'Evaluation of the Research Performance of the Joint Research Centre of the European Commission during the 7th Framework Programme (2007-2013)'. Thomson Reuter, 2014

A2 – Planning, Evaluation and Knowledge Management Unit Page 45
10 Annex 1: Comparison of the Thomson Reuters Report and the Excellence
Mapping
In July 2014, Thomson Reuters produced the report 'Evaluation of the Research Performance of the
Joint Research Centre of the European Commission during the 7th Framework Programme (2007-
2013)'. The purpose of the report is to provide answers to a list of open questions, given by the JRC,
designed to measure the quantity and quality of its research during the FP7. A variety of methods
are applied to answer each question, these included bibliometric analysis, benchmarking, topic
clustering, patent analysis, identification of research fronts, social media analysis, and advanced
visualization. A set of world-class peer institutions are selected to benchmark the JRC in several
scientific research areas.
The data used for the report come from the Thomson Reuters databases underlying the Thomson
Reuters Web of Science™, which gives access not only to journals but also to conference
proceedings, books, patents, websites, and chemical structures, compounds and reactions. The Web
of Science focuses on research published in science, medicine, arts, humanities and social sciences.
The authoritative, multidisciplinary content covers over 12 000 of the highest impact journals
worldwide, including Open Access journals, and over 150 000 conference proceedings.
The table below aims at providing a brief overview of the sample analysed, coverage and indicators
used in the Thomson Reuters report and the Excellence Mapping produced by JRC.A2.
Thomson Reuters Report Excellence Mapping
Data source Thomson Reuters & Thomson Reuters
Web of Science™ Scopus & SciVal
Time period 2007-2013 2009-2013
Nr of JRC publications
4 436 4 929
Publications: journals, conferences and books;
partial focus on article, article-proceedings paper, review
peer-reviewed journals, conference papers, books, trade publications;
partial focus on articles
Comparators 18 organisations selected by the JRC
15 organisations that received the highest number of citations in 26 journal
categories of level 2 and 82 journal categories of level 3 => more than 1000
organisations
Indicators bibliometric; patents; social media bibliometric
Analytical dimensions:
productivity publication output publication output
impact
citations; citation per publication; normalized citation impact; average
impact factor; countries and institutions citing JRC; social media
impact
citations; citations per publication; proportion of cited publications; field-
weighted citation impact; publications in the top 10% of the most cited
publications; publications in the top 10% of the most cited journals

A2 – Planning, Evaluation and Knowledge Management Unit Page 46
Thomson Reuters Report Excellence Mapping
Areas analysed and indicators
used to determine JRC
excellence
20 journal categories & 20 custom subject categories: number of
publications; citation impact
26 journal categories & 36 MAWP clusters: share of publications
26 journal categories & 82 journal sub-categories: benchmarking standardized
scores for all impact indicators; distance to world average; distance to Top-15
collaborations
Nr of international co-authors; top collaborating countries and
organisations; citation impact by co-authoring country and organisation
Analysis to be included in the next volume of the report
innovation private sector partners; patents citing
JRC publications -
researcher mobility
follow-up of authors who published in 2003, 2008 and 2013
-
emerging areas
Research Fronts -
The Excellence Mapping and the Thomson Reuters study are complementary. Yet, where comparable, the results of both studies are coherent.

A2 – Planning, Evaluation and Knowledge Management Unit Page 47
11 Annex 2: Further graphs for the analysis of JRC publication statistics according to scientific areas (level 2) and JRC MAWP project clusters

A2 – Planning, Evaluation and Knowledge Management Unit Page 48

A2 – Planning, Evaluation and Knowledge Management Unit Page 49
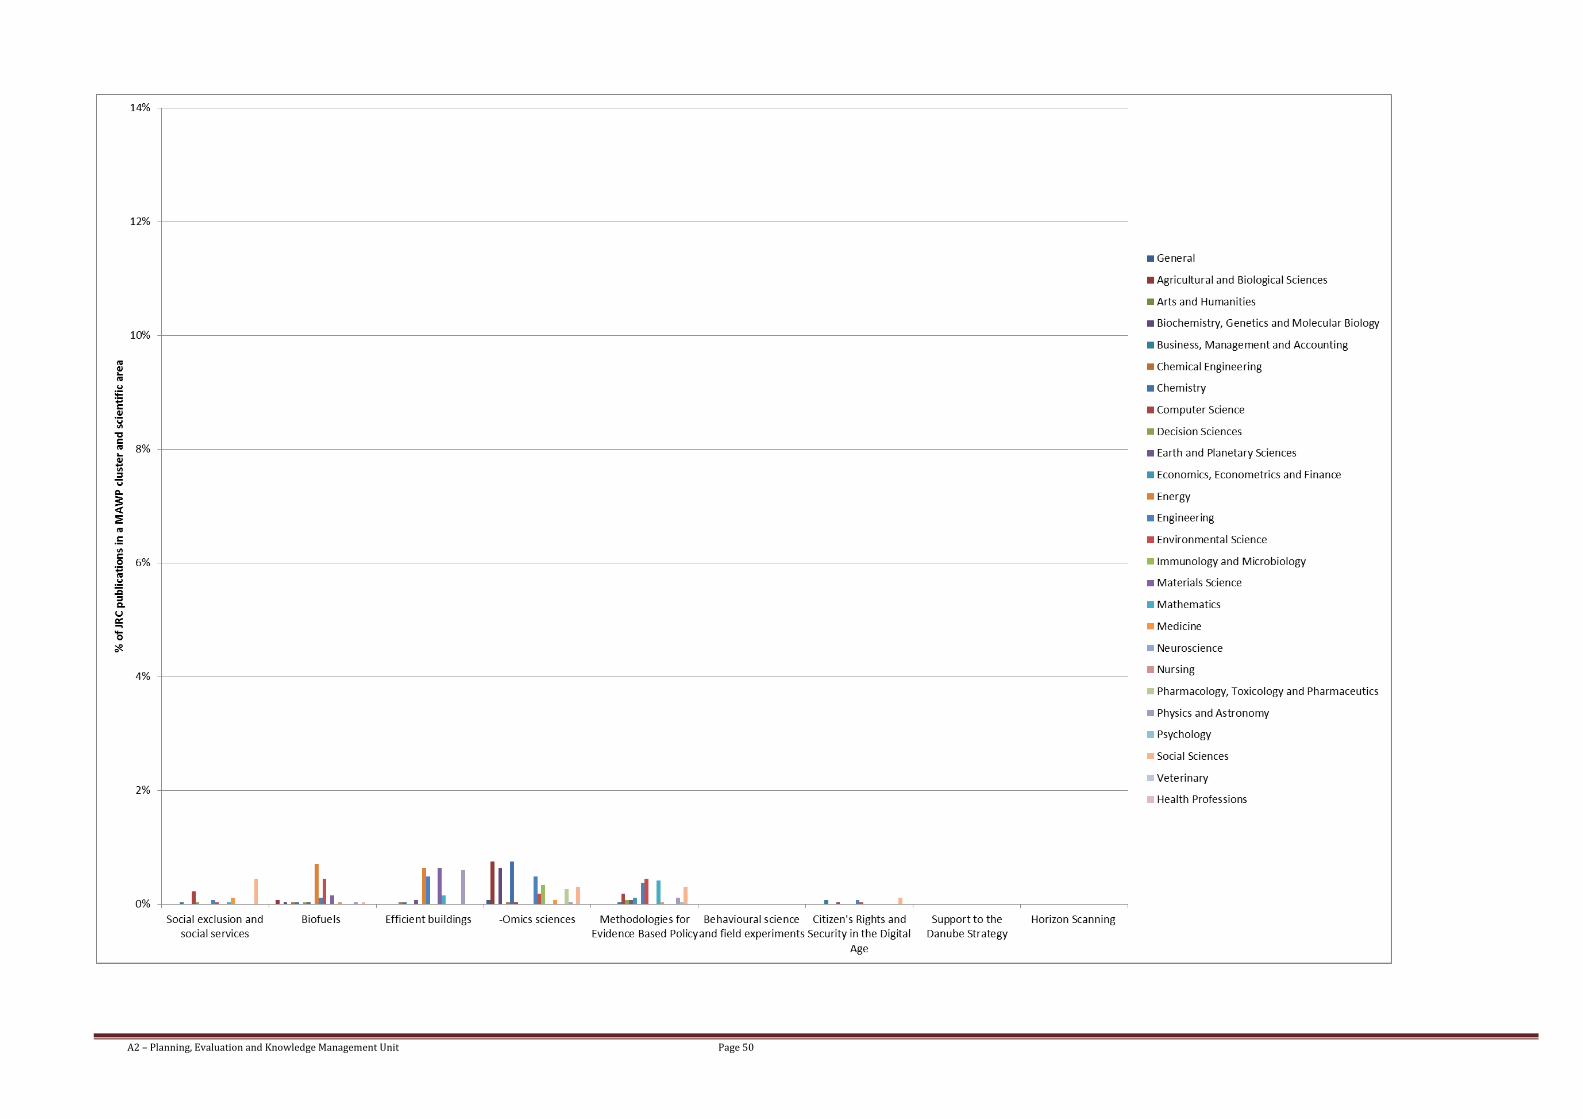
A2 – Planning, Evaluation and Knowledge Management Unit Page 50

A2 – Planning, Evaluation and Knowledge Management Unit Page 51
12 Annex 3: Data for level 2 benchmarking
Notes: 1) Ranking: own calculation; 2) SNIP: Source-Normalized Impact per Paper is a ratio between the “Raw Impact per Paper”, a type of Citations per Publication calculation, actually received by the journal, compared to the
“Citation Potential”, or expected Citations per Publication, of that journal’s field. SNIP takes differences in disciplinary characteristics into account, and can be used to compare journals in different fields. The average SNIP value
for all journals in Scopus is 1.000; 3) Publications in Top Journal Percentiles in SciVal indicates the extent to which an entity’s publications are present in the most-cited journals in the data universe: how many publications are
in the top 10% of the most-cited journals indexed by Scopus; 4) Outputs in Top Percentiles in SciVal indicates the extent to which an entity’s publications are present in the most-cited percentiles of a data universe: how many
publications are in the top 10% of the most-cited publications; 5) Field-Weighted Citation Impact in SciVal indicates how the number of citations received by an entity’s publications compares with the average number of
citations received by all other similar publications in the data universe. A Field-Weighted Citation Impact of 1.00 indicates that the entity’s publications have been cited exactly as would be expected based on the global average
for similar publications; the Field-Weighted Citation Impact of “World”, or the entire Scopus database, is 1.00; A Field-Weighted Citation Impact of more than 1.00 indicates that the entity’s publications have been cited more
than would be expected based on the global average for similar publications; for example, 2.11 means 111% more cited than world average; A Field-Weighted Citation Impact of less than 1.00 indicates that the entity’s
publications have been cited less than would be expected based on the global average for similar publications; for example, 0.87 means 13% less cited than world average "
Environmental Science2009 to 2013, All publication types
Top 15 institutions (in terms of N of citations) Country Publications Citations
Number of
Citing
Countries
Citations per
Publication
Cited
Publications
(%)
Field-
Weighted
Citation
Impact
Outputs in Top
Percentiles
(%)
Publications in
Top Journal
Percentiles
(%)
Publications Citations in top 10% of
the world
in top 10% by
SNIP
U.S. Department of Agriculture United States 6 661 47 027 167 2 1 7.1 76.7 1.4 17.8 19.9
CSIC Spain 4 692 44 488 178 3 2 9.5 85.4 1.8 28.0 38.3
Chinese Academy of Sciences China 6 683 32 883 148 1 3 4.9 65.7 1.1 16.3 22.9
Wageningen University and Research Center Netherlands 3 207 32 578 170 8 4 10.2 83.7 2.2 29.2 35.6
U.S. Geological Survey United States 4 221 31 478 170 4 5 7.5 78.2 1.5 20.2 23.7
CSIRO Australia 2 876 27 206 175 10 6 9.5 84.1 2.1 29.0 32.0
University of California at Berkeley United States 2 424 26 060 163 15 7 10.8 80.2 2.2 29.6 40.2
ETH Zurich Switzerland 2 234 25 273 162 20 8 11.3 83.8 2.4 35.6 43.7
U.S. Environmental Protection Agency United States 3 316 25 189 145 6 9 7.6 71.1 1.4 22.1 37.3
University of California at Davis United States 2 706 23 140 175 11 10 8.6 79.2 1.7 22.9 35.4
Tsinghua University China 3 275 20 967 119 7 11 6.4 66.1 1.2 19.7 36.9
University of British Columbia Canada 2 283 20 452 169 19 12 9.0 78.1 2.0 23.6 30.7
Graduate University of Chinese Academy of Sciences China 3 895 20 387 136 5 13 5.2 72.7 1.0 15.9 19.3
University of Queensland Australia 2 295 20 196 172 18 14 8.8 80.5 2.0 27.5 41.4
Harvard University United States 1 725 19 995 155 42 15 11.6 81.6 2.3 34.0 41.2
JRC 1 294 11 888 146 80 64 9.2 77.9 2.2 29.2 40.4
World 561 002 2 818 331 230 5.0 61.6 1.1 13.7 24.1
Source: © 2014 Elsevier B.V. All rights reserved. SciVal ® is a registered trademark of Elsevier Properties S.A. used under license.
Rank among 4 497
institutions that published in
the field
size-independent metricssize-dependent metrics

A2 – Planning, Evaluation and Knowledge Management Unit Page 52
Notes: 1) Ranking: own calculation; 2) SNIP: Source-Normalized Impact per Paper is a ratio between the “Raw Impact per Paper”, a type of Citations per Publication calculation, actually received by the journal, compared to the
“Citation Potential”, or expected Citations per Publication, of that journal’s field. SNIP takes differences in disciplinary characteristics into account, and can be used to compare journals in different fields. The average SNIP value
for all journals in Scopus is 1.000; 3) Publications in Top Journal Percentiles in SciVal indicates the extent to which an entity’s publications are present in the most-cited journals in the data universe: how many publications are
in the top 10% of the most-cited journals indexed by Scopus; 4) Outputs in Top Percentiles in SciVal indicates the extent to which an entity’s publications are present in the most-cited percentiles of a data universe: how many
publications are in the top 10% of the most-cited publications; 5) Field-Weighted Citation Impact in SciVal indicates how the number of citations received by an entity’s publications compares with the average number of
citations received by all other similar publications in the data universe. A Field-Weighted Citation Impact of 1.00 indicates that the entity’s publications have been cited exactly as would be expected based on the global average
for similar publications; the Field-Weighted Citation Impact of “World”, or the entire Scopus database, is 1.00; A Field-Weighted Citation Impact of more than 1.00 indicates that the entity’s publications have been cited more
than would be expected based on the global average for similar publications; for example, 2.11 means 111% more cited than world average; A Field-Weighted Citation Impact of less than 1.00 indicates that the entity’s
publications have been cited less than would be expected based on the global average for similar publications; for example, 0.87 means 13% less cited than world average "
Earth and Planetary Sciences2009 to 2013, All publication types
Top 15 institutions (in terms of N of citations) Country Publications Citations
Number of
Citing
Countries
Citations per
Publication
Cited
Publications
(%)
Field-
Weighted
Citation
Impact
Outputs in
Top
Percentiles
(%)
Publications
in Top Journal
Percentiles
(%)
Publications Citations in top 10% of
the world
in top 10% by
SNIP
Harvard University United States 5 270 87 433 146 6 1 16.6 91.8 2.0 47.6 43.4
NASA Goddard Space Flight Center United States 5 577 83 970 158 3 2 15.1 84.7 2.2 37.2 30.7
California Institute of Technology United States 4 320 75 840 143 12 3 17.6 90.8 2.1 47.7 36.5
University of California at Berkeley United States 4 132 69 802 154 14 4 16.9 87.5 2.3 42.8 35.5
CNRS France 5 259 60 254 178 7 5 11.5 84.8 1.9 33.4 20.7
NOAA United States 4 892 57 762 182 8 6 11.8 84.4 2.0 33.2 18.5
University of Colorado United States 4 525 57 166 159 10 7 12.6 83.1 2.1 35.2 23.5
CSIC Spain 5 287 56 370 169 5 8 10.7 84.9 1.6 29.0 20.6
University of Arizona United States 3 701 55 211 160 17 9 14.9 86.3 2.1 38.1 33.4
Jet Propulsion Laboratory, California Institute of Technology United States 4 565 52 168 150 9 10 11.4 74.1 1.9 32.5 22.9
University of Washington United States 3 241 51 197 173 26 11 15.8 87.8 2.3 39.5 29.2
University of California at Santa Cruz United States 2 263 49 879 147 56 12 22.0 91.4 2.7 52.6 42.8
University of Oxford United Kingdom 2 869 47 188 166 31 13 16.4 84.9 2.5 39.8 26.5
ETH Zurich Switzerland 3 596 46 471 173 18 14 12.9 84.4 2.2 36.0 27.1
University of Hawaii United States 3 266 46 015 160 24 15 14.1 88.3 1.8 37.1 31.5
JRC 813 9160 144 284 221 11.3 79.8 2.1 33.5 30.1
World 503 154 2 290 020 222 4.6 58.6 1.0 12.0 16.7
Source: © 2014 Elsevier B.V. All rights reserved. SciVal ® is a registered trademark of Elsevier Properties S.A. used under license.
size-dependent metrics
Rank among 3 851
institutions that
published in the field
size-independent metrics

A2 – Planning, Evaluation and Knowledge Management Unit Page 53
Notes: 1) Ranking: own calculation; 2) SNIP: Source-Normalized Impact per Paper is a ratio between the “Raw Impact per Paper”, a type of Citations per Publication calculation, actually received by the journal, compared to the
“Citation Potential”, or expected Citations per Publication, of that journal’s field. SNIP takes differences in disciplinary characteristics into account, and can be used to compare journals in different fields. The average SNIP value
for all journals in Scopus is 1.000; 3) Publications in Top Journal Percentiles in SciVal indicates the extent to which an entity’s publications are present in the most-cited journals in the data universe: how many publications are
in the top 10% of the most-cited journals indexed by Scopus; 4) Outputs in Top Percentiles in SciVal indicates the extent to which an entity’s publications are present in the most-cited percentiles of a data universe: how many
publications are in the top 10% of the most-cited publications; 5) Field-Weighted Citation Impact in SciVal indicates how the number of citations received by an entity’s publications compares with the average number of
citations received by all other similar publications in the data universe. A Field-Weighted Citation Impact of 1.00 indicates that the entity’s publications have been cited exactly as would be expected based on the global average
for similar publications; the Field-Weighted Citation Impact of “World”, or the entire Scopus database, is 1.00; A Field-Weighted Citation Impact of more than 1.00 indicates that the entity’s publications have been cited more
than would be expected based on the global average for similar publications; for example, 2.11 means 111% more cited than world average; A Field-Weighted Citation Impact of less than 1.00 indicates that the entity’s
publications have been cited less than would be expected based on the global average for similar publications; for example, 0.87 means 13% less cited than world average "
Physics and Astronomy2009 to 2013, All publication types
Top 15 institutions (in terms of N of citations) Country Publications Citations
Number of
Citing
Countries
Citations per
Publication
Cited
Publications
(%)
Field-
Weighted
Citation
Impact
Outputs in
Top
Percentiles
(%)
Publications
in Top Journal
Percentiles
(%)
Publications Citations in top 10% of
the world
in top 10% by
SNIP
Harvard University United States 10 592 150 965 133 9 1 14.3 82.1 2.3 38.8 41.1
Massachusetts Institute of Technology United States 10 735 132 778 142 8 2 12.4 75.1 2.4 32.1 38.6
University of California at Berkeley United States 8 594 129 456 134 17 3 15.1 79.5 2.6 35.3 35.0
Stanford University United States 9 032 127 675 141 16 4 14.1 71.9 2.5 32.0 37.5
California Institute of Technology United States 7 325 117 002 128 28 5 16.0 83.0 2.4 39.8 35.1
University of Tokyo Japan 15 262 113 134 127 1 6 7.4 69.1 1.5 18.8 21.9
CEA France 12 468 110 310 135 3 7 8.8 71.1 1.8 21.5 27.0
CSIC Spain 11 256 110 224 143 5 8 9.8 76.2 1.7 24.2 22.5
INFN Italy 11 863 101 645 133 4 9 8.6 67.4 1.7 22.2 20.0
Princeton University United States 6 697 97 880 127 33 10 14.6 77.7 2.5 32.6 36.4
University of Oxford United Kingdom 7 608 95 321 145 26 11 12.5 78.5 2.2 31.0 25.7
Lawrence Berkeley National Laboratory United States 6 690 91 809 128 34 12 13.7 76.7 2.6 31.4 33.2
University of Cambridge United Kingdom 7 985 87 154 132 22 13 10.9 78.0 2.1 28.4 29.2
CNRS France 10 039 82 295 139 11 14 8.2 75.3 1.5 22.2 23.9
University of Maryland United States 7 008 81 844 124 32 15 11.7 76.1 2.1 30.8 32.3
JRC 1 081 6384 102 637 696 5.9 66.6 1.6 10.7 26.7
World 1 433 978 6 598 953 206 4.6 60.3 1.1 11.6 17.5
Source: © 2014 Elsevier B.V. All rights reserved. SciVal ® is a registered trademark of Elsevier Properties S.A. used under license.
size-dependent metrics
Rank among 4 515
institutions that
published in the field
size-independent metrics

A2 – Planning, Evaluation and Knowledge Management Unit Page 54
Notes: 1) Ranking: own calculation; 2) SNIP: Source-Normalized Impact per Paper is a ratio between the “Raw Impact per Paper”, a type of Citations per Publication calculation, actually received by the journal, compared to the
“Citation Potential”, or expected Citations per Publication, of that journal’s field. SNIP takes differences in disciplinary characteristics into account, and can be used to compare journals in different fields. The average SNIP value
for all journals in Scopus is 1.000; 3) Publications in Top Journal Percentiles in SciVal indicates the extent to which an entity’s publications are present in the most-cited journals in the data universe: how many publications are
in the top 10% of the most-cited journals indexed by Scopus; 4) Outputs in Top Percentiles in SciVal indicates the extent to which an entity’s publications are present in the most-cited percentiles of a data universe: how many
publications are in the top 10% of the most-cited publications; 5) Field-Weighted Citation Impact in SciVal indicates how the number of citations received by an entity’s publications compares with the average number of
citations received by all other similar publications in the data universe. A Field-Weighted Citation Impact of 1.00 indicates that the entity’s publications have been cited exactly as would be expected based on the global average
for similar publications; the Field-Weighted Citation Impact of “World”, or the entire Scopus database, is 1.00; A Field-Weighted Citation Impact of more than 1.00 indicates that the entity’s publications have been cited more
than would be expected based on the global average for similar publications; for example, 2.11 means 111% more cited than world average; A Field-Weighted Citation Impact of less than 1.00 indicates that the entity’s
publications have been cited less than would be expected based on the global average for similar publications; for example, 0.87 means 13% less cited than world average "
Agricultural and Biological Sciences2009 to 2013, All publication types
Top 15 institutions (in terms of N of citations) Country Publications Citations
Number of
Citing
Countries
Citations per
Publication
Cited
Publications
(%)
Field-
Weighted
Citation
Impact
Outputs in
Top
Percentiles
(%)
Publications
in Top Journal
Percentiles
(%)
Publications Citations in top 10% of
the world
in top 10% by
SNIP
U.S. Department of Agriculture United States 18 392 115 493 189 1 1 6.3 75.5 1.3 15.1 13.6
CSIC Spain 11 533 96 184 198 2 2 8.3 83.6 1.7 24.0 24.7
INRA Institut National de La Recherche Agronomique France 8 915 74 193 182 3 3 8.3 81.1 1.7 24.1 24.5
Harvard University United States 5 614 68 030 190 11 4 12.1 83.9 2.1 36.0 23.7
University of California at Davis United States 6 599 58 330 196 8 5 8.8 80.2 1.7 23.8 23.2
Wageningen University and Research Center Netherlands 6 696 58 082 186 7 6 8.7 80.9 1.9 24.7 24.6
Cornell University United States 5 239 51 624 190 14 7 9.9 81.8 1.9 27.0 23.7
CNRS France 5 304 49 556 190 13 8 9.3 84.1 1.8 30.2 24.4
University of Oxford United Kingdom 3 883 45 617 193 29 9 11.7 85.3 2.2 35.3 30.7
University of Florida United States 6 698 45 005 192 6 10 6.7 75.8 1.4 16.7 15.0
University of California at Berkeley United States 3 467 43 310 178 43 11 12.5 85.3 2.1 33.7 31.3
CSIRO Australia 4 373 42 165 188 19 12 9.6 85.3 2.0 26.6 22.8
University of British Columbia Canada 4 077 41 452 185 27 13 10.2 82.7 1.8 28.4 24.5
University of Copenhagen Denmark 4 983 39 680 175 15 14 8.0 82.5 1.8 24.4 21.9
University of Cambridge United Kingdom 3 365 38 109 190 45 15 11.3 84.2 2.1 33.7 31.2
JRC 633 5874 137 569 387 9.3 84.4 2.3 34.4 28.6
World 889 148 4 302 952 230 4.8 66.2 1.0 12.6 12.7
Source: © 2014 Elsevier B.V. All rights reserved. SciVal ® is a registered trademark of Elsevier Properties S.A. used under license.
size-dependent metrics
Rank among 4 594
institutions that
published in the field
size-independent metrics

A2 – Planning, Evaluation and Knowledge Management Unit Page 55
Notes: 1) Ranking: own calculation; 2) SNIP: Source-Normalized Impact per Paper is a ratio between the “Raw Impact per Paper”, a type of Citations per Publication calculation, actually received by the journal, compared to the
“Citation Potential”, or expected Citations per Publication, of that journal’s field. SNIP takes differences in disciplinary characteristics into account, and can be used to compare journals in different fields. The average SNIP value
for all journals in Scopus is 1.000; 3) Publications in Top Journal Percentiles in SciVal indicates the extent to which an entity’s publications are present in the most-cited journals in the data universe: how many publications are
in the top 10% of the most-cited journals indexed by Scopus; 4) Outputs in Top Percentiles in SciVal indicates the extent to which an entity’s publications are present in the most-cited percentiles of a data universe: how many
publications are in the top 10% of the most-cited publications; 5) Field-Weighted Citation Impact in SciVal indicates how the number of citations received by an entity’s publications compares with the average number of
citations received by all other similar publications in the data universe. A Field-Weighted Citation Impact of 1.00 indicates that the entity’s publications have been cited exactly as would be expected based on the global average
for similar publications; the Field-Weighted Citation Impact of “World”, or the entire Scopus database, is 1.00; A Field-Weighted Citation Impact of more than 1.00 indicates that the entity’s publications have been cited more
than would be expected based on the global average for similar publications; for example, 2.11 means 111% more cited than world average; A Field-Weighted Citation Impact of less than 1.00 indicates that the entity’s
publications have been cited less than would be expected based on the global average for similar publications; for example, 0.87 means 13% less cited than world average "
Engineering2009 to 2013, All publication types
Top 15 institutions (in terms of N of citations) Country Publications Citations
Number of
Citing
Countries
Citations per
Publication
Cited
Publications
(%)
Field-
Weighted
Citation
Impact
Outputs in
Top
Percentiles
(%)
Publications
in Top Journal
Percentiles
(%)
Publications Citations in top 10% of
the world
in top 10% by
SNIP
Massachusetts Institute of Technology United States 9 881 79 673 131 21 1 8.1 56.6 2.5 18.5 41.9
Tsinghua University China 23 106 70 798 128 1 2 3.1 48.7 1.1 6.9 18.2
Stanford University United States 6 400 62 186 128 57 3 9.7 59.7 2.9 19.3 43.2
Nanyang Technological University Singapore 10 003 56 796 125 19 4 5.7 58.8 1.9 15.0 40.0
Georgia Institute of Technology United States 10 650 56 585 121 17 5 5.3 52.3 1.9 12.3 35.8
National University of Singapore Singapore 8 038 54 907 119 33 6 6.8 60.9 2.0 16.3 40.2
Harvard University United States 4 643 53 822 131 103 7 11.6 67.3 2.8 26.4 42.7
University of California at Berkeley United States 6 177 51 457 130 66 8 8.3 60.3 2.8 17.1 40.7
Zhejiang University China 17 812 50 168 118 3 9 2.8 47.7 1.0 7.0 15.1
Shanghai Jiaotong University China 15 318 49 343 115 5 10 3.2 50.2 1.0 7.6 20.5
Harbin Institute of Technology China 22 376 49 243 117 2 11 2.2 41.3 0.8 4.8 11.8
University of Texas at Austin United States 6 252 43 027 123 61 12 6.9 52.3 2.2 13.7 39.0
Imperial College London United Kingdom 6 206 41 478 139 64 13 6.7 60.6 2.0 15.8 42.1
University of Michigan United States 7 622 40 481 124 39 14 5.3 55.3 2.0 13.2 38.3
University of Illinois at Urbana-Champaign United States 7 037 40 091 117 49 15 5.7 57.0 2.0 12.9 40.7
JRC 919 5534 99 777 455 6.0 59.1 2.1 12.7 38.5
World 2 413 281 6 118 942 221 2.5 40.2 1.0 5.8 18.5
Source: © 2014 Elsevier B.V. All rights reserved. SciVal ® is a registered trademark of Elsevier Properties S.A. used under license.
size-dependent metrics
Rank among 4 718
institutions that
published in the field
size-independent metrics

A2 – Planning, Evaluation and Knowledge Management Unit Page 56
Notes: 1) Ranking: own calculation; 2) SNIP: Source-Normalized Impact per Paper is a ratio between the “Raw Impact per Paper”, a type of Citations per Publication calculation, actually received by the journal, compared to the
“Citation Potential”, or expected Citations per Publication, of that journal’s field. SNIP takes differences in disciplinary characteristics into account, and can be used to compare journals in different fields. The average SNIP value
for all journals in Scopus is 1.000; 3) Publications in Top Journal Percentiles in SciVal indicates the extent to which an entity’s publications are present in the most-cited journals in the data universe: how many publications are
in the top 10% of the most-cited journals indexed by Scopus; 4) Outputs in Top Percentiles in SciVal indicates the extent to which an entity’s publications are present in the most-cited percentiles of a data universe: how many
publications are in the top 10% of the most-cited publications; 5) Field-Weighted Citation Impact in SciVal indicates how the number of citations received by an entity’s publications compares with the average number of
citations received by all other similar publications in the data universe. A Field-Weighted Citation Impact of 1.00 indicates that the entity’s publications have been cited exactly as would be expected based on the global average
for similar publications; the Field-Weighted Citation Impact of “World”, or the entire Scopus database, is 1.00; A Field-Weighted Citation Impact of more than 1.00 indicates that the entity’s publications have been cited more
than would be expected based on the global average for similar publications; for example, 2.11 means 111% more cited than world average; A Field-Weighted Citation Impact of less than 1.00 indicates that the entity’s
publications have been cited less than would be expected based on the global average for similar publications; for example, 0.87 means 13% less cited than world average "
Chemistry2009 to 2013, All publication types
Top 15 institutions (in terms of N of citations) Country Publications Citations
Number of
Citing
Countries
Citations per
Publication
Cited
Publications
(%)
Field-
Weighted
Citation
Impact
Outputs in
Top
Percentiles
(%)
Publications
in Top Journal
Percentiles
(%)
Publications Citations in top 10% of
the world
in top 10% by
SNIP
Peking University China 7 352 89 580 133 4 1 12.2 85.9 1.8 36.2 20.0
CSIC Spain 7 924 76 671 149 2 2 9.7 86.9 1.5 28.7 26.0
Chinese Academy of Sciences China 7 440 72 715 133 3 3 9.8 80.9 1.6 31.3 20.4
University of California at Berkeley United States 3 170 70 421 134 45 4 22.2 88.6 3.1 47.8 44.7
Northwestern University United States 4 074 67 746 122 26 5 16.6 84.1 2.1 38.3 29.4
Zhejiang University China 7 176 66 516 127 5 6 9.3 80.6 1.5 27.0 16.9
Massachusetts Institute of Technology United States 3 498 64 867 123 38 7 18.5 86.6 2.6 47.6 46.2
National University of Singapore Singapore 4 048 63 285 118 28 8 15.6 88.7 2.4 43.1 28.1
Graduate University of Chinese Academy of Sciences China 6 016 61 516 126 6 9 10.2 85.2 1.5 30.3 15.7
Tsinghua University China 5 582 59 810 125 11 10 10.7 81.3 1.7 29.6 22.2
Nanyang Technological University Singapore 3 955 58 712 120 32 11 14.8 90.5 2.4 45.1 26.3
University of Tokyo Japan 5 420 58 207 121 12 12 10.7 83.8 1.5 29.5 25.8
Stanford University United States 2 780 58 108 124 55 13 20.9 87.8 3.0 50.1 49.6
CNRS France 6 005 55 896 144 7 14 9.3 86.8 1.5 29.0 23.4
Kyoto University Japan 5 624 55 476 117 10 15 9.9 85.2 1.4 28.5 22.9
JRC 597 4796 94 694 648 8.0 84.8 1.2 22.1 22.5
World 995 567 7 607 451 216 7.6 74.9 1.2 21.2 16.8
Source: © 2014 Elsevier B.V. All rights reserved. SciVal ® is a registered trademark of Elsevier Properties S.A. used under license.
size-dependent metrics
Rank among 4 508
institutions that
published in the field
size-independent metrics
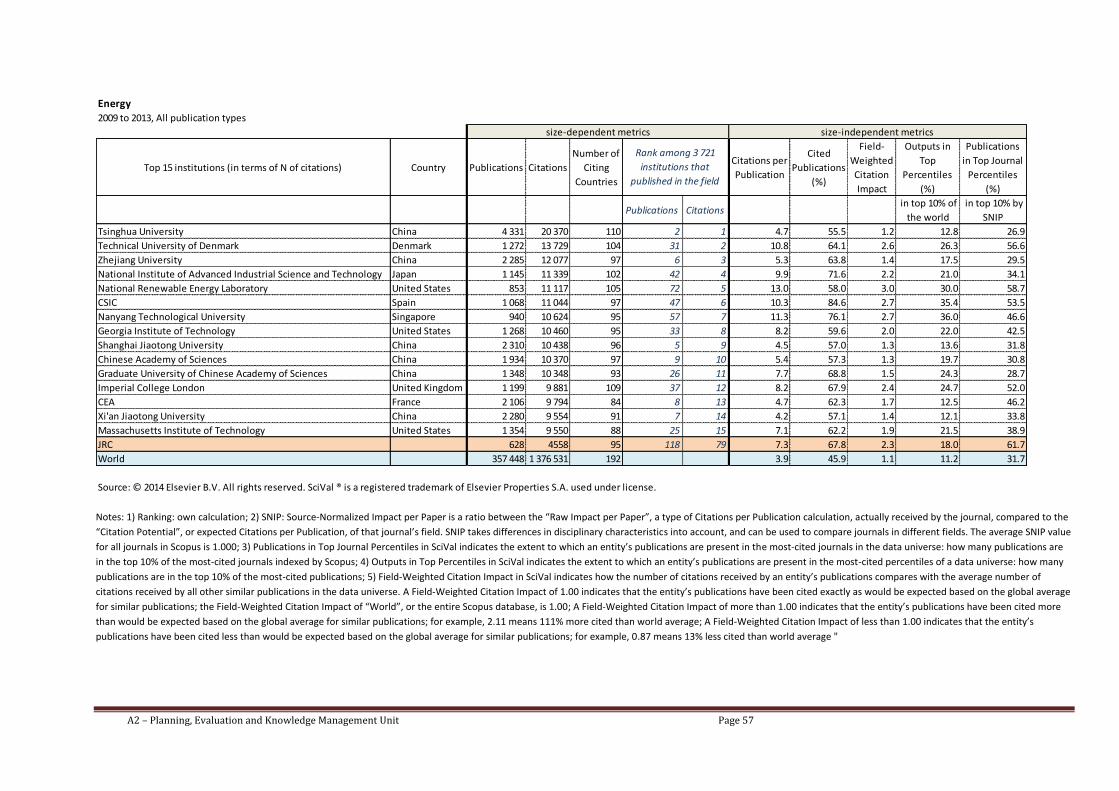
A2 – Planning, Evaluation and Knowledge Management Unit Page 57
Notes: 1) Ranking: own calculation; 2) SNIP: Source-Normalized Impact per Paper is a ratio between the “Raw Impact per Paper”, a type of Citations per Publication calculation, actually received by the journal, compared to the
“Citation Potential”, or expected Citations per Publication, of that journal’s field. SNIP takes differences in disciplinary characteristics into account, and can be used to compare journals in different fields. The average SNIP value
for all journals in Scopus is 1.000; 3) Publications in Top Journal Percentiles in SciVal indicates the extent to which an entity’s publications are present in the most-cited journals in the data universe: how many publications are
in the top 10% of the most-cited journals indexed by Scopus; 4) Outputs in Top Percentiles in SciVal indicates the extent to which an entity’s publications are present in the most-cited percentiles of a data universe: how many
publications are in the top 10% of the most-cited publications; 5) Field-Weighted Citation Impact in SciVal indicates how the number of citations received by an entity’s publications compares with the average number of
citations received by all other similar publications in the data universe. A Field-Weighted Citation Impact of 1.00 indicates that the entity’s publications have been cited exactly as would be expected based on the global average
for similar publications; the Field-Weighted Citation Impact of “World”, or the entire Scopus database, is 1.00; A Field-Weighted Citation Impact of more than 1.00 indicates that the entity’s publications have been cited more
than would be expected based on the global average for similar publications; for example, 2.11 means 111% more cited than world average; A Field-Weighted Citation Impact of less than 1.00 indicates that the entity’s
publications have been cited less than would be expected based on the global average for similar publications; for example, 0.87 means 13% less cited than world average "
Energy2009 to 2013, All publication types
Top 15 institutions (in terms of N of citations) Country Publications Citations
Number of
Citing
Countries
Citations per
Publication
Cited
Publications
(%)
Field-
Weighted
Citation
Impact
Outputs in
Top
Percentiles
(%)
Publications
in Top Journal
Percentiles
(%)
Publications Citations in top 10% of
the world
in top 10% by
SNIP
Tsinghua University China 4 331 20 370 110 2 1 4.7 55.5 1.2 12.8 26.9
Technical University of Denmark Denmark 1 272 13 729 104 31 2 10.8 64.1 2.6 26.3 56.6
Zhejiang University China 2 285 12 077 97 6 3 5.3 63.8 1.4 17.5 29.5
National Institute of Advanced Industrial Science and Technology Japan 1 145 11 339 102 42 4 9.9 71.6 2.2 21.0 34.1
National Renewable Energy Laboratory United States 853 11 117 105 72 5 13.0 58.0 3.0 30.0 58.7
CSIC Spain 1 068 11 044 97 47 6 10.3 84.6 2.7 35.4 53.5
Nanyang Technological University Singapore 940 10 624 95 57 7 11.3 76.1 2.7 36.0 46.6
Georgia Institute of Technology United States 1 268 10 460 95 33 8 8.2 59.6 2.0 22.0 42.5
Shanghai Jiaotong University China 2 310 10 438 96 5 9 4.5 57.0 1.3 13.6 31.8
Chinese Academy of Sciences China 1 934 10 370 97 9 10 5.4 57.3 1.3 19.7 30.8
Graduate University of Chinese Academy of Sciences China 1 348 10 348 93 26 11 7.7 68.8 1.5 24.3 28.7
Imperial College London United Kingdom 1 199 9 881 109 37 12 8.2 67.9 2.4 24.7 52.0
CEA France 2 106 9 794 84 8 13 4.7 62.3 1.7 12.5 46.2
Xi'an Jiaotong University China 2 280 9 554 91 7 14 4.2 57.1 1.4 12.1 33.8
Massachusetts Institute of Technology United States 1 354 9 550 88 25 15 7.1 62.2 1.9 21.5 38.9
JRC 628 4558 95 118 79 7.3 67.8 2.3 18.0 61.7
World 357 448 1 376 531 192 3.9 45.9 1.1 11.2 31.7
Source: © 2014 Elsevier B.V. All rights reserved. SciVal ® is a registered trademark of Elsevier Properties S.A. used under license.
size-dependent metrics
Rank among 3 721
institutions that
published in the field
size-independent metrics

A2 – Planning, Evaluation and Knowledge Management Unit Page 58
Notes: 1) Ranking: own calculation; 2) SNIP: Source-Normalized Impact per Paper is a ratio between the “Raw Impact per Paper”, a type of Citations per Publication calculation, actually received by the journal, compared to the
“Citation Potential”, or expected Citations per Publication, of that journal’s field. SNIP takes differences in disciplinary characteristics into account, and can be used to compare journals in different fields. The average SNIP value
for all journals in Scopus is 1.000; 3) Publications in Top Journal Percentiles in SciVal indicates the extent to which an entity’s publications are present in the most-cited journals in the data universe: how many publications are
in the top 10% of the most-cited journals indexed by Scopus; 4) Outputs in Top Percentiles in SciVal indicates the extent to which an entity’s publications are present in the most-cited percentiles of a data universe: how many
publications are in the top 10% of the most-cited publications; 5) Field-Weighted Citation Impact in SciVal indicates how the number of citations received by an entity’s publications compares with the average number of
citations received by all other similar publications in the data universe. A Field-Weighted Citation Impact of 1.00 indicates that the entity’s publications have been cited exactly as would be expected based on the global average
for similar publications; the Field-Weighted Citation Impact of “World”, or the entire Scopus database, is 1.00; A Field-Weighted Citation Impact of more than 1.00 indicates that the entity’s publications have been cited more
than would be expected based on the global average for similar publications; for example, 2.11 means 111% more cited than world average; A Field-Weighted Citation Impact of less than 1.00 indicates that the entity’s
publications have been cited less than would be expected based on the global average for similar publications; for example, 0.87 means 13% less cited than world average "
Materials Science2009 to 2013, All publication types
Top 15 institutions (in terms of N of citations) Country Publications Citations
Number of
Citing
Countries
Citations per
Publication
Cited
Publications
(%)
Field-
Weighted
Citation
Impact
Outputs in
Top
Percentiles
(%)
Publications
in Top Journal
Percentiles
(%)
Publications Citations in top 10% of
the world
in top 10% by
SNIP
Massachusetts Institute of Technology United States 5 089 69 006 124 24 1 13.6 74.7 2.8 33.6 37.4
National University of Singapore Singapore 5 065 61 888 112 26 2 12.2 77.6 2.2 33.1 29.3
Peking University China 5 787 60 810 118 16 3 10.5 77.2 2.1 31.1 23.3
Nanyang Technological University Singapore 5 535 59 640 124 18 4 10.8 76.7 2.3 29.4 27.1
Chinese Academy of Sciences China 8 046 56 419 118 4 5 7.0 66.6 1.5 20.9 15.7
Tsinghua University China 8 854 56 057 123 2 6 6.3 63.8 1.4 15.9 17.1
Stanford University United States 3 636 53 761 116 52 7 14.8 72.2 3.1 31.6 32.4
Zhejiang University China 7 409 49 129 115 6 8 6.6 69.4 1.3 19.7 16.2
Graduate University of Chinese Academy of Sciences China 6 575 47 969 114 9 9 7.3 72.3 1.4 19.8 12.0
CSIC Spain 6 327 47 773 123 11 10 7.6 79.8 1.6 21.4 22.3
Northwestern University United States 3 739 45 524 114 50 11 12.2 75.1 2.3 31.3 31.8
University of Tokyo Japan 6 947 45 181 110 8 12 6.5 68.5 1.5 15.7 16.6
Georgia Institute of Technology United States 4 366 45 049 123 36 13 10.3 70.2 2.3 27.2 33.5
University of California at Berkeley United States 3 452 44 354 112 60 14 12.8 76.5 2.8 29.1 28.3
University of Cambridge United Kingdom 3 954 43 542 120 43 15 11.0 75.8 2.1 27.3 27.3
JRC 561 3988 87 772 575 7.1 70.9 2.3 11.1 33.5
World 1 159 372 5 691 126 199 4.9 59.2 1.1 12.9 16.1
Source: © 2014 Elsevier B.V. All rights reserved. SciVal ® is a registered trademark of Elsevier Properties S.A. used under license.
size-dependent metrics
Rank among 4 430
institutions that
published in the field
size-independent metrics

A2 – Planning, Evaluation and Knowledge Management Unit Page 59
Notes: 1) Ranking: own calculation; 2) SNIP: Source-Normalized Impact per Paper is a ratio between the “Raw Impact per Paper”, a type of Citations per Publication calculation, actually received by the journal, compared to the
“Citation Potential”, or expected Citations per Publication, of that journal’s field. SNIP takes differences in disciplinary characteristics into account, and can be used to compare journals in different fields. The average SNIP value
for all journals in Scopus is 1.000; 3) Publications in Top Journal Percentiles in SciVal indicates the extent to which an entity’s publications are present in the most-cited journals in the data universe: how many publications are
in the top 10% of the most-cited journals indexed by Scopus; 4) Outputs in Top Percentiles in SciVal indicates the extent to which an entity’s publications are present in the most-cited percentiles of a data universe: how many
publications are in the top 10% of the most-cited publications; 5) Field-Weighted Citation Impact in SciVal indicates how the number of citations received by an entity’s publications compares with the average number of
citations received by all other similar publications in the data universe. A Field-Weighted Citation Impact of 1.00 indicates that the entity’s publications have been cited exactly as would be expected based on the global average
for similar publications; the Field-Weighted Citation Impact of “World”, or the entire Scopus database, is 1.00; A Field-Weighted Citation Impact of more than 1.00 indicates that the entity’s publications have been cited more
than would be expected based on the global average for similar publications; for example, 2.11 means 111% more cited than world average; A Field-Weighted Citation Impact of less than 1.00 indicates that the entity’s
publications have been cited less than would be expected based on the global average for similar publications; for example, 0.87 means 13% less cited than world average "
Pharmacology, Toxicology and Pharmaceutics2009 to 2013, All publication types
Top 15 institutions (in terms of N of citations) Country Publications Citations
Number of
Citing
Countries
Citations per
Publication
Cited
Publications
(%)
Field-
Weighted
Citation
Impact
Outputs in
Top
Percentiles
(%)
Publications
in Top Journal
Percentiles
(%)
Publications Citations in top 10% of
the world
in top 10% by
SNIP
Harvard University United States 3 000 33 670 154 1 1 11.2 84.0 1.8 32.1 20.9
Pfizer United States 2 910 26 804 126 2 2 9.2 82.3 1.5 26.3 14.3
VA Medical Center United States 2 246 20 997 140 5 3 9.3 81.4 1.6 28.8 15.6
GlaxoSmithKline United Kingdom 2 105 20 459 135 8 4 9.7 81.2 1.6 25.7 14.1
University of North Carolina United States 1 772 18 986 134 14 5 10.7 82.2 1.8 30.1 19.5
University of Toronto Canada 1 880 18 274 129 11 6 9.7 79.6 1.6 29.8 19.5
INSERM France 1 787 18 046 133 13 7 10.1 87.4 1.6 29.1 24.6
Johns Hopkins University United States 1 752 17 044 146 15 8 9.7 83.8 1.7 29.8 17.3
University of California at San Francisco United States 1 447 16 829 136 25 9 11.6 83.8 2.0 32.9 23.4
University of California at San Diego United States 1 386 16 675 137 29 10 12.0 85.4 2.0 35.6 18.2
University of Copenhagen Denmark 1 613 15 403 142 19 11 9.5 84.1 1.8 28.1 20.2
University College London United Kingdom 1 360 15 159 151 32 12 11.1 84.9 1.9 34.0 21.0
Karolinska Institutet Sweden 1 229 14 953 139 45 13 12.2 85.0 2.0 30.1 18.7
Utrecht University Netherlands 1 436 14 784 138 26 14 10.3 80.6 1.7 30.7 20.7
University of Pittsburgh United States 1 481 14 695 118 21 15 9.9 83.5 1.7 29.4 14.0
JRC 251 3195 80 595 350 12.7 88.8 1.8 37.8 12.3
World 412 862 2 367 261 217 5.7 65.8 1.0 15.8 9.9
Source: © 2014 Elsevier B.V. All rights reserved. SciVal ® is a registered trademark of Elsevier Properties S.A. used under license.
size-dependent metrics
Rank among 4 301
institutions that
published in the field
size-independent metrics

A2 – Planning, Evaluation and Knowledge Management Unit Page 60
Notes: 1) Ranking: own calculation; 2) SNIP: Source-Normalized Impact per Paper is a ratio between the “Raw Impact per Paper”, a type of Citations per Publication calculation, actually received by the journal, compared to the
“Citation Potential”, or expected Citations per Publication, of that journal’s field. SNIP takes differences in disciplinary characteristics into account, and can be used to compare journals in different fields. The average SNIP value
for all journals in Scopus is 1.000; 3) Publications in Top Journal Percentiles in SciVal indicates the extent to which an entity’s publications are present in the most-cited journals in the data universe: how many publications are
in the top 10% of the most-cited journals indexed by Scopus; 4) Outputs in Top Percentiles in SciVal indicates the extent to which an entity’s publications are present in the most-cited percentiles of a data universe: how many
publications are in the top 10% of the most-cited publications; 5) Field-Weighted Citation Impact in SciVal indicates how the number of citations received by an entity’s publications compares with the average number of
citations received by all other similar publications in the data universe. A Field-Weighted Citation Impact of 1.00 indicates that the entity’s publications have been cited exactly as would be expected based on the global average
for similar publications; the Field-Weighted Citation Impact of “World”, or the entire Scopus database, is 1.00; A Field-Weighted Citation Impact of more than 1.00 indicates that the entity’s publications have been cited more
than would be expected based on the global average for similar publications; for example, 2.11 means 111% more cited than world average; A Field-Weighted Citation Impact of less than 1.00 indicates that the entity’s
publications have been cited less than would be expected based on the global average for similar publications; for example, 0.87 means 13% less cited than world average "
Biochemistry, Genetics and Molecular Biology2009 to 2013, All publication types
Top 15 institutions (in terms of N of citations) Country Publications Citations
Number of
Citing
Countries
Citations per
Publication
Cited
Publications
(%)
Field-
Weighted
Citation
Impact
Outputs in
Top
Percentiles
(%)
Publications
in Top Journal
Percentiles
(%)
Publications Citations in top 10% of
the world
in top 10% by
SNIP
Harvard University United States 25 600 486 899 199 1 1 19.0 87.6 2.3 45.0 39.8
University of Toronto Canada 11 758 169 215 178 2 2 14.4 86.4 1.8 38.3 32.3
University of California at San Francisco United States 8 622 169 107 177 17 3 19.6 88.1 2.3 46.3 37.3
Johns Hopkins University United States 10 304 166 290 187 4 4 16.1 86.5 2.0 40.8 30.7
University of Oxford United Kingdom 9 247 161 702 193 10 5 17.5 88.5 2.2 43.3 34.5
University of Michigan United States 9 416 159 316 185 6 6 16.9 86.9 2.0 40.5 32.2
University of Cambridge United Kingdom 8 571 156 306 184 18 7 18.2 88.7 2.2 44.7 36.2
University of Pennsylvania United States 9 250 153 813 170 9 8 16.6 86.7 2.0 41.9 35.3
Stanford University United States 8 928 153 635 180 12 9 17.2 87.2 2.2 43.8 40.7
INSERM France 11 056 152 136 183 3 10 13.8 86.8 1.7 38.6 28.4
University of California at San Diego United States 8 657 147 483 194 16 11 17.0 88.0 2.1 42.9 31.8
University of California at Los Angeles United States 8 434 143 147 188 19 12 17.0 86.8 2.1 42.7 33.5
National Cancer Institute United States 8 218 142 574 175 22 13 17.3 88.5 2.0 42.1 34.2
University of Texas M. D. Anderson Cancer Center United States 8 319 141 796 159 20 14 17.0 86.9 2.0 43.6 44.4
University of Washington United States 8 658 140 319 182 15 15 16.2 87.5 2.0 40.4 32.3
JRC 324 3242 94 1 356 1231 10.0 89.2 1.7 34.6 23.5
World 1 406 903 12 175 656 232 8.7 75.5 1.2 23.8 17.7
Source: © 2014 Elsevier B.V. All rights reserved. SciVal ® is a registered trademark of Elsevier Properties S.A. used under license.
size-dependent metrics
Rank among 4 704
institutions that
published in the field
size-independent metrics

A2 – Planning, Evaluation and Knowledge Management Unit Page 61
Notes: 1) Ranking: own calculation; 2) SNIP: Source-Normalized Impact per Paper is a ratio between the “Raw Impact per Paper”, a type of Citations per Publication calculation, actually received by the journal, compared to the
“Citation Potential”, or expected Citations per Publication, of that journal’s field. SNIP takes differences in disciplinary characteristics into account, and can be used to compare journals in different fields. The average SNIP value
for all journals in Scopus is 1.000; 3) Publications in Top Journal Percentiles in SciVal indicates the extent to which an entity’s publications are present in the most-cited journals in the data universe: how many publications are
in the top 10% of the most-cited journals indexed by Scopus; 4) Outputs in Top Percentiles in SciVal indicates the extent to which an entity’s publications are present in the most-cited percentiles of a data universe: how many
publications are in the top 10% of the most-cited publications; 5) Field-Weighted Citation Impact in SciVal indicates how the number of citations received by an entity’s publications compares with the average number of
citations received by all other similar publications in the data universe. A Field-Weighted Citation Impact of 1.00 indicates that the entity’s publications have been cited exactly as would be expected based on the global average
for similar publications; the Field-Weighted Citation Impact of “World”, or the entire Scopus database, is 1.00; A Field-Weighted Citation Impact of more than 1.00 indicates that the entity’s publications have been cited more
than would be expected based on the global average for similar publications; for example, 2.11 means 111% more cited than world average; A Field-Weighted Citation Impact of less than 1.00 indicates that the entity’s
publications have been cited less than would be expected based on the global average for similar publications; for example, 0.87 means 13% less cited than world average "
Medicine2009 to 2013, All publication types
Top 15 institutions (in terms of N of
citations)Country Publications Citations
Number of
Citing
Countries
Citations per
Publication
Cited
Publications
(%)
Field-
Weighted
Citation
Impact
Outputs in
Top
Percentiles
(%)
Publications
in Top Journal
Percentiles
(%)
Publications Citations in top 10% of
the world
in top 10% by
SNIP
Harvard University United States 68 956 915 826 210 1 1 13.3 78.5 2.5 32.1 42.1
Johns Hopkins University United States 32 138 398 410 206 3 2 12.4 78.3 2.3 29.9 36.4
University of Toronto Canada 35 268 370 809 206 2 3 10.5 76.7 2.0 25.4 32.0
VA Medical Center United States 30 887 338 718 201 4 4 11.0 79.7 2.0 28.7 33.2
University of California at San Francisco United States 24 275 328 463 204 7 5 13.5 79.6 2.5 32.0 41.6
University of Pennsylvania United States 25 060 302 371 197 6 6 12.1 77.1 2.3 29.0 37.7
University College London United Kingdom 26 743 296 656 208 5 7 11.1 76.4 2.2 28.5 32.2
University of California at Los Angeles United States 22 894 272 127 202 8 8 11.9 78.0 2.2 29.1 35.4
University of Washington United States 22 317 267 226 203 9 9 12.0 78.4 2.3 29.0 37.0
Duke University United States 19 356 254 425 203 15 10 13.1 78.7 2.4 29.9 39.3
University of Pittsburgh United States 22 208 253 141 194 11 11 11.4 78.7 2.1 29.3 34.1
University of Michigan United States 22 308 249 559 197 10 12 11.2 77.4 2.0 28.3 37.1
Mayo Clinic Rochester MN United States 19 265 245 338 195 18 13 12.7 75.3 2.3 28.9 41.9
Columbia University United States 20 020 233 940 207 13 14 11.7 77.8 2.3 29.3 37.2
University of Oxford United Kingdom 16 693 225 772 205 23 15 13.5 78.6 2.6 32.3 35.7
JRC 309 3 120 130 1 944 1516 10.1 80.3 2.3 29.1 17.0
World 3 460 869 17 899 216 234 5.2 57.9 1.0 13.0 18.1
Source: © 2014 Elsevier B.V. All rights reserved. SciVal ® is a registered trademark of Elsevier Properties S.A. used under license.
size-dependent metrics size-independent metrics
Rank among 4 746
institutions that
published in the field

A2 – Planning, Evaluation and Knowledge Management Unit Page 62
Notes: 1) Ranking: own calculation; 2) SNIP: Source-Normalized Impact per Paper is a ratio between the “Raw Impact per Paper”, a type of Citations per Publication calculation, actually received by the journal, compared to the
“Citation Potential”, or expected Citations per Publication, of that journal’s field. SNIP takes differences in disciplinary characteristics into account, and can be used to compare journals in different fields. The average SNIP value
for all journals in Scopus is 1.000; 3) Publications in Top Journal Percentiles in SciVal indicates the extent to which an entity’s publications are present in the most-cited journals in the data universe: how many publications are
in the top 10% of the most-cited journals indexed by Scopus; 4) Outputs in Top Percentiles in SciVal indicates the extent to which an entity’s publications are present in the most-cited percentiles of a data universe: how many
publications are in the top 10% of the most-cited publications; 5) Field-Weighted Citation Impact in SciVal indicates how the number of citations received by an entity’s publications compares with the average number of
citations received by all other similar publications in the data universe. A Field-Weighted Citation Impact of 1.00 indicates that the entity’s publications have been cited exactly as would be expected based on the global average
for similar publications; the Field-Weighted Citation Impact of “World”, or the entire Scopus database, is 1.00; A Field-Weighted Citation Impact of more than 1.00 indicates that the entity’s publications have been cited more
than would be expected based on the global average for similar publications; for example, 2.11 means 111% more cited than world average; A Field-Weighted Citation Impact of less than 1.00 indicates that the entity’s
publications have been cited less than would be expected based on the global average for similar publications; for example, 0.87 means 13% less cited than world average "
Computer Science2009 to 2013, All publication types
Top 15 institutions (in terms of N of citations) Country Publications Citations
Number of
Citing
Countries
Citations per
Publication
Cited
Publications
(%)
Field-
Weighted
Citation
Impact
Outputs in
Top
Percentiles
(%)
Publications
in Top Journal
Percentiles
(%)
Publications Citations in top 10% of
the world
in top 10% by
SNIP
Massachusetts Institute of Technology United States 7 479 37 542 120 9 1 5.0 54.9 2.5 10.5 38.2
Stanford University United States 5 461 34 320 125 24 2 6.3 57.6 3.2 14.0 42.3
Nanyang Technological University Singapore 8 146 33 521 113 5 3 4.1 50.5 1.8 9.7 37.1
Tsinghua University China 13 650 32 439 109 1 4 2.4 43.1 1.1 5.1 19.8
University of California at Berkeley United States 5 180 32 300 126 27 5 6.2 58.4 2.8 11.3 40.3
University of Illinois at Urbana-Champaign United States 5 774 31 265 106 22 6 5.4 56.8 2.5 9.7 36.9
Carnegie Mellon University United States 7 377 30 822 111 10 7 4.2 55.5 2.5 8.6 38.6
Microsoft USA United States 4 976 29 617 100 32 8 6.0 61.9 4.3 12.9 39.2
Georgia Institute of Technology United States 6 716 26 031 111 14 9 3.9 50.6 1.9 8.4 36.4
University of California at San Diego United States 4 122 25 344 122 53 10 6.1 57.5 2.7 12.9 36.4
University of Texas at Austin United States 4 710 25 169 112 40 11 5.3 54.2 2.5 11.3 39.0
National University of Singapore Singapore 6 379 24 833 105 18 12 3.9 50.6 1.7 8.2 36.7
ETH Zurich Switzerland 4 803 23 492 107 38 13 4.9 57.6 2.4 11.5 35.6
IBM United States 6 635 21 617 112 15 14 3.3 50.7 2.1 5.9 37.5
Harbin Institute of Technology China 8 877 21 263 101 2 15 2.4 40.3 0.9 5.3 15.0
JRC 590 1992 85 840 637 3.4 49.0 1.5 8.6 28.4
World 1 490 951 3 139 017 219 2.1 39.1 1.1 4.1 20.5
Source: © 2014 Elsevier B.V. All rights reserved. SciVal ® is a registered trademark of Elsevier Properties S.A. used under license.
size-dependent metrics size-independent metrics
Rank among 4 545
institutions that
published in the field

A2 – Planning, Evaluation and Knowledge Management Unit Page 63
Notes: 1) Ranking: own calculation; 2) SNIP: Source-Normalized Impact per Paper is a ratio between the “Raw Impact per Paper”, a type of Citations per Publication calculation, actually received by the journal, compared to the
“Citation Potential”, or expected Citations per Publication, of that journal’s field. SNIP takes differences in disciplinary characteristics into account, and can be used to compare journals in different fields. The average SNIP value
for all journals in Scopus is 1.000; 3) Publications in Top Journal Percentiles in SciVal indicates the extent to which an entity’s publications are present in the most-cited journals in the data universe: how many publications are
in the top 10% of the most-cited journals indexed by Scopus; 4) Outputs in Top Percentiles in SciVal indicates the extent to which an entity’s publications are present in the most-cited percentiles of a data universe: how many
publications are in the top 10% of the most-cited publications; 5) Field-Weighted Citation Impact in SciVal indicates how the number of citations received by an entity’s publications compares with the average number of
citations received by all other similar publications in the data universe. A Field-Weighted Citation Impact of 1.00 indicates that the entity’s publications have been cited exactly as would be expected based on the global average
for similar publications; the Field-Weighted Citation Impact of “World”, or the entire Scopus database, is 1.00; A Field-Weighted Citation Impact of more than 1.00 indicates that the entity’s publications have been cited more
than would be expected based on the global average for similar publications; for example, 2.11 means 111% more cited than world average; A Field-Weighted Citation Impact of less than 1.00 indicates that the entity’s
publications have been cited less than would be expected based on the global average for similar publications; for example, 0.87 means 13% less cited than world average "
Multidisciplinary2009 to 2013, All publication types
Top 15 institutions (in terms of N of citations) Country Publications Citations
Number of
Citing
Countries
Citations per
Publication
Cited
Publications
(%)
Field-
Weighted
Citation
Impact
Outputs in
Top
Percentiles
(%)
Publications
in Top Journal
Percentiles
(%)
Publications Citations in top 10% of
the world
in top 10% by
SNIP
Harvard University United States 3 084 177 889 179 1 1 57.7 92.5 4.6 74.3 97.3
Stanford University United States 1 539 87 188 183 6 2 56.7 89.9 4.3 68.7 96.4
Massachusetts Institute of Technology United States 1 235 72 463 148 8 3 58.7 89.8 4.6 72.1 96.8
University of California at Berkeley United States 1 199 61 665 172 9 4 51.4 89.7 4.0 68.1 93.0
University of Washington United States 829 53 425 178 21 5 64.4 89.4 4.5 71.3 96.7
University of Oxford United Kingdom 1 021 50 350 178 13 6 49.3 83.4 3.9 62.5 93.7
University of California at San Francisco United States 827 50 332 148 22 7 60.9 93.6 5.2 77.0 98.5
University of California at San Diego United States 1 097 50 202 164 12 8 45.8 91.0 3.4 68.7 98.2
Washington University St. Louis United States 583 49 983 158 40 9 85.7 92.6 6.7 77.0 98.8
Yale University United States 978 49 790 165 14 10 50.9 91.3 3.8 71.4 96.8
University of Cambridge United Kingdom 890 47 866 176 17 11 53.8 87.4 4.2 66.3 94.6
Cornell University United States 822 47 361 162 24 12 57.6 89.3 4.2 69.8 96.7
University of California at Los Angeles United States 841 44 437 170 20 13 52.8 90.8 3.9 70.3 95.3
Johns Hopkins University United States 733 43 978 155 29 14 60.0 90.6 4.3 69.8 96.9
Columbia University United States 882 41 673 159 18 15 47.2 88.2 3.4 65.8 95.5
JRC 37 2008 113 922 526 54.3 78.4 4.1 51.4 93.9
World 122 815 1 483 483 223 12.1 52.2 1.1 20.9 44.8
Source: © 2014 Elsevier B.V. All rights reserved. SciVal ® is a registered trademark of Elsevier Properties S.A. used under license.
size-dependent metrics size-independent metrics
Rank among 4 084
institutions that
published in the field

A2 – Planning, Evaluation and Knowledge Management Unit Page 64
Notes: 1) Ranking: own calculation; 2) SNIP: Source-Normalized Impact per Paper is a ratio between the “Raw Impact per Paper”, a type of Citations per Publication calculation, actually received by the journal, compared to the
“Citation Potential”, or expected Citations per Publication, of that journal’s field. SNIP takes differences in disciplinary characteristics into account, and can be used to compare journals in different fields. The average SNIP value
for all journals in Scopus is 1.000; 3) Publications in Top Journal Percentiles in SciVal indicates the extent to which an entity’s publications are present in the most-cited journals in the data universe: how many publications are
in the top 10% of the most-cited journals indexed by Scopus; 4) Outputs in Top Percentiles in SciVal indicates the extent to which an entity’s publications are present in the most-cited percentiles of a data universe: how many
publications are in the top 10% of the most-cited publications; 5) Field-Weighted Citation Impact in SciVal indicates how the number of citations received by an entity’s publications compares with the average number of
citations received by all other similar publications in the data universe. A Field-Weighted Citation Impact of 1.00 indicates that the entity’s publications have been cited exactly as would be expected based on the global average
for similar publications; the Field-Weighted Citation Impact of “World”, or the entire Scopus database, is 1.00; A Field-Weighted Citation Impact of more than 1.00 indicates that the entity’s publications have been cited more
than would be expected based on the global average for similar publications; for example, 2.11 means 111% more cited than world average; A Field-Weighted Citation Impact of less than 1.00 indicates that the entity’s
publications have been cited less than would be expected based on the global average for similar publications; for example, 0.87 means 13% less cited than world average "
Social Sciences2009 to 2013, All publication types
Top 15 institutions (in terms of N of citations) Country Publications Citations
Number of
Citing
Countries
Citations per
Publication
Cited
Publications
(%)
Field-
Weighted
Citation
Impact
Outputs in
Top
Percentiles
(%)
Publications
in Top Journal
Percentiles
(%)
Publications Citations in top 10% of
the world
in top 10% by
SNIP
Harvard University United States 5 528 28 314 158 1 1 5.1 64.5 2.2 12.8 32.4
University of Michigan United States 4 504 21 301 144 4 2 4.7 64.8 2.0 11.2 30.7
University of California at Berkeley United States 3 910 20 029 150 10 3 5.1 60.8 2.3 11.5 31.2
University of Toronto Canada 5 344 19 829 153 2 4 3.7 59.6 1.7 8.3 24.2
University of Oxford United Kingdom 5 174 19 078 154 3 5 3.7 59.1 1.9 9.0 24.6
Stanford University United States 3 360 17 522 150 23 6 5.2 63.2 2.5 13.5 36.4
Arizona State University United States 3 754 16 877 152 11 7 4.5 64.3 1.9 10.5 23.7
University of California at Los Angeles United States 3 490 16 653 139 18 8 4.8 63.0 2.0 10.4 25.7
University of Washington United States 3 502 16 599 148 17 9 4.7 63.5 1.9 10.3 25.6
University of Texas at Austin United States 4 090 16 102 128 5 10 3.9 61.2 1.7 8.4 25.0
University of Minnesota United States 3 605 15 567 134 13 11 4.3 63.5 1.9 9.9 26.3
Columbia University United States 3 984 15 367 151 7 12 3.9 61.0 1.8 9.4 26.3
University of British Columbia Canada 3 401 15 096 155 21 13 4.4 62.9 1.8 10.4 25.5
University of North Carolina United States 3 600 14 870 141 14 14 4.1 61.1 1.6 9.1 21.8
University of Illinois at Urbana-Champaign United States 3 741 14 762 126 12 15 3.9 57.5 1.6 7.0 25.3
JRC 391 1821 105 601 374 4.7 67.3 2.1 15.6 27.3
World 938 980 1 905 649 227 2.0 41.6 1.0 3.7 14.3
Source: © 2014 Elsevier B.V. All rights reserved. SciVal ® is a registered trademark of Elsevier Properties S.A. used under license.
size-dependent metrics size-independent metrics
Rank among 4 453
institutions that
published in the field
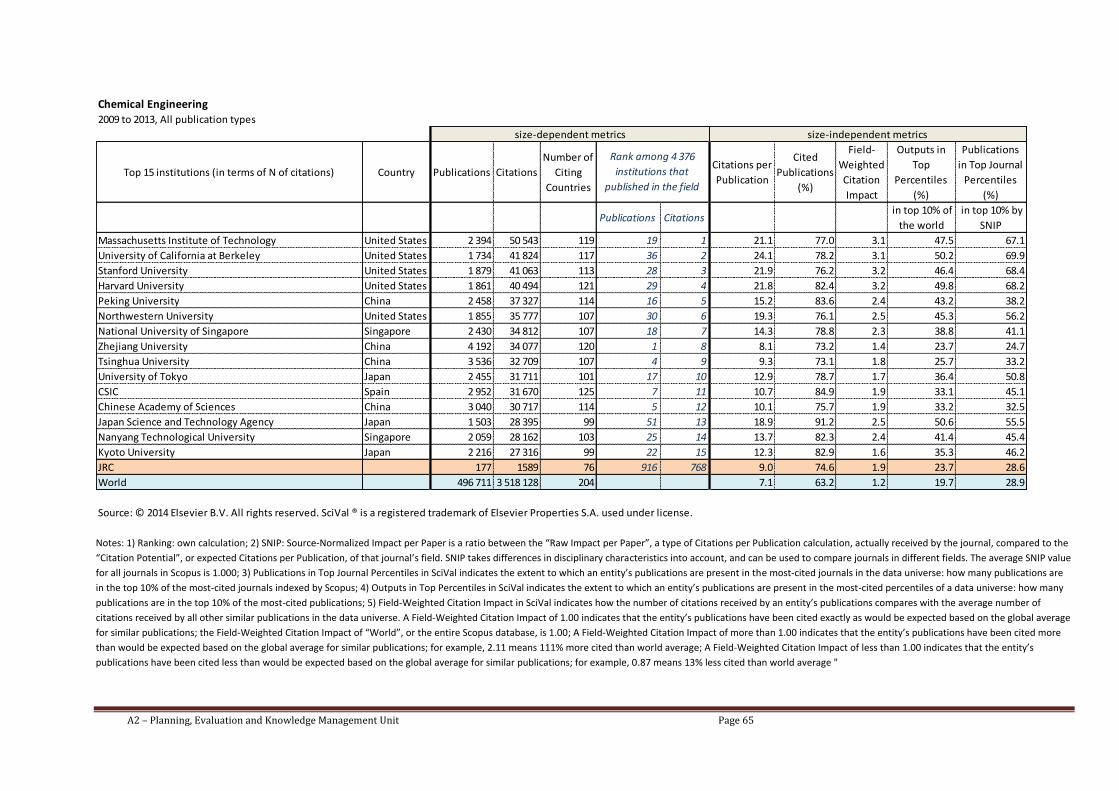
A2 – Planning, Evaluation and Knowledge Management Unit Page 65
Notes: 1) Ranking: own calculation; 2) SNIP: Source-Normalized Impact per Paper is a ratio between the “Raw Impact per Paper”, a type of Citations per Publication calculation, actually received by the journal, compared to the
“Citation Potential”, or expected Citations per Publication, of that journal’s field. SNIP takes differences in disciplinary characteristics into account, and can be used to compare journals in different fields. The average SNIP value
for all journals in Scopus is 1.000; 3) Publications in Top Journal Percentiles in SciVal indicates the extent to which an entity’s publications are present in the most-cited journals in the data universe: how many publications are
in the top 10% of the most-cited journals indexed by Scopus; 4) Outputs in Top Percentiles in SciVal indicates the extent to which an entity’s publications are present in the most-cited percentiles of a data universe: how many
publications are in the top 10% of the most-cited publications; 5) Field-Weighted Citation Impact in SciVal indicates how the number of citations received by an entity’s publications compares with the average number of
citations received by all other similar publications in the data universe. A Field-Weighted Citation Impact of 1.00 indicates that the entity’s publications have been cited exactly as would be expected based on the global average
for similar publications; the Field-Weighted Citation Impact of “World”, or the entire Scopus database, is 1.00; A Field-Weighted Citation Impact of more than 1.00 indicates that the entity’s publications have been cited more
than would be expected based on the global average for similar publications; for example, 2.11 means 111% more cited than world average; A Field-Weighted Citation Impact of less than 1.00 indicates that the entity’s
publications have been cited less than would be expected based on the global average for similar publications; for example, 0.87 means 13% less cited than world average "
Chemical Engineering2009 to 2013, All publication types
Top 15 institutions (in terms of N of citations) Country Publications Citations
Number of
Citing
Countries
Citations per
Publication
Cited
Publications
(%)
Field-
Weighted
Citation
Impact
Outputs in
Top
Percentiles
(%)
Publications
in Top Journal
Percentiles
(%)
Publications Citations in top 10% of
the world
in top 10% by
SNIP
Massachusetts Institute of Technology United States 2 394 50 543 119 19 1 21.1 77.0 3.1 47.5 67.1
University of California at Berkeley United States 1 734 41 824 117 36 2 24.1 78.2 3.1 50.2 69.9
Stanford University United States 1 879 41 063 113 28 3 21.9 76.2 3.2 46.4 68.4
Harvard University United States 1 861 40 494 121 29 4 21.8 82.4 3.2 49.8 68.2
Peking University China 2 458 37 327 114 16 5 15.2 83.6 2.4 43.2 38.2
Northwestern University United States 1 855 35 777 107 30 6 19.3 76.1 2.5 45.3 56.2
National University of Singapore Singapore 2 430 34 812 107 18 7 14.3 78.8 2.3 38.8 41.1
Zhejiang University China 4 192 34 077 120 1 8 8.1 73.2 1.4 23.7 24.7
Tsinghua University China 3 536 32 709 107 4 9 9.3 73.1 1.8 25.7 33.2
University of Tokyo Japan 2 455 31 711 101 17 10 12.9 78.7 1.7 36.4 50.8
CSIC Spain 2 952 31 670 125 7 11 10.7 84.9 1.9 33.1 45.1
Chinese Academy of Sciences China 3 040 30 717 114 5 12 10.1 75.7 1.9 33.2 32.5
Japan Science and Technology Agency Japan 1 503 28 395 99 51 13 18.9 91.2 2.5 50.6 55.5
Nanyang Technological University Singapore 2 059 28 162 103 25 14 13.7 82.3 2.4 41.4 45.4
Kyoto University Japan 2 216 27 316 99 22 15 12.3 82.9 1.6 35.3 46.2
JRC 177 1589 76 916 768 9.0 74.6 1.9 23.7 28.6
World 496 711 3 518 128 204 7.1 63.2 1.2 19.7 28.9
Source: © 2014 Elsevier B.V. All rights reserved. SciVal ® is a registered trademark of Elsevier Properties S.A. used under license.
size-dependent metrics size-independent metrics
Rank among 4 376
institutions that
published in the field

A2 – Planning, Evaluation and Knowledge Management Unit Page 66
Notes: 1) Ranking: own calculation; 2) SNIP: Source-Normalized Impact per Paper is a ratio between the “Raw Impact per Paper”, a type of Citations per Publication calculation, actually received by the journal, compared to the
“Citation Potential”, or expected Citations per Publication, of that journal’s field. SNIP takes differences in disciplinary characteristics into account, and can be used to compare journals in different fields. The average SNIP value
for all journals in Scopus is 1.000; 3) Publications in Top Journal Percentiles in SciVal indicates the extent to which an entity’s publications are present in the most-cited journals in the data universe: how many publications are
in the top 10% of the most-cited journals indexed by Scopus; 4) Outputs in Top Percentiles in SciVal indicates the extent to which an entity’s publications are present in the most-cited percentiles of a data universe: how many
publications are in the top 10% of the most-cited publications; 5) Field-Weighted Citation Impact in SciVal indicates how the number of citations received by an entity’s publications compares with the average number of
citations received by all other similar publications in the data universe. A Field-Weighted Citation Impact of 1.00 indicates that the entity’s publications have been cited exactly as would be expected based on the global average
for similar publications; the Field-Weighted Citation Impact of “World”, or the entire Scopus database, is 1.00; A Field-Weighted Citation Impact of more than 1.00 indicates that the entity’s publications have been cited more
than would be expected based on the global average for similar publications; for example, 2.11 means 111% more cited than world average; A Field-Weighted Citation Impact of less than 1.00 indicates that the entity’s
publications have been cited less than would be expected based on the global average for similar publications; for example, 0.87 means 13% less cited than world average "
Mathematics2009 to 2013, All publication types
Top 15 institutions (in terms of N of citations) Country Publications Citations
Number of
Citing
Countries
Citations per
Publication
Cited
Publications
(%)
Field-
Weighted
Citation
Impact
Outputs in
Top
Percentiles
(%)
Publications
in Top Journal
Percentiles
(%)
Publications Citations in top 10% of
the world
in top 10% by
SNIP
Massachusetts Institute of Technology United States 3 788 19 388 107 8 1 5.1 63.2 2.2 11.1 27.9
University of California at Berkeley United States 3 164 19 123 117 17 2 6.0 65.1 2.1 9.5 25.1
Stanford University United States 2 979 19 041 118 23 3 6.4 63.3 2.4 13.3 28.5
Harvard University United States 2 670 18 970 131 35 4 7.1 69.1 2.1 14.5 23.7
University of Michigan United States 2 910 17 704 137 25 5 6.1 61.2 1.6 8.4 23.7
University of California at San Diego United States 2 365 16 866 126 48 6 7.1 64.0 2.3 13.6 20.8
University of California at Los Angeles United States 2 349 16 698 126 50 7 7.1 66.8 2.5 12.4 26.4
University of Oxford United Kingdom 3 243 16 613 121 14 8 5.1 67.4 2.0 11.1 19.5
University of Cambridge United Kingdom 2 840 15 707 121 29 9 5.5 65.1 1.8 11.4 25.2
ETH Zurich Switzerland 3 112 15 599 108 18 10 5.0 65.3 2.0 11.7 22.8
Tsinghua University China 6 505 15 213 103 1 11 2.3 47.8 0.8 4.6 11.9
University of Illinois at Urbana-Champaign United States 3 194 14 593 95 16 12 4.6 61.8 1.8 6.8 20.4
University of Texas at Austin United States 2 608 14 178 99 38 13 5.4 62.7 2.2 11.7 28.7
Imperial College London United Kingdom 2 862 13 999 120 27 14 4.9 66.3 1.9 10.3 23.7
Princeton University United States 2 192 13 193 103 62 15 6.0 71.0 2.2 13.5 33.5
JRC 239 914 66 1 120 938 3.8 62.3 1.6 10.9 21.7
World 794 047 2 037 623 217 2.6 49.8 1.0 4.8 12.0
Source: © 2014 Elsevier B.V. All rights reserved. SciVal ® is a registered trademark of Elsevier Properties S.A. used under license.
size-dependent metrics size-independent metrics
Rank among 4 394
institutions that
published in the field

A2 – Planning, Evaluation and Knowledge Management Unit Page 67
Notes: 1) Ranking: own calculation; 2) SNIP: Source-Normalized Impact per Paper is a ratio between the “Raw Impact per Paper”, a type of Citations per Publication calculation, actually received by the journal, compared to the
“Citation Potential”, or expected Citations per Publication, of that journal’s field. SNIP takes differences in disciplinary characteristics into account, and can be used to compare journals in different fields. The average SNIP value
for all journals in Scopus is 1.000; 3) Publications in Top Journal Percentiles in SciVal indicates the extent to which an entity’s publications are present in the most-cited journals in the data universe: how many publications are
in the top 10% of the most-cited journals indexed by Scopus; 4) Outputs in Top Percentiles in SciVal indicates the extent to which an entity’s publications are present in the most-cited percentiles of a data universe: how many
publications are in the top 10% of the most-cited publications; 5) Field-Weighted Citation Impact in SciVal indicates how the number of citations received by an entity’s publications compares with the average number of
citations received by all other similar publications in the data universe. A Field-Weighted Citation Impact of 1.00 indicates that the entity’s publications have been cited exactly as would be expected based on the global average
for similar publications; the Field-Weighted Citation Impact of “World”, or the entire Scopus database, is 1.00; A Field-Weighted Citation Impact of more than 1.00 indicates that the entity’s publications have been cited more
than would be expected based on the global average for similar publications; for example, 2.11 means 111% more cited than world average; A Field-Weighted Citation Impact of less than 1.00 indicates that the entity’s
publications have been cited less than would be expected based on the global average for similar publications; for example, 0.87 means 13% less cited than world average "
Economics, Econometrics and Finance2009 to 2013, All publication types
Top 15 institutions (in terms of N of citations) Country Publications Citations
Number of
Citing
Countries
Citations per
Publication
Cited
Publications
(%)
Field-
Weighted
Citation
Impact
Outputs in
Top
Percentiles
(%)
Publications
in Top Journal
Percentiles
(%)
Publications Citations in top 10% of
the world
in top 10% by
SNIP
Harvard University United States 1 598 13 867 126 1 1 8.7 72.8 3.3 21.3 63.5
National Bureau of Economic Research United States 1 335 12 664 108 2 2 9.5 81.7 3.5 27.7 67.6
University of California at Berkeley United States 1 089 8 805 115 7 3 8.1 72.1 3.2 19.3 52.6
University of Chicago United States 923 8 694 105 12 4 9.4 78.1 3.3 25.1 66.6
Stanford University United States 1 104 8 500 109 6 5 7.7 73.6 2.9 20.8 54.5
New York University United States 1 060 8 345 100 8 6 7.9 70.8 2.6 18.3 48.7
University of Pennsylvania United States 1 030 7 868 101 9 7 7.6 71.8 2.6 19.9 57.7
Columbia University United States 1 140 7 856 101 5 8 6.9 72.5 2.5 18.7 54.9
Northwestern University United States 824 6 984 95 15 9 8.5 74.5 2.6 18.7 57.9
Massachusetts Institute of Technology United States 813 6 599 95 16 10 8.1 75.5 3.3 22.8 66.4
University of Michigan United States 786 6 275 104 18 11 8.0 76.1 2.7 19.5 51.1
Duke University United States 748 6 145 116 25 12 8.2 74.6 3.1 21.9 56.5
London School of Economics United Kingdom 1 178 6 109 100 4 13 5.2 66.6 2.1 12.6 43.3
University of Oxford United Kingdom 1 197 6 066 110 3 14 5.1 65.6 1.9 11.4 42.4
Yale University United States 827 5 741 88 14 15 6.9 74.8 2.4 17.3 52.3
JRC 149 752 68 399 276 5.0 70.5 2.1 16.1 18.4
World 198 048 515 819 203 2.6 44.0 1.1 5.2 18.4
Source: © 2014 Elsevier B.V. All rights reserved. SciVal ® is a registered trademark of Elsevier Properties S.A. used under license.
size-dependent metrics size-independent metrics
Rank among 3 130
institutions that
published in the field

A2 – Planning, Evaluation and Knowledge Management Unit Page 68
Notes: 1) Ranking: own calculation; 2) SNIP: Source-Normalized Impact per Paper is a ratio between the “Raw Impact per Paper”, a type of Citations per Publication calculation, actually received by the journal, compared to the
“Citation Potential”, or expected Citations per Publication, of that journal’s field. SNIP takes differences in disciplinary characteristics into account, and can be used to compare journals in different fields. The average SNIP value
for all journals in Scopus is 1.000; 3) Publications in Top Journal Percentiles in SciVal indicates the extent to which an entity’s publications are present in the most-cited journals in the data universe: how many publications are
in the top 10% of the most-cited journals indexed by Scopus; 4) Outputs in Top Percentiles in SciVal indicates the extent to which an entity’s publications are present in the most-cited percentiles of a data universe: how many
publications are in the top 10% of the most-cited publications; 5) Field-Weighted Citation Impact in SciVal indicates how the number of citations received by an entity’s publications compares with the average number of
citations received by all other similar publications in the data universe. A Field-Weighted Citation Impact of 1.00 indicates that the entity’s publications have been cited exactly as would be expected based on the global average
for similar publications; the Field-Weighted Citation Impact of “World”, or the entire Scopus database, is 1.00; A Field-Weighted Citation Impact of more than 1.00 indicates that the entity’s publications have been cited more
than would be expected based on the global average for similar publications; for example, 2.11 means 111% more cited than world average; A Field-Weighted Citation Impact of less than 1.00 indicates that the entity’s
publications have been cited less than would be expected based on the global average for similar publications; for example, 0.87 means 13% less cited than world average "
Decision Sciences2009 to 2013, All publication types
Top 15 institutions (in terms of N of citations) Country Publications Citations
Number of
Citing
Countries
Citations per
Publication
Cited
Publications
(%)
Field-
Weighted
Citation
Impact
Outputs in
Top
Percentiles
(%)
Publications
in Top Journal
Percentiles
(%)
Publications Citations in top 10% of
the world
in top 10% by
SNIP
Hong Kong Polytechnic University Hong Kong (China) 734 4 657 83 1 1 6.3 68.8 2.3 19.6 56.1
Staffordshire University United Kingdom 9 4 296 74 1 984 2 477.3 44.4 84.2 11.1 28.6
University of California at Berkeley United States 526 4 019 84 10 3 7.6 70.9 1.9 15.4 65.1
National University of Singapore Singapore 659 3 835 83 3 4 5.8 66.5 1.7 15.2 54.5
Stanford University United States 479 3 708 90 15 5 7.7 71.2 2.2 17.1 62.4
Texas A and M University United States 677 3 313 80 2 6 4.9 70.3 1.5 9.9 47.6
Georgia Institute of Technology United States 577 3 202 77 6 7 5.5 71.2 1.5 11.6 53.2
City University of Hong Kong Hong Kong (China) 494 3 199 86 12 8 6.5 70.2 1.8 18.6 69.8
Harvard University United States 477 3 155 93 16 9 6.6 72.5 1.9 16.4 61.1
University of Michigan United States 532 3 071 94 8 10 5.8 72.0 1.5 10.7 53.8
University of Toronto Canada 495 3 064 81 11 11 6.2 67.7 1.8 15.2 52.4
Pennsylvania State University United States 551 2 973 86 7 12 5.4 67.7 1.5 11.1 50.7
ETH Zurich Switzerland 371 2 663 80 45 13 7.2 73.6 2.5 18.1 49.3
University of Minnesota United States 454 2 662 72 20 14 5.9 68.1 1.6 14.3 58.1
University of Maryland United States 402 2 599 72 33 15 6.5 64.4 2.0 16.9 67.6
JRC 88 666 69 502 223 7.6 84.1 3.9 23.9 52.4
World 113 696 370 284 186 3.3 49.2 1.2 7.3 34.8
Source: © 2014 Elsevier B.V. All rights reserved. SciVal ® is a registered trademark of Elsevier Properties S.A. used under license.
size-dependent metrics size-independent metrics
Rank among 3 396
institutions that
published in the field

A2 – Planning, Evaluation and Knowledge Management Unit Page 69
Notes: 1) Ranking: own calculation; 2) SNIP: Source-Normalized Impact per Paper is a ratio between the “Raw Impact per Paper”, a type of Citations per Publication calculation, actually received by the journal, compared to the
“Citation Potential”, or expected Citations per Publication, of that journal’s field. SNIP takes differences in disciplinary characteristics into account, and can be used to compare journals in different fields. The average SNIP value
for all journals in Scopus is 1.000; 3) Publications in Top Journal Percentiles in SciVal indicates the extent to which an entity’s publications are present in the most-cited journals in the data universe: how many publications are
in the top 10% of the most-cited journals indexed by Scopus; 4) Outputs in Top Percentiles in SciVal indicates the extent to which an entity’s publications are present in the most-cited percentiles of a data universe: how many
publications are in the top 10% of the most-cited publications; 5) Field-Weighted Citation Impact in SciVal indicates how the number of citations received by an entity’s publications compares with the average number of
citations received by all other similar publications in the data universe. A Field-Weighted Citation Impact of 1.00 indicates that the entity’s publications have been cited exactly as would be expected based on the global average
for similar publications; the Field-Weighted Citation Impact of “World”, or the entire Scopus database, is 1.00; A Field-Weighted Citation Impact of more than 1.00 indicates that the entity’s publications have been cited more
than would be expected based on the global average for similar publications; for example, 2.11 means 111% more cited than world average; A Field-Weighted Citation Impact of less than 1.00 indicates that the entity’s
publications have been cited less than would be expected based on the global average for similar publications; for example, 0.87 means 13% less cited than world average "
Business, Management and Accounting2009 to 2013, All publication types
Top 15 institutions (in terms of N of citations) Country Publications Citations
Number of
Citing
Countries
Citations per
Publication
Cited
Publications
(%)
Field-
Weighted
Citation
Impact
Outputs in
Top
Percentiles
(%)
Publications
in Top Journal
Percentiles
(%)
Publications Citations in top 10% of
the world
in top 10% by
SNIP
Harvard University United States 1 211 9 661 104 4 1 8.0 67.6 3.3 19.7 60.4
University of Pennsylvania United States 1 007 8 583 94 7 2 8.5 72.2 2.7 23.9 58.9
Hong Kong Polytechnic University Hong Kong (China) 1 560 8 077 108 1 3 5.2 68.8 1.9 14.0 33.8
University of Michigan United States 989 7 247 106 8 4 7.3 71.7 2.4 18.7 48.9
Indiana University Bloomington United States 1 097 7 164 98 6 5 6.5 65.3 2.4 16.4 42.6
Texas A and M University United States 1 214 6 757 106 3 6 5.6 65.7 1.8 13.0 33.0
Arizona State University United States 989 6 637 102 8 7 6.7 69.8 2.2 15.5 46.7
University of North Carolina United States 627 6 396 107 53 8 10.2 69.7 2.5 20.3 49.6
Pennsylvania State University United States 1 276 6 369 100 2 9 5.0 65.1 1.6 10.0 34.3
New York University United States 817 6 364 89 21 10 7.8 69.2 2.2 17.0 51.0
Michigan State University United States 915 6 350 100 13 11 6.9 72.8 2.3 18.7 45.3
Stanford University United States 773 6 337 99 31 12 8.2 70.5 2.8 20.1 51.9
Erasmus University Rotterdam Netherlands 803 6 232 95 23 13 7.8 75.8 2.3 18.3 36.8
University of Maryland United States 740 6 144 92 35 14 8.3 72.6 2.6 19.5 54.9
Northwestern University United States 615 5 694 86 58 15 9.3 67.3 2.3 19.0 59.5
JRC 104 572 68 743 469 5.5 66.3 2.2 16.3 30.1
World 293 010 689 753 201 2.4 38.5 1.0 4.8 17.1
Source: © 2014 Elsevier B.V. All rights reserved. SciVal ® is a registered trademark of Elsevier Properties S.A. used under license.
size-dependent metrics size-independent metrics
Rank among 3 492
institutions that
published in the field

A2 – Planning, Evaluation and Knowledge Management Unit Page 70
Notes: 1) Ranking: own calculation; 2) SNIP: Source-Normalized Impact per Paper is a ratio between the “Raw Impact per Paper”, a type of Citations per Publication calculation, actually received by the journal, compared to the
“Citation Potential”, or expected Citations per Publication, of that journal’s field. SNIP takes differences in disciplinary characteristics into account, and can be used to compare journals in different fields. The average SNIP value
for all journals in Scopus is 1.000; 3) Publications in Top Journal Percentiles in SciVal indicates the extent to which an entity’s publications are present in the most-cited journals in the data universe: how many publications are
in the top 10% of the most-cited journals indexed by Scopus; 4) Outputs in Top Percentiles in SciVal indicates the extent to which an entity’s publications are present in the most-cited percentiles of a data universe: how many
publications are in the top 10% of the most-cited publications; 5) Field-Weighted Citation Impact in SciVal indicates how the number of citations received by an entity’s publications compares with the average number of
citations received by all other similar publications in the data universe. A Field-Weighted Citation Impact of 1.00 indicates that the entity’s publications have been cited exactly as would be expected based on the global average
for similar publications; the Field-Weighted Citation Impact of “World”, or the entire Scopus database, is 1.00; A Field-Weighted Citation Impact of more than 1.00 indicates that the entity’s publications have been cited more
than would be expected based on the global average for similar publications; for example, 2.11 means 111% more cited than world average; A Field-Weighted Citation Impact of less than 1.00 indicates that the entity’s
publications have been cited less than would be expected based on the global average for similar publications; for example, 0.87 means 13% less cited than world average "
Immunology and Microbiology2009 to 2013, All publication types
Top 15 institutions (in terms of N of citations) Country Publications Citations
Number of
Citing
Countries
Citations per
Publication
Cited
Publications
(%)
Field-
Weighted
Citation
Impact
Outputs in
Top
Percentiles
(%)
Publications
in Top Journal
Percentiles
(%)
Publications Citations in top 10% of
the world
in top 10% by
SNIP
Harvard University United States 6 104 118 165 175 1 1 19.4 89.2 2.2 47.1 39.4
INSERM France 2 925 45 330 168 3 2 15.5 88.3 1.7 43.4 38.9
National Institute of Allergy and Infectious Diseases United States 2 605 44 785 159 6 3 17.2 89.3 2.0 45.4 25.8
University of Pennsylvania United States 2 396 42 638 159 10 4 17.8 88.4 2.1 45.4 38.8
Johns Hopkins University United States 2 822 42 621 175 5 5 15.1 87.5 1.8 39.7 31.5
University of California at San Francisco United States 2 122 41 968 165 17 6 19.8 91.2 2.3 49.7 39.4
University of Washington United States 2 383 41 489 166 11 7 17.4 89.1 2.1 45.4 32.8
University of Oxford United Kingdom 2 471 41 286 180 9 8 16.7 88.9 2.1 44.5 32.6
Stanford University United States 1 835 37 945 161 23 9 20.7 91.2 2.5 50.5 42.0
Universite Paris 5 France 1 824 36 209 160 24 10 19.9 88.4 2.3 47.5 45.8
University of California at San Diego United States 1 656 34 278 165 37 11 20.7 89.9 2.5 47.7 41.4
Karolinska Institutet Sweden 2 153 34 128 168 16 12 15.9 87.7 1.8 39.7 32.4
University of Toronto Canada 2 209 34 116 154 14 13 15.4 85.9 1.8 38.8 34.4
Imperial College London United Kingdom 2 280 34 075 166 12 14 14.9 87.4 1.8 42.1 33.6
Washington University St. Louis United States 1 496 31 027 147 49 15 20.7 90.9 2.3 50.3 38.5
JRC 48 428 60 1 817 1681 8.9 89.6 1.8 35.4 22.2
World 336 907 2 864 568 224 8.5 77.3 1.1 22.9 15.9
Source: © 2014 Elsevier B.V. All rights reserved. SciVal ® is a registered trademark of Elsevier Properties S.A. used under license.
size-dependent metrics size-independent metrics
Rank among 4 282
institutions that
published in the field

A2 – Planning, Evaluation and Knowledge Management Unit Page 71
Notes: 1) Ranking: own calculation; 2) SNIP: Source-Normalized Impact per Paper is a ratio between the “Raw Impact per Paper”, a type of Citations per Publication calculation, actually received by the journal, compared to the
“Citation Potential”, or expected Citations per Publication, of that journal’s field. SNIP takes differences in disciplinary characteristics into account, and can be used to compare journals in different fields. The average SNIP value
for all journals in Scopus is 1.000; 3) Publications in Top Journal Percentiles in SciVal indicates the extent to which an entity’s publications are present in the most-cited journals in the data universe: how many publications are
in the top 10% of the most-cited journals indexed by Scopus; 4) Outputs in Top Percentiles in SciVal indicates the extent to which an entity’s publications are present in the most-cited percentiles of a data universe: how many
publications are in the top 10% of the most-cited publications; 5) Field-Weighted Citation Impact in SciVal indicates how the number of citations received by an entity’s publications compares with the average number of
citations received by all other similar publications in the data universe. A Field-Weighted Citation Impact of 1.00 indicates that the entity’s publications have been cited exactly as would be expected based on the global average
for similar publications; the Field-Weighted Citation Impact of “World”, or the entire Scopus database, is 1.00; A Field-Weighted Citation Impact of more than 1.00 indicates that the entity’s publications have been cited more
than would be expected based on the global average for similar publications; for example, 2.11 means 111% more cited than world average; A Field-Weighted Citation Impact of less than 1.00 indicates that the entity’s
publications have been cited less than would be expected based on the global average for similar publications; for example, 0.87 means 13% less cited than world average "
Health Professions2009 to 2013, All publication types
Top 15 institutions (in terms of N of citations) Country Publications Citations
Number of
Citing
Countries
Citations per
Publication
Cited
Publications
(%)
Field-
Weighted
Citation
Impact
Outputs in
Top
Percentiles
(%)
Publications
in Top Journal
Percentiles
(%)
Publications Citations in top 10% of
the world
in top 10% by
SNIP
Harvard University United States 1 524 11 778 112 1 1 7.7 75.5 1.9 21.8 31.6
Centers for Disease Control and Prevention United States 454 8 780 133 49 2 19.3 81.1 4.6 41.0 84.5
University of Toronto Canada 1 445 8 268 99 2 3 5.7 70.5 1.5 14.9 19.3
VA Medical Center United States 1 272 6 908 100 3 4 5.4 69.5 1.5 14.4 18.6
University of Sydney Australia 1 180 6 881 100 4 5 5.8 70.5 1.7 13.6 24.6
University of Pittsburgh United States 967 6 528 93 8 6 6.8 73.1 1.8 17.3 27.7
University of Queensland Australia 1 161 6 046 98 5 7 5.2 69.0 1.7 12.7 15.3
University of Washington United States 1 028 5 929 104 7 8 5.8 68.3 1.9 14.9 22.2
University College London United Kingdom 743 5 778 89 12 9 7.8 74.8 2.2 23.3 34.6
Utrecht University Netherlands 559 5 618 84 28 10 10.1 79.4 1.9 24.0 32.0
University of North Carolina United States 721 5 287 91 15 11 7.3 68.4 1.8 18.7 41.4
University of British Columbia Canada 929 5 085 94 9 12 5.5 67.2 1.5 13.0 27.4
University of Michigan United States 840 5 021 95 10 13 6.0 73.7 1.6 17.5 28.4
Vrije Universiteit Netherlands 579 4 860 85 24 14 8.4 79.3 2.0 23.0 33.6
Stanford University United States 563 4 810 78 26 15 8.5 72.1 2.0 22.7 28.9
JRC 32 285 44 1 107 604 8.9 84.4 2.3 31.3 0.0
World 143 390 505 594 199 3.5 52.4 1.0 8.0 15.4
Source: © 2014 Elsevier B.V. All rights reserved. SciVal ® is a registered trademark of Elsevier Properties S.A. used under license.
size-dependent metrics size-independent metrics
Rank among 3 925
institutions that
published in the field
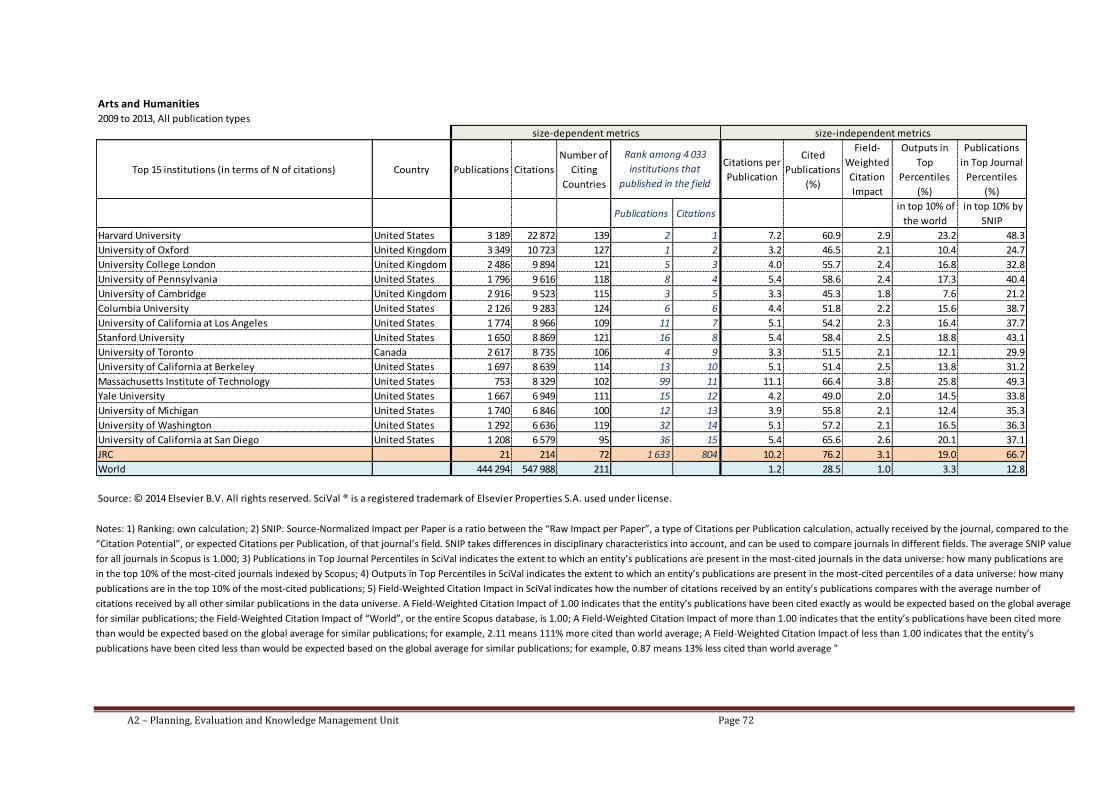
A2 – Planning, Evaluation and Knowledge Management Unit Page 72
Notes: 1) Ranking: own calculation; 2) SNIP: Source-Normalized Impact per Paper is a ratio between the “Raw Impact per Paper”, a type of Citations per Publication calculation, actually received by the journal, compared to the
“Citation Potential”, or expected Citations per Publication, of that journal’s field. SNIP takes differences in disciplinary characteristics into account, and can be used to compare journals in different fields. The average SNIP value
for all journals in Scopus is 1.000; 3) Publications in Top Journal Percentiles in SciVal indicates the extent to which an entity’s publications are present in the most-cited journals in the data universe: how many publications are
in the top 10% of the most-cited journals indexed by Scopus; 4) Outputs in Top Percentiles in SciVal indicates the extent to which an entity’s publications are present in the most-cited percentiles of a data universe: how many
publications are in the top 10% of the most-cited publications; 5) Field-Weighted Citation Impact in SciVal indicates how the number of citations received by an entity’s publications compares with the average number of
citations received by all other similar publications in the data universe. A Field-Weighted Citation Impact of 1.00 indicates that the entity’s publications have been cited exactly as would be expected based on the global average
for similar publications; the Field-Weighted Citation Impact of “World”, or the entire Scopus database, is 1.00; A Field-Weighted Citation Impact of more than 1.00 indicates that the entity’s publications have been cited more
than would be expected based on the global average for similar publications; for example, 2.11 means 111% more cited than world average; A Field-Weighted Citation Impact of less than 1.00 indicates that the entity’s
publications have been cited less than would be expected based on the global average for similar publications; for example, 0.87 means 13% less cited than world average "
Arts and Humanities2009 to 2013, All publication types
Top 15 institutions (in terms of N of citations) Country Publications Citations
Number of
Citing
Countries
Citations per
Publication
Cited
Publications
(%)
Field-
Weighted
Citation
Impact
Outputs in
Top
Percentiles
(%)
Publications
in Top Journal
Percentiles
(%)
Publications Citations in top 10% of
the world
in top 10% by
SNIP
Harvard University United States 3 189 22 872 139 2 1 7.2 60.9 2.9 23.2 48.3
University of Oxford United Kingdom 3 349 10 723 127 1 2 3.2 46.5 2.1 10.4 24.7
University College London United Kingdom 2 486 9 894 121 5 3 4.0 55.7 2.4 16.8 32.8
University of Pennsylvania United States 1 796 9 616 118 8 4 5.4 58.6 2.4 17.3 40.4
University of Cambridge United Kingdom 2 916 9 523 115 3 5 3.3 45.3 1.8 7.6 21.2
Columbia University United States 2 126 9 283 124 6 6 4.4 51.8 2.2 15.6 38.7
University of California at Los Angeles United States 1 774 8 966 109 11 7 5.1 54.2 2.3 16.4 37.7
Stanford University United States 1 650 8 869 121 16 8 5.4 58.4 2.5 18.8 43.1
University of Toronto Canada 2 617 8 735 106 4 9 3.3 51.5 2.1 12.1 29.9
University of California at Berkeley United States 1 697 8 639 114 13 10 5.1 51.4 2.5 13.8 31.2
Massachusetts Institute of Technology United States 753 8 329 102 99 11 11.1 66.4 3.8 25.8 49.3
Yale University United States 1 667 6 949 111 15 12 4.2 49.0 2.0 14.5 33.8
University of Michigan United States 1 740 6 846 100 12 13 3.9 55.8 2.1 12.4 35.3
University of Washington United States 1 292 6 636 119 32 14 5.1 57.2 2.1 16.5 36.3
University of California at San Diego United States 1 208 6 579 95 36 15 5.4 65.6 2.6 20.1 37.1
JRC 21 214 72 1 633 804 10.2 76.2 3.1 19.0 66.7
World 444 294 547 988 211 1.2 28.5 1.0 3.3 12.8
Source: © 2014 Elsevier B.V. All rights reserved. SciVal ® is a registered trademark of Elsevier Properties S.A. used under license.
size-dependent metrics size-independent metrics
Rank among 4 033
institutions that
published in the field

A2 – Planning, Evaluation and Knowledge Management Unit Page 73
Notes: 1) Ranking: own calculation; 2) SNIP: Source-Normalized Impact per Paper is a ratio between the “Raw Impact per Paper”, a type of Citations per Publication calculation, actually received by the journal, compared to the
“Citation Potential”, or expected Citations per Publication, of that journal’s field. SNIP takes differences in disciplinary characteristics into account, and can be used to compare journals in different fields. The average SNIP value
for all journals in Scopus is 1.000; 3) Publications in Top Journal Percentiles in SciVal indicates the extent to which an entity’s publications are present in the most-cited journals in the data universe: how many publications are
in the top 10% of the most-cited journals indexed by Scopus; 4) Outputs in Top Percentiles in SciVal indicates the extent to which an entity’s publications are present in the most-cited percentiles of a data universe: how many
publications are in the top 10% of the most-cited publications; 5) Field-Weighted Citation Impact in SciVal indicates how the number of citations received by an entity’s publications compares with the average number of
citations received by all other similar publications in the data universe. A Field-Weighted Citation Impact of 1.00 indicates that the entity’s publications have been cited exactly as would be expected based on the global average
for similar publications; the Field-Weighted Citation Impact of “World”, or the entire Scopus database, is 1.00; A Field-Weighted Citation Impact of more than 1.00 indicates that the entity’s publications have been cited more
than would be expected based on the global average for similar publications; for example, 2.11 means 111% more cited than world average; A Field-Weighted Citation Impact of less than 1.00 indicates that the entity’s
publications have been cited less than would be expected based on the global average for similar publications; for example, 0.87 means 13% less cited than world average "
Neuroscience2009 to 2013, All publication types
Top 15 institutions (in terms of N of citations) Country Publications Citations
Number of
Citing
Countries
Citations per
Publication
Cited
Publications
(%)
Field-
Weighted
Citation
Impact
Outputs in
Top
Percentiles
(%)
Publications
in Top Journal
Percentiles
(%)
Publications Citations in top 10% of
the world
in top 10% by
SNIP
Harvard University United States 7 607 115 934 155 1 1 15.2 85.8 1.9 40.4 33.6
University College London United Kingdom 5 725 78 352 145 2 2 13.7 83.6 1.8 37.6 34.6
University of California at Los Angeles United States 3 426 52 450 142 6 3 15.3 85.6 1.8 40.3 33.2
VA Medical Center United States 4 411 51 604 134 3 4 11.7 85.8 1.6 35.5 21.7
Johns Hopkins University United States 3 525 49 027 132 5 5 13.9 84.9 1.8 36.9 29.4
University of California at San Francisco United States 2 799 48 660 135 10 6 17.4 86.7 2.0 45.1 41.0
University of California at San Diego United States 3 209 47 700 134 7 7 14.9 85.6 1.9 40.4 32.3
University of Toronto Canada 4 141 47 066 133 4 8 11.4 83.2 1.6 32.2 23.3
Columbia University United States 2 973 44 457 136 8 9 15.0 84.7 1.8 37.5 32.9
University of Pennsylvania United States 2 794 43 302 124 11 10 15.5 86.0 2.1 39.0 33.3
Stanford University United States 2 471 42 360 118 16 11 17.1 86.3 2.1 44.4 42.0
University of Oxford United Kingdom 2 631 39 417 124 12 12 15.0 85.0 2.0 41.0 37.7
Yale University United States 2 483 37 487 120 15 13 15.1 86.6 1.9 44.1 41.3
INSERM France 2 809 34 685 126 9 14 12.3 84.6 1.5 37.0 31.6
King's College London United Kingdom 2 577 34 246 121 13 15 13.3 84.6 1.9 37.9 26.8
JRC 13 142 27 2 314 1897 10.9 84.6 1.5 46.2 8.3
World 295 341 2 489 462 217 8.4 75.8 1.1 23.6 19.8
Source: © 2014 Elsevier B.V. All rights reserved. SciVal ® is a registered trademark of Elsevier Properties S.A. used under license.
size-dependent metrics size-independent metrics
Rank among 4 077
institutions that
published in the field
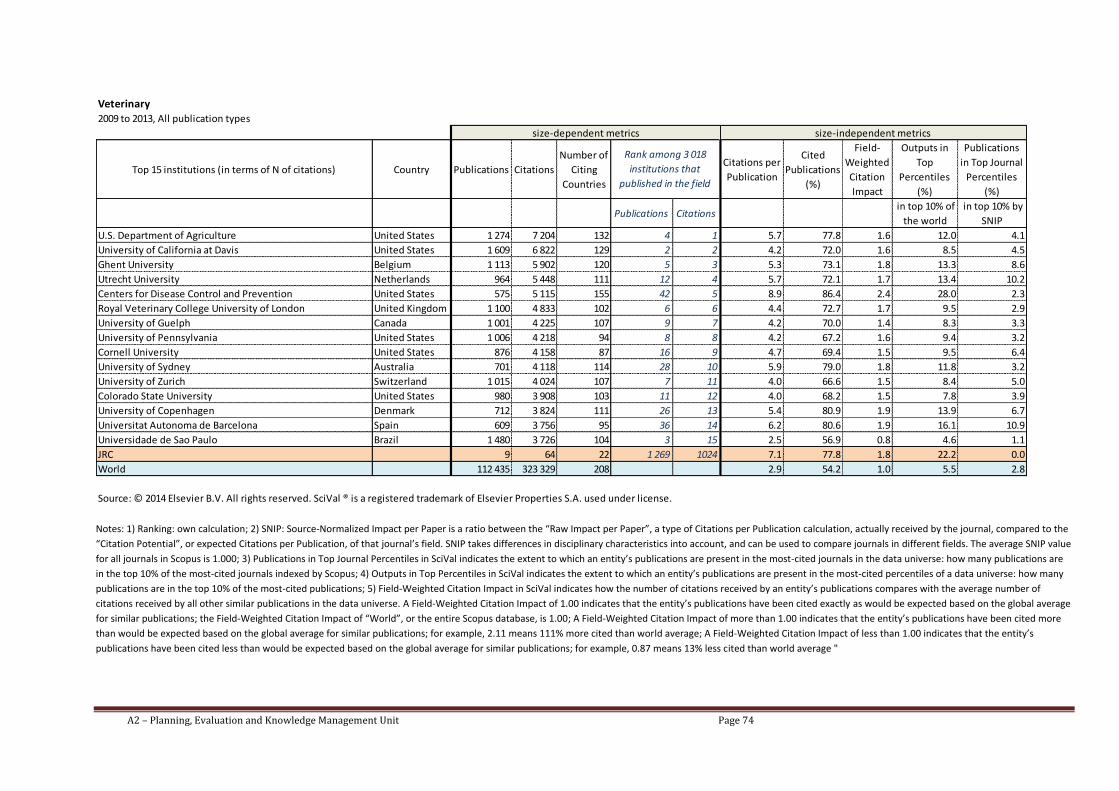
A2 – Planning, Evaluation and Knowledge Management Unit Page 74
Notes: 1) Ranking: own calculation; 2) SNIP: Source-Normalized Impact per Paper is a ratio between the “Raw Impact per Paper”, a type of Citations per Publication calculation, actually received by the journal, compared to the
“Citation Potential”, or expected Citations per Publication, of that journal’s field. SNIP takes differences in disciplinary characteristics into account, and can be used to compare journals in different fields. The average SNIP value
for all journals in Scopus is 1.000; 3) Publications in Top Journal Percentiles in SciVal indicates the extent to which an entity’s publications are present in the most-cited journals in the data universe: how many publications are
in the top 10% of the most-cited journals indexed by Scopus; 4) Outputs in Top Percentiles in SciVal indicates the extent to which an entity’s publications are present in the most-cited percentiles of a data universe: how many
publications are in the top 10% of the most-cited publications; 5) Field-Weighted Citation Impact in SciVal indicates how the number of citations received by an entity’s publications compares with the average number of
citations received by all other similar publications in the data universe. A Field-Weighted Citation Impact of 1.00 indicates that the entity’s publications have been cited exactly as would be expected based on the global average
for similar publications; the Field-Weighted Citation Impact of “World”, or the entire Scopus database, is 1.00; A Field-Weighted Citation Impact of more than 1.00 indicates that the entity’s publications have been cited more
than would be expected based on the global average for similar publications; for example, 2.11 means 111% more cited than world average; A Field-Weighted Citation Impact of less than 1.00 indicates that the entity’s
publications have been cited less than would be expected based on the global average for similar publications; for example, 0.87 means 13% less cited than world average "
Veterinary2009 to 2013, All publication types
Top 15 institutions (in terms of N of citations) Country Publications Citations
Number of
Citing
Countries
Citations per
Publication
Cited
Publications
(%)
Field-
Weighted
Citation
Impact
Outputs in
Top
Percentiles
(%)
Publications
in Top Journal
Percentiles
(%)
Publications Citations in top 10% of
the world
in top 10% by
SNIP
U.S. Department of Agriculture United States 1 274 7 204 132 4 1 5.7 77.8 1.6 12.0 4.1
University of California at Davis United States 1 609 6 822 129 2 2 4.2 72.0 1.6 8.5 4.5
Ghent University Belgium 1 113 5 902 120 5 3 5.3 73.1 1.8 13.3 8.6
Utrecht University Netherlands 964 5 448 111 12 4 5.7 72.1 1.7 13.4 10.2
Centers for Disease Control and Prevention United States 575 5 115 155 42 5 8.9 86.4 2.4 28.0 2.3
Royal Veterinary College University of London United Kingdom 1 100 4 833 102 6 6 4.4 72.7 1.7 9.5 2.9
University of Guelph Canada 1 001 4 225 107 9 7 4.2 70.0 1.4 8.3 3.3
University of Pennsylvania United States 1 006 4 218 94 8 8 4.2 67.2 1.6 9.4 3.2
Cornell University United States 876 4 158 87 16 9 4.7 69.4 1.5 9.5 6.4
University of Sydney Australia 701 4 118 114 28 10 5.9 79.0 1.8 11.8 3.2
University of Zurich Switzerland 1 015 4 024 107 7 11 4.0 66.6 1.5 8.4 5.0
Colorado State University United States 980 3 908 103 11 12 4.0 68.2 1.5 7.8 3.9
University of Copenhagen Denmark 712 3 824 111 26 13 5.4 80.9 1.9 13.9 6.7
Universitat Autonoma de Barcelona Spain 609 3 756 95 36 14 6.2 80.6 1.9 16.1 10.9
Universidade de Sao Paulo Brazil 1 480 3 726 104 3 15 2.5 56.9 0.8 4.6 1.1
JRC 9 64 22 1 269 1024 7.1 77.8 1.8 22.2 0.0
World 112 435 323 329 208 2.9 54.2 1.0 5.5 2.8
Source: © 2014 Elsevier B.V. All rights reserved. SciVal ® is a registered trademark of Elsevier Properties S.A. used under license.
size-dependent metrics size-independent metrics
Rank among 3 018
institutions that
published in the field

A2 – Planning, Evaluation and Knowledge Management Unit Page 75
Notes: 1) Ranking: own calculation; 2) SNIP: Source-Normalized Impact per Paper is a ratio between the “Raw Impact per Paper”, a type of Citations per Publication calculation, actually received by the journal, compared to the
“Citation Potential”, or expected Citations per Publication, of that journal’s field. SNIP takes differences in disciplinary characteristics into account, and can be used to compare journals in different fields. The average SNIP value
for all journals in Scopus is 1.000; 3) Publications in Top Journal Percentiles in SciVal indicates the extent to which an entity’s publications are present in the most-cited journals in the data universe: how many publications are
in the top 10% of the most-cited journals indexed by Scopus; 4) Outputs in Top Percentiles in SciVal indicates the extent to which an entity’s publications are present in the most-cited percentiles of a data universe: how many
publications are in the top 10% of the most-cited publications; 5) Field-Weighted Citation Impact in SciVal indicates how the number of citations received by an entity’s publications compares with the average number of
citations received by all other similar publications in the data universe. A Field-Weighted Citation Impact of 1.00 indicates that the entity’s publications have been cited exactly as would be expected based on the global average
for similar publications; the Field-Weighted Citation Impact of “World”, or the entire Scopus database, is 1.00; A Field-Weighted Citation Impact of more than 1.00 indicates that the entity’s publications have been cited more
than would be expected based on the global average for similar publications; for example, 2.11 means 111% more cited than world average; A Field-Weighted Citation Impact of less than 1.00 indicates that the entity’s
publications have been cited less than would be expected based on the global average for similar publications; for example, 0.87 means 13% less cited than world average "
Psychology2009 to 2013, All publication types
Top 15 institutions (in terms of N of citations) Country Publications Citations
Number of
Citing
Countries
Citations per
Publication
Cited
Publications
(%)
Field-
Weighted
Citation
Impact
Outputs in
Top
Percentiles
(%)
Publications
in Top Journal
Percentiles
(%)
Publications Citations in top 10% of
the world
in top 10% by
SNIP
Harvard University United States 3 868 36 624 137 1 1 9.5 79.9 2.0 25.9 33.7
University of California at Los Angeles United States 2 564 24 006 125 3 2 9.4 80.8 1.9 25.8 35.6
King's College London United Kingdom 2 141 22 504 128 9 3 10.5 83.2 2.0 30.6 38.7
University College London United Kingdom 2 417 21 428 130 6 4 8.9 78.8 1.8 25.2 26.4
Columbia University United States 2 530 20 243 130 4 5 8.0 77.3 1.7 21.5 31.7
University of Michigan United States 2 283 19 931 127 7 6 8.7 80.3 1.9 23.0 34.4
Yale University United States 2 107 19 475 128 10 7 9.2 80.3 1.9 25.8 35.5
VA Medical Center United States 2 511 18 981 124 5 8 7.6 78.2 1.5 20.5 19.5
University of Toronto Canada 2 688 18 978 113 2 9 7.1 78.0 1.7 19.5 25.7
University of Minnesota United States 2 158 17 451 116 8 10 8.1 79.2 1.9 21.1 35.5
University of Pennsylvania United States 2 050 17 263 124 11 11 8.4 79.9 1.8 22.6 33.7
University of California at San Diego United States 1 838 16 583 116 15 12 9.0 77.9 1.9 24.4 27.1
Stanford University United States 1 687 15 961 111 23 13 9.5 81.2 2.0 27.7 37.7
University of Washington United States 2 017 15 926 119 12 14 7.9 80.1 1.7 20.8 31.6
University of Pittsburgh United States 1 766 15 795 103 17 15 8.9 81.7 1.9 25.7 39.3
JRC 26 41 21 1 414 1968 1.6 53.8 2.0 11.5 7.7
World 258 750 1 263 068 211 4.9 64.0 1.1 12.0 18.1
Source: © 2014 Elsevier B.V. All rights reserved. SciVal ® is a registered trademark of Elsevier Properties S.A. used under license.
size-dependent metrics size-independent metrics
Rank among 3 609
institutions that
published in the field

A2 – Planning, Evaluation and Knowledge Management Unit Page 76
Notes: 1) Ranking: own calculation; 2) SNIP: Source-Normalized Impact per Paper is a ratio between the “Raw Impact per Paper”, a type of Citations per Publication calculation, actually received by the journal, compared to the
“Citation Potential”, or expected Citations per Publication, of that journal’s field. SNIP takes differences in disciplinary characteristics into account, and can be used to compare journals in different fields. The average SNIP value
for all journals in Scopus is 1.000; 3) Publications in Top Journal Percentiles in SciVal indicates the extent to which an entity’s publications are present in the most-cited journals in the data universe: how many publications are
in the top 10% of the most-cited journals indexed by Scopus; 4) Outputs in Top Percentiles in SciVal indicates the extent to which an entity’s publications are present in the most-cited percentiles of a data universe: how many
publications are in the top 10% of the most-cited publications; 5) Field-Weighted Citation Impact in SciVal indicates how the number of citations received by an entity’s publications compares with the average number of
citations received by all other similar publications in the data universe. A Field-Weighted Citation Impact of 1.00 indicates that the entity’s publications have been cited exactly as would be expected based on the global average
for similar publications; the Field-Weighted Citation Impact of “World”, or the entire Scopus database, is 1.00; A Field-Weighted Citation Impact of more than 1.00 indicates that the entity’s publications have been cited more
than would be expected based on the global average for similar publications; for example, 2.11 means 111% more cited than world average; A Field-Weighted Citation Impact of less than 1.00 indicates that the entity’s
publications have been cited less than would be expected based on the global average for similar publications; for example, 0.87 means 13% less cited than world average "
Nursing2009 to 2013, All publication types
Top 15 institutions (in terms of N of citations) Country Publications Citations
Number of
Citing
Countries
Citations per
Publication
Cited
Publications
(%)
Field-
Weighted
Citation
Impact
Outputs in
Top
Percentiles
(%)
Publications
in Top Journal
Percentiles
(%)
Publications Citations in top 10% of
the world
in top 10% by
SNIP
Harvard University United States 3 066 30 966 158 1 1 10.1 74.9 2.1 26.8 29.7
University of Toronto Canada 1 786 14 866 135 4 2 8.3 73.7 1.8 19.3 19.4
University of North Carolina United States 1 397 14 048 142 9 3 10.1 75.3 2.1 21.8 19.1
VA Medical Center United States 1 953 12 632 118 3 4 6.5 71.4 1.6 17.3 17.4
Johns Hopkins University United States 1 657 12 019 143 5 5 7.3 70.2 1.6 18.5 17.0
University of Pittsburgh United States 1 437 11 269 116 7 6 7.8 72.1 1.9 19.2 18.6
University of Pennsylvania United States 1 637 10 628 122 6 7 6.5 68.7 1.8 18.7 11.9
University of Minnesota United States 1 253 10 606 120 15 8 8.5 74.9 1.8 22.0 20.3
University of Washington United States 1 420 10 478 125 8 9 7.4 74.1 1.7 19.2 22.8
University of California at San Francisco United States 1 364 10 082 125 11 10 7.4 75.0 2.0 19.1 18.8
University of California at Los Angeles United States 1 187 9 516 106 16 11 8.0 74.3 1.7 21.3 23.1
Maastricht University Netherlands 896 9 456 112 26 12 10.6 82.7 2.2 30.0 23.1
University of Copenhagen Denmark 852 9 390 116 30 13 11.0 83.2 2.2 30.2 27.8
Tufts University United States 828 9 367 130 31 14 11.3 78.9 1.8 29.6 20.3
Yale University United States 927 8 574 114 24 15 9.2 70.8 2.1 18.1 19.8
JRC 2 1 1 2 979 3305 0.5 50.0 0.2 0.0 0.0
World 213 045 785 843 216 3.7 51.4 1.0 8.6 7.9
Source: © 2014 Elsevier B.V. All rights reserved. SciVal ® is a registered trademark of Elsevier Properties S.A. used under license.
size-dependent metrics size-independent metrics
Rank among 3 593
institutions that
published in the field

A2 – Planning, Evaluation and Knowledge Management Unit Page 77
13 Annex 4: Further graphs for level 2 benchmarking results
Figure 28: 'Number of citations per publication' in seven scientific areas, level 2
Figure 29: 'Cited publications (in percent)' in seven scientific areas, level 2
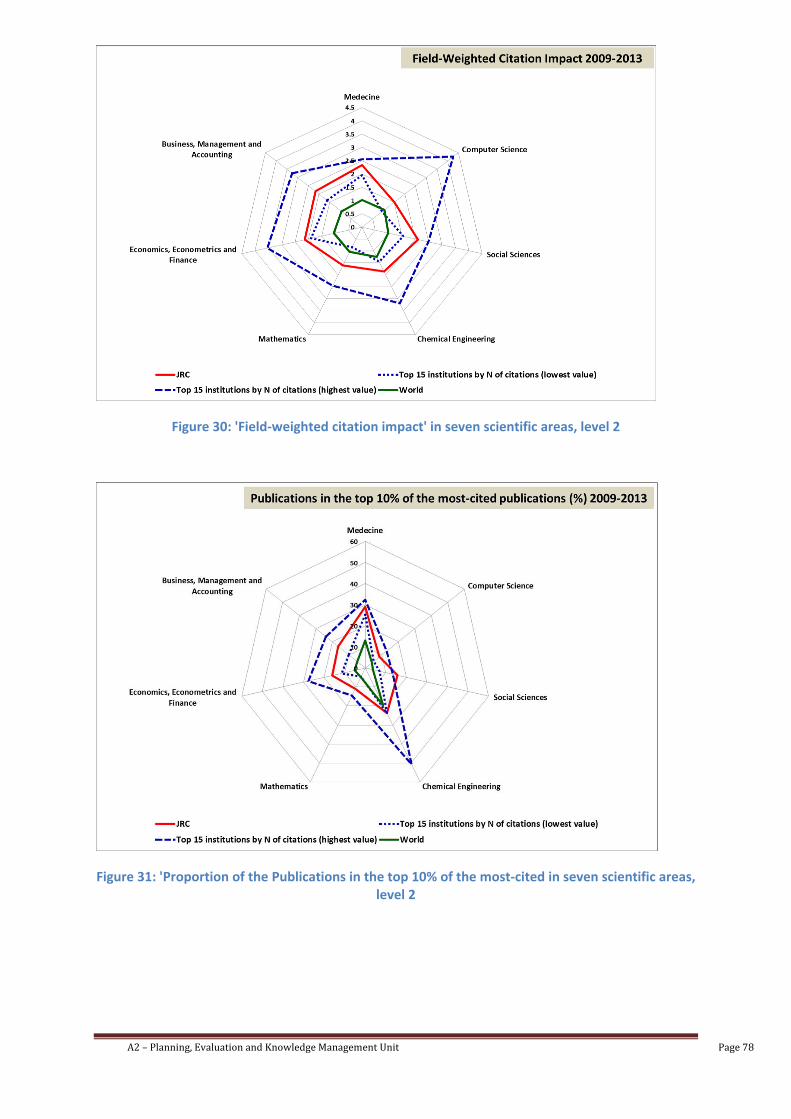
A2 – Planning, Evaluation and Knowledge Management Unit Page 78
Figure 30: 'Field-weighted citation impact' in seven scientific areas, level 2
Figure 31: 'Proportion of the Publications in the top 10% of the most-cited in seven scientific areas, level 2

A2 – Planning, Evaluation and Knowledge Management Unit Page 79
Figure 32: Proportion of the Publications in the top 10% of the most-cited in seven scientific areas, level 2
14 Annex 5: Further graphs of level 2 normalised benchmarking results
Figure 33: Normalised set of five benchmarking indicators for scientific area 'Medicine'

A2 – Planning, Evaluation and Knowledge Management Unit Page 80
Figure 34: Normalised set of five benchmarking indicators for scientific area 'Computer Science'
Figure 35: Normalised set of five benchmarking indicators for scientific area 'Social Sciences'

A2 – Planning, Evaluation and Knowledge Management Unit Page 81
Figure 36: Normalised set of five benchmarking indicators for scientific area 'Chemical Engineering'
Figure 37: Normalised set of five benchmarking indicators for scientific area 'Mathematics'

A2 – Planning, Evaluation and Knowledge Management Unit Page 82
Figure 38: Normalised set of five benchmarking indicators for scientific area 'Economics, Econometrics & Finance'
Figure 39: Normalised set of five benchmarking indicators for scientific area 'Business, Management and Accounting''

A2 – Planning, Evaluation and Knowledge Management Unit Page 83
15 Annex 6: Further graphs for level 3 benchmarking results
Source: own calculations. Raw data: © 2014 Elsevier B.V. All rights reserved. SciVal ® is a registered trademark
of Elsevier Properties S.A. used under license.
Source: own calculations. Raw data: © 2014 Elsevier B.V. All rights reserved. SciVal ® is a registered trademark
of Elsevier Properties S.A. used under license.
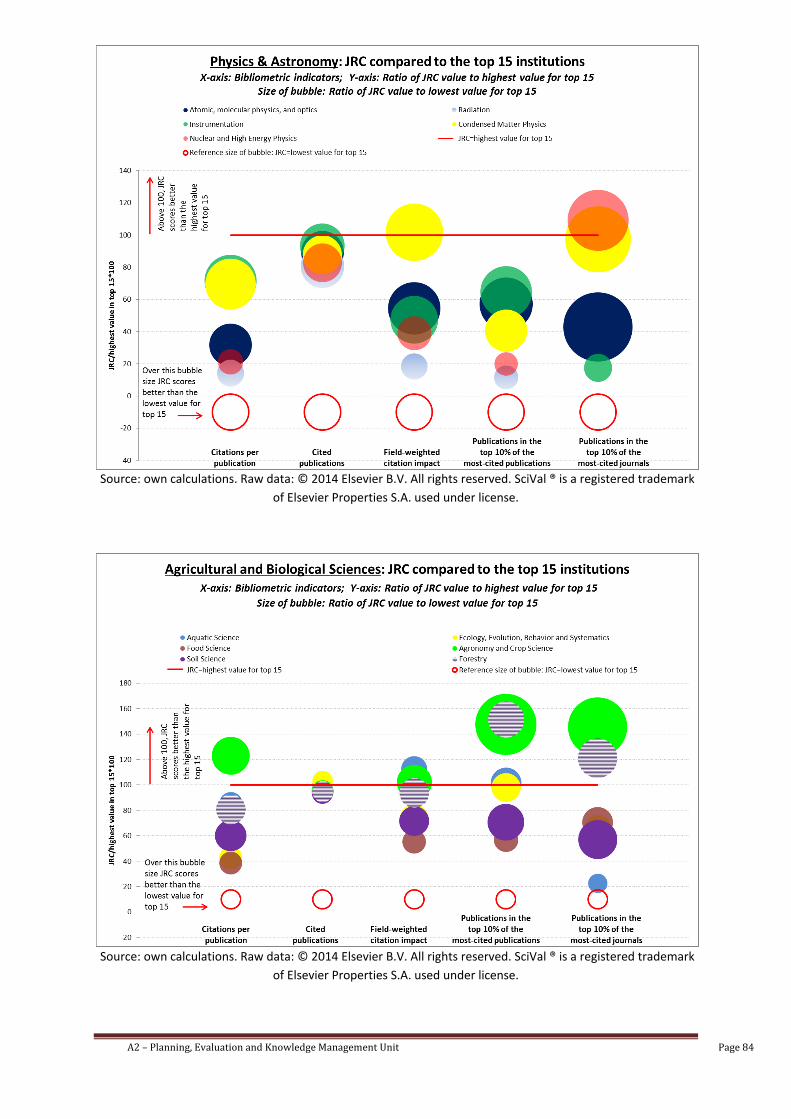
A2 – Planning, Evaluation and Knowledge Management Unit Page 84
Source: own calculations. Raw data: © 2014 Elsevier B.V. All rights reserved. SciVal ® is a registered trademark
of Elsevier Properties S.A. used under license.
Source: own calculations. Raw data: © 2014 Elsevier B.V. All rights reserved. SciVal ® is a registered trademark
of Elsevier Properties S.A. used under license.

A2 – Planning, Evaluation and Knowledge Management Unit Page 85
Source: own calculations. Raw data: © 2014 Elsevier B.V. All rights reserved. SciVal ® is a registered trademark
of Elsevier Properties S.A. used under license.
Source: own calculations. Raw data: © 2014 Elsevier B.V. All rights reserved. SciVal ® is a registered trademark
of Elsevier Properties S.A. used under license.

A2 – Planning, Evaluation and Knowledge Management Unit Page 86
Source: own calculations. Raw data: © 2014 Elsevier B.V. All rights reserved. SciVal ® is a registered trademark
of Elsevier Properties S.A. used under license.
Source: own calculations. Raw data: © 2014 Elsevier B.V. All rights reserved. SciVal ® is a registered trademark
of Elsevier Properties S.A. used under license.

A2 – Planning, Evaluation and Knowledge Management Unit Page 87
Source: own calculations. Raw data: © 2014 Elsevier B.V. All rights reserved. SciVal ® is a registered trademark
of Elsevier Properties S.A. used under license.
Source: own calculations. Raw data: © 2014 Elsevier B.V. All rights reserved. SciVal ® is a registered trademark
of Elsevier Properties S.A. used under license.

A2 – Planning, Evaluation and Knowledge Management Unit Page 88
Source: own calculations. Raw data: © 2014 Elsevier B.V. All rights reserved. SciVal ® is a registered trademark
of Elsevier Properties S.A. used under license.
Source: own calculations. Raw data: © 2014 Elsevier B.V. All rights reserved. SciVal ® is a registered trademark
of Elsevier Properties S.A. used under license.

A2 – Planning, Evaluation and Knowledge Management Unit Page 89
Source: own calculations. Raw data: © 2014 Elsevier B.V. All rights reserved. SciVal ® is a registered trademark
of Elsevier Properties S.A. used under license.
Source: own calculations. Raw data: © 2014 Elsevier B.V. All rights reserved. SciVal ® is a registered trademark
of Elsevier Properties S.A. used under license.