exane bnp paribas 2005 european seminar paris, 9 june 2005€¦ · exane bnp paribas 2005 european...
TRANSCRIPT

Exane BNP Paribas2005 European Seminar
Paris, 9 June 2005
Antoine ZACHARIAS, CEO of VINCIChristian LABEYRIE, CFO of VINCI

2
CONCESSIONSMotorwaysCar parksBridges / tunnelsAirports
CONSTRUCTIONProject managementBuildingCivil engineeringFacility management
ENERGIESDesign, building and maintenance of: energy:infrastructure & networks industrial utilities technical development projects in
construction telecommunication infrastructure
Road works& maintenanceProduction and recycling ofmaterialsUrban development projects
ROADS
4 business lines operating in synergy

3
Rion-Antirion bridge: an excellent illustration ofVINCI’s business model (construction-concession)

4
2004 sales: €19.5bn
45%
25%
13%
17%
34%
13%
Concessions Energy Roads Construction
32%19%
Other activities
2%
Construction & concessions:sound financial fit
2004 operating income: €1.3bn
2004 net income: €732m 2004 capital employed: €7.4bn
2004 IFRS restated figures
10%
17%
30%
43%
95%6%2%
-5% 2%

5
Rest of world:(o/w Africa 2.3%; Asia 0.8%)
North America(USA 3.4%; Canada 0.8%) 4.3%
4.2%Other European countries
(o/w Benelux 4.4%; Spain0.6%) 62.1%
8.4%
7.7%
5.6%
7.7%
France +10%Germany +12%United Kingdom +5%Central & Eastern Europe +13%Other European countries +1%
North America -11%Rest of world +1%
Geographical breakdown of 2004 sales
2004/2003 change
Group has reinforced positions in France andEurope

6
€345m
€ (19m)
+ 42%
+13%
+35%
+18%
+8%
04/03change
1,3681,5101,060Operating cash flow *
528885540Of which net financial surplus,ex concessions **
(2,433)(2,285)(2,266)Net debt
2,0181,5611,377Cash flow from operations
732731541Net income(after tax and goodwill)
1,3006.7%
1,3737%
1,1666.4%
Operating income% sales
19,52019,52018,111Sales
2004IFRS20042003€ million
(*) Cash flow from operations – net investments in operating assets + change in WCR(**) Cofiroute, VINCI Park, Infrastructures
Key figures (French GAAP)
Noteworthy performancesin a buoyant market

7
9801,067
1,166
1,372
2001-2004 operating income 2001-2004 income
€ million
2001 2002 2003 2004
+13% per year (**)+12% per year +4% per year
17,172 17,55418,111 19,520
2001-2004 sales
Uninterrupted growth
2001 2002 2003 2004 2001 2002 2003 2004
(*) French GAAP(**) Excluding equity swap ASF
(*) (*)
Equity swap ASF

8
88% free float
Employees
Treasury shares
Foreign institutionalsOf which: UK 20%, USA 17%,other Europe 11%
Individual shareholders
French institutionals
Employees are thelargest category ofVINCI shareholder(46,000 persons) (*)
80,000 individualshareholders (exemployees)
Foreign institutionsaccount for nearly half ofthe total, with asatisfactory breakdownby geographical zone
Shareholding structure at 31/12/04 (83.81 million shares) (**)
28%9% 3%
12%
48%
9%
3%
48%
12%
28%
(*) The weight of employees was approximately 11% at 31 March 2005(**) The number of shares making up equity stood at 172 million at 31 May 2005 (after the 2:1 split), o/w 7.3 million treasury shares

9
Share buybacks and dividends: commitments held
Share buybacks:
In 2004: 11.8 million shares bought on the market / 10.8 million sharescancelled (when the 2:1 split is taken into account)A new share buyback programme capped at €1.2bn was voted by theshareholders meeting held on 28 April 2005
Already 6.1 million shares bought back since the start of the year
Dividends:€3.5 per share, i.e. up 48% from 200340% payout ratereturn of around 3%After examining the interim financial statements and growth prospects,the Board will now take a decision every year about the payout of aninterim dividend

10
An investor who invested €1,000 in VINCI shares on 1 January 2000 and reinvested alldividends collected (including tax credit) in the purchase of further VINCI shares wouldhave an investment worth €3,254 on 30 May 2005.
This represents an average annual return of 25%
1 Jan. 00 30 May 05
Shareholder return on investment since 2000
+25% a year
€1,000
€3,254
2000 / 2005: strong value creation for VINCI shareholders

VINCI’s business lines

CONCESSIONS

13
468
872
485
125
56730.6%
2002 2003 2004
60031.8%
61631.7%
481
12334
-23
VINCI Concessions: 2004 key figures
Operating income Net income
+2.7% 2004/2003
170
164
214
+31% 2004/2003
In € million
1
2002 2003
2004
167
(41)
Cofiroute VINCI ParkAirport services Other infra.Holding cos, incl. ASF
50
1226
Sales
1,851 1,889 1,943
+4.7% 2004/2003
2002 2003 2004

14
VINCI Concessions: outlook for 2005
ASFConsolidation of links between ASF and VINCI
CofirouteIntercity network: investment programme stepped upA86: works on schedule ; discussions with the Grantor under wayEmphasis put on quality and services / development of electronic toll system
VINCI ParkNew developments in France and in Central EuropeFocus on brand policy
Airport operationsRefocusing on cargoRestructuring of US ramp & pax activities
InfrastructuresA dozen of projects are being studied, in synergy with construction,essentially in Europe

15
A19 contract awarded to VINCI
100% VINCI101 km motorway section betweenArtenay and Courtenay (south of Paris)
Cost of works: €550m Financing
Equity: €125mSubsidy: €85mSenior debt: €509m
Maturity of concession: 2070
Forecast traffic at opening:> 8,000 vehicles per daySchedule
Start of work: Q1 2007Opening: Q3 2009
16
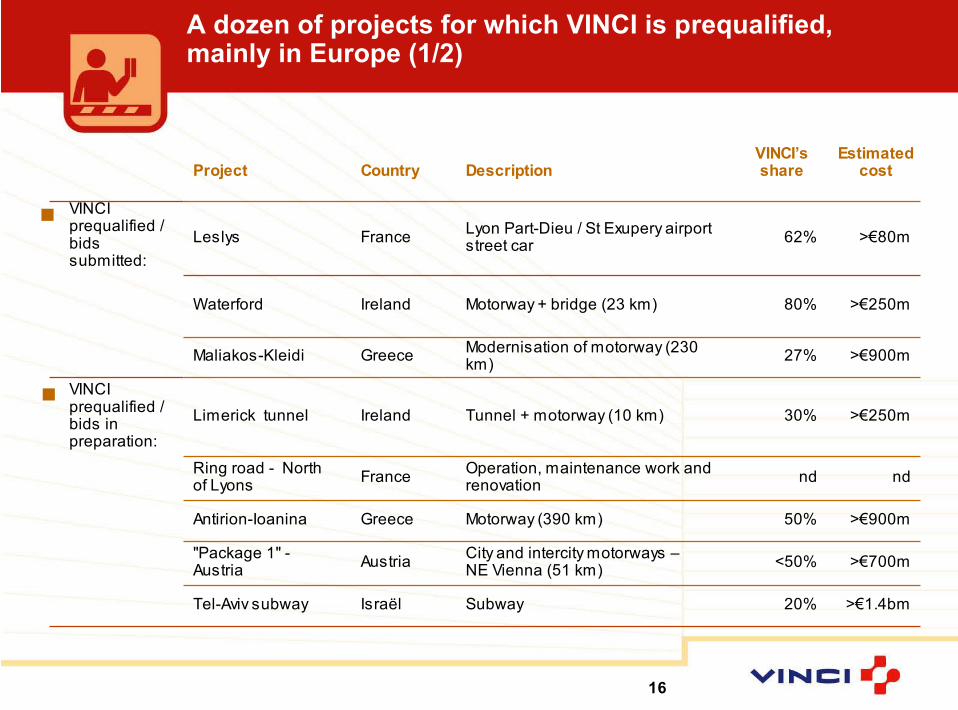
A dozen of projects for which VINCI is prequalified,mainly in Europe (1/2)
ndndOperation, maintenance work andrenovationFranceRing road - North
of Lyons
>€900m50%Motorway (390 km)GreeceAntirion-Ioanina
>€700m<50%City and intercity motorways –NE Vienna (51 km)Austria"Package 1" -
Austria
>€1.4bm20%SubwayIsraëlTel-Aviv subway
>€250m30%Tunnel + motorway (10 km)IrelandLimerick tunnelVINCIprequalified /bids inpreparation:
>€900m27%Modernisation of motorway (230km)GreeceMaliakos-Kleidi
>€250m80%Motorway + bridge (23 km)IrelandWaterford
>€80m62%Lyon Part-Dieu / St Exupery airportstreet carFranceLeslys
VINCIprequalified /bidssubmitted:
Estimatedcost
VINCI’sshareDescriptionCountryProject

17
>€1bn50%Motorway (360 km)GreeceAthens-Patras
>€70m50%Design & build – 32,000 seatsFranceNice stadium
>€250m33%Upkeep & maintenance ofCouncil road networkUKBirmingham PFI
>€200m33%Build and operation of a newstreet car lineFranceReims steet carPre-qualification
under way:
>€200m47%Widening (37 km) / maintenance(52 km) of motorwaysMünich-Ausburg
GermanyA8 (A-Modell)
>€800 m,80% subs.35%Ring road (10 km)BelgiumAntwerp ring
>€200m33%City road tunnel (2.6 km)UKTyne tunnelVINCIprequalified /waiting for thebid
Estimatedcost
VINCI’sshareDescriptionCountryProject
A dozen of projects for which VINCI is prequalified,mainly in Europe (2/2)

18
A-Model programme – Germany
German motorway widening andmaintenance programme set up inJanuary 2005, financed by TollCollect toll revenue
12 projects in total:Covering more than 560 kmRepresenting an investment of €5bn
First five tenders expected to beissued before end-2005(220 km; investment > €1.5 billion)
Shadow toll payment mechanism:Concessionaire paid by the FederalGovernment based on actual trafficvolumesConcession period: 30 years
50/50 VINCI/Hochtief partnership

ENERGY

20
2,095 2,2182,410
928897
949
VINCI Energies: 2004 key figures
Operating incomeSales Net income
+63% 2004/2003+40% 2004/2003+5% 2004/2003
€ million
118129
181
75
53
87
3,044 3,1153,338
2002 2003 2004InternationalFrance
3.9% 4.1% 5.4%
2002 2003 2004 2002 2003 2004

21
VINCI Energies: outlook for 2005
Markets to perform well in Europe, in particular in France
External growth policy to be continued in France and the rest ofEurope, in all fields of activity
Ongoing restructuring at TMS

ROADS

23
VINCI Roads: 2004 key figures
Operating incomeSales Net income
+5% 2004/2003+11% 2004/2003
€ million
2,949 3,023 3,298
2,4572,3092,257
5,2065,332 5,755
2002 2003 2004
InternationalFrance
3.2%3.8%
3.9%
+7% 2004/2003
166
201222
96
126131
2002 2003 2004 2002 2003 2004

24
Eurovia: outlook for 2005
Good prospects in France (urban development projects, tramwaysand new electoral deadlines)
Organic growth in Europe driven by new contractual models:Launch of the ”A – Model” programme in Germany (motorway wideningoperations financed by HGV electronic toll)Overall maintenance contracts for urban networks in the United Kingdom(PFI)
Integration of latest acquisitions (Spain, UK)
Strategy giving priority to development in the materials segment andto strengthening Eurovia’s corporate network in Europe and NorthAmerica

CONSTRUCTION
26
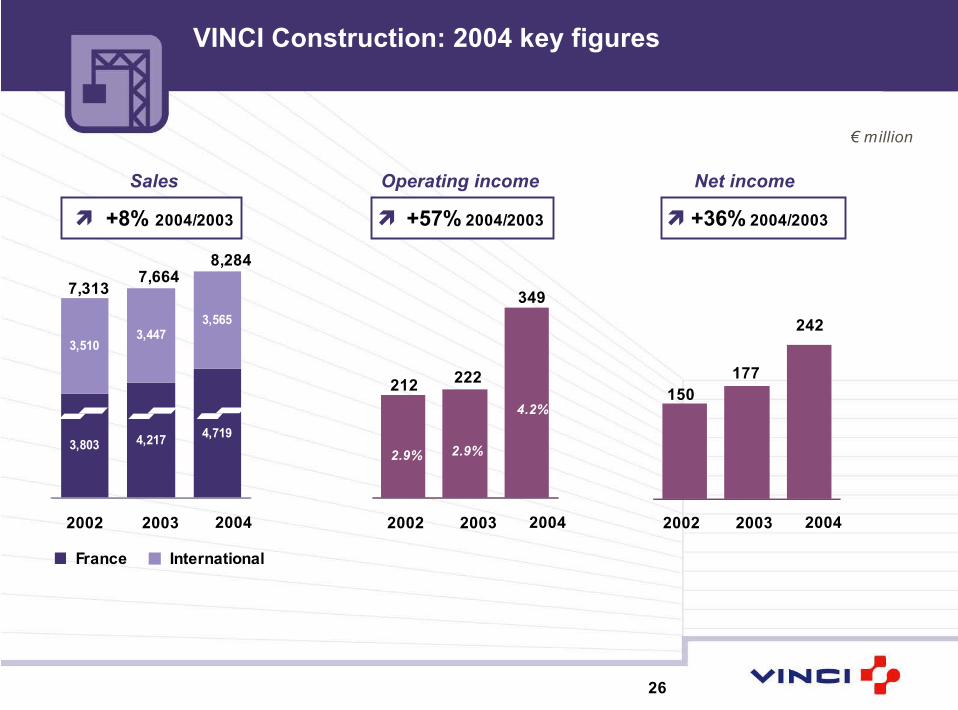
3,803 4,2174,719
3,565
3,4473,510
VINCI Construction: 2004 key figures
€ million
Operating incomeSales Net income
+36% 2004/2003+57% 2004/2003+8% 2004/2003
7,3137,664
8,284
2002 2003 2004
InternationalFrance
2.9% 2.9%
4.2%
212 222
349
2002 2003 2004 2002 2003 2004
150177
242

27
VINCI Construction: outlook for 2005
Very high level of order book: more than one year of sales at end-2004
Significant growth in trading expected in 2005 in France and CentralEurope
Targeted external growthcompleting meshing of networks in Francecompleting regional locations in the UK and Central Europe
Growing importance of PPP model in most European markets
Stepping-up of synergies with VINCI Concessions and other divisions

2004 IFRS accounts

29
2004 key figures
3,6153,744Shareholders' equity(including minority interests)
2,018 (*)Cash flow from operations
1,3681,510Operating cash flow (**)
2,021Gross operating surplus
1,373Operating income
1,300Profit from operations
2,4332,285Net debt
732731Net income (Group share)
19,52019,520Sales
IFRS standardsFrench GAAP(in € millions)
(*) Before net financing cost and tax(**) Cash flows from operations net of investments in operating assets (before growth investments)

30
Reconciliation of net income under French GAAP / IFRS
Net income under IFRS standards
Total IFRS restatements
Effect of minority interests on restatements
Tax effect on restatements
Other restatements
Restatement of reversals of provisions for major repairs will be deducted fromshareholders' equity at 1/01/2004 (IAS 37)
Cessation of amortisation of actuarial gains and losses on post-employmentobligations (IAS 19)
Restatement at amortised cost of Oceane 2007 and 2018 (IAS 39 / IAS 32)
Restatement of Group savings scheme in the1st quarter of 2005 announced in 2004(IFRS 2)
Restatements of stock option plans 2002/2003/2004 (IFRS 2)
Cessation of amortisation on goodwill on acquisition (IFRS 3)
Net income under French GAAP
(in € mill ions)
732
1
3
8
(10)
(6)
10
(15)
(16)
(20)
47
731
2004

Outlook for 2005

32
Order book at record level and of good quality
+6%
+3%
+11%
+20%
Change /Dec. 04
+17%10.014,812Total
+19%12.89,122Construction
+13%8.54,108Roads
+16%5.71,582Energy
Change /March 04
Months ofaverage
businessactivity
31 March2005in millions of euros
Order book at 31 March 2005
Excellent visibility for 2005

33
Outlook for 2005
Overall favourable market conditions:
Strong demand in building and infrastructure (France, Central andEastern Europe)
Development of innovating contractual schemes (PPPs , A-Model)
VINCI’s ambitions:
Maintain focus on margin and cash flow generation
Continue to build our European network via targeted acquisition policy
Reinforce internal synergies
In 2005, VINCI should do at least as well as in 2004!

Appendices

35
Appendices
36 to 41Sales
56 - 572004 accounts – IFRS standards
VINCI Concessions:
59 to 62Overall
63 to 67Cofiroute
68 to 70VINCI Park
43 to 542004 accounts – French GAAP

36
+9.7%+11%2,8772,593o/w France+4.1%+5.4%1,5311,453o/w International
+7.7%+8.9%4,4084,046Total
nsns8048Miscellaneous
+4%+3.5%458443Concessions and services
-1.2%+0.4%752749Energy
+0.3%+3%1,0301,000Roads
+14.9%+15.6%2,0881,806Construction
Var.like-for-like
Var.actualQ1 2005Q1 2004in millions of euros
Net sales at 31 March 2005

37
+8.7%+10.2%12,11810,999o/w France+4.4%+4.1%7,4027,112o/w International
+7.1%+7.8%19,52018,111Total
N/MN/M199111Miscellaneous
+4.7%+2.9%1,9431,889Concessions and services
+4.7%+7.2%3,3393,115Energy
+7%+7.9%5,7555,332Roads
+7.5%+8.1%8,2847,664Construction
Changeat constant
consolidationscope
Change20042003€ million
Total sales

38
N/MN/M(205)(143)Eliminations
+8.7%+10.2%12,11810,999Total
+56%+56%428274Real estate
+4.2%+4.1%1,4681,410Concessions and services
+6.7%+8.7%2,4102,218Energy
+7%+9.1%3,2983,023Roads
+10.6%+11.9%4,7194,217Construction
Change at constant
consolidationscope
Change20042003€ million
French sales

39
+4.4%+4.1%7,4037,112Total
N/MN/M(22)(20)Eliminations
+6.4%-0.7%475478Concessions and services
-0.2%+3.5%928897Energy
+7%+6.4%2,4572,309Roads
+3.7%+3.4%3,5653,448Construction
Change at constant
consolidationscope
Change20042003€ million
International sales

40
18%
16%
18%
5%
2%2%
4%
41%
25%
21%
13%
2,500 profit centres250,000 sites per year
2004 sales by expertise 2004 sales by client base
Good fit between skills, satisfactory diversification of client base
Civil engineeringConstructionRoad worksUrban development projectsRoad building materialsEnergyConcessionsInfrastructure servicesFacility managementReal estate
Local authorities and public entitiesIndustrial companiesPrivate investors and service companiesMass market
8%
19%
8%
19%18%16%
8%4%
18%8%2%5%2%
41%25%21%13%

41
2004 sales: €5.75bn
% Europeansales exFrance
Breakdown of European sales(ex France)
Germany 28%United Kingdom 26%Benelux 15%Czech Republic 10%
Poland 4%Hungary 3%Other Central & EasternEuropean countries 2%Spain 6%Other European countries 6%

Financial statements at 31 December 2004French GAAP

43
Income statement (1/2)
+29%1,3481,042875Operating income after net
financial income
6.9%5.8%5%% sales
(24)(124)(192)Net financial expenses
7%6.4%6.1%% sales
+18%1,3731,1661,067Operating income
10.4%9.8%9.5%% sales
+14%2,0211,7781,664EBITDA
+8%19,52018,11117,554Sales
04/03change200420032002€ million
French GAP

44
166
29
114
424
118
212
201222
128123117
481475
181129
222
349
1,0676.4% sales
1,3727% sales
+18%
Construction
+5%+50%
Energy
+11%
Total
+57%
Cofiroute
VINCI ParkOther concessions
Roads
2004 operating income by business line
€ million
1,1666.4% sales
Concessions +3%+1%
+40%
2002 2003 2004 04/03 changeFrench GAAP

45
30.6%
3.2%
3.9%
2.9%
6.1%
4.1%3.8%
2.9%
6.4%
31.7%
5.4%
3.9%4.2%
7%
.
2004:SalesOperating income
€1,943 m€616m
€3,338m€181m
€5,755m€222m
€8,284m€349m
*
(*) Operating income ex airport services: 42% of sales in 2002, 2003 and 2004
*
*
Concessions(and airport services)
Energy Total VINCI2002 2003 2004 2002 2003 2004 2002 2003 2004 2002 2003 2004 2002 2003 2004
Roads Construction
€19,520m€1,373m
Changes in operating margins by business line
Operating income / Sales (French GAAP)

46
+32%7.805.935,21Diluted earnings per share (€ pershare
+35%8.766.495.62Earnings per share (€ per share)
+35%731541478Net income
+1(96)(96)(79)Companies accounted for by equitymethod and minority interests
+104(80)(184)(102)Goodwill amortisation
(154)(388)
30%
(234)
22%
(223)
25%
Tax
Effective tax rate
(67)(53)147Exceptional result
+29%1,3481,042875Operating income after net
financial income
04/03change200420032002€ million
French GAAP
Income statement (2/2)

47
Cash flow statement (1/2):substantial generation of cash flow
(506)(313)(*) o/w: - new concessions for Cofiroute
(1,117)(743)Investments in development *
20189Disposals
594406Cash flows before dividends andchanges in capital
(254)(185) - ASF shares
+42%1,5101,060Operating cash flow442113Change in WCR
(493)(430)Net investments in operating assets
+13%1,5611,377Cash flow from operations
04/03change20042003€ million
French GAAP

48
26053Capital increases
(492)(35)Share buybacks
(360)(190)Dividends and miscellaneous
2234Cash flows in the period
594406Cash flows before dividends andchanges in capital
20042003€ million
Operating cash flow covers all borrowingrequirements
French GAAP
Cash flow statement (2/2):policy of share buy-backs stepped up

49
1,457
551595
2,3732,448
88182
1,095
2,307 2,408
2,325
7,402
2,226
6,768
3,1482,937
Balance sheet: reinforced financial structure
Minority interestsConcessionfixed assets
Other fixed assets
Treasury stock
Provisions andvarious long-termcharges
WCR
Net debt
Equity
€ million
Assets Liabilities Assets Liabilities
31/12/2003 31/12/2004
French GAAP

50
Breakdown of net debt by business line
(67)(703)(636)Other concessions+1(478)(479)VINCI Park
(19)(2,285)(2,266)Total
(447)(1,575)(1,128)Holdings and miscellaneous
(188)(3,299)(3,111)Sub-total: concessions andairport services
(298)(1,989)(1,691)Cofiroute
+176(129)(305)Airport services
+6162,5891,973Sub-total: construction, roadsand energy
+62422360Energy+184661477Roads+3701,5061,136Construction
04/03change31/12/200431/12/2003€ million
French GAAP

51
+11%168151141Of which Cofiroute
+6%504748 VINCI Park
+35%731541478Total
5721(13)Real estate / holdings
+31%214164170Concessions and services
+63%875375Energy
+5%13112696Roads
+36%242177150Construction
04/03change200420032002€ million
Net income by business line
French GAAP

52
Analysis of cash flow by business line
(27)(157)(52)(180)(78)Investments inoperating assets
104316105532453Operating cashflow
53169(22)265(22)Change in WCR
78304179447553Cash flow fromoperations
Holdingsand otherRoadsEnergyConstructionConcessions€ million
Total Group: €1,510m
French GAAP

53
Return on capital employed andReturn on equity by business line
7.9%
214
2,724
5.9%
417
7,102
7,439
6,765
Concessions
46.1%
242
525
N/A
266
(287)
(399)
(175)
Construction
19.1%
131
690
30.8%
160
518
470
567
Roads
73187Net income
2,937270Equity at 01/01/2004
13.3%57.6%ROCE
1,031114NOPAT
7,778197Average
24.9%32.3%ROE
7,959223Capital employedat 31/12/04
7,596172Capital employedat 01/01/2004
TotalGroupEnergy€ million
(c)
(d)
(d)/(c)
(b)/(a)
(b)
(a)
French GAAP

54
526
343
926
454
1,425
352
51
1,227
247
512
405
2005 2006 2007 2008 2009 2010-
2015
2016 2017 2018 2019 >2020
Financial position at 31 December 2004 (French GAAP)
Rating: BBB+/A2 (S&P) and BAA1/P2 (Moody’s) with stable outlookSetting-up of a 5-year €1,5bn credit line(+2 optional years)
€ million
Available cash: External debt with maturity of morethan one year:
Repayment schedule of debt withmaturity of more than one year:
€4,095m 638
6402,817
Total Group- Other subsidiaries- Cofiroute- Vinci SA
€6,468m1,5262,6292,313
Total Group- Other subsidiaries- Cofiroute- Vinci SA

Financial statements at 31 December 2004IFRS standards

56
2004 income statement: comparison under French GAAP /IFRS
1,372Operating income
)
French GAAP
(109)Minority interests
731Net income (Group share)
14Share in equity affi l iates
(80)Goodwill amortisation
(388)Income tax
(53)Exceptional result
(24)Net financial expense
127Other financial income and expenses
(151)Financing cost
(617)Amortisation and depreciation charges
(32)Net allocation to provisions
(18,165)Operating expenses
665Other revenue
19,520Sales
(in € millions)
(46)Goodwill amortisation
(10)Non-recurring items
Net income (Group share)
Minority interests
Net income (including minority interests)
Share in equity affi l iates
Income tax
Net financial expense
Other financial income and expenses
Net financing cost
Operating income
Share-based payment (IFRS 2)
Profit from operations
Operating expenses
Other revenue from ancillary activities
Sales
IFRS standards
732
(107)
838
14
(380)
(3)
238
(242)
1,208
(36)
1,300
(18,475)
255
19,520

57
2004 cash flow statement under IFRS
Collection and repayment of loans
Dividends paid
Other cash flows linked to growth operations
Net financial investments
Tax paid
Net cash flows linked to financing operations (III)Effect of changes in foreign exchange rates (IV)
Increases and reductions in capital
Change in WCR and current provisions
Cash flow from operations before tax and net financing cost
Net change in free cash flow (I)+(II)+(III)+(IV)
Change in cash management assets(*)
Sums collected during the fiscal year from stock options
Free cash flow after financing of growthNet cash flows linked to investment transactions (II)
Growth investments in concessions
Free cash flow from operations (CF available for growth)Net investments in operating assets
Cash flows from operations (I)Net interest expense paid
213
16
(241)
(385)
(489)2
95
421
2,018
+88
(223)
(343)
(231)
575(1,269)
(568)
1,368(476)
1,844
(210)
(*) cash investments excluding marketable securities

Details on VINCI Concessions
59
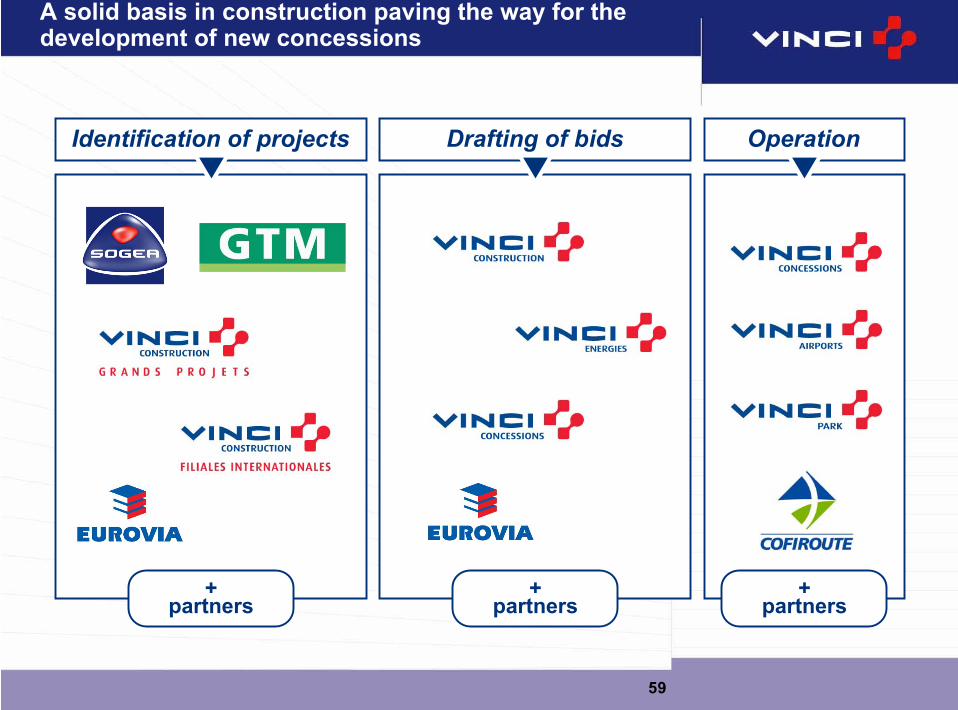
Identification of projects Drafting of bids Operation
+partners
+partners
+partners
A solid basis in construction paving the way for thedevelopment of new concessions

60
Construction margins
The Construction-Concessions integrated model:value creation over project life
Builder
Operator
Investor / conces-sionaire
“Ramp-up”
Value added
Contribution toconsolidated
income
Margins on major repairs and maintenance
Disposal of stakesor refinancing
Time scale
VINCI Construction
VINCI Concessions
Or dividends
MaturityConstruction
Operator margins

61
2004 IFRS figures by business segmentof VINCI Concessions
36ns--ASF (*)
(46)(5.8)%(27)468Airport services
23328.6%5561 943Total
(2)ns(26)(7)Holdings & double counts
1223.9%30125Other concessions
6724.1%117485VINCI Park
16653%462872Cofiroute
Net income
% ofsales
OperatingincomeSalesin millions of euros
(*) Consolidated by equity method (23% of stake)

62
VINCI Concessions: locations

63
Cofiroute: history and network
1970: creation of Cofiroute
Shareholders: VINCI (65.34%),Eiffage (16.99%), Colas (16.67%),banks (1%)
1980: 700 km under concession,o/w 508 km in operation
2005: 1,100 km under concession,o/w 928 km in operation
Number of km-lanes:4,440 km at 31 Dec. 2004
End of concession:Intercity network: 2030A86 tunnels: 70 years after totalopening
Inflation-indexed fees1.42% in 200585% x 2006-2009 i70% x i from 2010 onwards
64
257231
216195
136
189175
121
29%
28%27%
26%
21%
26%
27%
21%
1997 1998 1999 2000 2001 2002 2003 2004
Net income % sales
584
577
537504
407466443
361
67%69%68%
68%
64%65%
66%
62%
1997 1998 1999 2000 2001 2002 2003 2004
GOS % GOS
100
120
140
1994 1995 1996 1997 1998 1999 2000 2001 2002 2003 2004
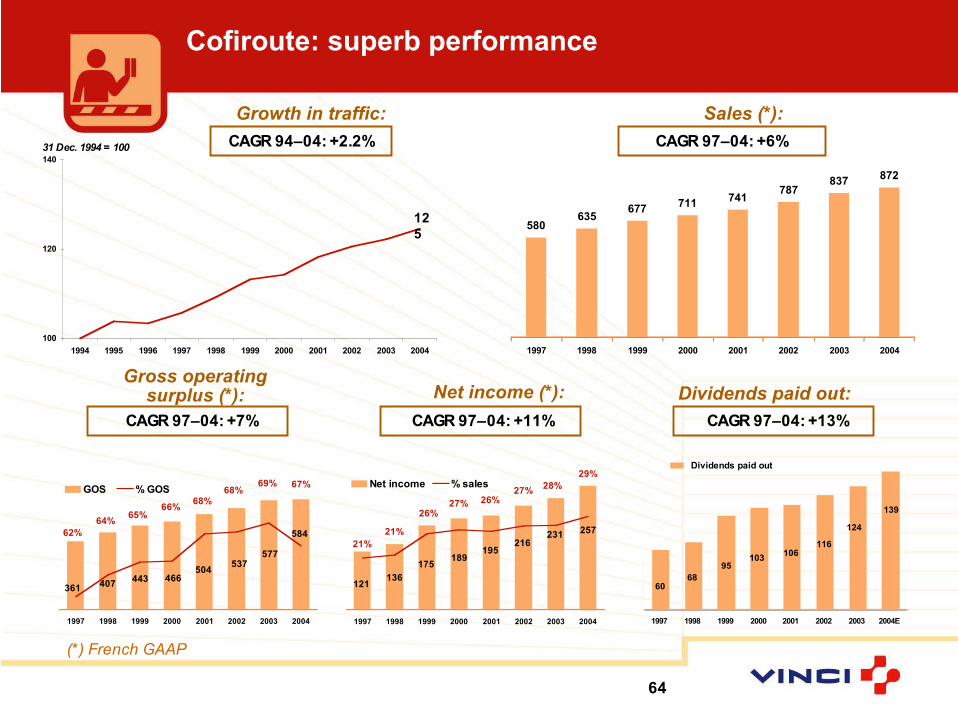
Cofiroute: superb performance
580635
677711
741787
837872
1997 1998 1999 2000 2001 2002 2003 2004
CAGR 97–04: +6%
CAGR 97–04: +7% CAGR 97–04: +11%
CAGR 94–04: +2.2%31 Dec. 1994 = 100
125
CAGR 97–04: +13%
Growth in traffic: Sales (*):
Gross operatingsurplus (*): Net income (*): Dividends paid out:
139
124
116
106
68
10395
60
1997 1998 1999 2000 2001 2002 2003 2004E
Dividends paid out
(*) French GAAP

65
Cofiroute:an intercity network of 1,100 km to be completed in 2007
0
100
200
300
400
500
600
04 05E 06E 07E 08E
M!
Intercity networkcapex programme
New sections Improvement in network (ICAS)/renewal of utilities (IEAS)
€1.6 billion capex to be spent between 2005-2008 to build the remaining 163 km of theintercity networkContractual next commissioning dates:
Robust generation of cash flow after construction ofnew sections is completed (from 2008 on)
163 kmA85 and A11 Angers bypass80 km2008A8525 km2007A2858 km2006

66
A86 West tunnels: an innovative and ambitious solution in anurban environment
A86 West tunnel: 17.5 kmA: East tunnel 1 (Rueil-A13): 4.5 kmB: East tunnel 2 (A13-Pt Colbert): 5.5 kmC: West tunnel (Rueil-A12): 7.5 km
A
B
C

67
A86 West tunnels: a new source of growthwhen intercity concession expires
Forecast receiptsGrowth in toll receipts, traffic and feesToll price based on the “congestion charge” principle
Forecast capex and schedule of opening
Data projected out to 2020Sales > €130m% GOS/sales > 72%
0.64
0.04
0.10
0.50
At end2004
Amendmentto be agreed
notdeterminedWest tunnel
End 20090.7East tunnel 2
End 20071.0East tunnel 1
1st entry intoservice
Forecast totalIn €bn
0
50
100
150
200
250
300
350
400
04 05E 06E 07E 08E
M!
A86 capex programme
End of concession: >2080

68
12%
27%
84%
44%
46%
44%
27%
16%
44%
77%
92%
8%23%
56%
ParisInternational
Spaces:800,000
Sales:€485m
Type of contract Geographical zone
EBITDA:€176m
% EBITDA/sales
12%
44%
22%
42%
VINCI Park: Largest car park operator in Europe(2004 figures)
% EBITDA/sales
36% 36%
Provinces France
Substantial number of contracts: 1,266 car parks managed in 240 citiesAverage residual duration of concession contracts: 33 years (incl. fully-owned)Net pre-goodwill income: 13.2% of sales (€64m)
Concessions & fully-ownedServices
Spaces:800,000
Sales:€485m
EBITDA:€176m

69
VINCI Park in France: good fit with VINCI Concessions’other operations, i.e. motorways and airports
442,000 spaces managedat 31 December 2004
N°1 in France
Operations in 165 cities
Good fit with the motorwaynetwork in which VINCI is aparticipant (ASF, Escota,Cofiroute)

70
0
100 000
200 000
300 000
400 000
500 000
600 000
700 000
800 000
900 000
2002 2003 2004 31 March 05
VINCI Park: increase in the number of spaces managedin Q1 2005
Services Concessions Fully-owned
384,400
331,900
18,700
464,100
327,700
19,200
735,000 811,000
Until 2004, growth driven by new service contracts abroadRenewed development of concessions in France since the end of the Antitrust ban (June 2004)Overall, the impact of spaces lost in 2002-2004 (176,000 spaces) has been completely offset
442,100 361,300
13,100
278,000
151,000
9,800
50,800
300,700
FranceInterna-
tionalTotalup 9% in 2 years
449,500
327,000
22,900
799,400
451,700
328,800
22,900
803,400

Exane BNP Paribas2005 European Seminar
Paris, 9 June 2005
Antoine ZACHARIAS, CEO of VINCIChristian LABEYRIE, CFO of VINCI