examining zebra mussel and crayfish effects on swimmer’s
TRANSCRIPT

Examining zebra mussel and crayfish effects on swimmer’s itch, a snail-borne parasitic disease
Submitted by
Aleena Hajek
Biomedical Sciences
To
The Honors College
Oakland University
In partial fulfillment of the
requirement to graduate from
The Honors College
Mentor: Thomas Raffel, Ph.D.
Department of Biology
Oakland University
February 15th, 2017

Running head: MUSSEL AND CRAYFISH EFFECTS ON SNAIL-BORNE PARASITES
2
Abstract
Swimmer’s itch is caused by avian schistosomes, snail-borne parasites that normally use
birds as definitive hosts but sometimes try to infect humans. Although it is clear that higher
densities of waterfowl and snail hosts lead to increased swimmer’s itch incidence, the effects of
other ecological variables on these parasites are less well understood. Preliminary data collected
by the Raffel lab in 2015 suggested links between urbanization and swimmer’s itch in northern
MI lakes, apparently mediated by effects of increased water clarity and growth of attached algae
(i.e., snail food) on snail populations. Urbanization might lead to (1) increased introductions of
invasive species like zebra mussels, which increase water clarity, and (2) insecticide runoff
leading to declines in crayfish, the most important invertebrate predators of snails and mussels.
My project investigated relationships between abundances of zebra mussels, crayfish, snails, and
avian schistosomes in MI lakes as well as environmental and habitat data, such as water
temperature, algae, and substrate type, as part of a large-scale survey effort being conducted by
the Raffel lab in 2016. Our findings will help to determine the causes of swimmer’s itch in
northern MI lakes and inform future management efforts, so perhaps one day our kids will no
longer have to worry about it.

Running head: MUSSEL AND CRAYFISH EFFECTS ON SNAIL-BORNE PARASITES
3
Current Research
Avian schistosomes are caused by snail-borne trematode parasites in the genus
Trichobilharzia, closely related to the parasites that cause human schistosomiasis (Horak et al.,
2015). Avian schistosomes generally use birds as definitive hosts and cannot complete their life
cycles in mammals (Blankespoor & Reimink, 1991). Several snail species act as intermediate
hosts for these parasites. Infected snails release motile infective stages called cercariae into the
water, and if these find a bird they will infect it by penetrating its skin (Horak et al., 2015).
However, cercariae sometimes mistake humans for birds and try to penetrate our skin, leading to
a massive immune response in the skin that often kills the parasite and leaves behind a nasty,
itchy rash (Horak et al., 2015). Several factors are known to increase the risk of swimmer’s itch,
including high snail densities, high bird visitation, and warm temperatures (Horak et al., 2015).
To our knowledge, no prior studies have examined potential correlations between
invasive zebra (Dreissena polymorpha) or quagga (Dreissena bugensis) mussels and cercarial
dermatitis (swimmer’s itch). However, zebra mussels are known to increase water clarity
(decrease turbidity) by consuming phytoplankton, which are algae and bacteria that grow in the
water column (Kirsch & Dzialowski, 2012). These changes in water turbidity are mostly seen in
shallow ponds and lakes (MacIsaac, H. J., 1996). The pattern of mussels decreasing turbidity is
supported by research on the Saginaw Bay among others. In the bay, the turbidity was 9.2
nephelometric turbidity units (NTU) in 1991 (MacIsaac, H. J., 1996). In the span of a year, it
decreased to 8.3 NTU and after another, down to 3.7 NTU (MacIsaac, H. J., 1996). Turbidity has
also been shown to have an inverse relationship with mussel respiration rate (Alexander Jr, J. E.,
Thorp, J. H. & Fell, R. D., 1994). This increased water clarity can allow more light to penetrate
to the bottom of the lake, thereby increasing growth of periphyton (attached algae) that serve as

Running head: MUSSEL AND CRAYFISH EFFECTS ON SNAIL-BORNE PARASITES
4
food for snails (Rohr et al., 2008). Zebra mussels can also increase nutrient (mostly phosphorus
and ammonia) concentrations in water (Wojtal-Frankiewicz, 2011; Lindim, 2015) and change the
species composition of phytoplankton (Baker et al., 1998), with unknown effects on growth rates
of attached algae and snail populations.
If zebra mussels cause increased water clarity by consuming phytoplankton (floating
algae), this should logically result in increased growth of attached algae (periphyton) and thus
increased snail densities. This could lead to increased incidence of swimmer’s itch where there is
a greater abundance of zebra mussels. However, this potential relationship between zebra
mussels and phytoplankton (floating algae) is complicated by the fact that zebra mussels rely on
phytoplankton as a food source, such that phytoplankton biomass is sometimes a positive
predictor of zebra mussel occurrence (MacIsaac, H. J., 1996). This leads to two possible
relationships between zebra mussels and water turbidity in natural lakes. It is possible that zebra
mussel abundance might have a positive correlation with phytoplankton levels and water
turbidity, if zebra mussel abundance is limited by phytoplankton abundance. Conversely, we
might observe a negative correlation between mussels and turbidity if zebra mussels are limited
by other factors, leading to reduced phytoplankton abundance in lakes with more mussels.
Another environmental factor that can limit mussel abundance is the availability of
calcium for growing shells. Zebra mussels grew best under controlled lab conditions when the
water had over 8.5 mg calcium per liter, an alkalinity level of over 65 mg CaCO3 per liter, and
water hardness over 100 mg of CaCO3 per liter (Hincks & Mackie 1997). Further, negative
growth was noted with levels of calcium less than 8.5 mg per liter, alkalinity less than 17.1 mg
CaCO3 per liter, and water hardness less than 31 mg CaCO3 per liter (Hincks, S. S. & Mackie, G.
L., 1997). These variables were able to explain 60-66% of the variation that was seen in shell

Running head: MUSSEL AND CRAYFISH EFFECTS ON SNAIL-BORNE PARASITES
5
length of the zebra mussels (Hincks, S. S. & Mackie, G. L., 1997). Later, alkalinity was used as
a predictor variable for zebra mussels by Whittier et al. (2008). It was found that zebra mussel
occurrences mostly happened in areas with a mean calcium level of at least 28 mg per liter and a
25th percentile of greater than 12 mg per liter (Whittier et al., 2008). Lastly, only 2 lakes with a
low alkalinity (12 mg per liter ≤ 75th percentile < 20 mg per liter or 75th percentile < 21 mg per
liter and a maximum of 28 mg per liter) were reported to have zebra mussel invasions, one of
which was Glen Lake, one of the 16 in our survey (Whittier et al., 2008). Therefore, alkalinity is
often positively correlated with mussel occurrence and is likely that these variables will differ
throughout the lakes in the survey.
Quagga mussels are a second species of invasive mussel also found in northern Michigan.
Quaggas are more adapted to living in colder climates than zebra mussels (Whittier et al., 2008).
Although quagga mussels do not spread as quickly as the zebra mussel, they are competitively
dominant and are expected to eventually displace zebra mussels in Michigan lakes where both
occur (Whittier et al., 2008). However, much less research has been done on the quagga mussel
and knowledge is currently limited (Whittier et al., 2008). For example, it is not known if their
environmental requirements are similar to zebra mussels, though quagga mussel shells are
thinner than zebra mussel shells so they might tolerate lower calcium levels (Whittier et al.,
2008). For the sake of this study, we will assume zebra and quagga mussels are similar enough
ecologically to include both in among-site analyses of mussel abundance.
Crayfish are important predators on both zebra mussels and snails (Czarnoleski et al.,
2011), so anything that influences crayfish populations could have indirect effects on mussel
densities, snail densities, and swimmer’s itch incidence (Halstead et al., 2015). Crayfish can also
have non-lethal effects on zebra mussel filtration rates (Czarnoleski et al., 2011), which could
Running head: MUSSEL AND CRAYFISH EFFECTS ON SNAIL-BORNE PARASITES
6
subsequently affect water clarity. Naddafi et al. found in 2007 that predatory cues from crayfish
caused negative effects on the clearance rate of phytoplankton. This then has an indirect positive
effect on phytoplankton due to the mussels slowing the intake (Naddafi et al, 2007). This again
leads to multiple possible outcomes with different predictions. Snails and mussels provide food
for crayfish, so one might expect high snail and mussel densities to support greater populations
of crayfish. This would lead to positive correlations between crayfish, snails, and swimmer’s
itch. Alternatively, high densities of crayfish predators might reduce populations of zebra
mussels and snails, resulting in negative correlations between crayfish and snails (Halstead et al.,
2015). The latter possibility is more likely if crayfish densities are limited by factors other than
food abundance. For example, crayfish are known to be highly sensitive to insecticides from
urban and agricultural runoff, and prior studies have found that even low levels of insecticide can
result in increased snail productions due to release from crayfish predation (Halstead et al.,
2015). It will thus be interesting to see whether and how snail and zebra mussel abundance
correlate with crayfish abundance in the lakes being studied.
The central purpose of the study was to test for potential effects of zebra mussels and
crayfish on avian schistosomes and their snail intermediate hosts in northern MI lakes. In
collaboration with other members of the Raffel lab, I measured these factors in 38 sites across
northern MI. I examined potential predictors of mussel abundance, water clarity, growth of
attached algae, and snail abundance, to test for hypothesized effects of (1) water quality on
mussel abundance, (2) mussels on water clarity and periphyton growth rates, (3) crayfish on
populations of zebra mussels and snails, and (4) water clarity and periphyton on populations of
snail intermediate hosts for swimmer’s itch parasites. I also compared and contrasted quadrat
sampling versus allowing mussels to settle on an artificial substrate, as alternative ways to

Running head: MUSSEL AND CRAYFISH EFFECTS ON SNAIL-BORNE PARASITES
7
measure zebra mussel abundance in northern Michigan lakes.
Methodology
My project was part of a larger effort by the Raffel lab to survey potential ecological
drivers of avian schistosome parasites on 38 sites on 16 lakes in northern Michigan. A table of all
the lakes, site identification codes, and latitude and longitude coordinates can be found in Table
1. Also, a map is provided in figure 1. Water temperature and light were measured continuously
using data loggers using HOBO pendant data loggers. We conducted weekly surveys of snail
densities at each site, in addition to growth of attached algae and water chemistry variables. I
also helped conduct laboratory analysis of samples (snails, zooplankton, algae, water chemistry).
The schedule of this can be seen in table 2 and 3.
At each site, I conducted two crayfish trapping sessions spaced two weeks apart. For each
trapping session, I set three traps for a day each, for a total of six trapping nights at each site.
Traps were baited with tuna using devices made from tea diffusers and string, positioning the
bait in the middle of the trap. I used two crayfish traps (2-inch diameter opening) and one
minnow trap (1-inch diameter opening) on each sampling occasion to obtain data on both large
and small crayfish. This can be seen in figure 3. All crayfish caught were documented with
photographs.
Zebra mussel settling rates were measured by placing two samplers at each site in July
and leaving them undisturbed through the end of September, when new mussels settle and attach
onto available substrates (Mackie et al., 1989). I suspended two samplers in the water column at
each site, either hanging from an existing dock structure or from a buoy. Zebra mussel samplers
were based on a published design (Monitoring Protocol, 2014) and comprised of a stacked array

Running head: MUSSEL AND CRAYFISH EFFECTS ON SNAIL-BORNE PARASITES
8
of three roughened PVC plastic sheets. The dimensions of the sheets were 15 cm by 15 cm, 20
cm by 20 cm and 22.5 cm by 22.5 cm. This gives a total of 2,262.5 square cm of surface area for
the zebra mussels to settle on per sampler. There was a 1 inch PVC pipe spacer to separate the
three layers and they were all connected by a 6-inch bolt and wing nut. After being collected, the
samplers were disassembled and scraped free of zebra mussels, which were preserved in 70%
ethanol for analysis of wet mass and approximate counts. To determine the approximate number
of mussels on each sampler, I massed 10 randomly selected mussels from each sampler. I then
divided the total mussel biomass per sampler by the mean mass per mussel to estimate the total
number of mussels per site. Before and after pictures of the samplers are provided in figure 2.
In addition, 3 times (week 1, week 3, and week 5 of the surveys), at every site, we
conducted a quadrat survey of the substrate at each site to obtain estimates of snail and zebra
mussel densities. Quadrat samplers consisted of a PVC square (one square foot) separated into 9
visual sections by string. Two strings ran vertically and two ran horizontally giving a 3 by 3 grid.
This can be seen in figure 5. For each survey, we tossed random samplings of the lake bottom at
three different water levels. We threw the quadrat sampler to four haphazard locations within
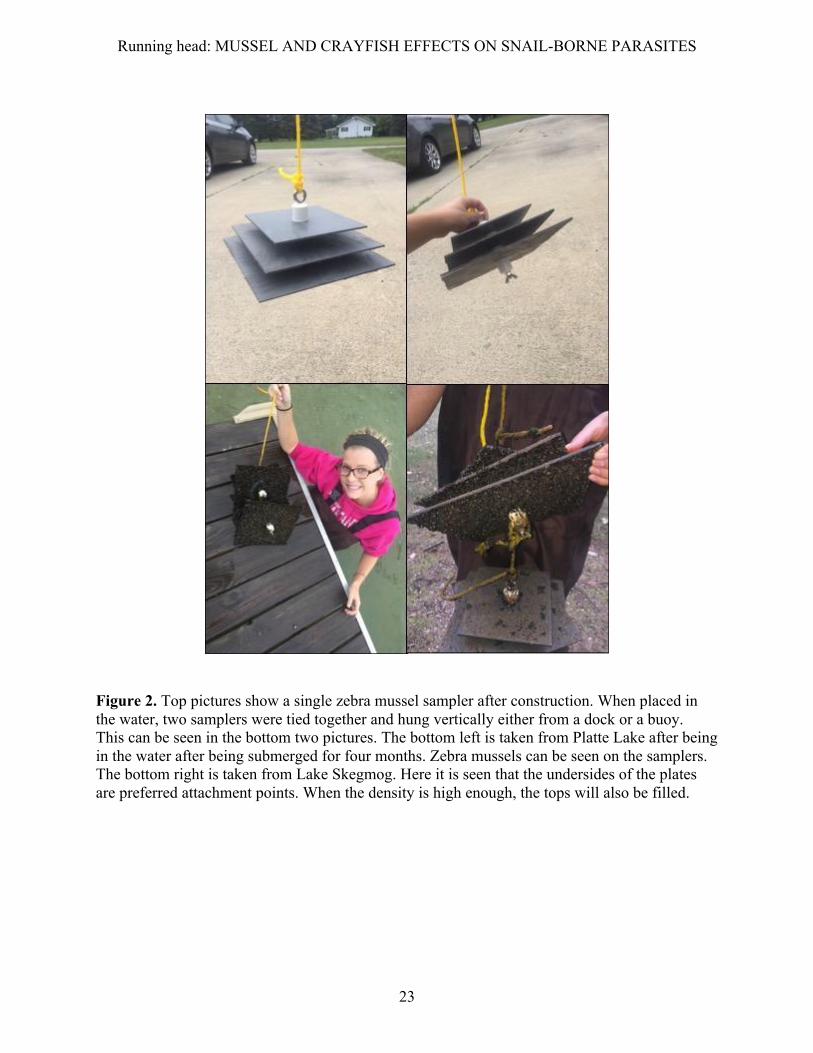
each water depth category (0-20 cm, 20-40 cm, 40-60 cm) and used a view bucket (Fig. 4) to
locate and count the snails and mussels in each quadrat. If there were too many to count, we only
counted the four corners of each quadrat to obtain density estimates. Densities were recorded for
both the snails and mussels and were identified to the genus level. Any other organisms, such as
crayfish, were noted if encountered in quadrat sampling. Lastly, the snails were collected and
preserved in 70% ethanol.
For all components of the site assessment, including cobble, a numerical score was used
to indicate abundance of landscape or substrate types based on the following numeric index: 0 =

Running head: MUSSEL AND CRAYFISH EFFECTS ON SNAIL-BORNE PARASITES
9
Absent, 1 = Sparse (< 10% coverage), 2 = Moderate (10−40% coverage), 3 = Heavy (40−75%
coverage), and 4 = Very Heavy (> 75% coverage).
Zooplankton was also sampled at the sites on three occasions. A standard 8-inch
zooplankton net with a 5-meter string attached was used. Sampling consisted of three horizontal
drags. The samples were preserved in Lugul’s solution. The three most abundant taxa
(Copepoda, Cladocera, and Ostracoda) were recorded and notes were taken if other rare taxa
were found.
Turbidity Protocol
Collect a sample in a clean container. Fill sample cell (glass vials) to the line,
approximately 15 mL, then cap the cell. Handle the cell by the top to avoid getting fingerprints
on the sides of the cell. Wipe the outside of the cell with a Kim wipe to remove any fingerprints
or water spots. Apply a thin film of silicone oil around the outside of the cell. Wipe with a soft
cloth to obtain an even film over the entire surface.Make sure the instrument is on a flat, sturdy
surface then press the I/O button to turn it on. Do not hold the instrument while it’s taking
readings. Insert sample cell into the instrument cell so that the triangle on the sample cell is
facing toward you. Close the lid. Select manual or automatic range selection by pressing the
RANGE key. The display will show AUTO RNG when the instrument is in automatic range
selection. Select signal averaging mode by pressing the SIGNAL AVERAGE key. The display
will show SIG AVG when the instrument is using signal averaging. Use signal average mode if
the sample causes a noisy signal (display changes constantly). Press READ. The display will
show - - - - NTU, then the turbidity in NTU. Record the turbidity after the lamp symbol turns off.
This protocol was followed at every site and was recorded once a week as shown in table
2 and 3. A Hach portable turbidimeter was used to take samples and therefore the Hach protocol

Running head: MUSSEL AND CRAYFISH EFFECTS ON SNAIL-BORNE PARASITES
10
was given and followed.
Chlorophyll A Assay Protocol
Periphyton Tiles Placement
Obtain 3 clean plexiglass tiles (10 x 10 cm) that have been secured to float and poly rope.
Tie each periphyton sampler to cinder block or sufficient anchor. Each tile should be tied so that
there are 30 cm of poly rope between the tile/float and the anchor. Walk out to 60 cm depth and
place samplers in a triangle formation leaving at least 2 meters between each anchor. Make sure
that they are all 30 cm from the water surface. Adjust the sampler so that the tile is oriented
upward towards the water surface and the float is underneath the tile.
Periphyton Tile Collection (end of survey)
Use a meter stick to measure and record the final depth of each tile (write the depth on
the field sheet). Remove the tile from the noodle float and place it into its corresponding Ziploc
bag. Avoid touching the top of the tile. Store bagged tile in cooler on ice. Process periphyton
tiles the same day as collection.
Periphyton Tile Processing and Filtration
Set up vacuum filtration apparatus. Keep tiles on ice until they are processed. Using
forceps and a toothbrush - hold the tile still in the pan and brush the surface of the tile, removing
periphyton and allowing it to collect in the pan. Use a squirt bottle (tap water) to rinse the tile
and the toothbrush, keeping all liquid in the pan. Use vacuum pump and filter tower set up to
concentrate the sample onto a Whatman GF/F glass microfiber filter (0.7 µm; Whatman Inc.,
Kent, U.K.). Be sure to thoroughly rinse the pan onto the top of the filter paper. If filtering in the
field, keep foil squares in waterproof bag on ice and get them to a freezer within 6 hours.
Methanol Extraction for Processing Periphyton Filters

Running head: MUSSEL AND CRAYFISH EFFECTS ON SNAIL-BORNE PARASITES
11
Filters will be folded and labeled in tin foil in freezer at -20 °C until fluorometric
analysis. Make up 90% Methanol solution (10% water). Place each filter in its labeled tube. Add
exactly 5 mL of methanol to each tube. Cap all tubes and place in fridge for a 24 hour period
topromote algal cell lysis following a modified version of the EPA method 445.0.
Loading microplate for reading Chlorophyll A on Fluorometer
Centrifuge samples for 5 minutes (1500 rpm) to remove any suspended particles from the
sample liquid. Pipette 200 µL of each sample. Fluorometric analysis (Synergy H1 microplate
reader, Biotek, Winooski, VT, USA) was used to determine chlorophyll A in relative
fluorescence units; fluorescence (emission) was recorded at the 680 nm detection wavelength
using an excitation wavelength of 440 nm. We calculated the average fluorescence for the three
tiles to obtain an index of periphyton growth potential at each site.
Alkalinity Protocol
Fill plastic tube full (to the top) with sample water. Pour the contents of the tube into the
square mixing bottle. Add the contents of one Phenolphthalein Indicator Powder Pillow to the
mixing bottle. Swirl to mix. If the water remains colorless, the phenolphthalein alkalinity is zero.
In this case, proceed to Step 7. If the sample turns pink, add Sulfuric Acid Standard Solution one
drop at a time. Count each drop. Swirl the mixing bottle after each drop is added. Add drops until
the sample turns colorless. Multiply by 20 the number of drops of titrant used. This is the mg/L
of phenolphthalein alkalinity as calcium carbonate (CaCO3). mg/L CaCO3 phenolphthalein
alkalinity = number of drops x 20. (Step 7) Add the contents of one Bromcresol Green-Methyl
Red Indicator Powder Pillow to the mixing bottle. Swirl to mix. Add Sulfuric Acid Standard
Solution one drop at a time. Count each drop. Swirl the mixing bottle after each drop is added.
Add drops until the sample turns pink. Multiply by 20 the total number of drops of titrant used in

Running head: MUSSEL AND CRAYFISH EFFECTS ON SNAIL-BORNE PARASITES
12
both steps 5 and 9. This is the total mg/L of methyl orange alkalinity as calcium carbonate
(CaCO3).
Alkalinity was only measured the first and final week (week 1 and 5) at each site. This
gave measurements for the beginning and end of the survey. This protocol is taken from the
Hach alkalinity test kit manual, seeing as this was the manufacturer that we used.
Statistical Analyses
Once all the data was compiled by late Fall 2016, correlation analysis, multiple linear
regression, and structural equation modeling were used to test for relationships between
variables. Prior to among-site analyses, we averaged the measurements of each predictor or
response variable for each site. Count data and turbidity measurements have highly skewed
distributions, so we log-transformed these variables (log10[N+1] for counts) prior to calculating
their averages. We next did an exploratory analysis testing for Pearson correlations between all
pairwise combinations of variables measured. For each response variable of interest (snail
abundance, periphyton growth, turbidity, crayfish abundance, mussels per quadrat, and mussels
per sampler), we followed up on potentially explanatory (r > 0.3) predictor variables using
multiple linear regression (function “lm” in program R). These predictors and responses are
compiled into a chart in table 4. The correlations coefficients greater than +/- 0.3 are highlighted.
Contributions of predictors to each model were assessed using F-tests with a Type II sums of
squares procedure (function “Anova” in the “car” package). Non-significant predictors (P > 0.05)
predictors were removed sequentially from each model via backwards selection. Program R was
used for all statistical analyses (R Project Core Team, 2016). This protocol is similar to the
protocol used by Alex Bageris to analyze his Honors Thesis dataset, which included several of
the same variables compiled by the Raffel lab during this survey.

Running head: MUSSEL AND CRAYFISH EFFECTS ON SNAIL-BORNE PARASITES
13
Results
Since there were two types of zebra mussel measurement, the quadrats and the samplers,
it was interesting to see if they would provide similar data for the lakes. This ended up not being
the case. For the mussel quadrats (Fig. 6), gravel (F1,36=16.718, p value < 0.001) and cobble were
significant, but no other variables such as alkalinity or crayfish abundance. However, with the
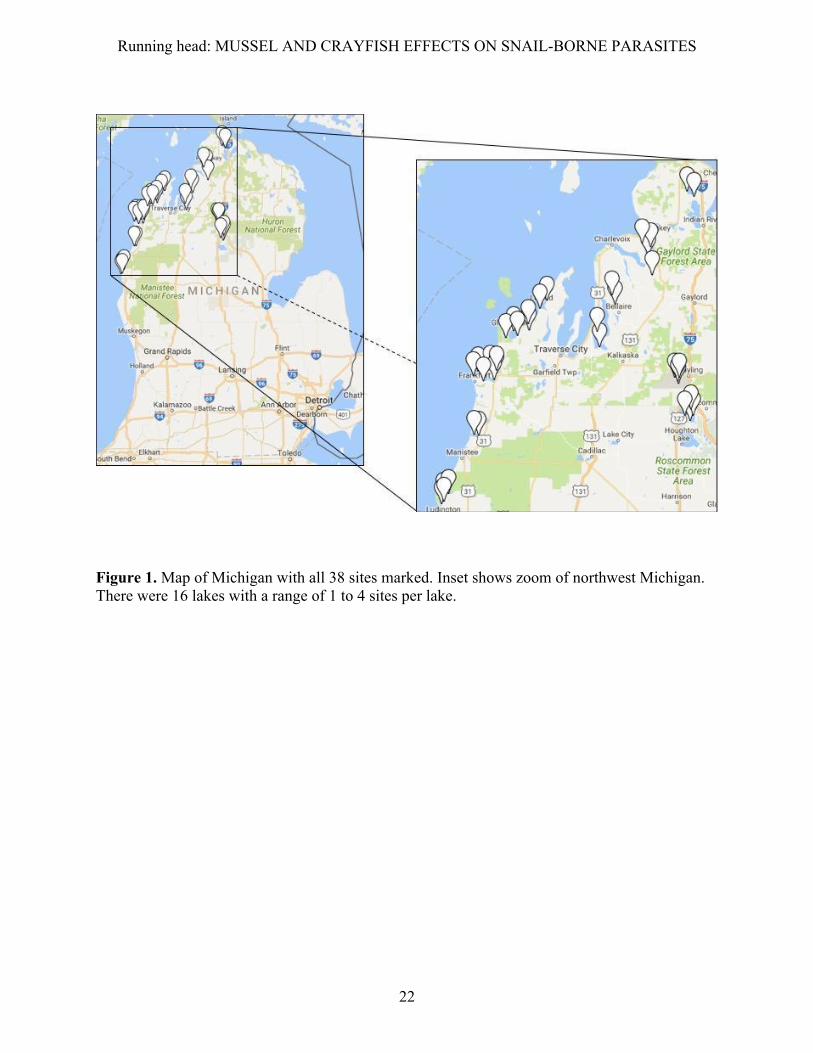
mussel samplers, we do not see this correlation. It was found that the undersides of the samplers
were colonized first, but when those were full, the top side would then be filled (Fig. 2). The best
predictor of mussel biomass on samplers was alkalinity, which was a highly significant predictor
(F1,27 = 7.867, P = 0.009; Fig. 8). Another predictor that had a nearly significant relationship with
mussel biomass, after accounting for alkalinity, was water turbidity (F1,27 = 4.176, P = 0.051;
Fig. 8).
Water turbidity was also the best predictor of snail abundance (F1,35 = 12.101, P < 0.001).
It had a negative slope, meaning the more turbid the water, the fewer snails. Snail abundance
also increased with our index of cobble substrate (F1,35=5.821, P = 0.021).
The best predictor of crayfish abundance was our index of sand substrate (F1,36=4.850, P
= 0.034), with more sandy substrate correlating with fewer crayfish (Fig. 9). Where there were
more crayfish, the mass of the mussels was decreased (F1,17 = 4.687, P = 0.045). Mussel size was
also negatively affected by the density of mussels on the sampler (F1,17=7.012, p value = 0.017)
(Fig. 10).
The two most significant predictors of water turbidity were mean daily temperature
(F1,26=19.547, p value < 0.001) and mussel biomass on samplers (F1,26=13.970, p value < 0.001;
Fig. 11). Another predictor was log mussels per sampler. Lastly periphyton, measured by relative
fluorescence units (RFU) of chlorophyll, was examined to see periphyton growth on surfaces.

Running head: MUSSEL AND CRAYFISH EFFECTS ON SNAIL-BORNE PARASITES
14
The best predictor of periphyton growth was the alkalinity of the water (F1,36 = 5.641, P = 0.023;
Fig. 12).
Discussion
The primary objective of this section of the research study was to determine whether
zebra mussels and crayfish are important factors driving swimmer’s itch incidence in northern
MI lakes. Based on our hypotheses, we predicted that sites with greater zebra mussel density
would increase water clarity, resulting in greater abundances of periphyton (attached algae) and
snails. Some of these predictions were supported by our results. The mussels did in fact increase
water clarity. This is probably because mussels filter algae out of the water, decreasing turbidity
and making the water clearer. However, the predicted effect of water clarity on periphyton was
not observed, and periphyton growth was not the best predictor of snail abundance. Thus, we
were unable to confirm that periphyton growth rates were the primary factor linking zebra
mussels and snails. One possible explanation of this lack of pattern is that our periphyton
measurements were all conducted in shallow water, and that snail populations are more limited
by light-limited growth of periphyton out in deeper water.
Our findings suggest a potential link between increased mussel abundance and snail
abundance, which would likely lead to an increased abundance of avian schistosome cercariae in
the water. Our data therefore leads us to believe that an increased swimmer’s itch risk is possibly
increased by zebra mussel invasion. Our results also suggest a potential role for crayfish in
moderating zebra mussel impacts on water clarity. We found a negative effect of crayfish
abundance on the size of mussels on samplers, consistent with prior studies that showed reduced
water filtration by zebra mussels in the presence of crayfish.

Running head: MUSSEL AND CRAYFISH EFFECTS ON SNAIL-BORNE PARASITES
15
The strong correlation between local mussel abundance (quadrat samples) and our index
of gravel substrate suggests that substrate availability is the major regulating factor for mussel
abundance at local sites. This is a density dependent factor that might set the carrying capacity of
mussels in a given site. If there are more mussels, it leads to less space, and therefore mussel
production will begin to cease because there is no longer an area for them to attach. In support of
this idea, we also found a negative effect of mussel density on individual mussel mass on
samplers (Fig 10). However, when we provided a substrate for the mussels to colonize
(controlling for substrate availability), colonization rates by juvenile mussels appear to have been
driven primarily by water alkalinity. As mentioned before, a minimum alkalinity is needed for
shell growth of the mussels. The samplers therefore instead show the rate at which mussels
colonize the substrate, rather than measuring the carrying capacity of mussels at a particular site.
Zebra and quagga mussels are already considered problematic invasive species in
Michigan lakes. Our results have a few implications for organizations interested in monitoring
and controlling zebra and quagga mussels. First, it seems clear that different methods of
surveying mussel abundance measure different aspects of zebra mussel population dynamics.
The quadrat sampling provided a fast, reliable way to measure local densities; however, these
numbers are not likely to be representative of the entire lake. The samplers might be better for
measuring lake-wide zebra mussel abundance and provide a measurement of the potential for
rapid mussel colonization. Both samplers and quadrats provide useful information that can help
provide a complete picture of zebra mussel abundance and population dynamics in each lake.
Snail location was not one of the factors studied in depth prior to conducting the study.
However, after further research on the topic, snails were more likely to be found in areas where
there was little cobble, due to predation factors (Kreps et al., 2012). Crayfish are known for

Running head: MUSSEL AND CRAYFISH EFFECTS ON SNAIL-BORNE PARASITES
16
liking more rocky areas because it provides them shelter (Kreps et al., 2012). Therefore, this is
where the crayfish density is the highest (Kreps et al., 2012). Our data did show that crayfish
were less abundant in sandy areas, consistent with prior findings that crayfish prefer rocky
substrates. However, we found more snails in the areas with more cobble substrate, even though
those are the same areas where crayfish are likely to be found. We are uncertain what might have
driven this pattern, but this result suggests that crayfish are not a strong determinant of snail
densities in these lakes.
Although mussel density was never a predictor for crayfish, crayfish were instead a
predictor for individual mussel mass. This is likely because when there is a risk of predation, the
mussels feed less so they can keep their shells closed as an anti-predator defense. With reduced
feeding rates, the mussels would not grow as rapidly and have a smaller mass to those compared
to areas where the abundance of crayfish was smaller.
Lastly, since turbidity played such a significant role in predicting snails and mussels, we
examined factors influencing turbidity in addition to mussels. One of the most significant
predictors was mean daily temperature, with higher temperatures leading to increased turbidity
(Fig. 11). One possibility is that higher temperatures led to a faster rate of chemical herbicide
breakdown. Another possibility is that water temperatures simply facilitate faster growth of
periphyton in the water, leading to increased turbidity.
Acknowledgements
The completion of this thesis would not have been possible without the guidance and
support of the Raffel lab and the lake associations. A sincere thank you is extended to Thomas
Raffel for his assistance and his remarkable mentorship. Without him, I would have not learned

Running head: MUSSEL AND CRAYFISH EFFECTS ON SNAIL-BORNE PARASITES
17
anything: statistics, how to conduct research in the lab, even how to tie multiple types of knots.
For that, I am deeply grateful. Also, I would like to thank Madelyn Messner and Jason
Sckrabulis for answering never ending questions and teaching us proper method in the field. We
began not knowing a single thing, but by the end, they trusted us enough to do it on our own.
Thank you for believing in us. Also, I would like to thank the 16 lake associations that helped
make the entire project possible through their generous funding. Some of these people even
opened their doors and provided us lodging. Although they did not believe they had a large
impact, it would have been impossible to complete the project without them. They invited
strangers into their home, fed us, and treated us like family. In the process, we felt like we truly
did become family. Thank you. The names of those that opened their homes to us are: Ken and
Teresa Dennings, Russ and Kathy Kittleson, Steve and Kathy Young, Sandra and Ken Michalik,
Anne Covy, Holly and Rich Gerdert, John and Gayle Popa, Denny and Luci Lavis, Scott and
Kelly Zimmerman, Bob and Dotty Blank, and Bob and Peggy Haverberg. Also, thank you to the
volunteers at each site who took daily water samples and measurements for the project. It
honestly could not have been done without them. Also, thank you to one of my best friends,
Paige Templeton, for giving up a weekend to come with me and collect mussel samplers in the
freezing cold. I would not have been able to do it without you. Lastly, thank you to my partner in
crime, my co-pilot and hype radio DJ, my crayfish grabber when I was grossed out, my catcher
when I (literally) fell, and my friend that kept me sane throughout the entire process. Thank you,
Alex Bageris.

Running head: MUSSEL AND CRAYFISH EFFECTS ON SNAIL-BORNE PARASITES
18
Table 1. Table compiling all sampling sites. Gives lake, our unique site identification code, as well as both latitude and longitude coordinates.

Running head: MUSSEL AND CRAYFISH EFFECTS ON SNAIL-BORNE PARASITES
19
Table 2. Compilation of weekly schedule for the west sites.
SI SURVEY 2016- WEST SITE
1 June 28-July1
2 July 5-8
3 July 12-15
4 July 19-22
5 July 26-29
Snail Survey Hamlin-4 Portage-2 Crystal-4 Platte-3 Glen-3 Lime-1 LT-1 Lee-2
Hamlin-1 Crystal-2 Platte-1 Glen-1 Lee-1
Hamlin-4 Portage-2 Crystal-4 Platte-3 Glen-3 Lime-1 LT-1 Lee-2
Hamlin-1 Crystal-2 Platte-1 Glen-1 Lee-1
Hamlin-4 Portage-2 Crystal-4 Platte-3 Glen-3 Lime-1 LT-1 Lee-2
Crayfish ✔ ✔
D/O ✔ ✔ ✔ ✔ ✔
Turbidity ✔ ✔ ✔ ✔ ✔
Zooplankton ✔ ✔ ✔
Alkalinity ✔ ✔
Water Sample
✔ ✔
Periphyton SET COLLECT

Running head: MUSSEL AND CRAYFISH EFFECTS ON SNAIL-BORNE PARASITES
20
Table 3. Compilation of weekly schedule for the east sites.
SI SURVEY 2016- EAST SITE
1 June 28-July1
2 July 5-8
3 July 12-15
4 July 19-22
5 July 26-29
Snail Survey
Higgins-4 Margrethe-4 Elk/Ske-2 Intmdt-2 Walloon-3 Douglas-2 Deer - 1
Higgins-1 Margrethe-1 Elk-1 Intmdt-1 Walloon-1 Douglas-1
Higgins-4 Margrethe-4 Elk/Ske-2 Intmdt-2 Walloon-3 Douglas-2 Deer - 1
Higgins-1 Margrethe-1 Elk-1 Intmdt-1 Walloon-1 Douglas-1
Higgins-4 Margrethe-4 Elk/Ske-2 Intmdt-2 Walloon-3 Douglas-2 Deer - 1
Crayfish ✔ ✔
D/O ✔ ✔ ✔ ✔ ✔
Turbidity ✔ ✔ ✔ ✔ ✔
Zooplankton ✔ ✔ ✔
Alkalinity ✔ ✔
Water Sample
✔ ✔
Periphyton SET COLLECT

Running head: MUSSEL AND CRAYFISH EFFECTS ON SNAIL-BORNE PARASITES
21
Table 4. Chart of predictors and responses. Correlation coefficients r>0.3 are highlighted.
Running head: MUSSEL AND CRAYFISH EFFECTS ON SNAIL-BORNE PARASITES
22
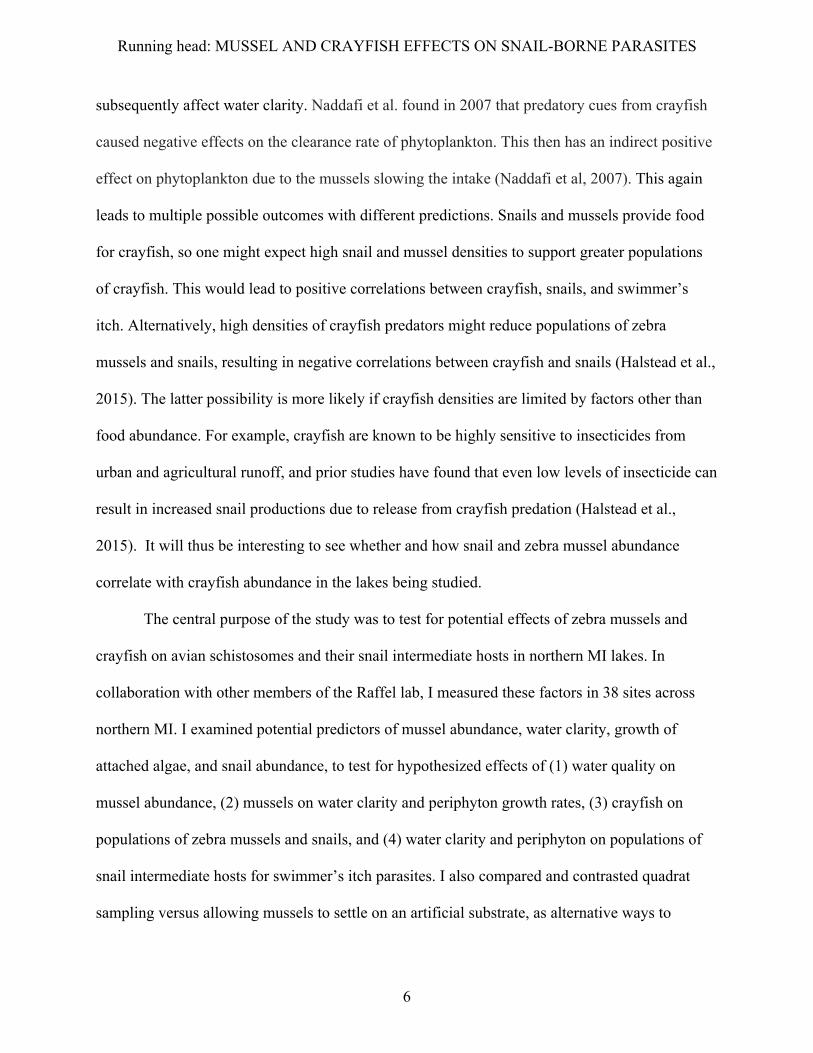
Figure 1. Map of Michigan with all 38 sites marked. Inset shows zoom of northwest Michigan. There were 16 lakes with a range of 1 to 4 sites per lake.
Running head: MUSSEL AND CRAYFISH EFFECTS ON SNAIL-BORNE PARASITES
23
Figure 2. Top pictures show a single zebra mussel sampler after construction. When placed in the water, two samplers were tied together and hung vertically either from a dock or a buoy. This can be seen in the bottom two pictures. The bottom left is taken from Platte Lake after being in the water after being submerged for four months. Zebra mussels can be seen on the samplers. The bottom right is taken from Lake Skegmog. Here it is seen that the undersides of the plates are preferred attachment points. When the density is high enough, the tops will also be filled.

Running head: MUSSEL AND CRAYFISH EFFECTS ON SNAIL-BORNE PARASITES
24
Figure 3. Set up of crayfish trap. a. and b. show minnow trap (denoted by “A - little” in our data set). c. and d. shows crayfish trap (denoted by “B - big” and “C - big” in our data set). Tuna was placed in the tea diffuser and used as bait to lure the crayfish into the traps.
Running head: MUSSEL AND CRAYFISH EFFECTS ON SNAIL-BORNE PARASITES
25
Figure 4. Picture of view bucket used to more clearly view the surface of the lake. It minimized the refraction from the water, enabling a clear view.

Running head: MUSSEL AND CRAYFISH EFFECTS ON SNAIL-BORNE PARASITES
26
Figure 5. Picture of quadrat used for zebra mussel and snail density sampling.

Running head: MUSSEL AND CRAYFISH EFFECTS ON SNAIL-BORNE PARASITES
27
Figure 6. Log mussels quadrats has three significant predictors: cobble (a.), gravel (b.), and mass per mussel (c.). Cobble and gravel both show positive correlations whereas mass per mussel shows a negative correlation with number of mussels in the quadrat sampler.

Running head: MUSSEL AND CRAYFISH EFFECTS ON SNAIL-BORNE PARASITES
28
Figure 7. Average alkalinity and log turbidity are significant predictors of log mussels on the samplers. a. shows a positive correlation between alkalinity and number of mussels on the sampler. b. shows a negative correlation between turbidity and number of mussels on the sampler.

Running head: MUSSEL AND CRAYFISH EFFECTS ON SNAIL-BORNE PARASITES
29
Figure 8. Log turbidity and cobble are significant predictors of log snails. a. shows a negative correlation between turbidity and snail density. b. shows a positive correlation between cobble and density of snails.

Running head: MUSSEL AND CRAYFISH EFFECTS ON SNAIL-BORNE PARASITES
30
Figure 9. For log crayfish, the only significant predictor is sand. The data shows a negative correlation between sand and crayfish numbers.

Running head: MUSSEL AND CRAYFISH EFFECTS ON SNAIL-BORNE PARASITES
31
Figure 10. Predictors of mass per mussel are given. The strongest correlations are with log crayfish (a.), log mussels on sampler (b.), and log mussel quadrat (c.). All have negative correlations with mussel mass.

Running head: MUSSEL AND CRAYFISH EFFECTS ON SNAIL-BORNE PARASITES
32
Figure 11. Log turbidity has four significant predictors: mean temperature (a.), cobble (b.), log mussel mass (c.), and log mussel sampler (d.). The graph shows that turbidity increases with increasing temperature. However, with every other predictor, turbidity has a negative correlation.

Running head: MUSSEL AND CRAYFISH EFFECTS ON SNAIL-BORNE PARASITES
33
Figure 12. Chlorophyll (Periphyton Growth in predictor/response chart) has three significant predictors: average alkalinity (a.), log mussel mass (b.), and log zooplankton (c.). All three are positively correlated with chlorophyll. Note that periphyton is measured by relative fluorescence units (RFU) of chlorophyll.

Running head: MUSSEL AND CRAYFISH EFFECTS ON SNAIL-BORNE PARASITES
34
Bibliography
Alexander Jr, J. E., Thorp, J. H., & Fell, R. D. (1994). Turbidity and temperature effects on
oxygen consumption in the zebra mussel (Dreissena polymorpha). Canadian Journal of
Fisheries and Aquatic Sciences, 51(1), 179-184.
Baker, S. M., Levinton, J. S., Kurdziel, J. P., & Shumway, S. E. (1998). Selective feeding and
biodeposition by zebra mussels and their relation to changes in phytoplankton
composition and seston load. Journal of Shellfish Research, 17(4): 1207-1213.
Blankespoor, H. D., & Reimink, R. L. (1991). The control of swimmer’s itch in Michigan: past,
present and future. Michigan Academician, 24(1), 7-23.
Bykova, O., Laursen, A., Bostan, V., Bautista, J., & McCarthy, L. (2006). Do zebra musssels
(Dreissena polymorpha) alter lake water chemistry in a way that favours Microcystis
growth? Science of the Total Environment: 371(1): 362-372. doi:
10.1016/j.scitotenv.2006.08.022
Czarnoleski, M., Müller, T., Kierat, J., Gryczkowski, L., & Chybowski, L. (2011). Anchor down
or hunker down: an experimental study on zebra mussels’ response to predation risk from
crayfish. Animal Behaviour, 82(3): 543-548. doi: 10.1016/j.anbehav.2011.06.008
De Meillon, B., Frank, G. H., & Allanson, B. R. (1958). Some aspects of snail ecology in South
Africa: a preliminary report. Bulletin of the World Health Organization, 18(5-6), 771.
Hincks, S. S., & Mackie, G. L. (1997). Effects of pH, calcium, alkalinity, hardness, and
chlorophyll on the survival, growth, and reproductive success of zebra mussel (Dreissena
polymorpha) in Ontario lakes. Canadian Journal of Fisheries and Aquatic
Sciences, 54(9), 2049-2057.
Hollandsworth, D., Lowe, R., & Badra, P. (2011). Indigenous Unionid Clam Refugia from Zebra

Running head: MUSSEL AND CRAYFISH EFFECTS ON SNAIL-BORNE PARASITES
35
Mussels in Michigan Inland Lakes. The American Midlan Naturalist, 166(2): 369-378.
doi: 10.1673/0003-0031-166.2.369
Horak, P., Mikes, L., Lichtenbergova, L., Skala, V., Soldanova, M., & Brant, SV. (2015). Avian
schistosomes and outbreaks of cercarial dermatitis. Clincal Microbiology Reviews,
28(1):165-190. doi: 10.1128/CMR.00043-14
Kirsch, K. M., & Dzialowski, A. R. (2012). Effects of invasive zebra mussels on phytoplankton,
turbidity, and dissolved nutrients in reservoirs. Hyrobiologia, 686: 169-179. doi:
10.1007/s10750-012-1008-1
Kreps, T. A., Baldridge, A. K., & Lodge, D. M. (2012). The impact of an invasive predator
(Orconectes rusticus) on freshwater snail communities: insights on habitat-specific
effects from a multilake long-term study. Canadian Journal of Fisheries and Aquatic
Sciences, 69(7), 1164-1173.
Lindim, C. (2015). Modeling the impact of Zebra mussels (Dreissena polymorpha) on
phytoplankton and nutrients in a lowland river. Ecological Modelling, 301: 17-26. doi:
10.1016/j.ecolmodel.2015.01.012
MacIsaac, H. J. (1996). Potential abiotic and biotic impacts of zebra mussels on the inland waters
of North America. American Zoologist, 36(3), 287-299.
Mackie, G. L., Gibbons, W. N., Muncaster, B. W., & Gray, I. M. (1989). The zebra mussel,
Dreissena polymorpha: a synthesis of European experiences and a preview for North
America. Ontario Ministry of Environment.
Naddafi, R., Eklöv, P., & Pettersson, K. (2007). Non- lethal predator effects on the feeding rate
and prey selection of the exotic zebra mussel Dreissena polymorpha. Oikos, 116(8),
1289-1298.

Running head: MUSSEL AND CRAYFISH EFFECTS ON SNAIL-BORNE PARASITES
36
Rohr, J. R., Schothoefer, A. M., Raffel, T. R., Carrick, H. J., Halstead, N., Hoverman, J. T.,
Johnson, C. M., Johnson, L. B., Lieske, C., Piwoni, M. D., Schoff, P. K., & Beasley, V.
R. (2008). Agrochemicals increase trematode infections in a declining amphibian species.
Nature, 455(30): 1235-1239. doi: 10.1038/nature07281
Whittier, T. R., Ringold, P. L., Herlihy, A. T., & Pierson, S. M. (2008). A calcium-based
invasion risk assessment for zebra and quagga mussels (Dreissena spp). Frontiers in
Ecology and the Environment, 6(4), 180-184.
Wojtal-Frankiewicz, A. & Frankiewicz, P. (2011). The impact of pelagic (Daphnia longispina)
and benthic (Dreissena polymorpha) filter feeders on chlorophyll and nutrient
concentration. Limnologica – Ecology and Management of Inland Waters, 41(3): 191-
200. doi: 10.1016/j.limno.2010.09.001
Zebra and Quagga Mussels Monitoring Protocol. (2014). Aquatic Invasive Species Monitoring
Manual - Citizen Lake Monitoring Network