examining potential changes in nutrition recommendations...
TRANSCRIPT
Examining Potential Changes in Nutrition
Recommendations and Implications for Specialty Crops in
California
Report Prepared for the California Institute for the Study of Specialty Crops
by
Brad Rickard, Agribusiness Department California Polytechnic State University, San Luis Obispo
and
Jana Gonsalves, Nutrition Department American River College, Sacramento
April 30, 2006
Funding for this project has been made available by the Governor’s Buy California Initiative, the California Department of Food and Agriculture (“CDFA”) and the United States Department of Agriculture (“USDA”). The content of this publication does not necessarily reflect the views or policies of CDFA or USDA, nor does any mention of trade names, commercial products and organizations imply endorsement of them by the CDFA or USDA.

i
Table of Contents
Page
List of Figures and Tables ii List of Appendices iii Introduction 1 Motivation 2 Research Objectives 7 Examining the Alternatives 8 The Traditional USDA Food Guide Pyramid 9 Harvard Model 10 Mayo Clinic Model 11 Mediterranean Model 12 Atkins Model 12 Dietary Approaches to Stop Hypertension (DASH) Model 13 The New USDA Food Guide: MyPyramid 14 Methodology 15 Step 1: Assessing the Nutrient Requirements under Alternative Diet Plans 17 Step 2: Calculating the Changes Needed for Compliance under Each Diet Plan 18 Step 3: Understanding the Economic Relationships between Nutrient Groups 19 Step 4: The Economic Simulation Model 22 Results 26 Sensitivity Analysis 29 Research Extensions 30 An Extension to Consider Additional Sub-Nutrient Groups 31 An Extension to Consider Phytochemicals 33 Industry and Policy Implications 35 References 62

ii
List of Figures and Tables
Page
Figure 1 An Illustration of How Shifts in Demand Affect Producer Revenue 37 Table 1 Comparison of Nutrient Content of Various Recommended Diet Patterns 38 Table 2 Current Consumption Patterns and Shares for Selected Nutrients 39 Table 3 Percent Change from Current Consumption Patterns to Meet Proposed Diet Recommendations 40 Table 4 Nutrient Content of the Top 50 Commodities in California 41 Table 5 Macronutrient Shares of the Top 50 Commodities in California 46 Table 6 Micronutrient Shares and Phytochemical Content of the Top 50 Commodities in California 51 Table 7 Percent Change in Nutrient Revenues under Alternative Diet Recommendations (Some Nutrient Substitution) 56 Table 8 Percent Change in Crop Revenues under Alternative Diet Recommendations (Some Nutrient Substitution) 57 Table 9 Percent Change in Nutrient Revenues under Alternative Diet Recommendations (Little Nutrient Substitution) 59 Table 10 Percent Change in Crop Revenues under Alternative Diet Recommendations (Little Nutrient Substitution) 60
iii
List of Appendices
Page
Appendix A The USDA Food Guide Pyramid (1992) 67 Appendix B Harvard Food Guide Pyramid 68 Appendix C Mayo Clinic Food Guide Pyramid 69 Appendix D Mediterranean Food Guide Pyramid 70 Appendix E Atkins Food Guide Pyramid 71 Appendix F The DASH Eating Plan 72 Appendix G USDA’s MyPyramid.gov (2005) 73 Appendix H Armington Matrix of Own- and Cross- Price Elasticities for Macronutrients 74 Appendix I Armington Matrix of Own- and Cross- Price Elasticities for Micronutrients 75
1
Introduction
Recent evidence reports that 65 percent of Americans are either overweight or obese, and this
percentage rate is nearly double what it was in 1995 (Hedley et al. 2004). One effort to combat
this epidemic has focused on the health benefits of including a greater share of foods derived
from specialty crops—including fruits, vegetables, and in some cases tree nuts—in U.S. diets.
Studies have shown that a higher consumption of selected specialty crops will reduce obesity and
related ailments such as cancer, stroke, and heart disease (Block, Patterson, and Subar 1992).
Considerable attention has been given to the economic impact that obesity has to consumers and
to the government in the United States, and elsewhere. The annual cost of poor diets in the
United States, with reference to health care costs, absenteeism, and early death has been
estimated to be as high as $10.6 billion per year (Frazao 1999).
Increased consumption of specialty crops will decrease the health costs associated with
obesity, but it will also lead to benefits for producers of those healthy food products. Most diet
recommendations advocate increased consumption of selected specialty crops and California’s
specialty crop growers stand to gain significantly if consumers follow the recommendations.
Based on the current consumption patterns in the United States, we highlight the economic
effects that compliance with seven different dietary plans would have for selected specialty crop
markets in California agriculture.
Every five years, beginning in 1980, the Department of Health and Human Services and
the USDA publish Nutrition and Your Health: Dietary Guidelines for Americans (DGA). Each
edition of the DGA reviews the existing guidelines and proposes changes in light of the recent
research in nutrition. Information from the DGA serves as the basis for the various food and

2
nutrition programs administered by the USDA, including the new USDA Food Guide or
MyPyramid that was released in 2005.
The DGA is also used by nutritionists and other health experts in developing non-USDA
food guides and recommended dietary plans. Quite often the recommendations from the non-
USDA food guides differ significantly with respect to the consumption of foods such as olive oil,
dairy products, fruits, vegetables, and even wine. Dietary plans offered as alternatives to the
USDA regimes include the Harvard Model, the Mayo Clinic Model, the Traditional
Mediterranean Diet Model, Atkins Diet, and the DASH diet, among others. Although the USDA
food guides have been the most visible, others such as the Harvard Model and the Mayo Clinic
Model are achieving greater public recognition. Furthermore, these alternative models are
gaining credibility by the individuals that will be responsible for shaping the information that is
used to develop the dietary guidelines in the United States, and elsewhere.
Motivation
A survey of the agricultural and food policy literature that examines topics related to nutrition
policy shows three major bodies of work. The first examines the degree to which consumers
respond to nutritional information and recommendations. Work done by Johnson (1999), Nayga
(1999), Kim, Nayga, and Capps (2001), Nayga (2001), Drichoutis, Lazaridis, and Nayga (2004),
He, Fletcher, and Rimal (2004) among others, exemplifies this branch of research. Much of this
work shows that U.S. consumers do respond, although sometimes only marginally, to food
recommendations. For example, Nayga (2001) showed that, in a given population, nutritional
label use has reduced the intake of total fat by 7 percent and increased the intake of dietary fiber
by 8 grams.

3
The second area has examined the relationship between observed phenomena, including
government policies, and obesity in the United States and elsewhere. Alston, Sumner, and Vosti
(2005) have examined the relationship between government subsidies and obesity rates in the
United States, and find that U.S. subsidies for corn and soybeans have not had a significant
impact on obesity rates. Loureiro and Nayga (2005) examined a dataset that spanned across
several countries in an effort to find relationships between variables—including female labor
force participation, urbanization, agricultural productivity, commuting miles (as a proxy for the
level of physical activity), emission output, agricultural subsidies, physical activity, age,
education, caloric intake, cigarette consumption, and income—and the growth of obese
populations in selected countries. Their findings suggest that female labor force participation,
caloric intake, and higher levels of income were the main drivers of the increased rate of obesity.
This branch of research often provides public policy options that could be implemented to help
curb the obesity epidemic in the United States, and elsewhere (e.g., Haddad 2003).
The third broad area of research related to nutrition policy has examined implications for
producers, and this is the focus of our research. Given some level of compliance with food and
nutritional recommendations, researchers have asked a series of “what if”’ questions related to
the implications for production agriculture in the United States if consumers followed food and
nutrition recommendations. We will modify methodologies used in previous studies, and apply
them to answer questions that are most pertinent to growers of specialty crops in California.
Rather than focus on the implications for traditional and aggregate food groups, we analyze the
implications for specific specialty crops by studying nutrient recommendations and nutrient
composition.

4
O’Brien (1995) examined the relationship between greater compliance to the USDA
Food Guide Pyramid (FGP) and production agriculture. He showed the per capita consumption
rates for the major food groups, and selected subgroups, in the United States between 1960 and
1990. For these food groups, O’Brien characterized the effects that a shift towards compliance
with the FGP would have. His findings focused on the direction and magnitude of changes
rather than percent changes. In addition, O’Brien discussed the adjustments that would be
required in the mix of food intake, namely the adjustments required away from fats, oils, and
sweeteners and towards fruits and vegetables.
Young and Kantor (1999) followed O’Brien’s idea, but developed a more rigorous
economic approach to examine the question of compliance with the FGP and the implications for
U.S. production agriculture. They provide the percent changes needed in production of the
traditional food groups to comply with the FGP, and the corresponding changes required in
acreages. For example, Young and Kantor’s results show that the food group titled “Meat,
poultry, fish, dry beans, eggs, and nuts” would need to increase by 5 percent, and the food group
titled “Other Fruits” would need to increase by 114 percent. Furthermore, using the traditional
food groups to aggregate, Young and Kantor show the direction that price, quantity supplied,
quantity demanded, and quantity traded would take under compliance with the FGP.
Young and Kantor (1999) looked closely at the impacts within the meat sector, and
examined how compliance with the FGP would affect beef, pork, poultry, and fish. This
consideration has motivated us to consider other intra-food group implications. For example,
how would greater compliance with the FGP (or other food recommendations) affect different
types of fruits, vegetables, and tree nuts. As one example of this, the California Walnut

5
Commission has recently tried to understand what new nutritional recommendations will mean to
the walnut industry (California Walnut Commission 2004).
Most recently, Jeter, Chalfant, and Sumner (2001, 2004) examined the impacts of
compliance with fruit and vegetable recommendations outside of the FGP, namely a cancer
prevention diet developed by the Cancer Prevention and Nutritional Services unit of the
California Department of Health Services. The cancer prevention diet requires consumption of
seven specific servings of fruit and vegetables per day. The authors also examine the
implications of compliance with diets that included five and seven non-specific servings of fruits
and vegetables per day. This research focused on the potential benefits for producers of fruits
and vegetables in California. In examining the percent increases needed in consumption for
compliance with the various diets, the authors decomposed the traditional food groups into
subgroups. For example, vegetables were divided into starchy vegetables, salad, other
vegetables, tomatoes, dark green and orange vegetables, cruciferous vegetables, and potatoes.
Based on the changes in consumption required, an economic model calculated the percent
changes in grower price, output, and revenue for thirty-seven fruit and vegetable commodities.
Their findings indicate that full compliance with the unrestricted five-a-day fruit and vegetable
diet would increase total net producer revenue to California’s fruit and vegetable growers by
$316 million. Full compliance with the unrestricted seven-a-day fruit and vegetable diet would
increase total net revenue by $788 million, and full compliance with the seven-a-day fruit and
vegetable cancer prevention diet would boost total net revenues to California’s fruit and
vegetable growers by $836 million. Nation wide, full compliance with the seven-a-day fruit and
vegetable cancer prevention diet would boost total U.S. net farm revenues by $1.44 billion.

6
The studies reviewed thus far use traditional food groups, or subgroups of those, as the
‘markets’ in their analyses. As a result, findings are constant across a food group (or subgroup)
and it is difficult to interpret crop specific implications. Therefore, to better understand the
effects of food recommendations for specific crops, we have decided to interpret various food
recommendations as nutrient recommendations, and assess the impact of greater compliance with
nutrient recommendations. To do so, we have developed a model that examines the effects of
compliance with various nutrient recommendations that will be applied to the 50 highest-value
agricultural products in California, many of which are considered specialty crops.
Our analysis extracts nutrient recommendations from diet recommendations. Diet
recommendations are broken down into 15 nutrient groups, specifically 9 macronutrients and 6
micronutrients, to help differentiate the nutrient recommendations found in alternative diet
regimes. Certainly including more nutrient groups would strengthen the precision of our
analysis, however, at some point additional nutrient groups would no longer provide valuable
insight and would only unnecessarily complicate our model. We initially included 6 nutrient
groups, slowly climbed up to 19 nutrient groups, and in the end decided to include 15 nutrient
groups. We felt that the 15 groups would i) explain the major differences between the food
recommendation models, and ii) provide a modeling framework that remains manageable. Of
course, we may consider adding nutrient groups—including sub-nutrient groups for
carbohydrates and key phytochemicals—in an extension to this work. The following list1
includes the 9 macronutrients and 6 micronutrients used in our analysis.
List of Macronutrients 1) Protein 2) Carbohydrates (CHO)
1 Abbreviations used in our study are placed in the parenthesis following the nutrient.

7
3) Fiber 4) Saturated Fats (SFA) 5) Monounsaturated Fats (MUFA) 6) Omega-3 Polyunsaturated Fats (Omega 3s) 7) Omega-6 Polyunsaturated Fats (Omega 6s) 8) Other Polyunsaturated Fats (Other PUFAs) 9) Cholesterol List of Micronutrients 10) Vitamin A 11) Vitamin C 12) Vitamin E 13) Calcium 14) Iron 15) Sodium
Research Objectives
To examine the economic effects of compliance with seven dietary regimes for specialty crop
growers in California, we have identified 8 research objectives.
i) Identify the current per capita consumption rates for 15 selected nutrient groups in the United States.
ii) In words, summarize the key similarities and differences among the seven dietary
plans that will be considered in the analysis. iii) Calculate the average per capita consumption rates for the 15 nutrient groups under
the seven alternative food guides, and compare to the current rates from Objective i) to assess the changes required for compliance.
iv) Compute the share of nutrients in each of the 50 highest-value agricultural products in
California.
v) Understand the economic relationships between production and consumption of the 15 nutrient groups.
vi) Develop a simulation model to examine how changes in consumption of the 15
nutrients (under compliance with the seven dietary regimes) would impact the gross revenues of the nutrients.

8
vii) Combine the changes required in nutrient consumption from Objective iii), the nutrient shares in Objective iv), and the simulated changes in nutrient gross revenues from Objective vi) to assess changes in gross revenues for specific agricultural products.
viii) Summarize the simulation results for an audience that may include economists,
nutritionists, industry participants, and policy makers. The first three objectives enable us to understand what type of changes in consumption would be
required for compliance with each of the seven dietary regimes. Objective iv) is a two-step
process. First the total weight of each agricultural product is broken down across the 15
nutrients. Second the nutrient weights are converted into nutrient shares. Objectives v), vi) and
vii) summarize the economic modeling component of our analysis whereby we simulate how
compliance would affect gross revenues across the 50 highest-value agricultural products in
California. Finally, Objective viii) is included to remind us who our audience is, and to present
our methodology and results in a way that is transparent and can be widely understood.
Examining the Alternatives
Recommendations for food intake have been made since the late 1800s. Upon establishing the
USDA in 1862, the government mandated the dissemination of research-based information
regarding nutrition to the public. The first set of food tables and dietary standards were
published in 1894 by the first director of the Office of Experiment Stations in the USDA, namely
W.O. Atwater. These tables presented food composition and dietary standards for protein, fat,
carbohydrate, ash (minerals) and energy of foods commonly available at the time. As early as
1902, Atwater made the claim that unless Americans exercised care in consuming a balanced
diet, “the evils” of over-consumption (i.e., fats) would eventually appear in the form of chronic
disease. Nutrition professionals are still engaged in discussions of chronic disease prevention

9
and treatment. Atwater’s research formed the basis for ongoing dietary guidance themes of
variety, balance, and moderation (Welsh et al. 1993).
Along with the dissemination of nutritional information, the USDA is also responsible for
overseeing and promoting U.S. agriculture. This is oftentimes in conflict with the promotion of
adequate and accurate nutritional information, and research continues to examine this
relationship (see Alston, Sumner, and Vosti 2005). With that conflict in mind, many other
professionals in the area of nutrition research have taken it upon themselves to review the
research related to food intake and disease and develop their own dietary patterns or food guides.
Several nutrition recommendations or diet regimes have been designed that mimic the pyramid
shape of the USDA FGP, yet are less similar to the USDA FGP in terms of content. Next we
will provide a description of the seven dietary regimes that are considered in our analysis.
The Traditional USDA Food Guide Pyramid
Creation of the traditional USDA FGP began in 1988 when the USDA contracted an independent
marketing firm to develop an educational tool that would be used to promote the Dietary
Guideline for Americans. The pyramid design was chosen to illustrate variety, proportionality,
and moderation. The FGP was officially released in 1992 and did not undergo any significant
changes until 2005 (Davies et al. 2001). Appendix A shows the illustration that is commonly
associated with the USDA FGP.
The traditional FGP illustrates variety by including seven food groups, namely: i) breads,
cereals, rice, and pasta; ii) vegetables; iii) fruit; iv) milk, yogurt, and cheese; v) meat, poultry,
fish, dry beans, and nuts; and vi) fats, oils, and sweets. The illustration of proportionality comes
from the shape of the pyramid. Breads, cereals, and grains form the base of the pyramid

10
followed by vegetables and fruits suggesting that the bulk of the diet should come primarily from
plant-based foods. Moderation is suggested by the range of servings from each food group. The
actual number of servings is dependent upon caloric intake. An obvious omission in this FGP,
compared to other diet regimes, is physical activity.
Harvard Model
Faculty members in the Harvard School of Public Health, led by Walter C. Willett and Meir J.
Stampfer, created the Healthy Eating Pyramid as an evidence-based guide for food intake.
Willett and Stampfer have been investigators in very large scale epidemiological studies,
spanning over 20 years, examining the dietary habits of men and women and the occurrence of
chronic disease (e.g., see Stampfer 1993). The results from these studies have shown a) positive
associations between animal fat and red meat consumption and risk of colon cancer, and b)
positive correlation between hydrogenated fat consumption and coronary heart disease. Results
from these studies also showed that certain fats could decrease risk of coronary heart disease,
namely monounsaturated and polyunsaturated fats (Hu et al. 1997; Fung et al. 2001; Hu et al.
2002). Likewise, evidence from these studies shows an inverse relationship between vitamin E
consumption and risk of coronary heart disease (Rimm et al. 1993; Stampfer et al. 1993).
The results of these and many other diet and health related studies have formed the basis
by which Willett, Stampfer, and other colleagues created the Healthy Eating Pyramid, a more
evidence-based alternative to the USDA FGP. As shown in Appendix B, the Healthy Eating
Pyramid resembles the USDA FGP but the content is much different. Distinction has been made
between whole-grain carbohydrates and refined grains and sugars, and between red meat and
poultry. Nuts and legumes, sources of plant-based proteins, and plant oils have been put in

11
categories of their own. These changes were due in part to results from several epidemiological
studies showing the effects of specific foods on chronic disease risk. Although not diet in nature,
another major difference is the inclusion of exercise as a component of the Healthy Eating
Pyramid. Many studies show exercise is beneficial not only from a weight loss or weight
maintenance standpoint, but also from the perspective of chronic disease risk. Population studies
have indicated an inverse relationship between exercise and coronary artery disease, myocardial
infarction, and diabetes in men and women (Manson et al. 1992; O'Connor et al. 1995; Manson
et al. 1999; Tanasescu et al. 2002).
Mayo Clinic Model
The Mayo Clinic Healthy Weight Pyramid (Appendix C) was developed by physicians and
dieticians at the Mayo Clinic. It is the first food intake guide to focus on weight loss or weight
maintenance. Much of the research that was used to develop the model was conducted by
obesity treatment experts at the Mayo Clinic in Rochester Minnesota, Pennsylvania State
University, and the University of Alabama at Birmingham. Donald D. Hensrud, a primary force
behind the Mayo Clinic Healthy Weight Pyramid, has substantial research experience in the area
of obesity treatment, prevention, and the co-morbidities associated with excessive weight. In
2000, Hensrud edited a book titled "Mayo Clinic on Healthy Weight: Answers to Help You
Achieve and Maintain the Weight That's Right for You" which uses the Mayo Clinic Healthy
Weight Pyramid as a guide for diet planning.
At the base of the pyramid are fruits and vegetables, followed by whole grains and lean
protein sources. Limitations are not made with respect to red meat consumption, however, it is
recommended that protein comes from plant sources, as well as fish, poultry, and dairy products.

12
Unlimited consumption of fruits and vegetables are encouraged as are generous amounts of
whole grains. This eating plan focuses on low-energy-density, high-fiber foods that provide
satiety and adequate nutrition.
Mediterranean Model
The Mediterranean Food Guide Pyramid (Appendix D)—developed through collaboration
between Harvard School of Public Health, a United Nations World Health Organization and
Food and Agriculture Organization (WHO/FAO) Collaborating Center, and Oldways
Preservation and Exchange Trust—represents the traditional dietary habits of Crete, Greece, and
southern Italy in 1960. This design is based on the observed relationship between a very low rate
of chronic disease and extended life expectancies for these populations at the time, in spite of
limited medical services. More recent epidemiological studies have also revealed that chronic
disease rates are still low in these traditional populations. Likewise, evidence from clinical
studies on various components of the diet, such as olive oil or red wine, is consistent with the
population data showing a lower incidence of heart disease and cancer.
The Mediterranean diet endorses an abundant consumption of fruits, vegetables, and
whole grains. It also encourages consumption of fresh or minimally processed foods, olive oil,
fish, and wine. As with several other diet regimes, physical activity is shown at the base of the
pyramid.
Atkins Model
Robert C. Atkins wrote his first diet book in 1973 advocating a low-carbohydrate, high-protein
diet for weight loss. Since then, dieting recommendations have changed many times and

13
recently many consumers have returned to Atkins’ dietary recommendations. In 1994 Atkins
published "Dr. Atkins' New Diet Revolution" which has caused an increase in the popularity of
low-carbohydrate, high-protein diets. A food intake guide was created using a visual that is
similar in appearance to, but nearly a reversal of the content shown in, the USDA FGP. A
pictorial representation of the Atkins Diet Recommendation is shown in Appendix E.
The emphasis of the initial period of the diet is to deplete the body of glycogen
(carbohydrate stores) and to initiate a state of ketosis (the body is breaking down body fat and
protein). The primary way to do that is to limit carbohydrate intake and to increase protein and
fat intake. This is evident in the visual food guide with protein sources at the base of the
pyramid and carbohydrate sources (namely grains) at the peak. The Atkins regime also lists
limitations for specific fruits and vegetables which are indicated in the visual.
Dietary Approaches to Stop Hypertension (DASH) Model
Dietary Approaches to Stop Hypertension (DASH) began as a multi-center clinical study funded
by the National Heart, Lung, and Blood Institute (NHLBI) within the National Institutes of
Health. The original study examined the effects of various components of the diet on blood
pressure. The results of the study showed that elevated blood pressure levels could be lowered
by consuming a diet low in total fat (notably saturated fat) and cholesterol, and rich in fruits,
vegetables, and low-fat dairy products. This diet is naturally lower in sodium, higher in
magnesium, calcium, and potassium, all of which have positive effects on blood pressure
(NHLBI, 2003). Appendix F outlines the guidelines required under the DASH diet plan.
Several studies have examined the effectiveness of the DASH eating plan in improving
health and reducing risk for chronic disease. The original intent was to develop an eating plan to
14
reduce blood pressure. While significant reductions in blood pressure have been seen in subjects
following the DASH diet (Craddick et al. 2003), other health benefits have also been reported.
Improvements in blood cholesterol and plasma homocysteine have been shown in subjects on the
DASH diet (Craddick, et al. 2003; Harsha et al. 2004). High blood cholesterol and high plasma
homocysteine are risk factors for cardiovascular disease. Doyle and Cashman (2004) reported
that the DASH eating plan may reduce markers of bone turnover which could lead to
improvement in bone density. In the long run, the DASH eating plan may prove to be beneficial
in reducing the risk of many chronic diseases, in addition to hypertension.
The New USDA Food Guide: MyPyramid
On April 19, 2005, the new USDA Food Guide Pyramid, MyPyramid, was unveiled.
MyPyramid places more emphasis on weight management, physical activity, optimal bone
health, and balanced nutrition than did the USDA FGP. MyPyramid (Appendix G) is a visual
representation of the DGA from 2005. MyPyramid includes an interactive component which
allows individuals to customize their plan. The visual is less detailed than those in the past.
Instead of the food groups displayed vertically in the pyramid, MyPyramid organizes the groups
horizontally. Each section for each food group is of similar size, so proportionality is not
obvious. The one exception is the section for oils. This is a much smaller section, suggesting
one should limit intake of oils. The graphics along with the text emphasize healthy food choices,
daily physical activity, and individuality. Subtle messages imbedded within the graphic are
moderation, personalization, variety, and gradual improvement.
To get the full benefit of the information contained within MyPyramid, one must access
the online version. Accessing MyPyramid Plan allows the individual to get diet specific

15
information for their gender, age, and physical activity level, expressed in servings of food
groups per day or week. Inside the Pyramid allows users to click on each food group and get
specific information including foods included in the group and nutrients found in foods within
each group. There is information about the Dietary Guidelines for Americans, a link for Tips
and Resources, information for professionals and children, and the Pyramid Tracker. Pyramid
Tracker is an online dietary and physical activity assessment tool that is designed for individuals
who are interested in keeping track of their physical activity and food and nutrient intake. This
online program will save the information for up to one year, allowing an individual to see
progress over time.
Methodology
Based on the current consumption patterns in the United States, we highlight the economic
effects that compliance with each of seven dietary plans (USDA FGP, Harvard, Mayo Clinic,
Mediterranean, Atkins, DASH, and My Pyramid) would have for the 50 highest-value markets in
California agriculture, many of which are specialty crops.
Our economic model is designed to ask various ‘what-if’ questions related to the
consumption of various nutrient groups, which are used to simulate the changes in the
consumption of specialty crops. This is done by first simulating changes in consumer demand
for nutrients to evaluate the effects on price, output, and revenues for each nutrient. Second, the
simulated changes in revenues for nutrients are used to understand changes in revenues for
specific crops using nutrient composition shares.
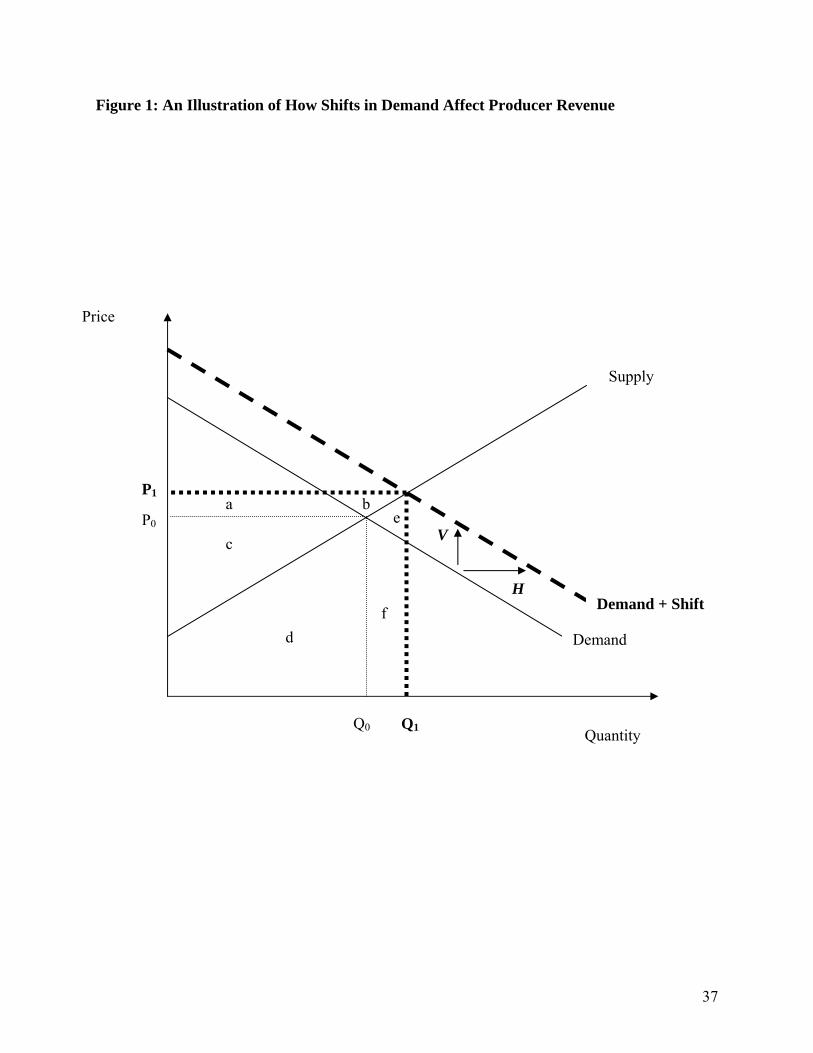
Changes in consumer demand can be assessed as a horizontal shift (H) or a vertical shift
(V) of demand, and both are illustrated in Figure 1. Figure 1 shows the supply and demand in a
16
market for a nutrient. The initial point of equilibrium is found at their intersection, namely at P0
and Q0. The initial gross revenue can be defined as the area under the market price and to the
left of the market quantity, i.e., P0*Q0. Initially, producers earn gross revenues of area (c+d) in
Figure 1. A shift in demand, in this case whether it is a vertical or horizontal shift, increases the
gross revenue to the area below the new market price of P1 and to the left of the new market
quantity of Q1. As a result, the new revenue amount is defined as area (a+b+c+d+e+f) in Figure
1, and the increase in profit is area (a+b+e+f). The objective of this research is to quantify the
changes in prices, output levels, and revenues for the 15 nutrient markets from simulated changes
in demand due to compliance with dietary recommendations. From that, we will use the
simulated changes in nutrient revenues to calculate changes in gross revenues for the 50 highest-
value agricultural products in California.
As illustrated in Figure 1, we can consider either a vertical shift (V) or a horizontal shift
(H) of demand. Both shifts result in a new equilibrium point and although it is illustrated as the
same point in Figure 1, the magnitude of these shifts is not necessarily the same. A vertical shift
of demand (one in the price direction) indicates that, holding the initial quantity consumed
constant, the consumers’ willingness to pay has changed. Conversely, a horizontal shift of
demand, or one that moves in the quantity direction, indicates that consumers will change the
quantity consumed holding the price constant. Our research is examining potential changes in
the demand for nutrients, and since these are changes in the quantity demanded given a price,
they will be considered horizontal shifts in demand.
Our analysis is performed using a four-stage procedure. Step 1 examines the nutrient
specifications of seven food recommendation regimes, namely the USDA FGP, Harvard, Mayo,
Mediterranean, Atkins, DASH, and MyPyramid. Step 2 calculates the percent changes in

17
nutrient groups that would be needed to fully comply with each of the seven food guide
recommendations. We recognize that full compliance with any of the selected food
recommendations is not realistic, however, we do this to understand the relative implications
across alternative diet plans. Step 3 determines the economic relationships between nutrient
groups, namely the own- and cross-price elasticities of demand for the 15 selected nutrient
groups. Step 3 is done to formally characterize how an increase (or decrease) in one nutrient
group would affect the consumption patterns of other nutrient groups. Lastly, Step 4 will apply
the simulation model that we have developed to examine several ‘what if’ scenarios. Scenarios
will include, but are not limited to, examinations of the effects of moving from current nutrient
intake to full compliance with each of the seven alternative food recommendation models
(USDA FGP, Harvard, Mayo Clinic, Mediterranean, Atkins, DASH, and MyPyramid).
Step 1: Assessing the Nutrient Requirements under Alternative Diet Plans
In order to compare the nutrient composition of the seven diet regimes, actual menu plans were
needed. Our nutrient breakdown for each of the diet regimes is based on average nutrient intakes
across five days that follow a 2000-calorie diet. For the Harvard, Atkins, and DASH diet
patterns, established menus were available and used to analyze their nutrient composition.
Willett's book Eat, Drink, and Be Healthy: The Harvard Medical School Guide to Healthy
Eating contains menu plans that follow the Healthy Eating Pyramid; Atkins' book Dr. Atkins'
New Diet Revolution suggests sample menus; and the DASH eating plan is provided by the
National Institutes of Health (NHLBI, 2003).
To assess the nutritional value of the remaining diet regimes (i.e., USDA FGP, Mayo
Clinic, Mediterranean, and MyPyramid) a five-day menu was created following the suggested
18
food servings from the diet regimes. Using Food Processor SQL 9.3.0 (ESHA Research, Salem,
Oregon), five-day menus for each of the four diet regimes were analyzed based on a standard
2000-calorie diet. In order to standardize the analysis across food guides, only the USDA
database was used to examine the nutrient contents of the various foods and diets.
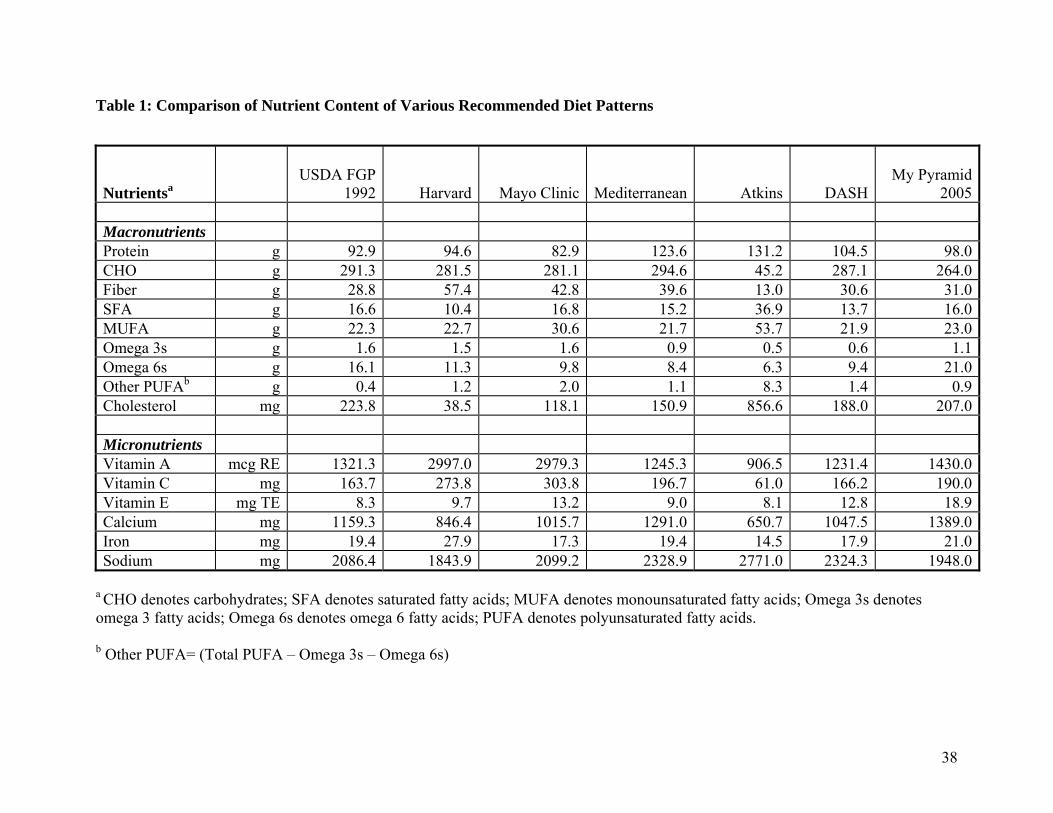
The results of these analyses and calculations are presented in Table 1. Table 1 shows
the quantities of nutrients required to meet the requirements of each the seven diet regimes. For
example, compliance with the Mayo Clinic would require 82.9 grams of protein whereas the
MyPyramid regimes requires 98.0 grams of protein.
Step 2: Calculating the Changes Needed for Compliance under Each Diet Plan
Using the information presented in Table 1, each diet plan was compared to the current nutrient
intake of Americans based on Continuing Survey of Food Intake by Individuals (CSFII) 1996-
1998, a nationwide survey conducted by the Agricultural Research Service of the USDA. This is
the most recently completed dataset that describes current nutrient intake across our 15 selected
nutrient groups. The per-capita consumption rates for the 15 selected nutrient groups in the
United States is provided in the first column of Table 2. Column two in Table 2 shows the
shares of macronutrients and micronutrients in the per-capita consumption rates. For example,
the per-capita consumption rate of protein in the United States is 75.0 grams, and this comprises
17.4 percent of the total macronutrient intake.
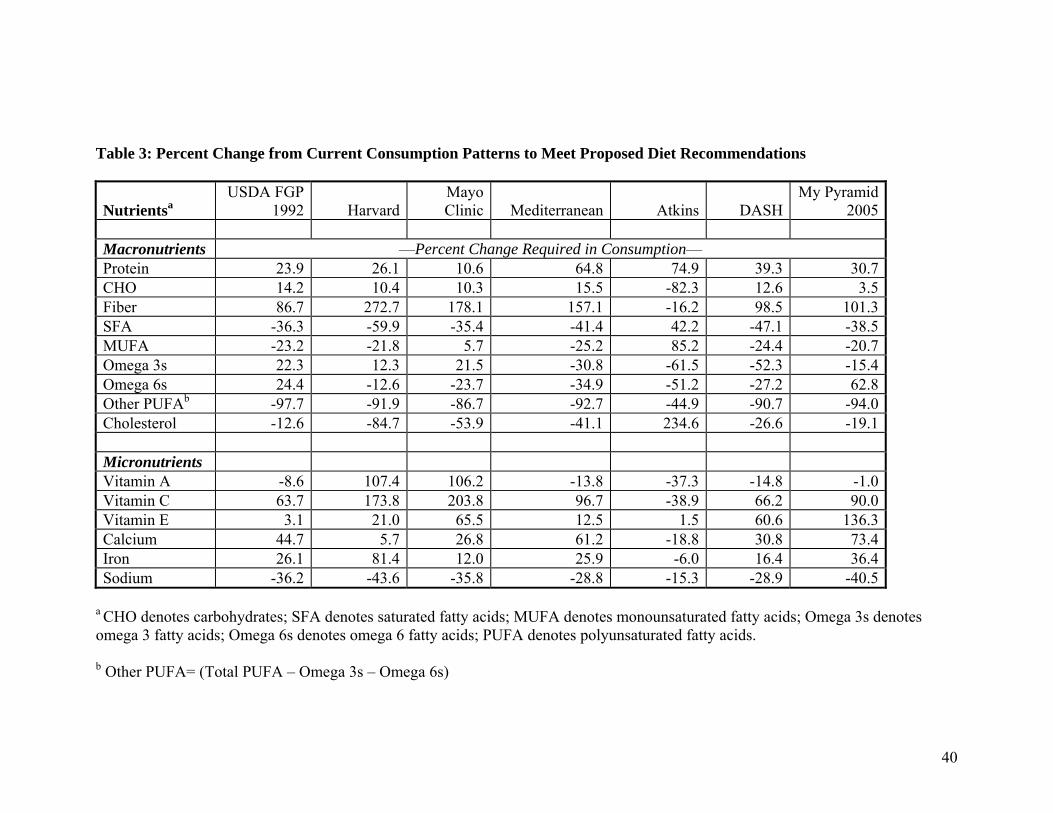
Calculations were made to determine what changes were necessary in order to comply
with each food recommendation plan. The changes in nutrient consumption needed to comply
with the seven plans are presented as percentage increases or decreases from the current nutrient
intakes shown in Table 3. For example, the percent change required to meet the Mayo Clinic
19
recommendation for protein would be 10.6 percent, and the percent change required to meet the
MyPyramid recommendation would be 30.7 percent.
Step 3: Understanding the Economic Relationships Between Nutrient Groups
Many of the nutrient groups that we have included in our analysis will substitute, in some
capacity, for other nutrient groups. Shifts in market conditions for one nutrient group will
ultimately affect conditions in the markets for other nutrient groups. The purpose of Step 3 is to
determine the degree to which nutrient groups substitute for each other. More formally, this is
known as defining the economic relationships between goods or calculating the price elasticities
of supply and demand.
The price elasticities of supply characterize how a change in the price of a product
(nutrient) will affect the production of the same product (nutrient). The price elasticities of
supply for all 15 nutrient groups have been set at 1.0 in our initial analysis for simplicity.
Own-price elasticities of demand characterize how a change in the price of a product
(nutrient) will affect the consumption of the same product (nutrient). Cross-price elasticities
characterize how a change in the price of a product (nutrient) will affect the consumption of
related products (nutrients). Demand elasticities can be estimated, calculated, or borrowed from
previous studies. Two pieces of recent research, namely Beatty and LaFrance (2005) and
Richards and Patterson (2004), offer some insight for directly estimating nutrient demand
elasticities, however, no previous estimates are available in the literature, and estimation requires
a significant amount of data and expertise.
We have decided that it would be best to calculate a matrix of the own- and cross-price
elasticities of demand for our 15 nutrient groups following an Armington-type specification (see
20
Armington, 1969). Piggott (1992) and Sumner, Alston, and Gray (1994) present an outline of
the limitations of the Armington specification, as well as an overview of Armington-type models
that have been used in earlier applications.
The calculation used to parameterize the Armington own-price elasticities of demand is
shown below in Equation (1a) and the calculation used to parameterize the Armington cross-
price elasticities of demand is shown in Equation (1b).
(1a) ηnn = ζnη – (1 - ζ n)σ where n = (1,…, 15)
(1b) ηno = ζ o (η + σ) where n = (1,…, 15) o = (1,…, 15), and n≠o
The own-price elasticity of demand for nutrient n is represented by ηnn, and ηno
represents the cross-price elasticity of demand for nutrient n with respect to the price of another
nutrient, o. The share of consumption for nutrient n is denoted as ζn, σ is the elasticity of
substitution between the nutrients, and η is the overall elasticity of demand for nutrients. The
elasticity of substitution (σ) is equal to zero when no substitution across products is possible, and
increases as substitution possibilities increase. An estimate of the elasticity of substitution
between the nutrient groups (η) is not available, however, one could be based on parameters
used in other studies, for example George and King (1971), Huang (1985), and Sumner, Alston,
and Gray (1994).
Information on consumption shares of nutrients, defined as ζn in the equations above, is
typically built up using information from industry sources, and where applicable, from national
consumption data. This method would be ideal in considering the caloric nutrient groups, but
becomes less ideal once non-caloric nutrient groups are considered. For example, the nutrient
share for cholesterol, vitamin A, vitamin C, vitamin E, sodium, iron, and calcium would be
significantly less than 1 percent, and the results would be driven solely by the nutrient shares for

21
fats, carbohydrates, and protein. Therefore, we consider the macronutrients to be a separate
group from the micronutrients and calculate the elasticity parameters for each group using
Equation (2) for the macronutrients and Equation (3) for the micronutrients. In Equation (2) the
subscripts a and b are used to denote different macronutrients. In Equation (3) the subscripts i
and j are used to denote different micronutrients. Now ζa (or ζb) is used to denote the
consumption share of the specific macronutrient a (or b) from the 9 selected macronutrients.
Likewise, ζi (or ζj) is used to denote the consumption share of the specific micronutrient i (or j)
from the 6 selected micronutrients.
(2a) ηaa = ζaη – (1 – ζ a)σ where a = (1,…, 9)
(2b) ηab = ζ b (η +σ) where a = (1,…, 9), b = (1,…, 9), and a≠b
(3a) ηii = ζiη – (1 – ζ i)σ where i = (10,…, 15)
(3b) ηij = ζ j (η +σ) where i = (10,…, 15), j = (10,…, 15), and i≠j
Appendices H provides the matrix of own- and cross- price elasticities for the 9
macronutrients. The value in the top left-hand corner in Appendix H, –0.91, describes the own-
price elasticity of demand for protein. This indicates that a one percent increase in the price of
protein will decrease the consumption of protein by 0.91 percent. The value directly below the
own-price elasticity of demand for protein, namely 0.29, describes the cross-price elasticity of
demand for protein with respect to the price of the carbohydrate group. This indicates that a one
percent increase in the price of carbohydrates will increase the consumption of protein by 0.29
percent. Appendix I provides the matrix of own- and cross- price elasticities for the 6
micronutrients used in our analysis.

22
Step 4: The Economic Simulation Model
The effects of compliance with the seven dietary recommendation plans will be understood by
simulating changes in demand, and calculating changes in revenue, for selected nutrient groups.
Simulated changes in revenue for selected nutrient groups will subsequently be used to calculate
changes in revenue for the 50 highest-value agricultural products in California. To assess these
effects we will follow a class of models that are often referred to as equilibrium displacement
models. Agricultural economists have adopted this type of model to study a wide range of
research topics, most notably in studies that examine the potential effects of relatively small
changes in supply and demand conditions. These models can be readily exposited and
understood, and therefore ideal for disseminating the results to both agricultural economists and
an audience with a general interest in nutrition policy.
A set of basic equations is used to describe the supply and demand for a given market,
here a market for a nutrient group. Totally differentiating these equations and converting them to
elasticity form yields a system of linear (logarithmic differential) approximations, or a linear
elasticity model. The equations are solved for proportional changes in quantity and prices as
functions of various elasticity and share parameters.
The basic structure of the model is given in Equations (4a), (4b), and (4c). The term Q is
used to denote a quantity and P denotes a price. The subscript n is used to denote a nutrient
group, where n = (1, …,15). Equation (4a) represents the supply of nutrient group n; it depends
only on its price and exogenous supply shifters (Bn). Equation (4b) represents demand for a
subset of nutrients, namely the nine macronutrients, and demand for a macronutrient, denoted a
where a = (1, …,9), is a function of all macronutrient prices, and exogenous demand shifters
(Aa). Equation (4c) represents demand for the six remaining nutrients, namely the micronutrient

23
groups, demand for micronutrients, denoted i where i = (10, …,15) is a function of all
micronutrient prices, and exogenous demand shifters (Ai).
(4a) Qn = fn (Pn; Bn) Supply, n = (1,…, 15)
(4b) Qa = ga (Pa, Pb; Aa) Demand, a = (1,…, 9), b = (1,…, 9), and a≠b
(4c) Qi = gi (Pi, Pj; Ai) Demand, i = (10,…, 15), j = (10,…, 15), and i≠j
Totally differentiating Equations (4a), (4b), and (4c) and converting to elasticity form
yields the linear elasticity model in Equations (5a), (5b), and (5c). These equations do not
involve any explicit or implicit assumptions about the functional forms used, and it is not
necessarily assumed that the elasticities are constant. However, it is assumed that the supply-
and-demand functions are approximately linear at the initial point of market equilibrium (Alston,
Norton, and Pardey 1995). Equilibrium adjustments can be simulated by exogenously specifying
supply and demand changes. Values for elasticity and share parameters are held constant as
exogenous changes to supply and demand are applied. Therefore, the linear elasticity model is
best suited for local adjustments around the initial long-run equilibrium.
In the simulation model that follows, a vertical shift of demand would be incorporated as
E(Q) = η[E(P) – α] in Equations (5b) and (5c) . A horizontal shift of demand would be
incorporated as [E(Q) – α] = η[E(P)], or equivalently E(Q) = {η[E(P)] + α} in Equations (5b)
and (5c). Since our research is examining potential changes in the demand for specialty crops
for a given price, they will be considered horizontal shifts in demand.
In the following equations, for any variable X, E(X) represents the relative change in X,
that is, E(X) represents dX/X where d refers to a total differential.
(5a) E(Qn) = εn [E(Pn) + βn]
(5b) E(Qa) = ηaa[E(Pa) – αa] + ∑b ηab [E(Pb) – αa]

24
(5c) E(Qi) = ηii[E(Pi) – αi] + ∑j ηij [E(Pj) – αi]
The own-price elasticity of supply for nutrient n is represented by εn. The price elasticity
of demand for the macronutrient a with respect to the price of another macronutrient b, is
represented by ηab. Similarly, the price elasticity of demand for the micronutrient i with respect
to the price of another macronutrient j, is represented by ηij. A relative increase in the supply of
a nutrient, (a vertical shift up) is denoted βn, a relative increase in the demand for a macronutrient
(a vertical shift up) is denoted αa, and a relative increase in the demand for a micronutrient (a
vertical shift up) is denoted αi. The fully specified model for the 15 nutrient groups yields a
system of forty-five equations.
Simulated changes in demand for nutrient groups due to compliance with food
recommendations yield changes in prices and output for the 15 nutrient groups. The simulated
changes in prices and output of nutrient groups can then be used to calculate the changes in the
gross revenues for the 9 macronutrients as shown in Equation (6), and gross revenues for the 6
micronutrients as shown in Equation (7). The percent change in gross revenue for a nutrient
group is approximated as the sum of the percent changes in price and quantity. This
approximation serves our purpose well as we are mostly concerned with a comparison of the
change in gross revenue across the seven diet regimes.
(6) E(TRa) ≈ E(Pa) + E(Qa) where a = (1,…, 9)
(7) E(TRi) ≈ E(Pi) + E(Qi) where i = (10,…, 15)
Changes in the gross revenues of specific crops follow a weighted share calculation. The
calculation combines the simulated changes in gross revenues for the 15 nutrients and nutrient
composition shares for specific crops. Table 4 details the nutrient composition of California’s
top 50 agricultural products (California Department of Food and Agriculture 2003), many of

25
which are specialty crops. Standard serving sizes of each of the top 50 commodities were
analyzed using Food Processor SQL (ESHA Research, Salem, Oregon) for nutrient content. For
consistency, the USDA database was selected for each of the items analyzed on the diet analysis
program.
Based on the information in Table 4 we calculate the nutrient composition shares for our
15 nutrient groups. Table 5 shows the nutrient composition shares for the macronutrients and
Table 6 shows the nutrient composition shares for the micronutrients. Nutrient composite shares
will not simply be based on mass. This is because a subset of the 15 nutrient groups—namely
the caloric nutrient groups including fats, carbohydrates, and protein—comprise the vast
majority of the total weight in any food item. Since macronutrients are typically measured in
grams and micronutrients are typically measured in milligrams, any weight-based share across
nutrients would favor the macronutrients. Instead, we assign additional weight to the non-caloric
nutrient groups, i.e., the micronutrients. We do this to better incorporate the changes in
micronutrient recommendations across the diet regimes in our analysis.
The final calculation in Step 4 is to calculate the percent change in gross revenue for a
specific crop due to changes in demand for nutrient groups based on compliance with the seven
dietary regimes and their nutrient recommendations. In the notation below, NCSaC refers to the
Nutrient Composition Share for macronutrient a and NCSiC refers to the Nutrient Composition
Share for macronutrient i, in specialty crop C. Equation (8) describes the calculation used to find
the percent change in gross revenue for a specific crop, denoted E(TRC), due to changes in
demand for nutrient groups from compliance with the seven dietary recommendations.
(8) E(TRC) = (0.95)*Σa [(E(TRa)* NCSaC] + (0.05)*Σi [(E(TRi)* NCSi
C]

26
Changes in gross revenues of nutrient groups and the nutrient composition shares are
used to calculate the change in gross revenue for a specific crop in Equation (8). We have
considered allocating different weights to the macronutrient group. Based on mass, the
allocation to macronutrients would be greater than 99.5 percent and we wanted our results to also
reflect the recommended changes in micronutrients to some degree. In the results presented
below, we allocate 95 percent of the weight to the macronutrients and 5 percent to the
micronutrients. Overall, we found that our results were robust across weight allocations of
between 85 and 98 percent for the macronutrient group.
Results
Our methodology included four steps and a summary of the results for the first three steps have
been provided above. Therefore, we will turn our attention here to the results from our final step,
namely the results from our simulation model. The simulation model is developed and used to
examine how compliance with the seven diet regimes would impact revenues for the 50 highest-
value agricultural products in California.
Based on the information in Tables 1 and 2, we calculated the percent changes in
consumption of nutrients required to comply with the seven dietary regimes in Table 3. The
calculated quantities of nutrients per serving for the 50 highest-value agricultural products in
California are provided in Table 4. Table 5 shows the relative share of each macronutrient and
Table 6 shows the relative share of each micronutrient for each agricultural product. The
simulation model as outlined in Equation (5) combines changes required for compliance with the
various diet plans in Table 3, the calculated elasticity parameters shown in Appendix H and
Appendix I, and the nutrient composition shares provided in Tables 5 and 6. The simulation
27
model allows us to examine how compliance with each diet regime would affect gross revenues
for the 15 nutrient groups and ultimately gross revenues for each of the 50 highest-value
agricultural products in California.
Table 7 shows the percent changes in gross revenues for the 15 nutrients across the seven
diet regimes. The model used to calculate the results in Table 7 assumes full consumer
compliance with the dietary regimes and that some substitution is possible across nutrient
groups. For example, Table 7 shows that gross revenue for protein would increase by 13.6
percent if consumers complied with the USDA FGP, whereas gross revenue would increase by
35.4 percent if consumers complied with the Mediterranean regime. For most diet regimes,
gross revenue would increase for protein, carbohydrates, fiber, Omega 3 and Omega 6
polyunsaturated fats, vitamin C, vitamin E, calcium, and iron. It will be the differences in the
proportions of nutrient groups, and the nutrient composition shares for specialty crops, that will
drive our results. Consumer compliance with many of these diets would increase the demand for
nutrient groups that are commonly found in many of California’s specialty crops. Calculating
the changes in revenue for nutrient groups is done as a step towards what we are ultimately
concerned with—calculating the changes in gross revenues for specialty crop markets in
California.
Table 8 shows the changes in revenues for the 50 highest-value agricultural products2 in
California given compliance with each of the seven dietary regimes. The most important result
is that compliance with all diet regimes, with the exception of Atkins, would increase gross
revenue for nearly all of the agricultural products listed in Table 8. For 38 of the agricultural
products listed in Table 8, compliance with the Harvard diet regime would generate the greatest
2 Table 8 includes two milk products and therefore 51 agricultural products are listed.

28
gross revenue gain. However, for certain specialty crops, compliance with the Mediterranean,
Atkins, and MyPyramid diet regimes would provide the greatest increase in gross revenues. In
many cases, the Harvard, Mayo Clinic, and Mediterranean diet regimes would all increase gross
revenues by 20 percent, or more.
In addition to our comparisons across the seven diet regimes, the differences between the
two USDA regimes should be noted. The results between the 1992 USDA FGP and the 2005
USDA MyPyramid are often similar, however, compliance with one of the USDA diet regimes is
not always best across all agricultural products. Compliance with the USDA FGP would
generate a slightly higher increase in gross revenue for citrus products, stone fruits, and several
vegetable products whereas the USDA MyPyramid would be best for leafy green vegetables,
olives, and tree nuts.
We assessed how seven dietary regimes would affect the gross revenue for 15 nutrient
groups, and used the results to calculate nutrient-weighted changes in gross revenue for
agricultural products. Previous work in this area provided results for aggregated food groups.
Our research has focused on understanding what the dietary regimes are recommending in terms
of nutrients. This was done to give a disaggregated set of results that would be directly
applicable to specific agricultural products. One example of the benefits of disaggregation in our
results is within the tree nut category. Earlier work aggregated tree nuts with other sources of
protein such as meat, poultry, eggs, and beans. Our results show the additional revenue that
would be generated from compliance with the various diet regimes across the protein sources is
different. Within the tree nut category alone, i.e., almonds, pistachios, and walnuts, the results
do not indicate that the same dietary regime would be best. The Harvard regime would be best
for almonds and pistachios while the USDA MyPyramid regime would be best for walnuts.
29
Although many agricultural products share similar nutrient profiles, all products are
different. Understanding the changes in gross revenue for agricultural products considering
nutrient composition enriches the analysis, and allows us to provide a set of results that are
specific to an agricultural product rather than to a group of agricultural products that share some
similar characteristics. As a result, our findings are much more applicable to growers of, and
policy makers concerned with the benefits of consuming, specialty crops.
Sensitivity Analysis
The results presented in Tables 7 and 8 were calculated assuming that there was some
substitutability between micronutrients (σa = 1.0) and also some substitutability between
micronutrients (σi = 0.75). The degree of substitutability is incorporated into the calculations of
the own- and cross-price elasticities of demand, and ultimately affects the results for revenue
changes among the 50 crops. To understand how robust our results in Table 7 and Table 8 are to
changes in this key assumption, we will undertake a sensitivity analysis under the assumption of
little substitutability between the 9 macronutrients (σa = 0.1) and the 6 micronutrients (σi = 0.1).
Table 9 is set up following the format in Table 7 and Table 10 is set up following the format in
Table 8. However, the changes in gross revenues in Tables 9 and 10 are different because we
assume that there is less substitution between the nutrients.
Table 9 documents the changes in gross revenues for the 15 nutrient groups under the
assumption that there is little substitution between nutrient groups. For example, Table 9
indicates that the compliance with the USDA FGP would increase gross revenue for protein by
19.5 percent. Table 10 incorporates the nutrient composition shares from Tables 5 and 6 and the
percent changes in gross revenues for the nutrient groups from Table 9 to calculate the changes

30
in gross revenue for the agricultural products under the assumption that there is little substitution
between the nutrient groups.
Overall, Table 10 shows that as the substitutability of nutrients decreases, the revenue
impacts from compliance with the various dietary recommendations are larger for most crops.
The crops that previously saw an increase in gross revenue in Table 9 will see a greater increase
in gross revenue in Table 10, and crops that previously saw a decrease in gross revenue in Table
9 will see a greater decrease in gross revenue in Table 10. For example, Table 8 reported that
compliance with the Harvard regime would increase gross revenue for romaine lettuce by 67.3
percent and in Table 10 gross revenue would increase by 113.9 percent. For 38 of the
agricultural products gross revenue would increase the most under compliance with the Harvard
regime, and again, six of the seven diet regimes would increase gross revenues for nearly all of
California’s specialty crops. The order of the rankings changes slightly from Table 9, and the
diet regime that is best for almonds and honey changes in Table 10. Almond revenue would see
the greatest increase under compliance with the Atkins regime followed by the Mediterranean
regime, and honey revenue would see the greatest increase under compliance with the 1992
USDA FGP.
Research Extensions
This study examined how various food recommendation models affect the demand for nutrients
rather than food groups, and this itself is an extension of earlier research in this field. Two
related research areas that deserve additional work are: i) consideration of additional sub-
nutrient groups in the analysis, and ii) calculating the amount of key phytochemicals in
agricultural products and understanding the role of phytochemicals in various dietary regimes.

31
Both research extensions would expand upon our list of 15 nutrients to assess how adding, or
further disaggregating, macronutrients and micronutrients would affect our results.
Examining sub-nutrients in the carbohydrate category might shed some light on the
different recommendations for simple and complex sugars, and help to further distinguish
between agricultural products. The presence of phytochemicals naturally found in many
specialty crops is something that is generating much interest (see Debusk et al. 2005).
Recommendations for increased consumption of phytochemicals has the potential to increase the
demand for specialty crops rich in phytochemicals. Incorporating existing or potential
recommendations concerning phytochemicals is a natural extension of our analysis. We expect
that further increases in consumption of agricultural products containing phytochemicals would
increase the demand for many of California’s specialty crops.
An Extension to Consider Additional Sub-Nutrient Groups At the onset of this project, our intent was to break each macronutrient group down into its most
basic components. The carbohydrates category can be broken down into monosaccharides,
disaccharides, starch, and fiber, with the fiber category being broken down further into soluble
fiber and insoluble fiber. Ideally, we would have had information for all sub-nutrient groups.
However, once we started collecting nutrient information for the 50 commodities, specific
nutrient data for sub-nutrients within the carbohydrate group were missing in the USDA National
Nutrient Database for Standard Reference.
Data on the nutrient content of all foods within the USDA database are limiting with
respect to monosaccharides, disaccharides, and total starch content. For some agricultural
products, complete data were available, but not for all. Likewise, the programs used to evaluate
32
the nutrient content of the various diets were not consistent with the USDA database. Because of
these complications, we were not able to further subdivide the carbohydrates category.
Similarly, there was inadequate information on the types of dietary fibers in every food
item within the USDA database. Dietary fiber can be classified into soluble fiber and insoluble
fiber. Each type of fiber carries out specific functions in the intestinal track and imparts certain
health benefits. Many fiber-rich foods contain both types of fiber, but are generally regarded as a
good source for one or the other. Presently, nutrition professionals are moving away from
distinguishing fiber according to solubility and do not make specific recommendations as to how
much of each type of fiber is considered healthy. To be consistent with current practices among
nutrition professionals and because of the limitation of the USDA nutrient database, we included
only total dietary fiber and did not subdivide this group. These complications left us with a total
carbohydrate category and a total fiber category.
With better information available, our research could be extended to examine how the
seven diet regimes would change the demand for specific types of carbohydrates. There is
reason to consider sub-nutrient groups within the carbohydrate group as research has suggested
that consumption of simple sugars, specifically consumption of fructose and high fructose corn
syrup, is associated with health risks such as obesity, aging, diabetes, and hypertriglyceridemia
(Bray 2004; Bray, Nielsen, and Popkin 2004; Gaby 2005). Simple sugars include
monosaccharides and disaccharides and are found in fresh and processed fruits, snack foods, and
sweeteners. The simple sugars in fresh fruits are not usually associated with any health
problems, however, processed foods that contain sweeteners are typically discouraged under
most healthy eating plans.

33
Our analysis examined saturated fats, monounsaturated fats, Omega 3 and Omega 6
polyunsaturated fats, and other polyunsaturated fats but not trans-fats. Trans-fats come primarily
from foods that are made with hydrogenated vegetable oils and are associated with chronic
diseases such as heart disease and possibly cancer. As of January 1, 2006, the Food and Drug
Administration has mandated that all food companies include trans-fats in their nutritional
labeling. Because of this, many food companies have made the necessary modifications to their
products to get the hydrogenated fat, and therefore the trans-fats, out of their products. Labeling
of trans-fats has made consumers more aware of the health risks associated with consumption of
trans-fats, and there have been signs that some consumers have begun to modify their diets to
avoid foods high in trans-fat.
An Extension to Consider Phytochemicals
One of the most interesting and dynamic areas of research in nutrition is in the area of
phytochemicals. Phytochemicals are non-nutritive plant compounds which confer health
benefits in humans. These chemicals offer protection to the plants themselves, and many offer
protection against chronic diseases in humans as well. There are over a thousand
phytochemicals, each with specific actions. Phytochemicals have been characterized as
antioxidants and include many positive effects for human health including stimulation of
enzymes, hormonal action, interference with DNA, and antibacterial action.
While there presently are no recommendations for specific levels of phytochemicals in
the diet, consuming a diet that meets the recommendations for fruits, vegetables, and whole
grains would certainly include significant amounts of these compounds. With vast research in
this area and in the area of biotechnology, we may see agricultural products engineered to

34
contain higher levels of specific phytochemicals in the future (Hausler 1998; American Dietetic
Association 1999; Milner 2002; Debusk et al. 2005).
Another provocative area of nutrition research is in nutritional genomics. This is the
study of how nutrition, or specific components of the diet, can affect gene expression and thus
affect disease risk. Most chronic diseases have a genetic component as well as an environmental
component to their risk profiles. It is plausible that in the future we will see foods developed that
will have more or less of a particular compound (such as a specific phytochemical) and marketed
to people from a nutritional genomics platform (Debusk et al. 2005).
Consistent with the present study, it would be of interest to incorporate phytochemical
information to understand how consumer compliance with phytochemical recommendations
would affect specialty crop markets in California. As a beginning, we could start with some of
the phytochemicals for which there is substantial research on health-related benefits such as
those listed in Table 6, namely β-Carotene, flavonoids, isoflavones, lutein, lycopene,
isothiocyanates, zeaxanthin, ellagic acid, limonoids, and allyl sulfides.
Food sources for many phytochemicals have been identified, however, content of all food
sources have not been quantified. The USDA has databases on the β-Carotene content and the
flavonoid content of selected foods, but these are not complete. Data does not exist on the
phytochemical content of all foods. For these reasons, it was not possible for us to do this type
of analysis in the present study. Table 6 indicates with asterisks the agricultural commodities
that contain specific quantities of 10 selected phytochemicals. These lists are not all inclusive,
but represent foods that are known to be good sources of each of the compounds.

35
Industry and Policy Implications
The purpose of this study was threefold: i) to review and assess various food recommendation
models (or dietary regimes) in terms of their nutrient recommendations, ii) to develop a
framework for evaluating the implications that consumer compliance with each diet would have
for selected nutrient groups, and iii) to understand how consumer compliance with the diet
regimes would affect gross revenues for the 50 highest-value agricultural products (many of
which are specialty crops) in California. This research was designed, and its intent was, to
answer questions that would be relevant to both growers of specialty crops and policy makers
interested in the potential benefits of increased compliance with nutritional recommendations.
Our results show that consumer compliance with six of the seven diet regimes, all except
the Atkins regime, would generate additional revenue for most of the specialty crops grown in
California. For 38 of the 50 agricultural products analyzed it was compliance with the Harvard
regime that would generate the most additional revenue. However, compliance with two USDA
regimes, the Mayo Clinic regime, the Mediterranean regime, and the DASH regime showed
results that closely trailed those for the Harvard regime.
This research makes two important contributions to our understanding of the implications
of better compliance with nutritional recommendations fro specialty crop producers. First, we
consider the economic effects of compliance with seven dietary regimes that have been widely
promoted in the United States. Prior research examined only compliance with the USDA FGP, a
cancer prevention diet, diets that included 5 and 7 servings of fruit and vegetables per day, and a
WHO-based diet. Second, given consumer compliance with nutritional recommendations, we
assessed the changes in gross revenues for agricultural products considering the nutrient
composition of those products. This approach has not been used previously in this area of
36
research, and it is a novel way of evaluating the economic implications for specific agricultural
products that had previously been aggregated into food groups.
U.S. consumers have become more aware of the ingredients in food products and the
nutrient composition of agricultural products. Our work follows this lead, and shows how
consumer compliance with seven different nutritional recommendations would affect the gross
revenue for producers of specialty crops in California. The modeling approach and the results
are outlined such that they can be understood by a wide audience, and therefore we anticipate
that our research will be of immediate interest to both industry stakeholders and policy makers in
California, and elsewhere.
37
V
H
P0
P1
d
a b e
Figure 1: An Illustration of How Shifts in Demand Affect Producer Revenue
Price
Quantity
Supply
Demand
Demand + Shift
Q0 Q1
f
c
38
Table 1: Comparison of Nutrient Content of Various Recommended Diet Patterns
Nutrientsa USDA FGP
1992 Harvard Mayo Clinic Mediterranean Atkins DASHMy Pyramid
2005 Macronutrients Protein g 92.9 94.6 82.9 123.6 131.2 104.5 98.0CHO g 291.3 281.5 281.1 294.6 45.2 287.1 264.0Fiber g 28.8 57.4 42.8 39.6 13.0 30.6 31.0SFA g 16.6 10.4 16.8 15.2 36.9 13.7 16.0MUFA g 22.3 22.7 30.6 21.7 53.7 21.9 23.0Omega 3s g 1.6 1.5 1.6 0.9 0.5 0.6 1.1Omega 6s g 16.1 11.3 9.8 8.4 6.3 9.4 21.0Other PUFAb g 0.4 1.2 2.0 1.1 8.3 1.4 0.9Cholesterol mg 223.8 38.5 118.1 150.9 856.6 188.0 207.0 Micronutrients Vitamin A mcg RE 1321.3 2997.0 2979.3 1245.3 906.5 1231.4 1430.0Vitamin C mg 163.7 273.8 303.8 196.7 61.0 166.2 190.0Vitamin E mg TE 8.3 9.7 13.2 9.0 8.1 12.8 18.9Calcium mg 1159.3 846.4 1015.7 1291.0 650.7 1047.5 1389.0Iron mg 19.4 27.9 17.3 19.4 14.5 17.9 21.0Sodium mg 2086.4 1843.9 2099.2 2328.9 2771.0 2324.3 1948.0
a CHO denotes carbohydrates; SFA denotes saturated fatty acids; MUFA denotes monounsaturated fatty acids; Omega 3s denotes omega 3 fatty acids; Omega 6s denotes omega 6 fatty acids; PUFA denotes polyunsaturated fatty acids.
b Other PUFA= (Total PUFA – Omega 3s – Omega 6s)

39
Table 2: Current Consumption Patterns and Shares for Selected Nutrients
Nutrientsa Current ConsumptionPatternsb
Consumption Shares(%)
Micronutrients Protein g 75.0 17.4CHO g 255.0 59.3Fiber g 15.4 3.6SFA g 26.0 6.1MUFA g 29.0 6.7Omega 3s g 1.3 0.3Omega 6s g 12.9 3.0Other PUFAc g 15.0 3.5Cholesterol mg 256.0 0.1 Macronutrients Vitamin A mcg RE 1445.0 19.7Vitamin C mg 100.0 13.7Vitamin E mg TE 8.0 6.5Calcium mg 801.0 9.8Iron mg 15.4 23.6Sodium mg 3271.0 26.7
a CHO denotes carbohydrates; SFA denotes saturated fatty acids; MUFA denotes monounsaturated fatty acids; Omega 3s denotes omega 3 fatty acids; Omega 6s denotes omega 6 fatty acids; PUFA denotes polyunsaturated fatty acids.
b Consumption patterns were taken from the Continuing Survey of Food Intake by Individuals (CSFII) 1996-1998, a nationwide survey conducted by the Agricultural Research Service of the United States Department of Agriculture in 1997. c Other PUFA= (Total PUFA – Omega 3s – Omega 6s)
40
Table 3: Percent Change from Current Consumption Patterns to Meet Proposed Diet Recommendations
Nutrientsa USDA FGP
1992 HarvardMayo Clinic Mediterranean Atkins DASH
My Pyramid2005
Macronutrients —Percent Change Required in Consumption— Protein 23.9 26.1 10.6 64.8 74.9 39.3 30.7CHO 14.2 10.4 10.3 15.5 -82.3 12.6 3.5Fiber 86.7 272.7 178.1 157.1 -16.2 98.5 101.3SFA -36.3 -59.9 -35.4 -41.4 42.2 -47.1 -38.5MUFA -23.2 -21.8 5.7 -25.2 85.2 -24.4 -20.7Omega 3s 22.3 12.3 21.5 -30.8 -61.5 -52.3 -15.4Omega 6s 24.4 -12.6 -23.7 -34.9 -51.2 -27.2 62.8Other PUFAb -97.7 -91.9 -86.7 -92.7 -44.9 -90.7 -94.0Cholesterol -12.6 -84.7 -53.9 -41.1 234.6 -26.6 -19.1 Micronutrients Vitamin A -8.6 107.4 106.2 -13.8 -37.3 -14.8 -1.0Vitamin C 63.7 173.8 203.8 96.7 -38.9 66.2 90.0Vitamin E 3.1 21.0 65.5 12.5 1.5 60.6 136.3Calcium 44.7 5.7 26.8 61.2 -18.8 30.8 73.4Iron 26.1 81.4 12.0 25.9 -6.0 16.4 36.4Sodium -36.2 -43.6 -35.8 -28.8 -15.3 -28.9 -40.5
a CHO denotes carbohydrates; SFA denotes saturated fatty acids; MUFA denotes monounsaturated fatty acids; Omega 3s denotes omega 3 fatty acids; Omega 6s denotes omega 6 fatty acids; PUFA denotes polyunsaturated fatty acids.
b Other PUFA= (Total PUFA – Omega 3s – Omega 6s)

41
Table 4a: Nutrient Contenta of the Top 50 Commodities in California by Serving Size
Milk Fat-Free Whole
Grapes Beef Romaine Lettuce
Almonds Oranges Strawberries Canned Tomatoes
Rice Broccoli
Rankingb 1 1 2 3 4 5 6 7 8 9 10 Quantity 8 8 0.5 4 1 1 1 1 0.5 0.25 0.5Measure ounce ounce cup ounce cup ounce each cup cup cup cup Nutrientsc Protein g 8.3 8.0 0.6 17.8 0.7 6.0 1.3 0.9 0.9 3.3 1.2CHO g 12.2 12.0 14.5 0.0 1.8 5.7 17.6 11.1 4.7 36.9 2.9Fiber g 0 0 0.7 0.0 1.2 3.5 3.1 2.9 1.1 0.6 1.1SFA g 0.3 4.6 0.04 10.7 0.02 1.1 0.02 0.02 0.02 0.1 0.01MUFA g 0.1 2.0 0.01 12.4 0.01 9.1 0.04 0.1 0.02 0.1 0Omega 3s g 0.01 0.3 0.01 0.6 0.1 0 0.01 0.1 0 0.01 0.01Omega 6s g 0.01 0.3 0.03 0.1 0.03 3.3 0.03 0.1 0.1 0.1 0.01Other PUFAd g 0.01 0 0 0.7 0 0 0 0.01 0.01 0.1 0Cholesterol mg 5.0 24.0 0 85.0 0 0 0 0 0 0 0Vitamin A mcg RE 149.0 60.0 4.8 0 324.8 0 33.6 2.9 35.4 0 15.0Vitamin C mg 0 1.2 8.6 0 13.4 0 82.7 84.7 4.7 0 39.0Vitamin E mg TE 0.02 0.2 0.2 0.5 0.07 7.3 0.2 0.4 0.3 0.1 0.3Calcium mg 306.0 276.0 8.0 24.0 18.5 70.0 60.2 23.0 17.2 13.0 21.0Iron mg 0.1 0 0.3 2.0 0.5 1.2 0.2 0.6 0.7 0.4 0.3Sodium mg 103.1 98.0 1.6 76.0 4.5 0 1.4 1.4 66.7 2.0 15.0a USDA National Nutrient Database for Standard Reference, 2004.
b CDFA Summary of County Agricultural Commissioners’ Reports.
c CHO denotes carbohydrates; SFA denotes saturated fatty acids; MUFA denotes monounsaturated fatty acids; Omega 3s denotes omega 3 fatty acids; Omega 6s denotes omega 6 fatty acids; PUFA denotes polyunsaturated fatty acids.
d Other PUFA= (Total PUFA – Omega 3s – Omega 6s)

42
Table 4b: Nutrient Contenta of the Top 50 Commodities in California by Serving Size
Salad Greens Peaches Chicken Avocados Pistachios Walnuts Lemons Celery Egg Plums
Rankingb 11 12 13 14 15 16 17 18 19 20
Quantity 1 1 4 1 1 1 1 1 1 1Measure cup each ounce each ounce ounce each each each each
Nutrientsc Protein g 0.9 1.4 26.2 3.4 5.8 4.3 0.9 0.3 6.3 0.5CHO g 1.6 15.0 0 14.9 7.9 3.9 7.8 1.2 0.4 7.5Fiber g 1.2 2.4 0 11.8 2.9 1.9 2.4 0.1 0 0.9SFA g 0.02 0.03 0.4 3.7 1.5 1.7 0.03 0.02 1.6 0.01MUFA g 0 0.1 0.3 16.9 6.6 2.5 0.01 0.01 1.9 0.1Omega 3s g 0.04 0 0.03 0.2 0.1 2.6 0.02 0 0.04 0Omega 6s g 0.02 0.1 0.2 2.9 3.7 10.8 0.1 0.03 0.6 0.03Other PUFAd g 0.01 0.01 0.1 0.4 0 0 0 0 0 0Cholesterol mg 0 0 65.8 0 0 0 0 0 211.5 0Vitamin A mcg RE 149.6 50.2 6.8 24.2 15.9 0.6 1.7 17.6 70.5 22.4Vitamin C mg 8.9 10.4 1.4 15.2 1.4 0.4 44.5 1.2 0 6.3Vitamin E mg TE 0.4 1.2 0.2 3.4 0.7 0.2 0.1 0.1 0.5 0.2Calcium mg 30.1 9.4 12.5 22.5 30.3 27.8 21.8 16.0 26.5 3.9Iron mg 0.7 0.4 0.8 1.1 1.2 0.8 0.5 0.1 0.9 0.1Sodium mg 14.0 0 73.7 13.8 0.3 0.6 1.7 32.0 70.0 0a USDA National Nutrient Database for Standard Reference, 2004.
b CDFA Summary of County Agricultural Commissioners’ Reports.
c CHO denotes carbohydrates; SFA denotes saturated fatty acids; MUFA denotes monounsaturated fatty acids; Omega 3s denotes omega 3 fatty acids; Omega 6s denotes omega 6 fatty acids; PUFA denotes polyunsaturated fatty acids.
d Other PUFA= (Total PUFA – Omega 3s – Omega 6s)

43
Table 4c: Nutrient Contenta of the Top 50 Commodities in California by Serving Size
Nectarines Onions Potatoes Tomatoes
Bell Peppers Cauliflower Spinach Wheat Turkey Garlic
Rankingb 21 22 23 24 25 26 27 28 29 30 Quantity 1 0.5 1 0.5 0.5 0.5 1 0.25 4 1Measure each cup each each each cup cup cup ounce each Nutrientsc Protein g 1.4 0.7 4.3 0.8 0.7 1.0 0.9 6.1 22.8 0.2CHO g 14.4 8.1 37.2 3.6 3.8 2.7 1.1 34.2 0 1.0Fiber g 2.3 1.1 4.7 1.1 1.4 1.3 0.7 5.9 0 0.1SFA g 0.03 0.01 0.1 0.04 0.1 0.01 0.02 0.1 1.7 0MUFA g 0.1 0.01 0 0.04 0.01 0 0 0.1 1.1 0Omega 3s g 0 0 0.02 0 0.01 0.04 0.04 0.01 0.1 0Omega 6s g 0.2 0 0.1 0.1 0.04 0.01 0.01 0.3 1.4 0.01Other PUFAd g 0 0.04 0 0 0 0 0 0 0.03 0Cholesterol mg 0 0 0 0 0 0 0 0 78.2 0Vitamin A mcg RE 46.2 0.2 0.4 76.4 29.5 1.0 281.4 0.4 0 0Vitamin C mg 7.3 5.1 41.9 11.6 65.9 23.2 8.4 0 0 0.9Vitamin E mg TE 1.1 0.02 0.02 0.5 0.3 0.04 0.6 0.5 0.8 0Calcium mg 8.2 17.6 25.6 9.1 8.2 11.0 29.7 13.9 19.3 5.4Iron mg 0.4 0.2 1.7 0.3 0.3 0.2 0.8 1.5 2.0 0.1Sodium mg 0 2.4 12.8 4.6 2.5 15.0 23.7 0.9 87.3 0.5a USDA National Nutrient Database for Standard Reference, 2004.
b CDFA Summary of County Agricultural Commissioners’ Reports.
c CHO denotes carbohydrates; SFA denotes saturated fatty acids; MUFA denotes monounsaturated fatty acids; Omega 3s denotes omega 3 fatty acids; Omega 6s denotes omega 6 fatty acids; PUFA denotes polyunsaturated fatty acids.
d Other PUFA= (Total PUFA – Omega 3s – Omega 6s)

44
Table 4d: Nutrient Contenta of the Top 50 Commodities in California by Serving Size
Cherries Cantaloupe Mushrooms Dried Plums Apples Carrots Pears Asparagus
Pink Beans
Sweet Potatoes
Rankingb 31 32 33 34 35 36 37 38 39 40
Quantity 0.5 1 0.5 1 1 1 1 0.5 0.25 1Measure cup cup cup each each each each cup cup each
Nutrientsc Protein g 0.8 1.3 1.5 0.5 0.4 0.7 0.6 1.5 11.0 2.0CHO g 11.6 13.1 1.6 24.9 19.1 6.9 25.7 2.6 33.7 22.9Fiber g 1.5 1.4 0.6 4.9 3.3 2.2 5.2 1.4 6.7 3.9SFA g 0.03 0.1 0.02 0.1 0.04 0.02 0.01 0.03 0.2 0.02MUFA g 0.03 0 0 0.1 0.01 0.01 0.04 0 0.1 0Omega 3s g 0.02 0.1 0 0 0.01 0 0 0.01 0.1 0Omega 6s g 0.02 0.1 0.1 0.1 0.1 0.1 0.1 0.03 0.1 0.02Other PUFAd g 0 0 0.01 0.01 0 0 0 0.01 0 0Cholesterol mg 0 0 0 0 0 0 0 0 0 0Vitamin A mcg RE 4.4 540.8 0 25.8 8.3 866.9 3.3 50.9 0 1890.0Vitamin C mg 5.1 58.7 1.2 0 6.4 4.3 7.0 3.8 0 29.5Vitamin E mg TE 0.1 0.1 0 0.3 0.3 0.5 0.2 0.8 0.1 0.3Calcium mg 9.4 14.4 1.4 8.5 8.3 23.8 14.9 16.1 68.3 39.0Iron mg 0.3 0.3 0.3 0.3 0.2 0.2 0.3 1.4 3.6 0.8Sodium mg 0 25.6 1.9 0.7 1.4 49.7 1.7 1.3 4.2 16.9a USDA National Nutrient Database for Standard Reference, 2004.
b CDFA Summary of County Agricultural Commissioners’ Reports.
c CHO denotes carbohydrates; SFA denotes saturated fatty acids; MUFA denotes monounsaturated fatty acids; Omega 3s denotes omega 3 fatty acids; Omega 6s denotes omega 6 fatty acids; PUFA denotes polyunsaturated fatty acids.
d Other PUFA= (Total PUFA – Omega 3s – Omega 6s)

45
Table 4e: Nutrient Contenta of the Top 50 Commodities in California by Serving Size
Corn Olives Dates Watermelon Lamb Apricots Honey Grapefruit Honeydew Artichokes Rankingb 41 42 43 44 45 46 47 48 49 50
Quantity 1 0.25 0.5 1 4 1 1 1 1 1 Measure ear cup cup cup ounce each Tbsp each cup each
Nutrientsc Protein g 4.6 0.3 2.2 0.9 23.7 0.5 0.1 1.9 0.9 5.3 CHO g 27.2 2.1 66.8 11.5 0 3.9 17.5 26.2 15.5 17.0 Fiber g 3.9 1.1 7.1 0.6 0 0.7 0.04 3.9 1.4 8.8 SFA g 0.3 0.5 0.03 0.02 2.4 0.01 0 0.03 0.1 0.06 MUFA g 0.5 2.7 0.03 0.1 2.7 0.1 0 0.03 0.01 0.01 Omega 3s g 0.02 0.02 0 0 0.1 0 0 0.01 0.1 0.03 Omega 6s g 0.8 0.3 0.01 0.1 0.5 0.03 0 0.1 0.04 0.1 Other PUFAd g 0 0.01 0.01 0 0 0 0 0 0 0 Cholesterol mg 0 0 0 0 74.8 0 0 0 0 0 Vitamin A mcg RE 28.6 13.4 0.9 85.1 0 67.2 0 63.9 10.2 0 Vitamin C mg 9.7 0.3 0.4 12.3 0 3.5 0.1 93.7 30.6 18.9 Vitamin E mg TE 0.1 0.6 0.04 0.1 0.2 0.3 0 0.6 0.03 0.3 Calcium mg 2.9 29.6 34.7 10.6 13.6 4.6 1.3 27.1 10.2 71.1 Iron mg 0.7 1.1 0.9 0.4 2.2 0.1 0.1 0.2 0.3 2.1 Sodium mg 21.5 293.0 1.8 1.5 77.1 0.4 0.9 2.5 30.6 152.3 a USDA National Nutrient Database for Standard Reference, 2004.
b CDFA Summary of County Agricultural Commissioners’ Reports.
c CHO denotes carbohydrates; SFA denotes saturated fatty acids; MUFA denotes monounsaturated fatty acids; Omega 3s denotes omega 3 fatty acids; Omega 6s denotes omega 6 fatty acids; PUFA denotes polyunsaturated fatty acids.
d Other PUFA= (Total PUFA – Omega 3s – Omega 6s)

46
Table 5a: Macronutrient Shares of the Top 50 Commodities in California
Milk Fat-Free Whole
Grapes Beef Romaine Lettuce
Almonds Oranges Strawberries Canned Tomatoes
Rice Broccoli
Rankinga 1 1 2 3 4 5 6 7 8 9 10 Macronutrientsb
— Shares (%) —
Protein 39.6 29.4 3.8 42.2 25.9 24.0 6.7 7.8 18.4 8.1 32.2CHO 58.3 44.1 90.8 0.0 25.2 7.9 76.5 66.3 58.7 89.6 38.4Fiber 0 0.0 4.8 0.0 44.4 14.0 16.3 23.4 21.0 1.5 28.6SFA 1.4 16.7 0.3 25.4 0.8 4.4 0.1 0.2 0.4 0.2 0.3MUFA 0.6 7.4 0.1 29.3 0.4 36.5 0.2 0.5 0.4 0.2 0Omega 3s 0 1.2 0.1 1.3 2.3 0 0.1 0.7 0 0.0 0.3Omega 6s 0 1.1 0.2 0.2 1.1 13.2 0.2 1.1 1.0 0.2 0.3Other PUFAc 0 0 0 1.6 0 0 0 0.1 0.2 0.2 0Cholesterol 0 0.1 0 0.2 0 0 0 0 0 0 0 a CDFA Summary of County Agricultural Commissioners’ Reports. b CHO denotes carbohydrates; SFA denotes saturated fatty acids; MUFA denotes monounsaturated fatty acids; Omega 3s denotes omega 3 fatty acids; Omega 6s denotes omega 6 fatty acids; PUFA denotes polyunsaturated fatty acids.
c Other PUFA= (Total PUFA – Omega 3s – Omega 6s)
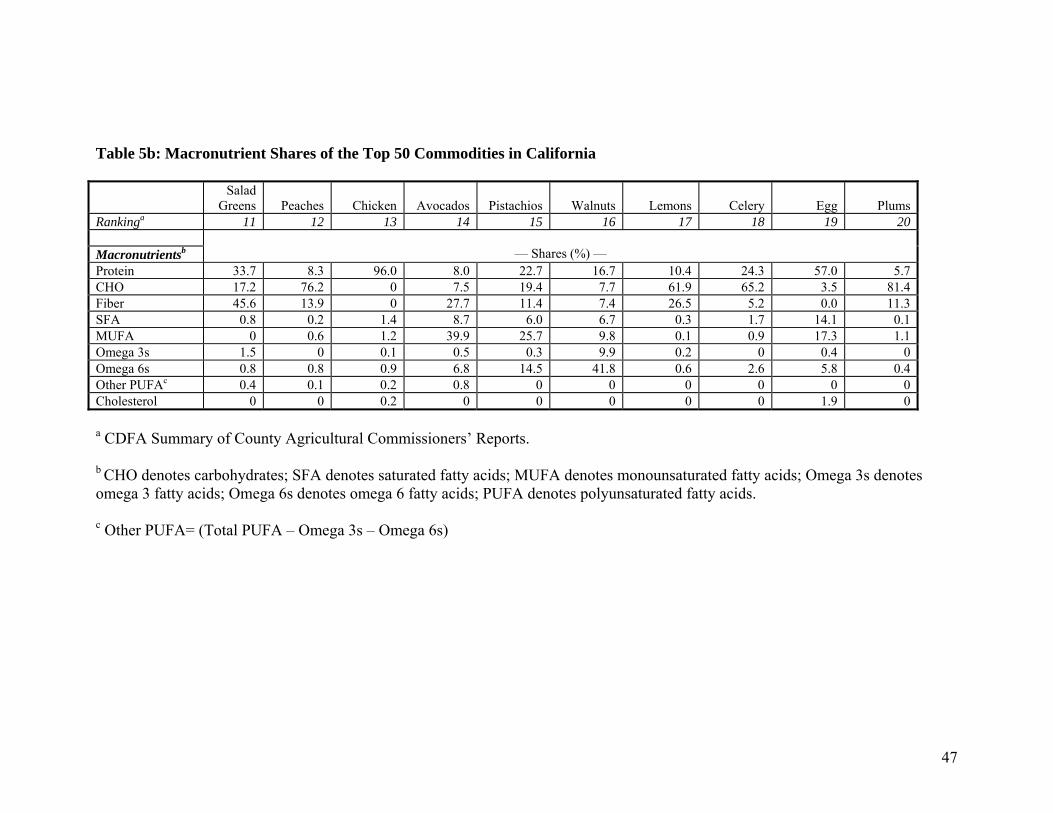
47
Table 5b: Macronutrient Shares of the Top 50 Commodities in California
Salad Greens Peaches Chicken Avocados Pistachios Walnuts Lemons Celery Egg Plums
Rankinga 11 12 13 14 15 16 17 18 19 20 Macronutrientsb
— Shares (%) —
Protein 33.7 8.3 96.0 8.0 22.7 16.7 10.4 24.3 57.0 5.7CHO 17.2 76.2 0 7.5 19.4 7.7 61.9 65.2 3.5 81.4Fiber 45.6 13.9 0 27.7 11.4 7.4 26.5 5.2 0.0 11.3SFA 0.8 0.2 1.4 8.7 6.0 6.7 0.3 1.7 14.1 0.1MUFA 0 0.6 1.2 39.9 25.7 9.8 0.1 0.9 17.3 1.1Omega 3s 1.5 0 0.1 0.5 0.3 9.9 0.2 0 0.4 0Omega 6s 0.8 0.8 0.9 6.8 14.5 41.8 0.6 2.6 5.8 0.4Other PUFAc 0.4 0.1 0.2 0.8 0 0 0 0 0 0Cholesterol 0 0 0.2 0 0 0 0 0 1.9 0 a CDFA Summary of County Agricultural Commissioners’ Reports. b CHO denotes carbohydrates; SFA denotes saturated fatty acids; MUFA denotes monounsaturated fatty acids; Omega 3s denotes omega 3 fatty acids; Omega 6s denotes omega 6 fatty acids; PUFA denotes polyunsaturated fatty acids.
c Other PUFA= (Total PUFA – Omega 3s – Omega 6s)

48
Table 5c: Macronutrient Shares of the Top 50 Commodities in California
Nectarines Onions Potatoes Tomatoes
Bell Peppers Cauliflower Spinach Wheat Turkey Garlic
Rankinga 21 22 23 24 25 26 27 28 29 30 Macronutrientsb — Shares (%) — Protein 9.0 8.3 10.3 17.5 15.4 26.8 42.8 14.8 84.0 16.0CHO 74.8 78.4 78.1 54.2 52.2 37.8 20.9 69.5 0 78.2Fiber 14.4 12.6 11.3 23.9 30.1 33.8 32.8 14.4 0 5.0SFA 0.2 0.1 0.1 0.9 1.1 0.3 1.0 0.3 6.2 0MUFA 0.7 0.1 0 0.9 0.2 0 0 0.2 4.1 0Omega 3s 0 0 0 0 0.2 1.1 2.0 0.0 0.3 0Omega 6s 0.9 0 0.2 2.6 0.9 0.3 0.5 0.7 5.1 0.8Other PUFAc 0 0.5 0 0 0 0 0 0 0.1 0Cholesterol 0 0 0 0 0 0 0 0 0.3 0
a CDFA Summary of County Agricultural Commissioners’ Reports. b CHO denotes carbohydrates; SFA denotes saturated fatty acids; MUFA denotes monounsaturated fatty acids; Omega 3s denotes omega 3 fatty acids; Omega 6s denotes omega 6 fatty acids; PUFA denotes polyunsaturated fatty acids.
c Other PUFA= (Total PUFA – Omega 3s – Omega 6s)

49
Table 5d: Macronutrient Shares of the Top 50 Commodities in California
Cherries Cantaloupe Mushrooms Dried Plums Apples Carrots Pears Asparagus
Pink Beans
Sweet Potatoes
Rankinga 31 32 33 34 35 36 37 38 39 40 Macronutrientsb — Shares (%) — Protein 6.2 8.4 47.5 1.8 1.8 8.7 2.4 34.9 24.4 8.2CHO 80.9 81.6 31.2 78.3 80.6 61.8 77.7 29.9 59.9 76.1Fiber 12.2 8.7 18.5 19.3 16.9 28.2 19.5 33.3 14.8 15.6SFA 0.2 0.5 0.6 0.2 0.2 0.3 0 0.7 0.3 0.1MUFA 0.2 0 0 0.2 0.1 0.1 0.2 0 0.1 0Omega 3s 0.2 0.4 0 0 0.1 00 0 0.2 0.3 0Omega 6s 0.2 0.4 1.9 0.2 0.3 0.9 0.2 0.7 0.3 0.1Other PUFAc 0 0 0.3 0 0 0 0 0.2 0 0Cholesterol 0 0 0 0 0 0 0 0 0 0 a CDFA Summary of County Agricultural Commissioners’ Reports. b CHO denotes carbohydrates; SFA denotes saturated fatty acids; MUFA denotes monounsaturated fatty acids; Omega 3s denotes omega 3 fatty acids; Omega 6s denotes omega 6 fatty acids; PUFA denotes polyunsaturated fatty acids.
c Other PUFA= (Total PUFA – Omega 3s – Omega 6s)

50
Table 5e: Macronutrient Shares of the Top 50 Commodities in California
Corn Olives Dates Watermelon Lamb Apricots Honey Grapefruit Honeydew Artichokes
Rankinga 41 42 43 44 45 46 47 48 49 50 Macronutrientsb — Shares (%) — Protein 13.8 4.8 3.2 7.4 80.3 9.5 0.3 8.3 5.6 23.6CHO 70.0 17.7 86.4 86.5 0 75.1 99.4 74.1 85.2 36.8Fiber 11.6 18.5 10.3 4.9 0 13.5 0.2 17.1 8.2 38.9SFA 0.8 8.2 0 0.2 8.2 0.2 0 0.1 0.4 0.3MUFA 1.5 45.5 0 0.5 9.2 1.2 0 0.1 0.1 0Omega 3s 0.1 0.3 0 0 0.3 0 0 0 0.4 0.1Omega 6s 2.3 4.8 0 0.6 1.8 0.6 0 0.2 0.2 0.3Other PUFAc 0 0.2 0 0 0 0 0 0 0 0Cholesterol 0 0 0 0 0.3 0 0 0 0 0 a CDFA Summary of County Agricultural Commissioners’ Reports. b CHO denotes carbohydrates; SFA denotes saturated fatty acids; MUFA denotes monounsaturated fatty acids; Omega 3s denotes omega 3 fatty acids; Omega 6s denotes omega 6 fatty acids; PUFA denotes polyunsaturated fatty acids.
c Other PUFA= (Total PUFA – Omega 3s – Omega 6s)

51
Table 6a: Micronutrient Sharesa and Phytochemicalb Content of the Top 50 Commodities in California
Milk Fat-Free Whole
Grapes Beef Romaine Lettuce
Almonds Oranges Strawberries Canned Tomatoes
Rice Broccoli
Rankingc 1 1 2 3 4 5 6 7 8 9 10 Micronutrients
— Shares (%) —
Vitamin A 30.1 16.1 3.4 0.0 59.8 0 3.5 0.3 15.5 0 5.7Vitamin C 0 3.2 61.3 0.0 24.7 0 87.2 87.8 20.4 4.5 77.6Vitamin E 0.2 0 6.4 9.4 0.8 68.7 1.3 2.6 7.1 0 4.1Calcium 55.6 60.5 5.1 6.6 3.1 9.8 5.7 2.2 6.8 10.3 3.7Iron 1.6 0 23.1 69.9 11.2 21.4 2.1 7.0 32.6 80.3 7.2Sodium 12.5 20.2 0.7 14.0 0.5 0 0.1 0.1 17.6 4.9 1.7 Phytochemicals β-Carotene Flavonoids ∗ ∗ Iosoflavones Lutein ∗ Lycopene ∗ Isothiocyanates ∗ Zeaxanthin Ellagic Acid ∗ Limonoids ∗ Allyl Sulfides a Using the Dietary Reference Intake (DRI) for each micronutrient, the shares represent the micronutrient content per serving. DRI information was taken from the Institute of Medicine of the National Academies of Sciences, National Academy Press. b Presence of phytochemicals in selected commodities is denoted with an asterisk. c CDFA Summary of County Agricultural Commissioners’ Reports.

52
Table 6b: Micronutrient Sharesa and Phytochemicalb Content of the Top 50 Commodities in California
Salad Greens Peaches Chicken Avocados Pistachios Walnuts Lemons Celery Egg Plums
Rankingc 11 12 13 14 15 16 17 18 19 20 Micronutrients — Shares (%) — Vitamin A 39.6 18.3 3.8 4.6 6.9 0.4 0.3 22.2 26.4 20.2Vitamin C 23.5 37.7 7.7 28.8 6.2 2.8 83.8 15.7 0 56.3Vitamin E 6.0 25.1 5.1 38.7 17.0 9.0 1.5 8.3 10.8 9.2Calcium 7.2 3.1 6.3 3.8 11.9 18.7 3.7 18.2 8.9 3.2Iron 21.5 15.9 52.1 22.6 57.9 68.9 10.6 11.4 38.3 11.1Sodium 2.2 0 25.0 1.6 0.1 0.3 0.2 24.2 15.7 0 Phytochemicals β-Carotene ∗ Flavonoids Iosoflavones Lutein Lycopene Isothiocyanates Zeaxanthin ∗ Ellagic Acid ∗ Limonoids ∗ Allyl Sulfides a Using the Dietary Reference Intake (DRI) for each micronutrient, the shares represent the micronutrient content per serving. DRI information was taken from the Institute of Medicine of the National Academies of Sciences, National Academy Press. b Presence of phytochemicals in selected commodities is denoted with an asterisk. c CDFA Summary of County Agricultural Commissioners’ Reports.

53
Table 6c: Micronutrient Sharesa and Phytochemicalb Content of the Top 50 Commodities in California
Nectarines Onions Potatoes Tomatoes
Bell Peppers Cauliflower Spinach Wheat Turkey Garlic
Rankingc 21 22 23 24 25 26 27 28 29 30 Micronutrients — Shares (%) — Vitamin A 19.9 0.2 0.1 29.4 3.9 0.4 52.7 0.2 0 0Vitamin C 31.5 59.0 65.7 44.4 88.2 83.1 15.8 0 0 46.5Vitamin E 27.1 1.4 0.2 11.3 2.4 0.9 6.9 13.4 14.3 0Calcium 3.2 18.3 3.6 3.1 1.0 3.6 5.0 5.8 5.1 24.2Iron 18.4 19.5 29.2 10.8 4.2 8.9 17.1 80.3 65.3 27.8Sodium 0 1.7 1.2 1.1 0.2 3.2 2.7 0.3 15.4 1.5 Phytochemicals β-Carotene ∗ ∗ Flavonoids ∗ Iosoflavones Lutein ∗ Lycopene ∗ Isothiocyanates ∗ Zeaxanthin ∗ Ellagic Acid Limonoids Allyl Sulfides ∗ ∗ a Using the Dietary Reference Intake (DRI) for each micronutrient, the shares represent the micronutrient content per serving. DRI information was taken from the Institute of Medicine of the National Academies of Sciences, National Academy Press. b Presence of phytochemicals in selected commodities is denoted with an asterisk. c CDFA Summary of County Agricultural Commissioners’ Reports.

54
Table 6d: Micronutrient Sharesa and Phytochemicalb Content of the Top 50 Commodities in California
Cherries Cantaloupe Mushrooms Dried Plums Apples Carrots Pears Asparagus
Pink Beans
Sweet Potatoes
Rankingc 31 32 33 34 35 36 37 38 39 40 Micronutrients — Shares (%) — Vitamin A 4.5 45.1 0 31.4 7.3 85.5 2.5 16.4 0 80.8Vitamin C 52.9 48.9 27.3 0 55.6 4.2 53.2 12.1 0 12.6Vitamin E 3.1 0.4 0 24.8 13.1 2.8 9.2 14.7 1.5 0.9Calcium 8.9 1.1 3.1 9.3 6.5 2.1 10.3 4.7 13.1 1.5Iron 30.5 3.2 66.9 34.1 16.7 2.4 24.1 51.9 84.9 3.8Sodium 0 1.3 2.7 0.5 0.7 2.9 0.8 0.3 0.5 0.4 Phytochemicals β-Carotene ∗ ∗ ∗ Flavonoids ∗ ∗ Iosoflavones ∗ Lutein Lycopene Isothiocyanates Zeaxanthin Ellagic Acid Limonoids Allyl Sulfides a Using the Dietary Reference Intake (DRI) for each micronutrient, the shares represent the micronutrient content per serving. DRI information was taken from the Institute of Medicine of the National Academies of Sciences, National Academy Press. b Presence of phytochemicals in selected commodities is denoted with an asterisk. c CDFA Summary of County Agricultural Commissioners’ Reports.

55
Table 6e: Micronutrient Sharesa and Phytochemicalb Content of the Top 50 Commodities in California
Corn Olives Dates Watermelon Lamb Apricots Honey Grapefruit Honeydew ArtichokesRankingc 41 42 43 44 45 46 47 48 49 50 Micronutrients — Shares (%) — Vitamin A 12.4 3.6 0.6 32.2 0 47.7 0 5.9 2.7 0Vitamin C 42.2 0.8 2.5 46.6 0 24.9 8.5 86.3 80.9 31.8Vitamin E 2.6 8.8 1.7 1.8 4.2 13.2 0 3.4 0.5 3.1Calcium 1.1 7.1 22.1 3.6 3.9 2.9 8.9 2.2 2.4 10.8Iron 36.1 33.2 72.3 15.3 77.3 11.2 78.6 2.1 8.6 39.0Sodium 5.6 46.7 0.8 0.4 14.7 0.2 3.9 0.1 4.9 15.3 Phytochemicals β-Carotene ∗ Flavonoids Iosoflavones Lutein Lycopene ∗ ∗ Isothiocyanates Zeaxanthin ∗ Ellagic Acid Limonoids ∗ Allyl Sulfides a Using the Dietary Reference Intake (DRI) for each micronutrient, the shares represent the micronutrient content per serving. DRI information was taken from the Institute of Medicine of the National Academies of Sciences, National Academy Press. b Presence of phytochemicals in selected commodities is denoted with an asterisk. c CDFA Summary of County Agricultural Commissioners’ Reports.

56
Table 7: Percent Change in Nutrient Revenues under Alternative Diet Recommendations (Some Nutrient Substitution)
USDA FGP 1992
Harvard Mayo Clinic Mediterranean
Atkins DASH My Pyramid2005
Nutrientsa
—Percent change in gross revenue—
Macronutrients Protein 13.6 15.0 6.8 35.4 32.3 21.2 16.4CHO 8.7 7.2 6.6 10.7 -46.4 7.8 2.8Fiber 45.0 138.6 90.7 81.7 -13.3 50.9 51.7SFA -16.6 -28.0 -16.2 -17.8 16.0 -22.1 -18.3MUFA -10.1 -9.0 4.3 -9.7 37.5 -10.7 -9.4Omega 3s 12.7 8.1 12.3 -12.5 -36.0 -24.7 -6.7Omega 6s 13.8 -4.3 -10.4 -14.5 -30.8 -12.1 32.4Other PUFAb -47.4 -44.1 -41.9 -43.5 -27.7 -43.9 -46.1Cholesterol
-4.7 -40.6 -25.5 -17.6 112.3 -11.8 -8.6
Micronutrients Vitamin A -4.1 66.6 65.4 -6.4 -23.2 -7.6 1.9Vitamin C 37.2 104.5 121.2 56.8 -24.2 38.7 53.9Vitamin E 2.6 17.2 42.1 8.6 -1.0 35.5 80.4Calcium 26.3 8.4 20.0 36.5 -12.6 18.5 44.4Iron 15.7 51.7 11.5 16.3 -5.3 10.2 23.3Sodium -19.9 -19.8 -15.8 -15.0 -10.6 -15.7 -20.7
a CHO denotes carbohydrates; SFA denotes saturated fatty acids; MUFA denotes monounsaturated fatty acids; Omega 3s denotes omega 3 fatty acids; Omega 6s denotes omega 6 fatty acids; PUFA denotes polyunsaturated fatty acids.
b Other PUFA= (Total PUFA – Omega 3s – Omega 6s)

57
Table 8a: Percent Change in Crop Revenues under Alternative Diet Recommendations (Some Nutrient Substitution)
USDA FGP 1992
Harvard Mayo Clinic Mediterranean
Atkins DASH My Pyramid2005
Selected Crops Ranked by Value (1 to 25)
—Percent change in gross revenue—
Fat-Free Milk 10.2 10.4 7.5 19.8 -13.9 12.3 8.6Whole Milk 5.0 2.9 3.6 11.6 -6.6 4.9 3.7Grapes 11.4 16.9 14.1 16.2 -40.4 11.1 7.6Beef -1.4 -2.1 0.0 6.9 26.2 -0.4 0.0Romaine Lettuce 25.1 67.3 45.1 45.8 -10.6 28.0 27.5Almonds 7.7 18.7 15.3 14.5 11.8 7.5 14.1Oranges 15.8 32.3 24.7 25.2 -34.8 16.6 13.6Strawberries 18.3 41.1 30.2 29.8 -31.3 19.2 17.2Canned Tomatoes 16.7 36.4 24.8 29.0 -23.7 18.5 16.1Rice 9.8 11.4 8.1 13.8 -37.5 9.4 5.5Broccoli 21.1 49.2 34.1 39.1 -11.9 24.6 22.5Salad Greens 25.9 68.9 45.4 48.8 -4.6 29.9 29.2Peaches 14.2 27.7 20.7 22.4 -33.5 15.0 12.6Chicken 12.5 14.7 6.7 32.3 29.6 19.0 15.7Avocados 9.7 34.4 27.1 19.7 8.3 9.8 14.3Pistachios 8.7 17.4 12.6 13.9 2.3 6.7 12.5Walnuts 11.5 11.1 5.2 4.1 -10.7 -1.3 18.3Lemons 19.5 45.2 32.5 32.7 -28.6 21.0 18.9Celery 11.1 15.9 11.6 18.8 -22.8 11.9 9.6Eggs 4.7 4.0 2.7 14.7 23.9 6.3 7.5Plums 13.4 25.1 19.6 20.5 -36.3 13.7 10.7Nectarines 14.3 28.2 20.8 22.7 -32.7 15.2 12.9Onions 14.2 26.6 20.0 22.5 -34.6 14.8 11.6Potatoes 14.1 25.8 19.4 22.2 -33.6 14.7 11.4Fresh Tomatoes 18.0 40.9 28.7 30.7 -22.8 19.6 18.4Bell Peppers 20.8 49.9 35.5 36.0 -23.3 22.9 21.2
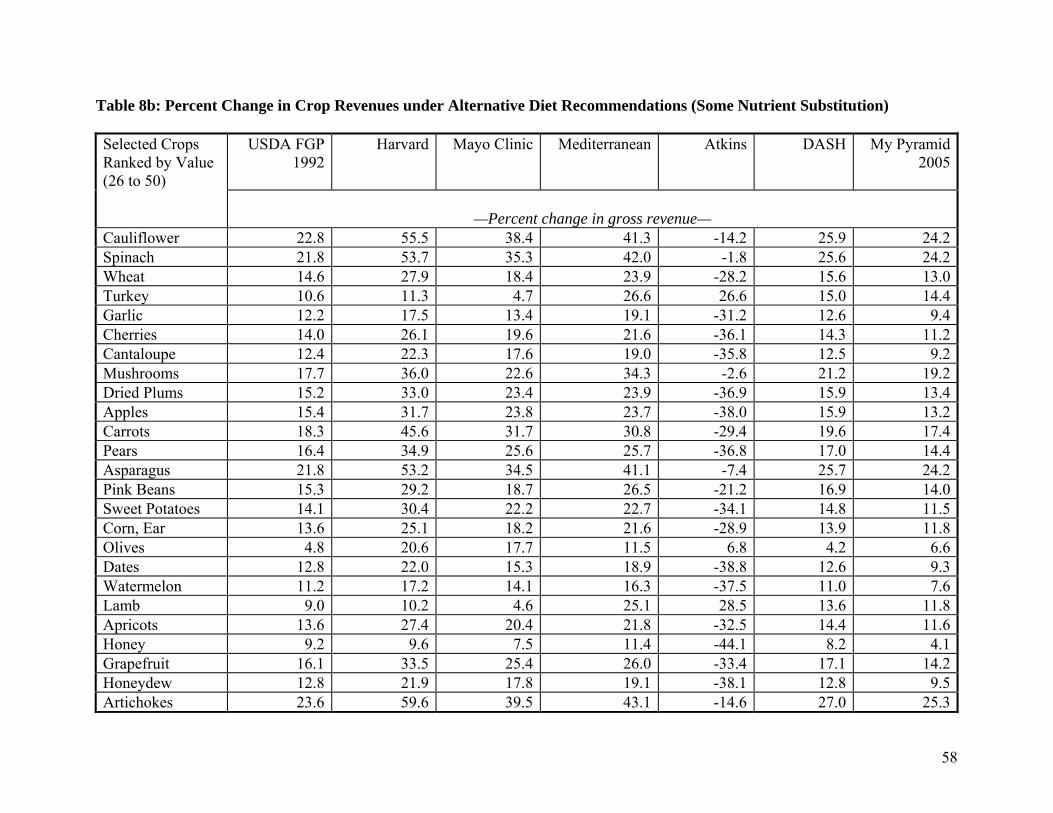
58
Table 8b: Percent Change in Crop Revenues under Alternative Diet Recommendations (Some Nutrient Substitution)
USDA FGP 1992
Harvard Mayo Clinic Mediterranean Atkins DASH My Pyramid2005
Selected Crops Ranked by Value (26 to 50)
—Percent change in gross revenue— Cauliflower 22.8 55.5 38.4 41.3 -14.2 25.9 24.2Spinach 21.8 53.7 35.3 42.0 -1.8 25.6 24.2Wheat 14.6 27.9 18.4 23.9 -28.2 15.6 13.0Turkey 10.6 11.3 4.7 26.6 26.6 15.0 14.4Garlic 12.2 17.5 13.4 19.1 -31.2 12.6 9.4Cherries 14.0 26.1 19.6 21.6 -36.1 14.3 11.2Cantaloupe 12.4 22.3 17.6 19.0 -35.8 12.5 9.2Mushrooms 17.7 36.0 22.6 34.3 -2.6 21.2 19.2Dried Plums 15.2 33.0 23.4 23.9 -36.9 15.9 13.4Apples 15.4 31.7 23.8 23.7 -38.0 15.9 13.2Carrots 18.3 45.6 31.7 30.8 -29.4 19.6 17.4Pears 16.4 34.9 25.6 25.7 -36.8 17.0 14.4Asparagus 21.8 53.2 34.5 41.1 -7.4 25.7 24.2Pink Beans 15.3 29.2 18.7 26.5 -21.2 16.9 14.0Sweet Potatoes 14.1 30.4 22.2 22.7 -34.1 14.8 11.5Corn, Ear 13.6 25.1 18.2 21.6 -28.9 13.9 11.8Olives 4.8 20.6 17.7 11.5 6.8 4.2 6.6Dates 12.8 22.0 15.3 18.9 -38.8 12.6 9.3Watermelon 11.2 17.2 14.1 16.3 -37.5 11.0 7.6Lamb 9.0 10.2 4.6 25.1 28.5 13.6 11.8Apricots 13.6 27.4 20.4 21.8 -32.5 14.4 11.6Honey 9.2 9.6 7.5 11.4 -44.1 8.2 4.1Grapefruit 16.1 33.5 25.4 26.0 -33.4 17.1 14.2Honeydew 12.8 21.9 17.8 19.1 -38.1 12.8 9.5Artichokes 23.6 59.6 39.5 43.1 -14.6 27.0 25.3

59
Table 9: Percent Change in Nutrient Revenues under Alternative Diet Recommendations (Little Nutrient Substitution)
USDA FGP 1992
Harvard Mayo Clinic Mediterranean
Atkins DASH My Pyramid2005
Nutrientsa
—Percent change in gross revenue—
Macronutrients Protein 19.5 20.8 7.4 54.6 75.5 33.5 26.4CHO 10.7 6.6 7.2 9.9 -67.2 9.2 1.8Fiber 76.4 244.6 159.5 138.4 -7.2 87.2 90.5SFA -35.2 -57.2 -34.2 -41.8 45.8 -45.0 -36.3MUFA -23.3 -22.7 3.0 -27.1 84.9 -24.4 -20.2Omega 3s 18.0 8.3 17.4 -32.2 -48.3 -49.7 -15.4Omega 6s 20.0 -14.3 -23.7 -35.9 -38.9 -26.9 55.6Other PUFAb -90.9 -86.3 -80.8 -88.4 -33.3 -84.5 -86.7Cholesterol
-13.7 -80.0 -51.0 -41.5 220.4 -26.3 -18.8
Micronutrients Vitamin A -9.7 84.4 84.6 -16.4 -29.0 -15.7 -7.2Vitamin C 55.9 144.7 173.3 84.0 -30.6 57.9 75.5Vitamin E 0.9 5.9 47.7 7.6 6.2 52.8 117.5Calcium 38.7 -8.0 12.5 51.8 -12.2 25.7 60.4Iron 21.8 60.8 -0.9 19.8 -0.7 12.6 26.8Sodium -34.9 -52.8 -44.4 -30.0 -9.1 -28.5 -43.0
a CHO denotes carbohydrates; SFA denotes saturated fatty acids; MUFA denotes monounsaturated fatty acids; Omega 3s denotes omega 3 fatty acids; Omega 6s denotes omega 6 fatty acids; PUFA denotes polyunsaturated fatty acids.
b Other PUFA= (Total PUFA – Omega 3s – Omega 6s)

60
Table 10a: Percent Change in Crop Revenues under Alternative Diet Recommendations (Little Nutrient Substitution)
USDA FGP 1992
Harvard Mayo Clinic Mediterranean
Atkins DASH My Pyramid2005
Selected Crops Ranked by Value (1 to 25)
—Percent change in gross revenue—
Fat-Free Milk 13.4 11.4 7.7 26.3 -8.6 17.3 11.7Whole Milk 3.9 -2.1 0.7 11.4 4.6 4.0 2.8Grapes 15.4 22.6 19.2 19.5 -56.5 15.0 9.7Beef -7.7 -11.4 -5.7 3.0 64.0 -5.7 -3.9Romaine Lettuce 40.4 113.9 75.3 73.4 -2.6 45.8 46.0Almonds 8.8 26.5 21.7 16.7 37.8 8.3 21.3Oranges 23.3 50.3 38.1 35.7 -46.4 24.8 20.5Strawberries 27.8 66.2 48.0 44.0 -40.0 29.4 27.0Canned Tomatoes 25.1 58.3 38.9 43.0 -26.3 28.4 25.2Rice 12.5 12.9 9.0 15.4 -51.5 12.0 6.1Broccoli 32.9 81.0 55.1 61.0 -4.8 39.4 36.6Salad Greens 41.7 116.9 76.0 78.8 8.3 49.2 49.1Peaches 20.5 42.3 31.2 30.9 -44.2 22.1 18.6Chicken 17.5 19.1 6.3 49.0 70.2 29.6 24.5Avocados 12.4 54.5 42.9 26.0 31.6 12.5 21.9Pistachios 10.5 23.8 17.0 15.6 20.7 7.1 18.8Walnuts 15.6 12.5 3.7 -2.1 -2.8 -7.5 29.2Lemons 30.0 73.7 52.3 49.4 -35.2 32.8 30.1Celery 15.0 21.3 15.0 24.5 -24.8 16.6 13.5Eggs 3.5 -0.2 -0.9 17.2 59.9 6.5 9.8Plums 19.0 37.4 29.0 27.4 -49.0 19.7 15.3Nectarines 20.7 43.2 31.5 31.5 -42.7 22.4 19.2Onions 20.4 40.1 29.9 30.9 -46.0 21.6 16.9Potatoes 20.2 38.6 28.7 30.5 -44.3 21.4 16.6Fresh Tomatoes 27.4 66.2 45.7 46.0 -24.6 30.3 29.2Bell Peppers 32.3 82.2 57.6 55.3 -25.5 36.2 34.2

61
Table 10b: Percent Change in Crop Revenues under Alternative Diet Recommendations (Little Nutrient Substitution)
USDA FGP 1992
Harvard Mayo Clinic Mediterranean Atkins DASH My Pyramid2005
Selected Crops Ranked by Value (26 to 50)
—Percent change in gross revenue— Cauliflower 35.9 92.3 62.9 65.0 -9.1 41.6 39.6Spinach 34.4 89.4 57.8 66.7 13.4 41.5 40.1Wheat 21.2 42.8 27.7 33.7 -34.7 23.3 19.5Turkey 14.0 13.0 2.7 38.6 64.8 22.2 22.2Garlic 16.8 23.7 18.1 24.8 -40.0 17.7 12.9Cherries 20.1 39.3 29.2 29.3 -48.8 20.7 16.2Cantaloupe 17.4 32.3 25.4 24.8 -48.2 17.6 12.7Mushrooms 26.7 57.3 34.9 52.5 11.8 33.3 30.8Dried Plums 22.5 52.2 36.5 33.8 -50.2 23.9 20.4Apples 22.6 49.5 36.6 33.2 -52.3 23.5 19.7Carrots 28.1 74.7 51.2 46.4 -36.6 30.7 27.9Pears 24.4 55.3 40.0 36.8 -50.1 25.6 21.9Asparagus 34.3 88.6 56.4 64.9 3.1 41.5 39.9Pink Beans 22.5 45.2 28.1 38.5 -21.9 25.6 21.4Sweet Potatoes 20.6 47.0 33.9 31.8 -45.1 21.9 17.1Corn, Ear 19.4 37.5 26.7 29.4 -35.8 20.1 17.4Olives 3.8 30.0 26.5 11.5 28.9 2.7 8.4Dates 18.1 32.3 22.1 24.7 -53.8 17.9 12.9Watermelon 15.0 23.1 19.1 19.9 -51.2 14.9 9.8Lamb 11.1 11.0 2.5 35.9 68.2 19.7 17.5Apricots 19.6 41.7 30.6 30.1 -42.3 21.1 17.1Honey 11.5 9.7 7.8 11.1 -63.5 9.8 3.5Grapefruit 23.9 52.4 39.2 37.2 -43.9 25.7 21.6Honeydew 17.9 31.4 25.6 24.8 -52.3 18.0 13.0Artichokes 37.6 100.2 65.5 68.3 -9.9 43.8 41.9

62
References Alston, J.M., G.W. Norton, and P.G. Pardey. Science Under Scarcity: Principles and Practice for Agricultural Research Evaluation and Priority Setting. Ithaca, New York: Cornell University Press, 1995. Alston, J.M., D.A. Sumner, and S.A. Vosti. “The Effects of Agricultural Research and Farm Subsidy Policies on Human Nutrition and Obesity.” Selected Paper of the 2005 Annual Meeting, American Agricultural Economics Association. Providence, RI. July 2005. American Dietetic Association “Position of the American Dietetic Association: Functional Foods.” Journal of the American Dietetic Association 99(October 1999): 1278-1285. Armington, P.S. “A Theory of Demand for Products Distinguished by Place of Production.” IMF Staff Papers 16 (March 1969): 159-176. Beatty, T.K.M., and J.T. LaFrance. “United States Demand for Food and Nutrition in the Twentieth Century.” American Journal of Agricultural Economics 87 (December 2005):1159-1166. Block, G., B. Patterson, and A. Subar. “Fruit, Vegetables, and Cancer Prevention: A Review of the Epidemiological Evidence.” Nutrition and Cancer 18 (January 1992):1-29. Bray, G.A. “The epidemic of obesity and changes in food intake: The fluoride hypothesis.” Physiology and Behavior 82 (August 2004): 115-121. Bray, G.A., S.J. Nielsen, and B.M. Popkin. “Consumption of high-fructose corn syrup in beverages may play a role in the epidemic of obesity.” American Journal of Clinical Nutrition 79 (2004): 537-543. California Department of Food and Agriculture: National Agricultural Statistics Services. Summary of County Agricultural Commissioners’ Reports. Sacramento CA, various issues. http://www.nass.usda.gov/ca/bul/agcom/indexcav.htm California Walnut Commission. U.S. Dietary Guidelines and Food Pyramid Update. California Walnut Commission Fall Update. September 2004. Craddick, S.R., P.J. Elmer, E. Obarzanek, W.M. Vollmer, L.P. Svetkey, and M.C. Swain. “The DASH diet and blood pressure.” Current Atherosclerosis Reports 5 (November 2003): 484-491. Cutler, D.M., E.L. Glaeser, and J.M. Shapiro. “Why Have Americans Become More Obese?” Journal of Economic Perspectives 17 (Summer 2003):93-118. Davies C.A., P. Britten, and E.F. Myers. “Past, present, and future of the Food Guide Pyramid.” Journal of the American Dietetic Association 101(August 2001): 881-885.
63
Debusk, R.M., C.P. Fogarty, J.M. Ordovas, and K.S. Kornman. “Nutritional Genomics in Practice: Where Do We Begin?” Journal of the American Dietetic Association 105 (April 2005):589-598. Doyle, L., and R.D. Cashman. “The DASH diet may have beneficial effects on bone health.” Nutrition Review 62 (May 2004): 215-220. Drichoutis, A., P. Lazaridis, and R.M. Nayga Jr. “Determinants of Consumers’ Use of Nutritional Food Labels.” Global Business and Economics Review 6 (2004): 320-332. Frazao, E. “High Costs of Poor Eating Patterns in the United States.” Chapter 1 in America’s Eating Habits: Changes and Consequences. Food and Rural Economics Division, Economic Research Service, USDA. Agriculture Information Bulletin No. 750 (AIB-750). April, 1999. Fung T.T., W.C. Willett, M.J. Stampfer, J.E. Manson, and F.B. Hu. “Dietary patterns and the risk of coronary heart disease in women.” Archives of Internal Medicine 161 (August 2001):1857-1862. Gaby, A.R. “Adverse effects of dietary fructose.” Alternative Medicine Review 10 (December 2005): 294-306. George, P.S., and G.A. King. Consumer Demand for Food Commodities in the United States with Projections for 1980. Giannini Foundation Monograph Number 26. Davis, California: University of California, Davis, March 1971. Haddad, L. What Can Food Policy Do to Redirect the Diet Transition? Washington, D.C. International Food Policy Research Institute, Food Consumption and Nutrition Division Discussion Paper No. 165. December 2003. Harsha, D.W., F.M. Sacks, E. Obarzanek, L.P. Svetkey, P.H. Li, G.A. Bray, M. Aickin, P.R. Conlin, E.R. Miller, and L.J. Appel. “Effect of Dietary Sodium Intake on Blood Lipids: Results From the DASH–Sodium Trial.” Hypertension 43 (January 2004): 393-398. Hausler, C.M. “Functional foods: Their role in disease prevention and health promotion.” Food Technology 52 (November 1998): 63-70. He, S., S. Fletcher, and A. Rimal. “Nutrition Consideration in Food Choice.” Journal of Food Distribution Research 35 (March 2004): 124-126. Hedley, A.A., C.L. Ogden, C.L. Johnson, M.D. Carroll, L.R. Curtin, and K.M. Flegal. “Overweight and obesity among US children, adolescents, and adults, 1999-2002.” Journal of American Medical Association 291 (June 2004):2847-2850. Hu F.B., L. Bronner, W.C. Willett, M.J. Stampfer, K.M. Rexrode, C.M. Albert, D. Hunter, and J.E. Manson. “Fish and omega-3 fatty acid intake and risk of coronary heart disease in women.” Journal of the American Medical Association 287 (April 2002):1815-1821.

64
Hu F.B., M.J. Stampfer, J.E. Manson, E. Rimm, G.A. Colditz, B.A. Rosner, C.H. Hennekens, and W.C. Willett. “Dietary fat intake and the risk of coronary heart disease in women.” New England Journal of Medicine 337 (November 1997):1491-1499. Huang, K.S. U.S. Demand for Food: A Complete System of Price and Income Effects. Technical Bulletin Number 1714. Washington DC: United States Department of Agriculture, Economic Research Service, December 1985. Huang, K.S., and B. Lin. Estimation of Food Demand and Nutrient Elasticities from Household Survey Data. Technical Bulletin Number 1887. Washington DC: United States Department of Agriculture, Economic Research Service, August 2000. Jeter, K.M., J.A. Chalfant, and D.A. Sumner. “An Analysis of the Private Costs and Benefits to Californians from Eating the USDA Recommendations for Fruits and Vegetables.” Paper Presentation at the Society for Nutrition Education Meetings, Oakland, CA. July 2001. Jeter, K.M., J.A. Chalfant, and D.A. Sumner. Does 5-a-Day Pay? Potential Gains to Growers from Increasing Consumption of Fruits and Vegetables to Recommended Levels in a Cancer Prevention Diet. University of California Agricultural Issues Brief 27, August 2004. Johnson, D.G. “Population, Food, and Knowledge.” The American Economic Review 90 (March 2000):1-14. Kim, S, R.M. Nayga Jr., and O. Capps Jr. “Health Knowledge and Consumer Use of Nutritional Labels: The Issue Revisited.” Agricultural and Resource Economics Review 30 (April 2001): 10-19. Loureiro, M.L., and R.M. Nayga Jr. “International Dimensions of Obesity and Overweight Related Problems: An Economics Perspective.” American Journal of Agricultural Economics 87 (December 2005):1147-1153. Manson J.E., D.M. Nathan, A.S. Krolewski, M.J. Stampfer, W.C. Willett, and C.H. Hennekens. “A prospective study of exercise and incidence of diabetes among US male physicians.” Journal of the American Medical Association 268 (July 1992):63-67. Manson J.E., F.B. Hu, J.W. Rich-Edwards, G.A. Colditz, M.J. Stampfer, W.C. Willett, F.E. Speizer, and C.H Hennekens. “A prospective study of walking as compared with vigorous exercise in the prevention of coronary heart disease in women.” New England Journal of Medicine 341 (August 1999):650-8. Milner, J.A. “Functional foods and health: A U.S. perspective.” British Journal of Nutrition 88 (2002): S151-S158.
65
Muth, R.F. “The Derived Demand Curve for a Productive Factor and the Industry Supply Curve.” Oxford Economic Papers 16 (July 1964): 221-234. National Heart, Lung, and Blood Institute, NHLBI Publication # 03-4082, “The DASH Eating Plan” May 2003. Nayga, R.M. Jr. “Toward an Understanding of Consumers’ Perceptions of Food Labels.” International Food and Agribusiness Management Review 2 (January 1999): 29-45. Nayga R.M. Jr. “Looking for the Nutritional Label: Does it Make a Difference?” Choices: The Magazine of Food, Farm, and Resource Issues 16 (October 2001): 39-42. O’Brien, P. “Dietary Shifts and Implications for U.S. Agriculture.” American Journal of Clinical Nutrition 61(June 1995):1390S-1396S. O’Connor G.T., C.H. Hennekens, W.C. Willett, S.Z. Goldhaber, R.S. Paffenbarger Jr., J.L. Breslow, I.M. Lee, and J.E. Buring. “Physical exercise and reduced risk of nonfatal myocardial infarction.” American Journal of Epidemiology 142 (December 1995):1147- 1156. Office of the Law Revision Counsel of the U.S. House of Representatives. United States Code, Title 7, Chapter 55. 1862. Philipson, T. “The World-wide Growth in Obesity: An Economic Research Agenda.” Health Economics 10 (January 2001):1-7. Piggott, R.R. “Some Old Truths Revisited.” Australian Journal of Agricultural and Resource Economics 36 (August 1992): 117-140. Richards, T. and P. Patterson. “Native American Obesity: An Economic Model of the Thrifty Gene Theory.” Selected Paper of the 2004 Annual Meeting, Western Agricultural Economics Association. Honolulu, HI. July 2004. Rimm E.B., M.J. Stampfer, A. Ascherio, E. Giovannucci, G.A. Colditz, and W.C. Willett. “Vitamin E consumption and the risk of coronary heart disease in men.” New England Journal of Medicine 328 (May 1993):1450-1456. Stampfer M.J., C.H. Hennekens, J.E. Manson, G.A. Colditz, B. Rosner, and W.C. Willett. “Vitamin E consumption and the risk of coronary disease in women.” New England Journal of Medicine 328 (May 1993):1444-1449. Sumner, D.A., J.M. Alston, and R. Gray. A Quantitative Analysis of the Effects of Wheat Imports on the U.S. Market for Wheat Including the Impact on Deficiency Payments. Davis, California: Prepared for the Canadian Wheat Board, April 1994.
66
Tanasescu M., M.F. Leitzmann, E.B. Rimm, W.C. Willett, M.J. Stampfer, and F.B. Hu. “Exercise type and intensity in relation to coronary heart disease in men.” Journal of the American Medical Association 288 (October 2002):1994-2000. United States Department of Agriculture: Agricultural Research Service. Continuing Survey of Food Intake by Individuals. Washington, D.C., 1997. United States Department of Agriculture: Agricultural Research Service. USDA National Nutrient Database for Standard Reference, Release 18. Washington, D.C., 2004. Available at http://www.nal.usda.gov/fnic/foodcomp United States Department of Agriculture: National Agricultural Statistics Services. Agricultural Statistics. Washington, D.C., various issues. Available at http://www.usda.gov/nass/pubs/agstats.htm United States Departments of Health and Human Services and Agriculture. Nutrition and Your Health: Dietary Guidelines for Americans. Washington, D.C., various issues. Available at http://www.health.gov/dietaryguidelines Volek J.S., and E.C. Westman. “Very-low-carbohydrate weight-loss diets revisited.” Cleveland Clinic Journal of Medicine 69 (November 2002):849-858. Welsh S.O., C. Davis, and A. Shaw. USDA’s Food Guide: Background and Development. United States Department of Agriculture, Publication No. 1514. September 1993. Young, C.E., and L.S. Kantor. Moving Toward the Food Guide Pyramid: Implications for U.S. Agriculture. Food and Rural Economics Division, Economic Research Service, USDA. Agricultural Economic Report No. 779 (AER-779). July 1999.

67
Appendix A: The USDA Food Guide Pyramid (1992)
Source: U.S. Department of Agriculture and the U.S. Department of Health and Human Services

68
Appendix B: Harvard Food Guide Pyramid
Source: EAT, DRINK, AND BE HEALTHY by Walter C. Willett, MD copyright Simon & Schuster 2001.

69
Appendix C: Mayo Clinic Food Guide Pyramid
Source: http://www.mayoclinic.org/news2000-av/pyramid1.jpg

70
Appendix D: Mediterranean Food Guide Pyramid
Source: K. Dun Gifford, Oldways Preservation & Exchange Trust http://www.oldwayspt.org/pyramids/med/p_med.html

71
Appendix E: Atkins Food Guide Pyramid
Source: http://atkins.com/Archive/2004/2/10-121449.html

72
Appendix F: The DASH Eating Plan
Food Group
Daily Servings (except
as noted)
Serving Sizes
Grains & grain products 7-8 1 slice bread 1 cup ready-to-eat cereala
cup cooked rice, pasta, or cereal
Vegetables 4-5 1 cup raw leafy vegetable cup cooked vegetable
6 ounces vegetable juice
Fruits 4-5 1 medium fruit cup dried fruit cup fresh, frozen, or canned fruit
6 ounces fruit juice
Lowfat or fat free dairy foods
2-3 8 ounces milk 1 cup yogurt 1 ounces cheese
Lean meats, poultry, and fish
2 or less 3 ounces cooked lean meats, skinless poultry, or fish
Nuts, seeds, and dry beans 4-5 per week
1/3 cup or 1 ounces nuts 1 tablespoon or ounce seeds
cup cooked dry beans
Fats & oilsb 2-3 1 teaspoon soft margarine 1 tablespoon lowfat mayonnaise 2 tablespoons light salad dressing 1 teaspoon vegetable oil
Sweets 5 per week 1 tablespoon sugar 1 tablespoon jelly or jam
ounce jelly beans 8 ounces lemonade
a Serving sizes vary between cup and 1 cups. Check the product’s nutrition label. b Fat content changes serving counts for fats and oils. For example: 1 tablespoon of regular salad dressing equals 1 serving; 1 tablespoon of a low-fat dressing equals serving; 1 tablespoon of a fat-free dressing equals 0 servings.
Source: National Heart Lung Blood Institute http://www.nhlbi.nih.gov/hbp/prevent/h_eating/h_e_dash.htm

73
Appendix G: USDA’s MyPyramid.gov (2005)
Source: MyPyramid.gov, United States Department of Agriculture. http://www.mypyramid.gov/

74
Appendix H: Armington Matrix of Own- and Cross- Price Elasticitiesa for Selected Macronutrients
Protein CHO Fiber SFA
MUFA Omega 3s
Omega 6s
Other PUFA
Cholesterol
Selected Macronutrients
Consumption Share (%)
Demand Elasticity with Respect to the Price of:
Protein 17.4 -0.91 0.09 0.91 0.91 0.91 0.91 0.91 0.91 0.91CHO 59.2 0.29 -0.70 0.29 0.29 0.29 0.29 0.29 0.29 0.29Fiber 3.6 0.02 0.02 -0.98 0.02 0.02 0.02 0.02 0.02 0.02SFA 6.0 0.03 0.03 0.03 -0.97 0.03 0.03 0.03 0.03 0.03MUFA 6.7 0.03 0.03 0.03 0.03 -0.97 0.03 0.03 0.03 0.03Other PUFA 0.3 0 0 0 0 0 -1.00 0 0 0Omega 3s 3.0 0.02 0.02 0.02 0.02 0.02 0.02 -0.99 0.02 0.02Omega 6s 3.5 0.02 0.02 0.02 0.02 0.02 0.02 0.02 -0.98 0.02Cholesterol 0.1 0.02 0.02 0.02 0.02 0.02 0.02 0.02 0.02 -1.00
a Appendix H provides the baseline elasticities that were used to calculate the results in Table 7 where some substitution between nutrient groups was allowed.
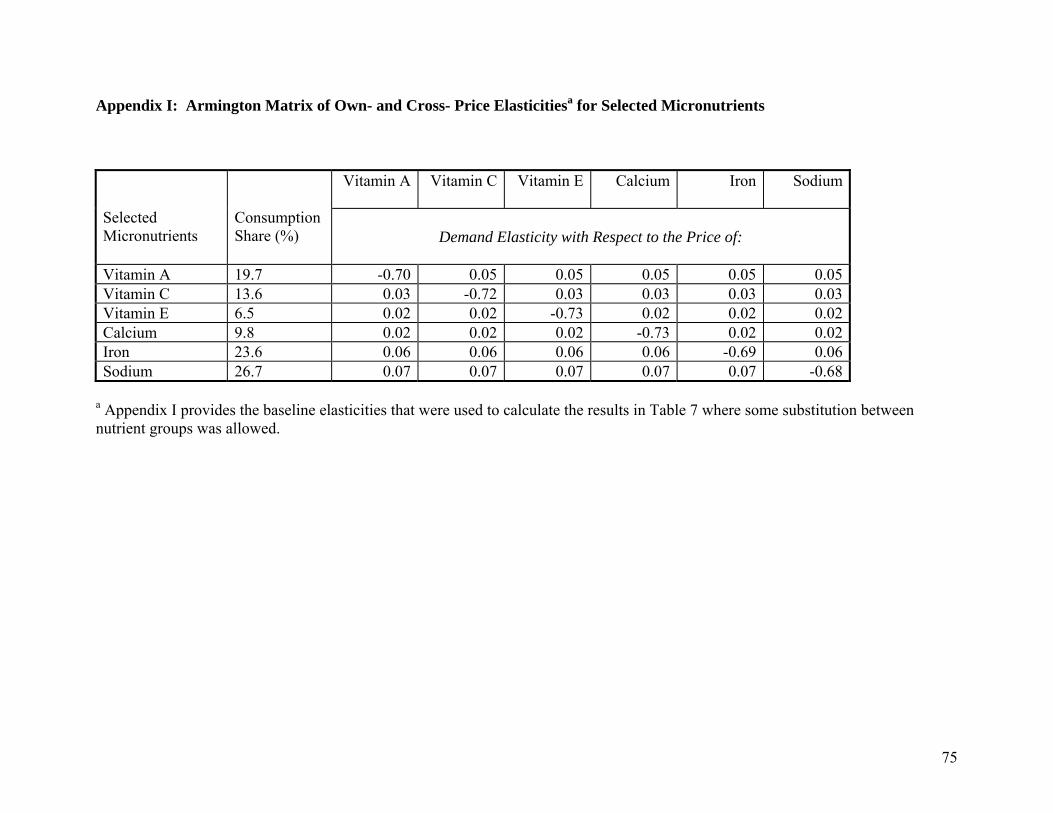
75
Appendix I: Armington Matrix of Own- and Cross- Price Elasticitiesa for Selected Micronutrients
Vitamin A Vitamin C Vitamin E Calcium Iron Sodium Selected Micronutrients
Consumption Share (%)
Demand Elasticity with Respect to the Price of:
Vitamin A 19.7 -0.70 0.05 0.05 0.05 0.05 0.05Vitamin C 13.6 0.03 -0.72 0.03 0.03 0.03 0.03Vitamin E 6.5 0.02 0.02 -0.73 0.02 0.02 0.02Calcium 9.8 0.02 0.02 0.02 -0.73 0.02 0.02Iron 23.6 0.06 0.06 0.06 0.06 -0.69 0.06Sodium 26.7 0.07 0.07 0.07 0.07 0.07 -0.68
a Appendix I provides the baseline elasticities that were used to calculate the results in Table 7 where some substitution between nutrient groups was allowed.