examining barriers to trade in used vehicles - usitc · office of industries working paper id-044...
TRANSCRIPT

Office of Industries Working Paper ID-044 August 2016
Disclaimer: Office of Industries working papers are the result of the ongoing professional research of USITC staff and solely represent the opinions and professional research of individual authors. These papers do not necessarily represent the views of the U.S. International Trade Commission or any of its individual Commissioners.
Examining Barriers to Trade in Used Vehicles David Coffin, Jeff Horowitz, Danielle Nesmith, and Mitchell Semanik
Abstract
Used vehicles represent a significant share of global vehicle trade, but many countries have policies in place that specifically limit used vehicle imports. Among five top passenger vehicle exporting countries (Canada, Japan, Korea, Mexico, and the United States), the United States is the largest exporter of used vehicles, with used vehicle exports accounting for an estimated 14 percent of total U.S. vehicle exports in 2014. Developing countries tend to show a preference for used vehicles versus new vehicles due to cost savings and greater product varieties. Top used vehicle markets include the United Arab Emirates, Russia, Nigeria, Mexico, and Burma. This paper uses a gravity model to estimate how policies from 140 countries limited used vehicle exports from five of the top passenger vehicle exporting countries, updating and improving on research published in 2006. Policies that almost entirely ban used vehicle imports are found to reduce used vehicle imports by 76 percent, while other policies limiting used vehicle imports reduce imports of used vehicles by 38 percent.

United States International Trade Commission
Address Correspondence To:
Office of Industries U.S. International Trade Commission Washington, DC 20436 USA
Examining Barriers to Trade in Used Vehicles
www.usitc.gov
Examining Barriers to Trade in Used Vehicles David Coffin, Jeff Horowitz, Danielle Nesmith, and Mitchell Semanik
Office of Industries and Office of Economics U.S. International Trade Commission (USITC) August 2016
The authors are staff with the Office of Industries and Office of Economics of the U.S. International Trade Commission (USITC). Office of Industries working papers are the result of the ongoing professional research of USITC staff and solely represent the opinions and professional research of individual authors. These papers do not necessarily represent the views of the U.S. International Trade Commission or any of its individual Commissioners. Working papers are circulated to promote the active exchange of ideas between USITC staff and recognized experts outside the USITC, and to promote professional development of office staff by encouraging outside professional critique of staff research.
This paper represents solely the views of the authors and is not meant to represent the views of the U.S. International Trade Commission or any of its commissioners. Please direct all correspondence to David Coffin, Office of Industries, U.S. International Trade Commission, 500 E Street, SW, Washington, DC 20436, telephone: 202-205-2232, fax: 202-205-2018, email: [email protected].
United States International Trade Commission
Examining Barriers to Trade of Used Vehicles
August 2016 No. ID-044

United States International Trade Commission
This working paper was prepared by:
David Coffin, [email protected]
Jeffrey Horowitz, [email protected]
Mitchell Semanik, [email protected]
Administrative Support
Monica Sanders

Table of Contents Introduction ................................................................................................................................ 3 Global Demand for Used Vehicles .............................................................................................. 4
Why Low-income Countries Import Used Vehicles ................................................................ 5 Effect of Used Vehicle Imports on Low-Income Countries ..................................................... 6 Effect of Used Vehicle Exports on High-Income Countries ..................................................... 7
Used Passenger Vehicle Trade .................................................................................................... 8
Used Passenger Vehicle Exporters .......................................................................................... 8 Top Markets for Used Vehicle Exports ................................................................................... 9
Tariff and Nontariff Measures Affecting Used Vehicle Trade .................................................. 11
Types of Measures ................................................................................................................ 12 Reasons for Measures that Limit Used Vehicle Imports ....................................................... 13
Gravity Model ........................................................................................................................... 14
Independent Variables .......................................................................................................... 17 Dependent Variable .............................................................................................................. 19
Results ....................................................................................................................................... 22 Conclusion ................................................................................................................................. 27
Future Research .................................................................................................................... 28
Bibliography .............................................................................................................................. 30
Appendix A Used Vehicle Trade and Restrictiveness ......................................... 33 Appendix B Data from Figures Used in Report .................................................. 38 Appendix C Formulas ........................................................................................ 40 Figures Figure 1: Share of 2014 global passenger vehicle exports included in model ............................... 4 Figure 2: Used vehicle exports, 2010–2014 (billions $) .................................................................. 9 Figure 3: Shares of exports of all vehicles and used vehicles from Canada, Japan, Korea, Mexico, and the United States to the world, 2010–2014 ............................................................ 10 Figure 4: World political map by level of used vehicle import restriction ................................... 18 Figure 5: Reported and estimated U.S. and Canadian used vehicle exports, 2010–14 ............... 21
Tables Table 1: Top markets for used vehicle exports from countries in the model in 2014 ................. 10 Table 2: Examples of countries with various measures affecting used vehicle imports. ............. 12 Table 3: U.S. and Canadian passenger vehicle-related HS subheadings ...................................... 20 Table 4: Model results .................................................................................................................. 23
2 | www.usitc.gov
Table 5: U.S. and Japan single country model results .................................................................. 25 Table 6: Comparison between PPML and OLS ............................................................................. 26 Table A.1: Estimated used vehicle imports by importing country and level of restrictiveness, 2010–14 ........................................................................................................................................ 34 Table B.1: Total vehicle exports included and excluded from model, 2010–2014 ...................... 39 Table B.2: Used vehicle exports by reporting country, 2010–2014 ............................................. 39 Table B.3: All vehicle exports by destination country’s level of income ...................................... 39 Table B.4: Used vehicle exports by destination country’s level of income .................................. 39 Table B.5: Reported and estimated used vehicle exports from the United States and Canada .......................................................................................................................................... 39
Examining Barriers to Trade in Used Vehicles
U.S. International Trade Commission | 3
Introduction Exports of used vehicles play a major role in total passenger vehicle exports, but have received relatively little attention from analysts, despite being a significant part of global trade. According to estimates in this paper, used passenger vehicle exports originating in Japan, Canada, the United States, Korea, and Mexico in 2014 represented 0.5 percent ($13.9 billion) of the value of these countries’ total exports and 6 percent of the value of their total passenger vehicle exports that year.1 Used vehicle exports may also affect prices in these countries’ domestic markets for passenger vehicles.
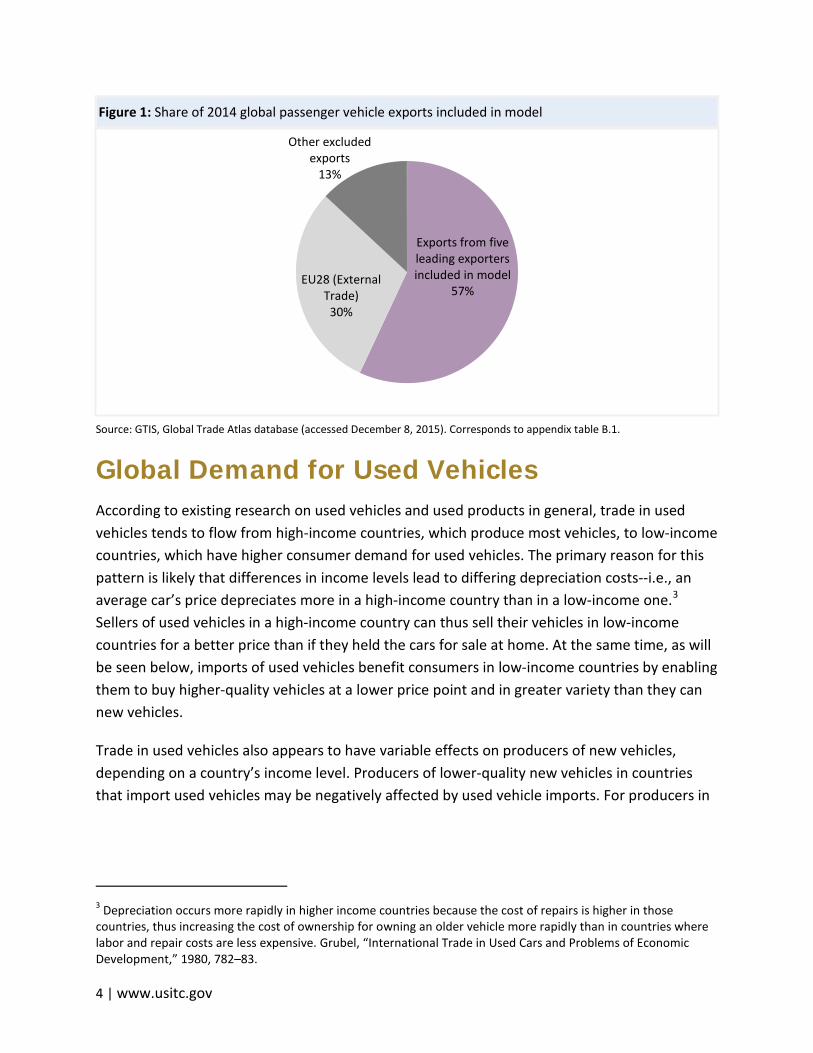
This paper seeks to survey existing research, improve upon existing used vehicle export data, and examine measures that may affect used vehicle trade. The first section looks at global demand for used vehicles, using existing data and literature on how trade in used vehicles affects importer and exporter countries. The second section examines significant markets for used vehicle exports, using existing data. The third section discusses measures limiting used vehicle imports, as well as why these measures may exist. The fourth section introduces the variables used in a gravity estimation of the factors driving the differences in used vehicle imports by country; the variables include several created solely for this study. The gravity estimation uses estimated used vehicle exports from the United States and Canada, combined with data on such exports from Japan, Korea, and Mexico. These countries are five of the six largest global exporters of passenger vehicles (figure 1).2 The fifth section discusses the results of the gravity estimation. The final section analyzes and explains the results.
1 From here on, the phrases “new vehicle” and “used vehicle” will be used in place of “new passenger vehicle” and “used passenger vehicle.” Passenger vehicles include cars, sport-utility vehicles, crossovers, minivans, and pickup trucks of less than five tons. Large vans for the transport of more than eight people, or trucks larger than five tons are not included because they tend to be manufactured by a different set of companies. Moreover, their ownership and trade patterns tend to differ from those vehicles included in the passenger vehicle category. 2 The European Union (EU), the other top-six exporter, was not included because its vehicle export data does not include separate codes for used vehicles. GTIS, Global Trade Atlas database (accessed December 8, 2015).
4 | www.usitc.gov
Figure 1: Share of 2014 global passenger vehicle exports included in model
Source: GTIS, Global Trade Atlas database (accessed December 8, 2015). Corresponds to appendix table B.1.
Global Demand for Used Vehicles According to existing research on used vehicles and used products in general, trade in used vehicles tends to flow from high-income countries, which produce most vehicles, to low-income countries, which have higher consumer demand for used vehicles. The primary reason for this pattern is likely that differences in income levels lead to differing depreciation costs--i.e., an average car’s price depreciates more in a high-income country than in a low-income one.3 Sellers of used vehicles in a high-income country can thus sell their vehicles in low-income countries for a better price than if they held the cars for sale at home. At the same time, as will be seen below, imports of used vehicles benefit consumers in low-income countries by enabling them to buy higher-quality vehicles at a lower price point and in greater variety than they can new vehicles.
Trade in used vehicles also appears to have variable effects on producers of new vehicles, depending on a country’s income level. Producers of lower-quality new vehicles in countries that import used vehicles may be negatively affected by used vehicle imports. For producers in
3 Depreciation occurs more rapidly in higher income countries because the cost of repairs is higher in those countries, thus increasing the cost of ownership for owning an older vehicle more rapidly than in countries where labor and repair costs are less expensive. Grubel, “International Trade in Used Cars and Problems of Economic Development,” 1980, 782–83.
Exports from five leading exporters included in model
57% EU28 (External
Trade) 30%
Other excluded exports
13%

Examining Barriers to Trade in Used Vehicles
U.S. International Trade Commission | 5
large high-income countries like the United States, the effect of used vehicle exports on the domestic vehicle market may be negligible.
Why Low-income Countries Import Used Vehicles Consumers in low-income countries tend to show a preference for used vehicles. This preference is driven by three primary factors: limited new offerings, price differentials, and differing depreciation rates. First, only a limited number of new vehicles, whether domestically produced or imported, are offered for sale in most developing countries, so a consumer in a developing country may find an imported used vehicle of a particular type more easily than a new one. Second, imported used vehicles tend to be less expensive than new vehicle imports. For example, the average cost of a new vehicle exported from the United States in 2014 under export codes specific to new vehicles was nearly $28,000, but the average value of a used vehicle exported from the United States that year was approximately $11,000.4 These used vehicles may also be of higher quality than new vehicles exported from other markets, like China or India. Third, repairs in low-income countries tend to be less costly because of the lower cost of labor there, holding down maintenance costs overall.5 Thus, the consumer in a lower-income country may be willing to pay more for a used vehicle than a comparable consumer in a higher-income country, despite used vehicles’ tendency to require more repairs.
Additionally, research on the effects of income on consumer preferences has shown that consumers in lower-income countries tend to have a stronger preference for lower-quality goods than consumers in higher-income countries.6 However, that is not to say that consumers in low-income countries prefer used over new at similar prices, but they are often income-constrained. For example, one study used gravity simulations to verify that increased per capita incomes lessened demand for used vehicles.7
4 USITC/DOC, DataWeb (accessed May 12, 2016). 5 Grubel, “International Trade in Used Cars,” 1980, 782–83. 6 Davis and Kahn, “International Trade in Used Vehicles,” January 2010, 6. 7 Pelletiere and Reinert, “World Trade in Used Automobiles,” 2006, 161–72.

6 | www.usitc.gov
Effect of Used Vehicle Imports on Low-Income Countries According to existing research, consumers in low-income countries benefit from access to imported used vehicles, whereas sales of new vehicles in these countries, particularly cheaper new vehicles, may suffer when imported used vehicles are available.8 An examination of the welfare impact of Cyprus’s liberalization of used vehicle imports on consumers, for example, found that its consumers benefited by several hundred dollars per purchaser, but that most of the benefit came from increased variety rather than from a drop in prices for all vehicles.9 An analysis of the effect of used vehicle import liberalization in Mexico found that greater access to imported used vehicles significantly depressed the sales and prices of new vehicles, Mexican automakers’ annual revenue, and Mexican government revenue, and predicted that further liberalization would have a negative impact on the Mexican economy as a whole.10 This same analysis also revealed a shift in demand from smaller new vehicles to larger used vehicles in Mexico.11
An examination of the U.S. passenger vehicle market over a 20-year period likewise revealed that the producer manufacturing the lowest-priced new vehicles seemed to be the manufacturer most affected by the existence of a used vehicle market (likely due to competition between higher-end used vehicles and lower-end new vehicles).12 Increased availability of used vehicles likely negatively affects new vehicle producers in developing countries in a similar fashion. However, a third paper examining the U.S. and Mexican markets argued that “there is no evidence that the increased availability of used vehicles [from the United States] has decreased sales of new vehicles in Mexico.”13 Further, this paper also used data that appeared to show that the decline seen in new small vehicle purchases in Mexico actually began several years before imports of used vehicles increased.14
8 Research on this topic comes from single-country case studies, which may have only limited relevance to an analysis of global trade in used vehicles. 9 Clerides, “Gains from Trade in Used Goods,” December 2004, 2–3. 10 Chu and Delgado, “Used Vehicle Imports Impact,” 2009, 360–62. 11 Chu and Delgado, “Used Vehicle Imports Impact,” 2009, 350. 12 Esteban and Shum, “Durable-good Oligopoly with Secondary Markets,” 2007, 17. 13 Davis and Kahn, “International Trade in Used Vehicles,” January 2010, 3. 14 Davis and Kahn, “International Trade in Used Vehicles,” January 2010, 17, 28.
Examining Barriers to Trade in Used Vehicles
U.S. International Trade Commission | 7
Another question raised about used vehicle imports in low-income countries is their effect on the environment. Emission levels in low-income countries will likely increase as the number of vehicles on the road increases. However, imported newer used vehicles may produce fewer emissions than the older used vehicles already in operation in low-income countries. To the extent that newer imported used vehicles replace older vehicles in low-income countries, imported used vehicles may reduce emissions and pollution overall. One study found, however, that Mexico’s imports of used vehicles from Canada and the United States from 2005 to 2008 lowered its emissions per mile driven, but drove up emissions overall because of the increased number of total vehicles in use in Mexico.15
Effect of Used Vehicle Exports on High-Income Countries The existence of foreign demand for a country’s used vehicles can raise prices in the exporting country for such vehicles, at least modestly.16 These higher prices may also increase trade-in values, and thus increase the likelihood that an aging vehicle’s owner will trade in that vehicle for a new one.
While used vehicle exports may represent a significant percentage of total vehicle exports for some developed countries (e.g., the United States), the positive effects of used vehicle exports on domestic used vehicle prices in developed countries may be quite small. One paper described international trade in used vehicles between developed and developing countries as a “substitute for an explicit ‘cash for clunkers’ program.”17 For example, an analysis of registered vehicles in the United States found that less than 25 percent of the vehicles exported to Mexico in the years examined represented a “net exit” from the U.S. market. In other words, Mexican demand for used vehicles from the United States had little impact on used vehicle sales or prices in the United States; instead, it lessened the number of vehicles reduced to scrap.18
15 This is despite emissions standards only applying to new vehicles, not used ones. Davis and Kahn, “International Trade in Used Vehicles,” January 2010, 13–14. 16 In the United States the effect is quite small because the share of used vehicle exports compared to U.S. sales is quite small. Domestic used vehicle sales totaled 41.9 million in 2013, while only a few hundred thousand used vehicles were exported. The size of the domestic used vehicle market in other countries is unknown, but in those like Japan that discourage long-term vehicle ownership, its domestic market is likely much smaller. Binder, Ward’s Automotive Yearbook, 2014, 220. 17 "Cash for clunkers" is the colloquial name for the Car Allowance Rebate System, a $3 billion dollar U.S. federal scrappage program that provided an incentive for consumers to trade in older high-emission used vehicles and replace them with lower-emissions new vehicles. Davis and Kahn, “International Trade in Used Vehicles,” January 2010, 2. 18 Davis and Kahn, “International Trade in Used Vehicles,” January 2010, 15–16.
8 | www.usitc.gov
Pelletiere and Reinert (2006) found that foreign countries’ nontariff measures limiting used vehicle imports had a statistically significant negative effect on the level of U.S. used vehicle exports to those countries, but the same did not hold true for Japanese used vehicle exports.19 For the United States, they found that countries that have preventive barriers to used vehicle imports were associated with 67 percent fewer U.S. exports to that country.
To the extent that greater international demand drives up used vehicle prices, this increase may boost trade-in values and thus support higher demand for new vehicles.20 For countries with a smaller used vehicle market (e.g., Japan), the effect of used vehicle exports on domestic vehicle prices may be more significant because in a smaller market, the exported used vehicles would represent a larger share of demand for domestic used vehicles.
Used Passenger Vehicle Trade During the period 2010–14, the estimated value of used vehicle exports from the United States, Canada, Japan, Mexico, and Korea rose more slowly than the value of their new vehicle exports. In 2014, the estimated value of these countries’ used vehicle exports was at least $17.6 billion (figure 2).21 This figure represents an increase of at least $2 billion (13 percent) over 2010, when used vehicle exports totaled $15.6 billion. However, during the same 2010–14 period, the total value of exports of both new and used passenger vehicles from these five countries rose 25 percent, from $238.8 billion in 2010 to $298.2 billion in 2014. As a result, the estimated share of used passenger vehicle exports fell from 6.5 percent in 2010 to 5.9 percent in 2014.
Used Passenger Vehicle Exporters Of the five countries included in the gravity estimation, the United States is the largest exporter, Japan is the second largest, and Mexico ranks fifth. Used vehicle exports as a share of vehicle exports vary by country. In the United States, used vehicle exports in 2014 made up 14percent of U.S. vehicle exports by value. In Japan, used vehicle exports in 2014 represented 7 percent of vehicle exports by value.22 Used vehicles accounted for no more than 2 percent of vehicle exports for the other three countries.23
19 Pelletiere and Reinert, “World Trade in Used Automobiles,” 2006, 169–70. 20 Data limitations make it unclear exactly how many used vehicles are exported each year. Sawyers, "Falling used-vehicle values threaten recovery." August 18, 2014. 21 Analyst calculation using USITC/DataWeb data (accessed March 2, 2015); GTIS, Global Trade Atlas database (accessed July 22, 2015). 22 All trade data used in this study are value data, not units. 23 Author calculation based on GTIS data. GTIS, Global Trade Atlas database (accessed July 22, 2015).

Examining Barriers to Trade in Used Vehicles
U.S. International Trade Commission | 9
Figure 2: Used vehicle exports, 2010–2014 (billions $)
Source: Analyst calculation using GTIS, Global Trade Atlas database (accessed July 22, 2015). Corresponds to appendix table B.2.
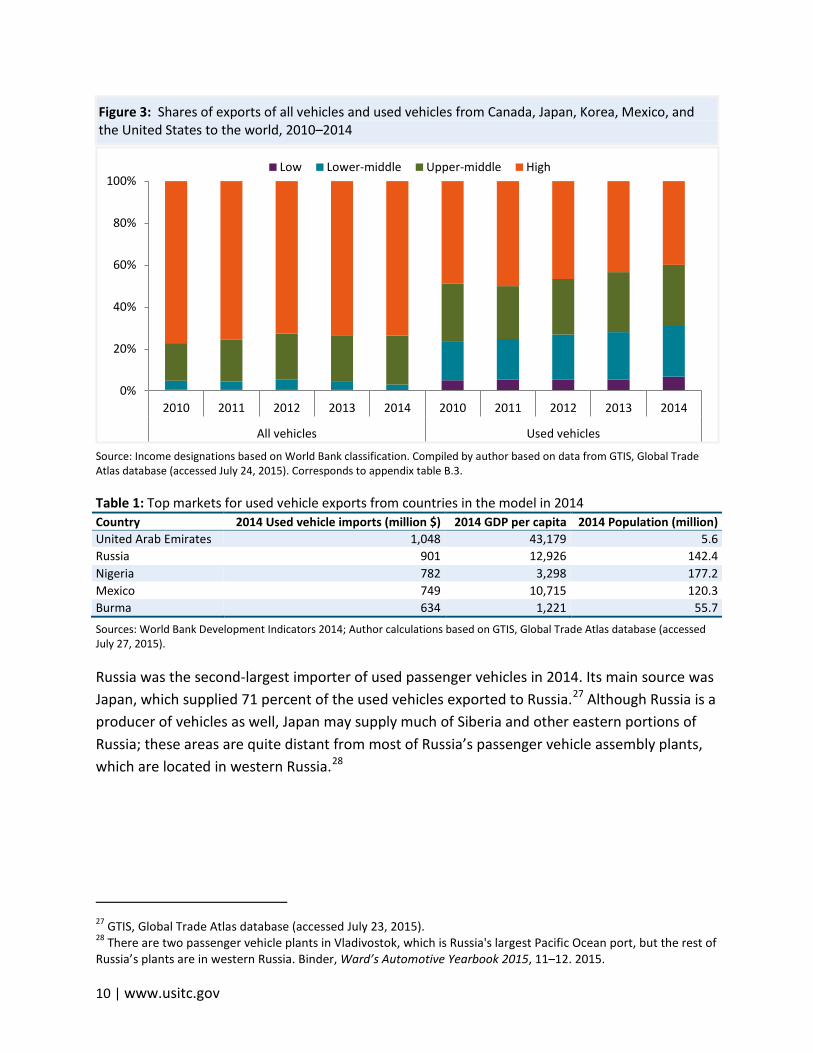
Top Markets for Used Vehicle Exports Low- and lower-middle-income countries tend to import a larger share of used vehicles than they do other vehicles. The chart below shows shares of imports of all vehicles versus imports of used vehicles from Canada, Japan, Korea, Mexico, and the United States (figure 3). In each year, low- and lower-middle-income countries absorbed less than 10 percent of total vehicle imports, but as much as 20 percent of used vehicle imports.
Table 1 shows that the markets for used vehicle exports vary greatly in terms of wealth (measured in GDP per capita) and population. Populations in these markets range from less than 10 million to over 177 million. Examining these data uncovers several less-than-obvious factors influencing used vehicle demand.
The United Arab Emirates (UAE) is a major importer of used passenger vehicles. From 2010 to 2014, the European Union (EU), Japan, Korea, Thailand, and the United States reported exporting over 1.4 million vehicles to the UAE.24 The volume of imports seems outsized compared to the population of the UAE, for a relatively high ratio of cars to people. According to World Bank 2014 data, the UAE has a population of over 5.6 million people.25 However, the UAE is also reportedly a major transshipment point.26
24 GTIS, Global Trade Atlas database (accessed January 2, 2015). 25 World Bank Development Indicators 2014 (accessed July 23, 2015). 26 Transshipment is the shipment of goods to an intermediate destination, then to yet another destination. Sadjadpour, “The Battle of Dubai,” July 2011.
15.6
18.4 18.1 18.0 17.6
02468
101214161820
2010 2011 2012 2013 2014
Billi
ons
$
United States Japan Korea Canada Mexico
10 | www.usitc.gov
Figure 3: Shares of exports of all vehicles and used vehicles from Canada, Japan, Korea, Mexico, and the United States to the world, 2010–2014
Source: Income designations based on World Bank classification. Compiled by author based on data from GTIS, Global Trade Atlas database (accessed July 24, 2015). Corresponds to appendix table B.3.
Table 1: Top markets for used vehicle exports from countries in the model in 2014 Country 2014 Used vehicle imports (million $) 2014 GDP per capita 2014 Population (million) United Arab Emirates 1,048 43,179 5.6 Russia 901 12,926 142.4 Nigeria 782 3,298 177.2 Mexico 749 10,715 120.3 Burma 634 1,221 55.7
Sources: World Bank Development Indicators 2014; Author calculations based on GTIS, Global Trade Atlas database (accessed July 27, 2015).
Russia was the second-largest importer of used passenger vehicles in 2014. Its main source was Japan, which supplied 71 percent of the used vehicles exported to Russia.27 Although Russia is a producer of vehicles as well, Japan may supply much of Siberia and other eastern portions of Russia; these areas are quite distant from most of Russia’s passenger vehicle assembly plants, which are located in western Russia.28
27 GTIS, Global Trade Atlas database (accessed July 23, 2015). 28 There are two passenger vehicle plants in Vladivostok, which is Russia's largest Pacific Ocean port, but the rest of Russia’s plants are in western Russia. Binder, Ward’s Automotive Yearbook 2015, 11–12. 2015.
0%
20%
40%
60%
80%
100%
2010 2011 2012 2013 2014 2010 2011 2012 2013 2014
All vehicles Used vehicles
Low Lower-middle Upper-middle High

Examining Barriers to Trade in Used Vehicles
U.S. International Trade Commission | 11
Nigeria’s large domestic vehicle market and relative lack of local new vehicle production are likely the main reasons that Nigeria is the second-largest market for U.S. used passenger vehicle exports in both unit and value terms. Nigeria is a relatively large country, with relatively low GDP per capita. As discussed previously, lower-income countries like Nigeria tend to show a preference for used vehicles. However, Nigeria has policy measures in place that prevent the legal importation of used vehicles more than 10 years old.29
Mexico’s geographic proximity to the United States and moderate GDP per capita likely contribute to Mexico’s position as one of the largest importers of used vehicles. Another major factor has likely been the North American Free Trade Agreement (NAFTA), in which Mexico agreed to remove all policy measures restricting imports of used vehicles from the United States and Canada that were manufactured within the NAFTA region.30 Mexico is a vehicle producer, but most of those vehicles are exported, so it’s used vehicle exports may not have a significant impact on its domestic vehicle market.
Burma imported over $2.2 billion worth of used vehicles from 2010 to 2014. Nearly all (97 percent) of those imports came from Japan.31 Similar to Russia, Burma likely imports high volumes of used vehicles from Japan because Japan is relatively close and has an abundant supply of available used vehicles. Further, Burma has little to no domestic production and a relatively low GDP per capita, making used vehicles a more likely choice for aspiring vehicle buyers.
Tariff and Nontariff Measures Affecting Used Vehicle Trade According to data collected for this report, 80 countries have policy measures in place that limit used vehicle imports.32 Of those 80 countries, 12 completely ban used vehicle imports, while the rest have import licenses, restrictions on the age of the vehicle, or other measures that limit used vehicle imports. These policies are often put in place to protect domestic dealers of new vehicles, to protect the environment from the emissions of used vehicles, or to protect domestic vehicle assembly (if it exists).33 It’s worth noting that the exporters included in the model report used vehicle exports to many of the countries that have laws in place banning the
29 Japanese Car Trade, “Import Rules and Regulations” (accessed July 22, 2015). 30 NAFTA, Appendix 300-A.2 24 (a-f), http://www.sice.oas.org/trade/nafta/anx300a1.asp#Ap300-A.2 . 31 GTIS, Global Trade Atlas database (accessed July 23, 2015). 32 See appendix A for a full listing of countries with measures in place that affect used vehicle imports. 33 Chu and Delgado, “Used Vehicle Imports Impact,” 2009, 348.

12 | www.usitc.gov
import of used vehicles (with exceptions). With the exception of China, these exports are included in the model, because it is assumed that they are being imported under antique, diplomatic, or other exceptions to the import ban. However the sum of all exports to countries with bans on used vehicle imports are only 4.3 percent of the total exports reported in the model in 2014.
Types of Measures There are four main types of tariff and nontariff measures affecting the importation of used vehicles: a complete ban, a ban on vehicles beyond a certain age, higher tariffs for used vehicles, and an import license requirement to legally import a used vehicle (table 2). The simplest, and most extreme, is a ban on all imports of used vehicles. Five South American countries have such a ban, as do several others worldwide. Many other countries restrict imports based on the age of the vehicle, ranging from as few as 3 years to as many as 10. Some countries charge a higher tariff on imports of used vehicles (compared to new vehicles), or cap the level of vehicle depreciation for tax purposes. One final policy that can limit the importation of used vehicles is the requirement of an import license. The state can then limit (or eliminate) the importation of used vehicles based on the number of licenses it distributes per year.34 Restrictions based on the condition of a vehicle are another type of import-limiting measure—one that can be used in conjunction with other policy measures.
Table 2: Examples of countries with various measures affecting used vehicle imports. Type of measure Countries Ban Brazil, Bhutan, Canada,a Chile, China, Colombia, Ecuador, Ethiopia,
Indonesia, Philippines, Sudan, Thailand, Turkey, Uruguay, and Venezuela
Banning imports of older vehicles Algeria, Bangladesh, Barbados, Bolivia, Bosnia, Chad, Cyprus, Dominican Republic, Egypt, El Salvador, Gabon, Honduras, Hungary, India, Jamaica, Kenya, Kuwait, Lebanon, Mauritius, Morocco, Namibia, Nepal, Nicaragua, Nigeria, Oman, Pakistan, Paraguay, Qatar, Saudi Arabia, Senegal, Tanzania, Trinidad and Tobago, and Uzbekistan
Higher tariff Haiti, Russia Import license Argentina, Australia, Botswana, Lesotho, Malaysia, Mexico, South
Africa, Sri Lanka, and Swaziland Source: Database of policy measures compiled by authors. For full list, see Appendix Table A.1.
a Canada does not allow the import of used vehicles unless they meet the Canadian Motor Vehicle Safety Act, which tends to only be vehicles made for the U.S. and Canadian markets.
34 Pelletiere and Reinert, “World Trade in Used Automobiles,” 2006, 163.
Examining Barriers to Trade in Used Vehicles
U.S. International Trade Commission | 13
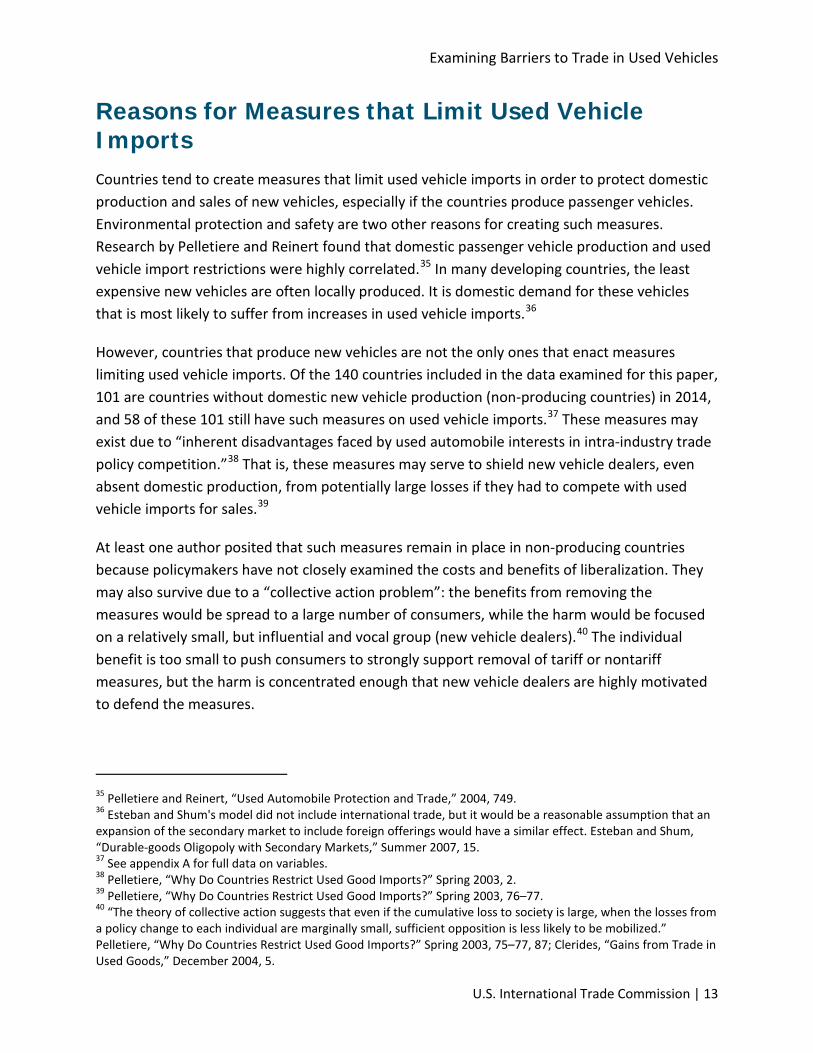
Reasons for Measures that Limit Used Vehicle Imports Countries tend to create measures that limit used vehicle imports in order to protect domestic production and sales of new vehicles, especially if the countries produce passenger vehicles. Environmental protection and safety are two other reasons for creating such measures. Research by Pelletiere and Reinert found that domestic passenger vehicle production and used vehicle import restrictions were highly correlated.35 In many developing countries, the least expensive new vehicles are often locally produced. It is domestic demand for these vehicles that is most likely to suffer from increases in used vehicle imports.36
However, countries that produce new vehicles are not the only ones that enact measures limiting used vehicle imports. Of the 140 countries included in the data examined for this paper, 101 are countries without domestic new vehicle production (non-producing countries) in 2014, and 58 of these 101 still have such measures on used vehicle imports.37 These measures may exist due to “inherent disadvantages faced by used automobile interests in intra-industry trade policy competition.”38 That is, these measures may serve to shield new vehicle dealers, even absent domestic production, from potentially large losses if they had to compete with used vehicle imports for sales.39
At least one author posited that such measures remain in place in non-producing countries because policymakers have not closely examined the costs and benefits of liberalization. They may also survive due to a “collective action problem”: the benefits from removing the measures would be spread to a large number of consumers, while the harm would be focused on a relatively small, but influential and vocal group (new vehicle dealers).40 The individual benefit is too small to push consumers to strongly support removal of tariff or nontariff measures, but the harm is concentrated enough that new vehicle dealers are highly motivated to defend the measures.
35 Pelletiere and Reinert, “Used Automobile Protection and Trade,” 2004, 749. 36 Esteban and Shum's model did not include international trade, but it would be a reasonable assumption that an expansion of the secondary market to include foreign offerings would have a similar effect. Esteban and Shum, “Durable-goods Oligopoly with Secondary Markets,” Summer 2007, 15. 37 See appendix A for full data on variables. 38 Pelletiere, “Why Do Countries Restrict Used Good Imports?” Spring 2003, 2. 39 Pelletiere, “Why Do Countries Restrict Used Good Imports?” Spring 2003, 76–77. 40 “The theory of collective action suggests that even if the cumulative loss to society is large, when the losses from a policy change to each individual are marginally small, sufficient opposition is less likely to be mobilized.” Pelletiere, “Why Do Countries Restrict Used Good Imports?” Spring 2003, 75–77, 87; Clerides, “Gains from Trade in Used Goods,” December 2004, 5.

14 | www.usitc.gov
Emissions reduction is another major reason often given for introducing policies that limit the import of used vehicles, because used vehicles, particularly older ones, tend to have less effective pollution controls. Another researcher, however, has claimed that while officials in non-producing countries may cite environmental and safety reasons when they enact import-limiting policy measures, “the interests of new car dealers are probably foremost in policymakers’ minds.”41
Gravity Model Economic gravity models are intended to predict bilateral trade flows between nations based on the economic sizes of and distance between the countries involved. This paper employs an econometric model that builds upon the gravity framework used by Pelletiere and Reinert in 2006 to model barriers to used vehicle exports from the United States and Japan.42 Our model adds used vehicle export data from three more countries: Canada, Korea, and Mexico. It also includes other components of gravity analysis that, while included in many gravity studies and widely seen as important, were not included in Pelletiere and Reinert’s analysis. Examples include a shared border, a common language, colonial ties, and a free trade agreement (FTA).
Gravity models arose from Newton’s universal law of gravitation in physics. When applied to international trade, the theory states that countries trade in proportion to their respective GDPs and the distance between them.43 Traditionally, gravity models also include things such as whether or not the importer and exporter are landlocked, and whether a pair of countries share a common language, border, colonial history, or FTA. In our case, the GDP of each country may be an imperfect method for estimating demand for used vehicles, as countries with higher GDP per capita demand more new vehicles per capita independent of population. Thus, this model uses total vehicle population and GDP per capita separately.
One relevant criticism of traditional gravity models is that they often fail to account for the multilateral resistance terms (MRTs). MRTs capture the fact that bilateral trade flows are shaped not only by characteristics of trade between a given importer and exporter, but also by characteristics of their trade with other partners. However, this paper proxies MRTs by using exporter fixed effects, which also generate less biased estimates and account for unobserved
41 Clerides, “Gains from Trade in Used Goods,” December 2004, 5. 42 Pelletiere and Reinert. “World Trade in Used Automobiles: A Gravity Analysis of Japanese and U.S. Exports,” 2006, 164. 43 UN and WTO, A Practical Guide to Trade Policy Analysis, 2012.
Examining Barriers to Trade in Used Vehicles
U.S. International Trade Commission | 15
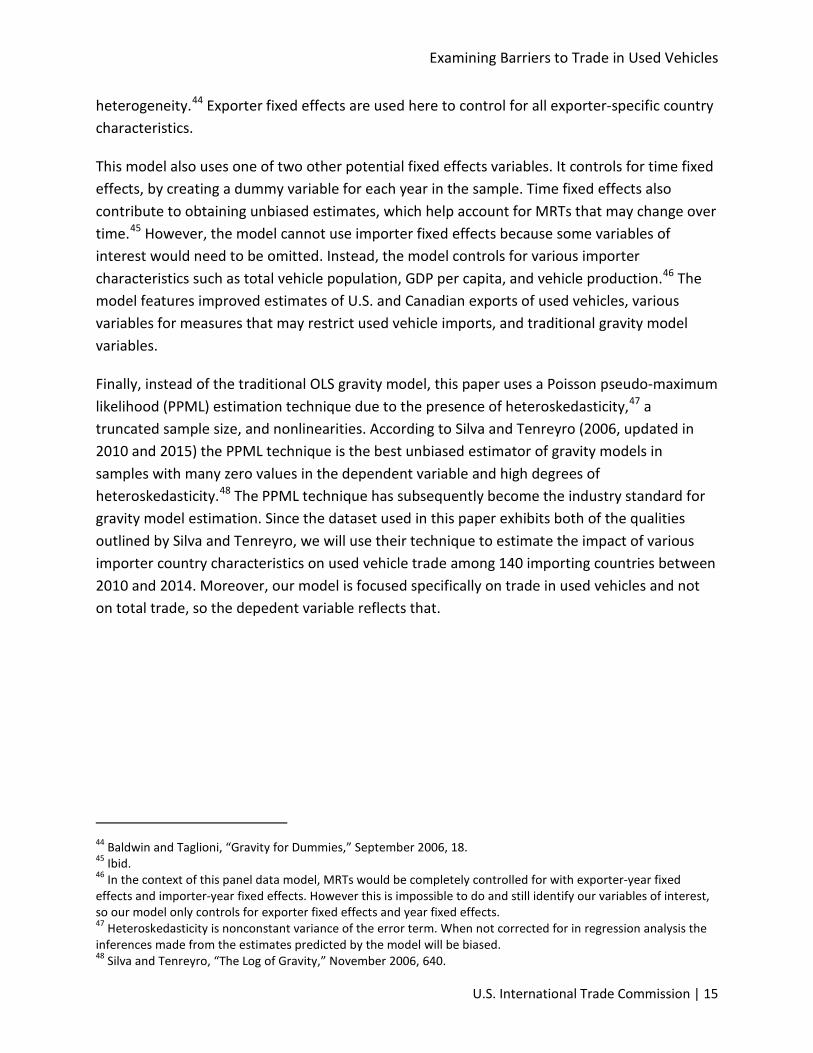
heterogeneity.44 Exporter fixed effects are used here to control for all exporter-specific country characteristics.
This model also uses one of two other potential fixed effects variables. It controls for time fixed effects, by creating a dummy variable for each year in the sample. Time fixed effects also contribute to obtaining unbiased estimates, which help account for MRTs that may change over time.45 However, the model cannot use importer fixed effects because some variables of interest would need to be omitted. Instead, the model controls for various importer characteristics such as total vehicle population, GDP per capita, and vehicle production.46 The model features improved estimates of U.S. and Canadian exports of used vehicles, various variables for measures that may restrict used vehicle imports, and traditional gravity model variables.
Finally, instead of the traditional OLS gravity model, this paper uses a Poisson pseudo-maximum likelihood (PPML) estimation technique due to the presence of heteroskedasticity,47 a truncated sample size, and nonlinearities. According to Silva and Tenreyro (2006, updated in 2010 and 2015) the PPML technique is the best unbiased estimator of gravity models in samples with many zero values in the dependent variable and high degrees of heteroskedasticity.48 The PPML technique has subsequently become the industry standard for gravity model estimation. Since the dataset used in this paper exhibits both of the qualities outlined by Silva and Tenreyro, we will use their technique to estimate the impact of various importer country characteristics on used vehicle trade among 140 importing countries between 2010 and 2014. Moreover, our model is focused specifically on trade in used vehicles and not on total trade, so the depedent variable reflects that.
44 Baldwin and Taglioni, “Gravity for Dummies,” September 2006, 18. 45 Ibid. 46 In the context of this panel data model, MRTs would be completely controlled for with exporter-year fixed effects and importer-year fixed effects. However this is impossible to do and still identify our variables of interest, so our model only controls for exporter fixed effects and year fixed effects. 47 Heteroskedasticity is nonconstant variance of the error term. When not corrected for in regression analysis the inferences made from the estimates predicted by the model will be biased. 48 Silva and Tenreyro, “The Log of Gravity,” November 2006, 640.

16 | www.usitc.gov
The variables in our model are defined as follows:
• UsedPVExports: Used vehicle exports by value (in thousands of dollars) from the exporter i to importer j during time t (2010 to 2014);49
• lnDistance: Log of the weighted distance between the exporter i and importer j;50 • lnTotalVehicles: Log of the estimate of the total vehicles present in the importing country j
in year t;51 • lnGDPcap: Log of real GDP per capita for country j; • Landlocked: A dummy variable equal to 1 if importer j is landlocked; • Language: A dummy variable equal to 1 if importer j speaks the same official language as
exporter i; • Contiguous: A dummy variable equal to 1 if both countries share a border; • Colony: A dummy variable equal to 1 if one country colonized the other at any point in
history; • FTA: A dummy variable equal to 1 if country j has a free trade agreement with the exporter
i; • EU: A dummy variable equal to 1 if the importer is a member of the European Union; • LowRestrict: A dummy variable equal to 1 if the importer has restrictions that are not
prohibitive; • HighRestrict: A dummy variable equal to 1 if the importer has restrictions that are
prohibitive; • SameSide: a dummy equal to 1 if countries i and j drive on the same side of the road. • lnVehicleProduction: log of the total vehicle production in the importing country j in year t; • lnTariff: the log of the tariff value that the exporter faces to export to a particular import
market in year t; and • α: exporter fixed effects (unobservable country-specific effect) to account (imperfectly) for
outward multilateral resistances; and • λ: time fixed effects (unobservable time-specific effects) that helps to account for
multilateral resistances associated to changes in time.
49 We use value in the estimation because quantity data is not consistent for every year and every country involved. 50 Our distance variable is the distw variable used in much of gravity analysis that comes from the CEPII database. The variable is a weighted distance measure that takes into account the populations of every main agglomeration within a country to create a distance more accurate than the traditional capital-to-capital or border-to-border measurements of distance. For more information, see Head and Mayer, “Illusory Border Effects: Distance Mismeasurement Inflates Estimates of Home Bias in Trade,” 2002. 51 This is computed this by multiplying the World Bank's vehicles per 1000 by population data. Ideally one would proxy for demand by calculating total demand for vehicles in an importing country each year (domestic production in addition to net imports), but consistent data on net imports does not exist.
Examining Barriers to Trade in Used Vehicles
U.S. International Trade Commission | 17
Independent Variables We model trade costs using a combination of different variables. We utilize five traditional country characteristics in gravity analysis that take the form of dummy variables: Colony, Contiguous, Distance, FTA, and Landlocked. Landlocked is included because, according to the literature, transportation costs for landlocked countries are likely to be higher than would be implied by their distance from their trading partner.52 Furthermore, it is a standard assumption in the literature that countries that share a border have lower costs of trade, so Contiguous is also included. We predict that the sign for the Landlocked and Distance coefficients will be negative, while for Contiguous, Colony, and FTA we expect it to be positive.
With respect to demand, we expect the coefficient on the GDP per capita of the importing country to be negative, since we expect wealthier countries to have a higher relative demand for new vehicles instead of used vehicles. We expect TotalVehicles to have a positive coefficient since this is our measure of the size of the total national automobile population. VehicleProduction is predicted to have a negative relationship with used vehicle imports, as we expect countries with higher levels of vehicle production to restrict potential competition from used vehicles. SameSide’s relationship with the dependent variable is expected to be positive, as most consumers prefer to buy vehicles designed to drive on the same side of the road that the consumers drive on.53
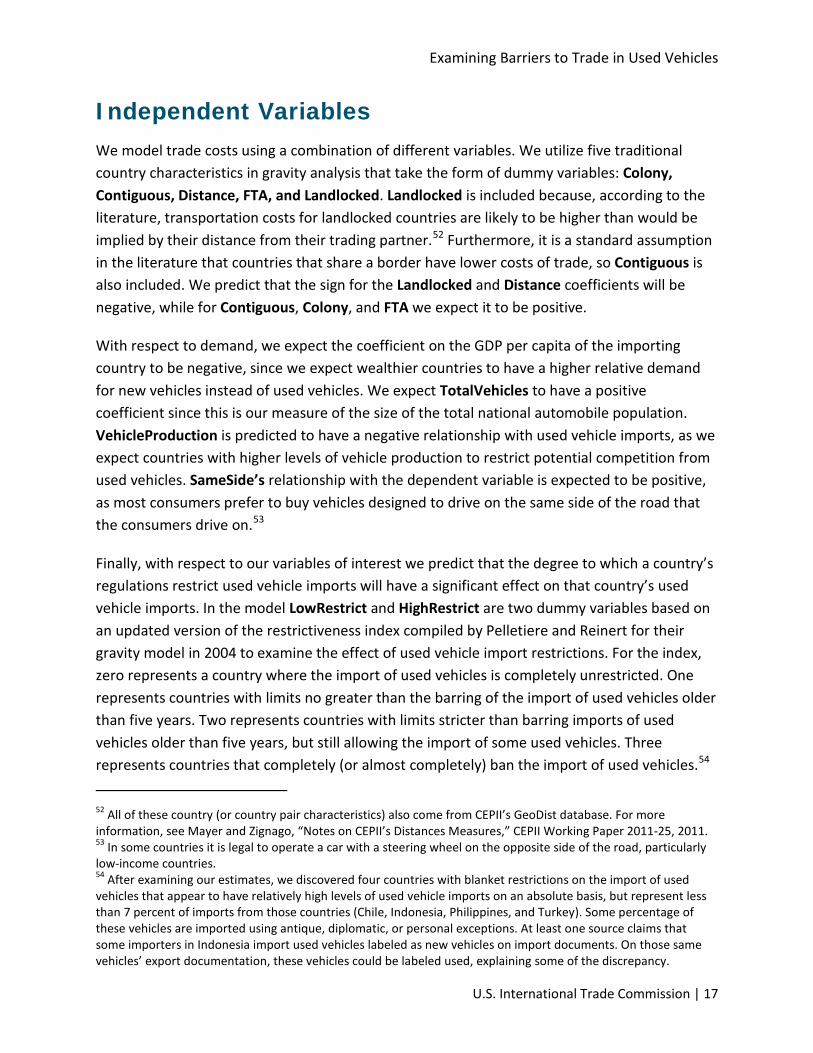
Finally, with respect to our variables of interest we predict that the degree to which a country’s regulations restrict used vehicle imports will have a significant effect on that country’s used vehicle imports. In the model LowRestrict and HighRestrict are two dummy variables based on an updated version of the restrictiveness index compiled by Pelletiere and Reinert for their gravity model in 2004 to examine the effect of used vehicle import restrictions. For the index, zero represents a country where the import of used vehicles is completely unrestricted. One represents countries with limits no greater than the barring of the import of used vehicles older than five years. Two represents countries with limits stricter than barring imports of used vehicles older than five years, but still allowing the import of some used vehicles. Three represents countries that completely (or almost completely) ban the import of used vehicles.54 52 All of these country (or country pair characteristics) also come from CEPII’s GeoDist database. For more information, see Mayer and Zignago, “Notes on CEPII’s Distances Measures,” CEPII Working Paper 2011-25, 2011. 53 In some countries it is legal to operate a car with a steering wheel on the opposite side of the road, particularly low-income countries. 54 After examining our estimates, we discovered four countries with blanket restrictions on the import of used vehicles that appear to have relatively high levels of used vehicle imports on an absolute basis, but represent less than 7 percent of imports from those countries (Chile, Indonesia, Philippines, and Turkey). Some percentage of these vehicles are imported using antique, diplomatic, or personal exceptions. At least one source claims that some importers in Indonesia import used vehicles labeled as new vehicles on import documents. On those same vehicles’ export documentation, these vehicles could be labeled used, explaining some of the discrepancy.
18 | www.usitc.gov
These data were collected manually based on authors’ research into the used vehicle import regulations for each country (figure 4), and LowRestrict corresponds to countries with a 1 or 2, while HighRestrict applies to countries with a 3.
Figure 4: World political map by level of used vehicle import restriction
Source: Information compiled using author research and the map tool at http://gunn.co.nz/map. Corresponds to appendix table B.4. Note: Countries in black have no data.
Tariffs are from the World Bank’s TRAINS database, using a simple average of the tariffs for passenger vehicles (used or otherwise).55 This database uses the most recent year available, which ranges from 2008 to 2013, depending on the country. The relationship between Tariff and the dependent variables is expected to be negative, i.e., lower tariffs should facilitate greater exports to a particular market.56
55 World Bank, TRAINS database (accessed March 18, 2015). 56 For bilateral country pairings where the importer and exporter are FTA partners, the tariff according to the FTA tariff schedule was used.

Examining Barriers to Trade in Used Vehicles
U.S. International Trade Commission | 19
Dependent Variable The dependent variable for this equation is used vehicle exports from country i to country j in year t. The exporters included in the dataset are Canada, Japan, Korea, Mexico, and the United States. These are five of the six largest exporters of passenger vehicles globally, representing roughly 57 percent of all passenger vehicle exports (new and used) in 2014.57 Used vehicle export data from these countries are used because few countries track used vehicle imports. The dataset includes estimates of U.S. and Canadian used vehicle exports calculated by the authors for those portions of the Harmonized Tariff System of the United States (HTS) that do not break out used vehicle exports.58 Previous used vehicle research only included the available used vehicle export data without modification, thus underestimating U.S. used vehicle exports.59 Unmodified used vehicle exports are used for Japan, Mexico, and Korea, as they each use country-specific 8- or 10-digit categories that cover specific export codes for all used vehicles.
Estimation of U.S. and Canadian used vehicle exports
This model is further enhanced by the use of an estimation technique to more accurately estimate used vehicle exports in Canada and the United States that are not reported in HS codes classifying exports specific to used vehicles. For the United States, only four of nine HS-6 digit passenger vehicle export subheadings have corresponding 10-digit Schedule B export codes specific to used vehicles (Canada has export subheadings for five of nine).60 The other five HS subheadings commingle new and used exports in the same export codes.61 These commingled codes include those for cars and sport-utility vehicles (SUVs) with gasoline engines larger than 1L to 1.5L, cars and SUVs with diesel engines 1.5L or smaller, electric vehicles, and pickup trucks and work vans (table 3). While very few cars and SUVs are made in the United States or Canada with engines 1.5L or smaller, millions of pickup trucks and work vans are produced in the United States and to a lesser extent, Canada.62
57 The EU was not included in the model because it does not offer any used vehicle-specific export data. The 57 percent calculated above excludes internal EU trade, if internal trade were included in the calculation of the share of global vehicle trade included in the model, then we would estimate that the countries in this dataset would make up roughly 40 percent of exports. GTIS, Global Trade Atlas database (accessed July 20, 2015). 58 This estimate uses the same method originally developed for Coffin, “Used Vehicles Are an Important Component,” 2015. 59 To our knowledge, Canadian used vehicle exports have not been used in a gravity model. 60 Those HS-6 categories are 870323, 870324, 870332, and 870333. 61 Those HS-6 categories are 870322, 870331, 870390, 870421, and 870431. 62 Binder, Ward’s Automotive Yearbook, 2014, 170–173.

20 | www.usitc.gov
This paper estimates exports country by country, based on the share of used to new vehicle exports in the HS-6 subheadings that have corresponding 8 or 10 digit export classifications specific to used vehicles. The observed share is then applied to those HS-6 subheadings where used vehicles’ share of exports is unknown. By estimating exports in this way, the estimate takes into account the preferences of each individual country for used versus new vehicles. However, this calculation may over- or underestimate used vehicles’ share of exports if consumers in a given country have a greater or lesser preference for used vehicles in observed HS-6 subheadings than they do in those HS-6 subheadings where the used vehicle share of exports is unobserved.
Table 3: U.S. and Canadian passenger vehicle-related HS subheadings
HS-6 Code Description Types of vehicles Used vehicle export classification (Y/N)
8703 Motor cars and other motor vehicles for the transport of persons
Passenger cars, SUVs, and minivans
870322 With spark-ignition engines of a cylinder capacity exceeding 1,000 cc but not exceeding 1,500 cc
Passenger cars, SUVs, and minivans
Canada Yes, United States No
870323 Exceeding 1,500 cc, but not exceeding 3,000 cc
Passenger cars, SUVs, and minivans
Yes
870324 Exceeding 3,000 cc Passenger cars, SUVs, and minivans
Yes
870331 With compression-ignition engines of a cylinder capacity not exceeding 1,500 cc
Passenger cars, SUVs, and minivans
No
870332 Exceeding 1,500 cc but not exceeding 2,500 cc Passenger cars, SUVs, and minivans
Yes
870333 Exceeding 2,500 cc Passenger cars, SUVs, and minivans
Yes
870390 Other Electric cars and SUVs No 8704 Motor vehicles for the transport of goods Trucks and vans for the
transport of goods
870421 Other, with compression-ignition engines and a gross vehicle weight not exceeding 5 metric tons
Diesel pickup trucks and work vans
No
870431 Other, with spark-ignition engine and a gross vehicle weight not exceeding 5 metric tons
Gasoline engine pickup trucks and work vans
No
Source: Information derived from U.S. Census, Schedule B (accessed August 28, 2015); and Statistics Canada, "Canadian Export Classification 2015," (accessed January 19, 2016).
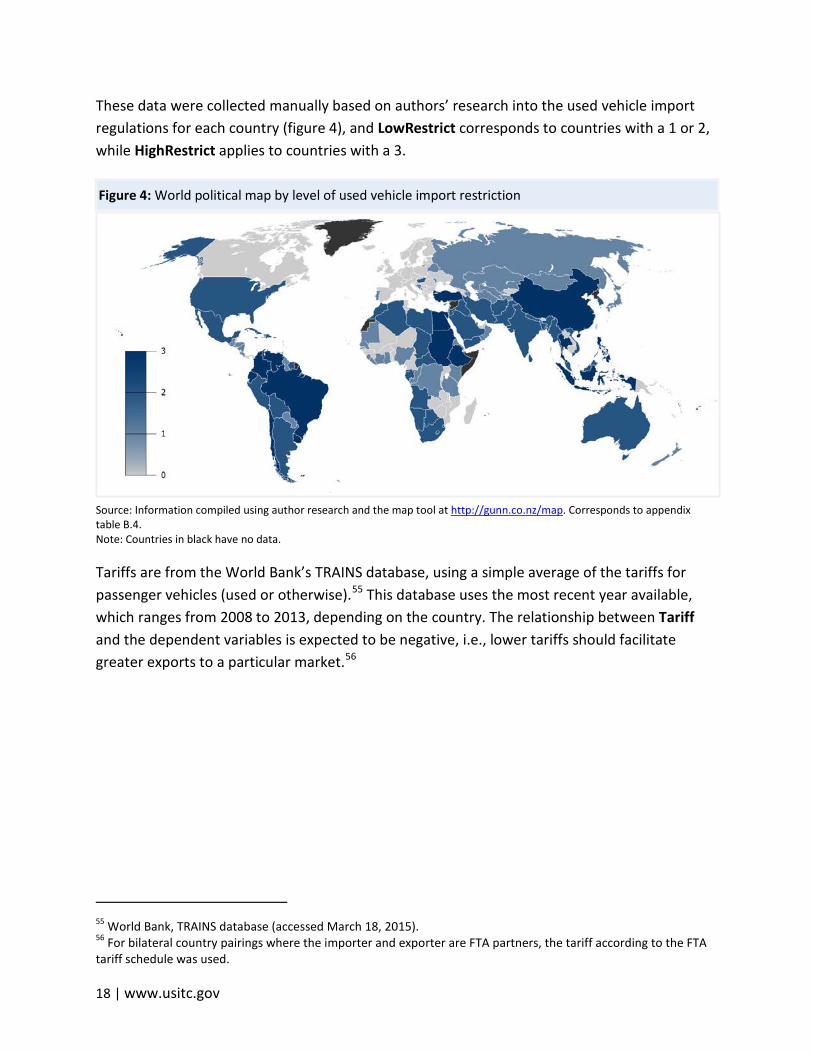
For 2014, the vast majority of the estimated used vehicle exports (87 percent or $9.2 billion) came directly from export codes (figure 5), and the estimate from the commingled export codes made up 13 percent of estimated exports ($1.4 billion). The estimation methodology used in this paper may underestimate the share of vehicles exported in the commingled export codes, because passenger vehicle manufacturers do not tend to produce vehicles of this type in the United States or Canada. Thus exports of such vehicles may include more used vehicles that were previously imported from other countries as new vehicles.
Examining Barriers to Trade in Used Vehicles
U.S. International Trade Commission | 21
Figure 5: Reported and estimated U.S. and Canadian used vehicle exports, 2010–14
Source: Author calculations based on USITC/DataWeb data (February 24, 2015). Corresponds to appendix table B.5.
China: A special case
Export data appear to indicate that China is a major importer of used vehicles—a picture that is inconsistent with China’s ban on used vehicle imports. However, many of its reported imports of used vehicles may actually be gray-market imports of new vehicles, with buyer networks reportedly purchasing new vehicles in the United States and exporting them to China as used vehicles. The reason is that a new luxury vehicle in China often sells for a significantly higher price, sometimes 300 percent higher, than in the United States.63
Since China bans the import of used vehicles, the vehicles sold may not have been labeled as used on any of the import documents. For this reason, in the gravity model, reported exports of used vehicles to China are coded as zero.
63 Goldstein, “U.S. Targets Buyers of China-Bound Luxury Cars,” February 11, 2014; Bunkley, "Selling Vehicles for Export Angers Automakers," July 21, 2014.
$8.9 $10.9 $10.0 $9.8 $9.2
$1.4
$1.5 $1.3 $1.5
$1.4
$0
$2
$4
$6
$8
$10
$12
$14
2010 2011 2012 2013 2014
Billi
ons
Reported Additional estimated
22 | www.usitc.gov
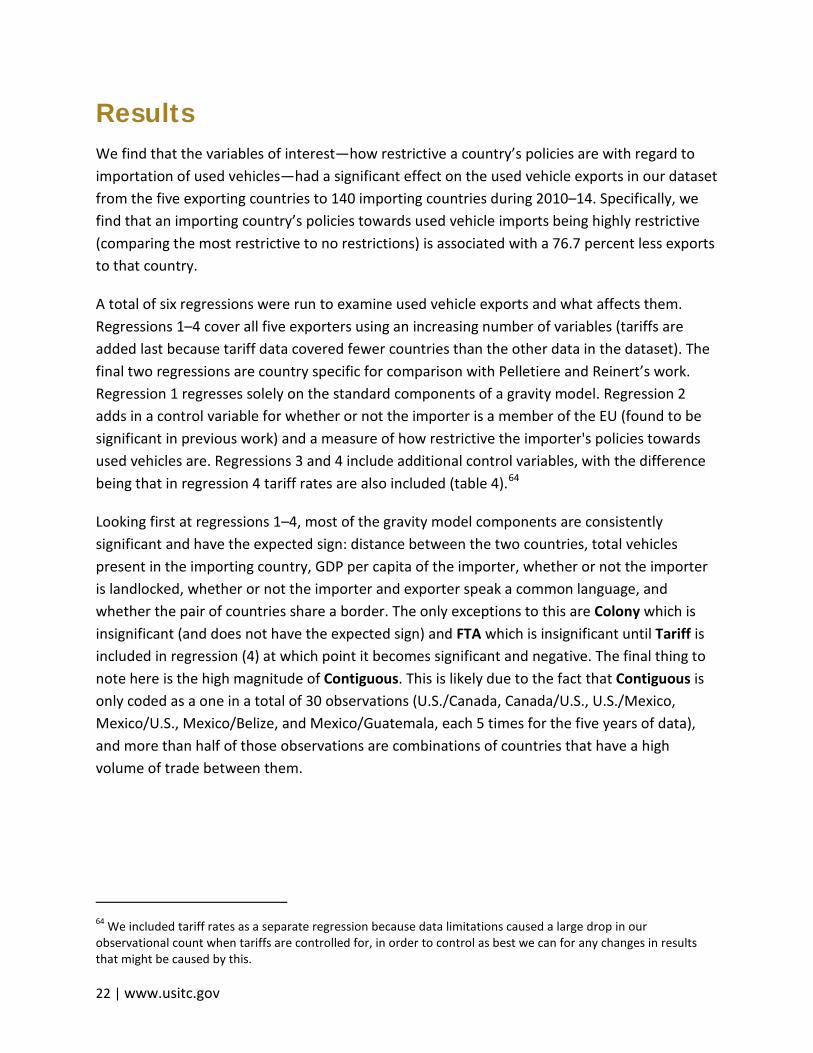
Results We find that the variables of interest—how restrictive a country’s policies are with regard to importation of used vehicles—had a significant effect on the used vehicle exports in our dataset from the five exporting countries to 140 importing countries during 2010–14. Specifically, we find that an importing country’s policies towards used vehicle imports being highly restrictive (comparing the most restrictive to no restrictions) is associated with a 76.7 percent less exports to that country.
A total of six regressions were run to examine used vehicle exports and what affects them. Regressions 1–4 cover all five exporters using an increasing number of variables (tariffs are added last because tariff data covered fewer countries than the other data in the dataset). The final two regressions are country specific for comparison with Pelletiere and Reinert’s work. Regression 1 regresses solely on the standard components of a gravity model. Regression 2 adds in a control variable for whether or not the importer is a member of the EU (found to be significant in previous work) and a measure of how restrictive the importer's policies towards used vehicles are. Regressions 3 and 4 include additional control variables, with the difference being that in regression 4 tariff rates are also included (table 4).64
Looking first at regressions 1–4, most of the gravity model components are consistently significant and have the expected sign: distance between the two countries, total vehicles present in the importing country, GDP per capita of the importer, whether or not the importer is landlocked, whether or not the importer and exporter speak a common language, and whether the pair of countries share a border. The only exceptions to this are Colony which is insignificant (and does not have the expected sign) and FTA which is insignificant until Tariff is included in regression (4) at which point it becomes significant and negative. The final thing to note here is the high magnitude of Contiguous. This is likely due to the fact that Contiguous is only coded as a one in a total of 30 observations (U.S./Canada, Canada/U.S., U.S./Mexico, Mexico/U.S., Mexico/Belize, and Mexico/Guatemala, each 5 times for the five years of data), and more than half of those observations are combinations of countries that have a high volume of trade between them.
64 We included tariff rates as a separate regression because data limitations caused a large drop in our observational count when tariffs are controlled for, in order to control as best we can for any changes in results that might be caused by this.
Examining Barriers to Trade in Used Vehicles
U.S. International Trade Commission | 23
Table 4: Model results
Variables (1)
UsedPV_exports (2)
UsedPV_exports (3)
UsedPV_exports (4)
UsedPV_exports lnDistance -0.42*** -0.50*** -0.42*** -0.53*** (0.111) (0.141) (0.155) (0.183) lnTotalVehicles 0.30*** 0.41*** 0.72*** 0.69*** (0.040) (0.040) (0.039) (0.047) lnGDPCAP -0.14** -0.14** -0.21*** -0.27*** (0.063) (0.063) (0.049) (0.076) (0.063) (0.063) (0.049) (0.076) Landlocked -1.00*** -1.21*** -1.24*** -1.35*** (0.178) (0.183) (0.177) (0.196) Language 0.55*** 0.37* 0.79*** 0.94*** (0.195) (0.193) (0.134) (0.245) Contiguous 1.19*** 0.54** 0.85*** 1.14*** (0.268) (0.256) (0.286) (0.415) Colony -0.82*** -0.81* -0.16 -0.40 (0.306) (0.432) (0.366) (0.402) FTA 0.18 -0.02 -0.26 -0.92*** (0.205) (0.226) (0.229) (0.309) EU -1.37*** -1.30*** -1.13*** (0.223) (0.223) (0.308) LowRestrict -0.19 -0.48*** -0.34* (0.278) (0.142) (0.204) HighRestrict -1.61*** -1.61*** -1.46*** (0.286) (0.247) (0.315) SameSide 1.37*** 1.40*** (0.170) (0.175) lnVehicleProduction -0.10*** -0.09*** (0.013) (0.017) lnTariff -0.14 (0.105) Constant 11.44*** 11.06*** 6.00*** 8.17*** (1.117) (1.315) (1.600) (2.091) Observations 3,455 3,455 3,455 2,507 R-squared 0.365 0.405 0.496 0.507 Adjusted R-squared 0.364 0.403 0.494 0.504 Exporter FE YES YES YES YES Year FE YES YES YES YES *** p<0.01, ** p<0.05, * p<0.1
Source: Authors calculations. Note: Robust standard errors are in parentheses.
24 | www.usitc.gov
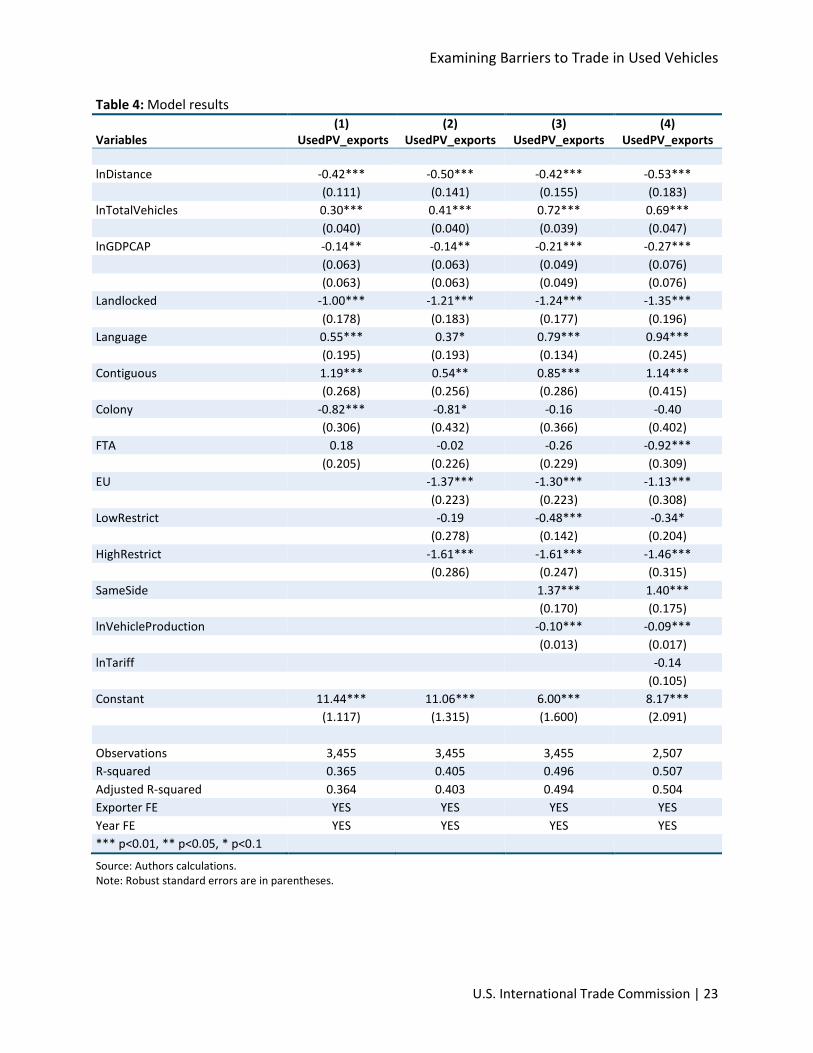
With respect to the variables of interest, regressions 2–4 gradually introduce five new variables. LowRestrict is found to be significant and negative, associated with a 38.1 percent decrease in used vehicle exports to the importing country, in regression (3) but is only significant at the 10 percent level in regression (4) when Tariff is included, and is associated with a 28.8 percent decrease in used vehicle exports to the importing country. HighRestrict is significant even when the model controls for tariff rates, and in regression (4) is associated with a 76.7 percent decrease in used vehicle exports to the importing country. The rest of the variables are significant and in the direction we expected, with the exception of Tariff.65 The importer being a member of the EU is associated with less exports to that country, the importer and exporter driving on the same side of the road is associated with more exports, and importer vehicle production is associated with less exports to that country.
Turning to country-specific modeling, table 5 reports the results of U.S. and Japan-specific regressions. These results mimic the specification of regression 4 in table 4. Comparing these findings to those in Pelletiere and Reinert, the country-specific regressions account for more years (2010 through 2014 instead of just 2001) and the results are noticeably different. When it comes to the variables of interest, HighRestrict and LowRestrict are negative and significant for exports from the United States, while LowRestrict is actually positive and significant for exports from Japan, while HighRestrict is not significant.
65 It’s worth noting here that, due to restrictions in available tariff data, the regression loses 900 observations when tariffs are added. Countries such as United Arab Emirates (1st), Nigeria (3rd), Mexico (4th), Myanmar (5th), Sri Lanka (6th) and Jordan (9th) are all top ten recipients of used vehicle exports in the model that are excluded (or excluded in some cases) when tariffs are included. It's worth noting however that the results of the other variables appear fairly consistent regardless of whether or not tariffs are included.

Examining Barriers to Trade in Used Vehicles
U.S. International Trade Commission | 25
We find that the total number of vehicles in the importing country remains significant and positive for both the United States and Japan. SameSide remains positive and significant for both countries. Moreover, Language remains positive and significant for the United States (this variable is omitted in the Japan regression due to a lack of partner countries with Japanese as the official spoken language). Landlocked is also found to be significant and negative for both countries. However, it is important to note that filtering the observations for just one exporter greatly dilutes the robustness and observational counts of the models, and these results are likely to differ if even a few observations with high exports differ in characteristics.
Table 5: U.S. and Japan single country model results
Variables (7) United States UsedPV_exports
(8) Japan UsedPV_exports
lnDistance 1.20*** -1.21*** (0.327) (0.299) lnTotalVehicles 0.75*** 0.71*** (0.083) (0.096) lnGDPCAP -0.11 -0.49*** (0.089) (0.102) Landlocked -2.16*** -0.90*** (0.406) (0.306) Language 0.82*** (0.316) Contiguous 2.45*** (0.577) Colony -0.40 -6.29*** (0.372) (0.835) FTA 0.37 -1.39*** (0.426) (0.371) EU -1.15*** -2.34*** (0.329) (0.399) LowRestrict -1.59*** 0.68** (0.300) (0.283) HighRestrict -2.81*** -0.68 (0.461) (0.577) SameSide 1.10*** 1.60*** (0.297) (0.322) lnVehicleProduction -0.12*** -0.07** (0.019) (0.030) lnTariff 0.14 -0.35** (0.127) (0.141) Constant -9.58*** 15.55*** (3.395) (3.202) Observations 505 569 R-squared 0.678 0.381 Adjusted R-squared 0.669 0.367 Year FE YES YES
Source: Authors calculations. Note: Robust standard errors are in parentheses. *** p<0.01, ** p<0.05, * p<0.1.

26 | www.usitc.gov
As discussed earlier, we use PPML for our estimations to address potential concerns about heteroskedacity and zero exports. Below is a comparison of results using OLS and PPML. The results are quite similar in direction, but PPML properly including results of zero trade between bilateral pairs is likely the cause for the differences in magnitudes in the results between the models. Noticeable other differences are the magnitude and significance of Contiguous and FTA. These are due to the inclusion of country pairs with zero trade in used vehicles in the PPML model.
Table 6: Comparison between PPML and OLS
Source: Authors calculations. Note: Robust standard errors in parentheses. *** p<0.01, ** p<0.05, * p<0.1.
Variables (1)
PPML (2) OLS
(3) PPML
(4) OLS
lnDistance -0.43*** -2.00*** -0.54*** -1.54***
(0.155) (0.171) (0.183) (0.194) lnTotalvehicles 0.72*** 1.15*** 0.68*** 1.01*** (0.039) (0.053) (0.047) (0.072) lnGDPCAP -0.21*** -0.19*** -0.28*** -0.26*** (0.050) (0.066) (0.076) (0.080) landlocked -1.23*** -0.81*** -1.34*** -1.25*** (0.177) (0.205) (0.196) (0.237) Language 0.79*** 3.06*** 0.94*** 2.82*** (0.134) (0.216) (0.246) (0.247) contiguous 0.89*** -2.73*** 1.20*** -2.60*** (0.284) (0.817) (0.414) (0.873) Colony -0.16 -0.17 -0.40 0.02 (0.365) (0.609) (0.401) (0.636) FTA -0.27 1.48*** -0.95*** 2.13*** (0.230) (0.288) (0.309) (0.348) EU -1.27*** -1.69*** -1.08*** -2.05*** (0.219) (0.246) (0.302) (0.264) LowRestrict -0.45*** -0.40** -0.30 -0.45** (0.142) (0.171) (0.200) (0.196) HighRestrict -1.55*** -1.67*** -1.37*** -1.97*** (0.245) (0.293) (0.314) (0.368) SameSide 1.37*** 4.20*** 1.41*** 4.02*** (0.170) (0.165) (0.176) (0.194) lnVehicleProduction -0.11*** -0.07*** -0.09*** -0.03 (0.013) (0.018) (0.017) (0.021) lnTariff
-0.15 0.10
(0.105) (0.089) Constant 6.07*** 8.50*** 8.30*** 7.32*** (1.600) (1.766) (2.081) (2.068)
Observations 3,455 3,058 2,507 2,215 R-squared 0.496 0.622 0.507 0.538 Adjusted R-squared 0.494 0.620 0.504 0.535 Exporter FE YES YES YES YES Year FE YES YES YES YES
Examining Barriers to Trade in Used Vehicles
U.S. International Trade Commission | 27
Conclusion This paper introduces more accurate used vehicle export estimates for the United States and Canada, and improves upon the previous gravity estimation focused on used vehicles, conducted by Pelletiere and Reinert in 2006. First, this paper uses PPML to estimate the gravity equation instead of OLS, which as discussed previously, is more accurate with datasets with a high number of zeroes among importer-exporter pairs like this one. This paper’s model also uses additional independent variables (Colony, Tariff, and VehicleProduction), refines previously used independent variables, and adds exporter and time fixed effects. Further, the model includes three additional exporters (Canada, Korea, and Mexico), more importers (140), and covers a five-year period, resulting in over three thousand importer-exporter pairs and making for a much more robust model.66 Also, rather than just using GDP, the model uses total vehicle population to show the size of the importer market. The authors believe the use of total vehicle population results in a more accurate model.
In this paper, rather than looking at each country separately, the authors ran the regression using all five exporters, as it quadrupled the number of observations and allowed a more global understanding of how each dependent variable affects used vehicle imports. Examining these results, some of Pelletiere and Reinert’s conclusions were verified, including the significant positive relationship between driving on the same side of the road and used vehicle imports, and the significant negative relationship between GDP per capita and preference for used vehicles. EU membership was also significant and negative, as Pelletiere and Reinert expected.
Overall, trade in used vehicles appears to behave in much the same way as trade in other goods, with variables like Contiguous, Landlocked, and Language showing significant positive or negative relationships as expected and discussed in the variables section. Furthermore, Pelletiere and Reinert expected that EU countries would be less likely to import used vehicles because they would likely trade internally, but their model had mixed results. Our model seems to support their original expectation.67
66 There were tariff data for only 2,507 of those instances. 67 Pelletiere and Reinert, “World Trade in Used Automobiles,” 2006, 164.
28 | www.usitc.gov
Two variables included in the model appear to have an effect that is different from the typical trade pattern, GDPCAP and FTA. The main difference from typical trade patterns, as discussed earlier in the theory section, was the negative relationship between used vehicle trade and GDP per capita. However, this relationship fits within the body of research on used vehicles and used goods, which states that lower-income countries will likely show a preference for lower-quality or used items. An unexpected difference from typical trade patterns in the results was the negative coefficient for FTA. We theorize that the removal of duties on the import of new and used vehicles from an FTA partner leads to more consumers choosing new vehicles over used vehicles, causing the negative coefficient in our model.
For variables specific to this used vehicles model, LowRestrict, HighRestrict, and VehicleProduction were significant and negative as expected. However, it is worth noting that the magnitude of the estimated effect of HighRestrict on exports is smaller than found by Pelletiere and Reinert. HighRestrict measures whether or not a country has restrictions in place preventing the importation of used vehicles, but the model only estimates that high levels of restrictiveness reduce exports to a country by 76.7 percent. There are two likely causes. The first is the large number of exceptions that countries include in their restrictions. The second is that the model uses export data, which tends to be less accurate than import data.68 The export data could include incorrect destinations or inaccurate descriptions of the good being exported (e.g., the vehicle being exported might be new rather than used). The authors also expected that the presence of domestic vehicle producers would reduce used vehicle imports, because some of the used vehicle literature discusses how relatively strong domestic vehicle producers lobby the government to protect the domestic market from used vehicle imports.
Future Research Future research could include better import data, more exporters, better tariff data, and a better or more differentiated restrictiveness index. Import data might help in reconciling how many importers appear to receive exports while having regulations in place preventing used vehicles from entering the country. The current model uses five exporters, as they were the top vehicle exporters that had differentiated used vehicle data. With more used vehicle export data, the model could be expanded for more robust results. The tariff data used in the model are TRAINS data, using simple averages of the tariff lines, but use of specific trade-weighted tariffs, if available, may add accuracy.69 The restrictiveness measure used mainly reflects restrictions on the age of vehicles imported, but includes import licenses, bans, and capped
68 As mentioned previously, import data were not used because few countries track used vehicle imports, so the dataset would have been much smaller. 69 Each country uses different HS 8-digit codes for passenger vehicles, and time constraints prevented the authors from examining HS 8-digit codes for every country included in the database.

Examining Barriers to Trade in Used Vehicles
U.S. International Trade Commission | 29
depreciation. Breaking apart those measures into their individual components may yield more accurate results. Also, incorporating used vehicle sales data, or at least more recent vehicle ownership rates, would also likely improve the model.
Another area of future used vehicle research is the effect of reducing used vehicle imports through nontariff measures on an importing country’s economy. With fewer used vehicle imports, for example, transportation costs in those countries may be higher, and those costs would influence the cost of numerous other goods, potentially affecting trade or even growth.

30 | www.usitc.gov
Bibliography Baldwin, Richard, and Daria Taglioni. “Gravity for Dummies and Dummies for Gravity
Equations.” NBER Working Paper 12516, September 2006.
Behrens, Kristian, Cem Ertur, and Wilfried Koch. "Dual Gravity: Using Spatial Econometrics to Control for Multilateral Resistance." Journal of Applied Econometrics 27, no. 5 (August 2012): 773–94. Originally published online December 12, 2010. http://onlinelibrary.wiley.com/doi/10.1002/jae.1231/full (fee required).
Binder, Alan K. Ward’s Automotive Yearbook. Southfield, MI: Ward’s Automotive Group, 2014.
Bunkley, Nick. "Selling Vehicles for Export Angers Automakers." Automotive News, July 21, 2014. http://www.autonews.com/article/20140721/LEGALFILE/307219975/selling-vehicles-for-export-angers-automakers-but-is-it-illegal?
Chu, Ted, and Alejandro Delgado. “Used Vehicle Imports Impact on New Vehicle Sales: The Mexican Case.” Análisis Económico 24, no. 55 (2009): 347–64.
Clerides, Sofronis. “Gains from Trade in Used Goods: Evidence from the Global Market for Automobiles.” CEPR Discussion Paper No. 4859, January 2005. http://papers.ssrn.com/sol3/papers.cfm?abstract_id=721603.
Coffin, David. “Used Vehicles Are an Important Component.” USITC Executive Briefings on Trade, January 2015. https://usitc.gov/sites/default/files/publications/332/executive_briefings/coffin_used_vehicle_exports.pdf.
Davis, Lucas W., and Matthew E. Kahn. “International Trade in Used Vehicles: The Environmental Consequences of NAFTA.” American Economic Journal: Economic Policy 2, no. 4 (January 2010): 58-82. https://www.aeaweb.org/articles.php?doi=10.1257/pol.2.4.58 (fee required).
Esteban, Susanna, and Matthew Shum. “Durable-goods Oligopoly with Secondary Markets: The Case of Automobiles.” RAND Journal of Economics 38 (Summer 2007): 332–54.
Goldstein, Matthew. “U.S. Targets Buyers of China-Bound Luxury Cars.” New York Times, February 11, 2014. http://dealbook.nytimes.com/2014/02/11/u-s-targets-buyers-of-china-bound-luxury-cars/.
Examining Barriers to Trade in Used Vehicles
U.S. International Trade Commission | 31
Golub, Stephen S. “Entrepôt Trade and Smuggling in West Africa: Benin, Togo and Nigeria.” The World Economy 35, no. 9 (September 2012): 1139–61. Originally published online July 23, 2012. http://onlinelibrary.wiley.com/doi/10.1111/j.1467-9701.2012.01469.x/abstract (fee required).
Grubel, Herbert G. “International Trade in Used Cars and Problems of Economic Development.” World Development 8, no. 10 (October 1980): 781–88. http://www.sciencedirect.com/science/article/pii/0305750X80900054 (fee required).
Head, Keith and Thierry Mayer. “Illusory Border Effects: Distance Mismeasurement.” CEPII Research Center Working Paper, No 2002-01, January 2002. http://www.cepii.fr/PDF_PUB/wp/2002/wp2002-01.pdf.
Japanese Car Trade. “Import Rules and Regulations on Japan Used Cars in Nigeria.” http://www.japanesecartrade.com/japancars/automobile-articles/japan-used-cars-import-regulations-in-nigeria (accessed July 22, 2015).
Mayer, Thierry, and Soledad Zignago. “Notes on CEPII’s Distances Measures: The GeoDist Database.” CEPII working paper no. 2011-25, December 2011. http://www.cepii.fr/PDF_PUB/wp/2011/wp2011-25.pdf.
Pelletiere, Danilo, and Kenneth A. Reinert. “Used Automobile Protection and Trade.” Empirical Economics 29 (2004): 737–51. http://home.earthlink.net/~dpelleti/sitebuildercontent/sitebuilderfiles/pelletiereeefinal.pdf.
Pelletiere, Danilo, and Kenneth A. Reinert. “World Trade in Used Automobiles: A Gravity Analysis of Japanese and U.S. Exports.” Asian Economic Journal 20, no. 2 (June 2006): 161–72. http://onlinelibrary.wiley.com/doi/10.1111/j.1467-8381.2006.00227.x-i1/references (fee required).
Pelletiere, Danilo. “Why Do Countries Restrict Used Good Imports? An Inquiry into the International Political Economy of Used Automobiles.” PhD diss., George Mason University, Spring 2003.
Sadjadpour, Karim. “The Battle of Dubai: The United Arab Emirates and the U.S.-Iran Cold War.” The Carnegie Papers, July 2011. http://carnegieendowment.org/files/dubai_iran.pdf.
Sawyers, Arlena. "Falling used-vehicle values threaten recovery." Automotive News, August 18, 2014. http://www.autonews.com/article/20140818/RETAIL/140819910/falling-used-vehicle-values-threaten-recovery.
32 | www.usitc.gov
Seaman, Kirk. “The 10 Cheapest Cars Sold in America for 2014.” Car and Driver, April 8, 2014. http://blog.caranddriver.com/the-10-cheapest-new-cars-sold-in-america-for-2014/.
Silva, Santos J.M.C. and Tenreyro, Silvana. “The Log of Gravity.” The Review of Economics and Statistics, November 2006, 88 (4): 641-658. http://personal.lse.ac.uk/tenreyro/jensen08k.pdf.
Statistics Canada, "Canadian Export Classification 2015," (accessed January 19, 2016). http://www.statcan.gc.ca/access_acces/alternative_alternatif.action?l=eng&loc=/pub/65-209-x/65-209-x2015000-eng.pdf.
Storchmann, Karl. “On the Depreciation of Automobiles: An International Comparison.” Transportation 31, no. 4 (November 2004): 371–408. http://link.springer.com/article/10.1023%2FB%3APORT.0000037087.10954.72.
U.S. Department of Commerce (USDOC). International Trade Administration (ITA). Office of Transportation and Machinery. Compilation of Foreign Motor Vehicle Import Requirements, 2011.
U.S. Department of Commerce (USDOC). Census Bureau. Schedule B, 2015. http://www.census.gov/foreign-trade/schedules/b/index.html.
U.S. International Trade Commission (USITC) Interactive Tariff and Trade DataWeb (DataWeb)/U.S. Department of Commerce (USDOC). http://dataweb.usitc.gov (accessed various dates).
United Nations and World Bank. A Practical Guide to Trade Policy Analysis, 2012. https://www.wto.org/english/res_e/publications_e/wto_unctad12_e.pdf.
World Bank. (2010–2014). Data retrieved August 28, 2015, from World Integrated Trade Solution. Tariff and Trade Analysis (TRAINS) database.

Examining Barriers to Trade in Used Vehicles
U.S. International Trade Commission | 33
Appendix A Used Vehicle Trade and Restrictiveness
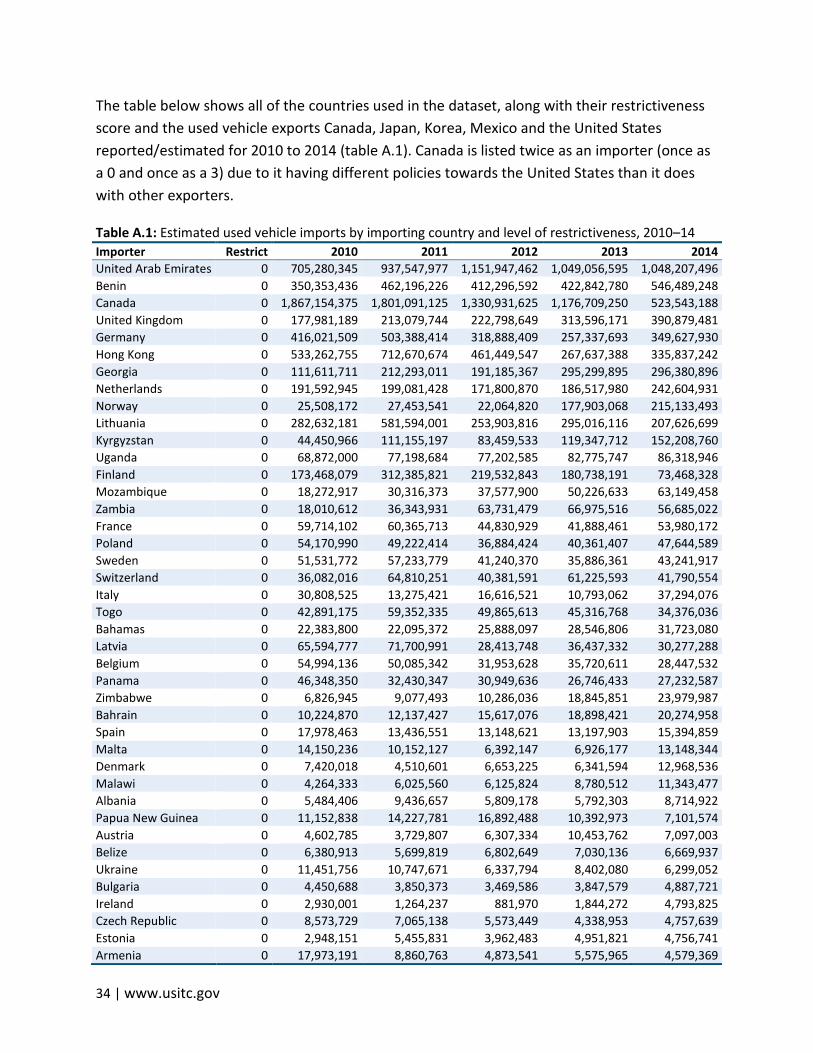
34 | www.usitc.gov
The table below shows all of the countries used in the dataset, along with their restrictiveness score and the used vehicle exports Canada, Japan, Korea, Mexico and the United States reported/estimated for 2010 to 2014 (table A.1). Canada is listed twice as an importer (once as a 0 and once as a 3) due to it having different policies towards the United States than it does with other exporters.
Table A.1: Estimated used vehicle imports by importing country and level of restrictiveness, 2010–14 Importer Restrict 2010 2011 2012 2013 2014 United Arab Emirates 0 705,280,345 937,547,977 1,151,947,462 1,049,056,595 1,048,207,496 Benin 0 350,353,436 462,196,226 412,296,592 422,842,780 546,489,248 Canada 0 1,867,154,375 1,801,091,125 1,330,931,625 1,176,709,250 523,543,188 United Kingdom 0 177,981,189 213,079,744 222,798,649 313,596,171 390,879,481 Germany 0 416,021,509 503,388,414 318,888,409 257,337,693 349,627,930 Hong Kong 0 533,262,755 712,670,674 461,449,547 267,637,388 335,837,242 Georgia 0 111,611,711 212,293,011 191,185,367 295,299,895 296,380,896 Netherlands 0 191,592,945 199,081,428 171,800,870 186,517,980 242,604,931 Norway 0 25,508,172 27,453,541 22,064,820 177,903,068 215,133,493 Lithuania 0 282,632,181 581,594,001 253,903,816 295,016,116 207,626,699 Kyrgyzstan 0 44,450,966 111,155,197 83,459,533 119,347,712 152,208,760 Uganda 0 68,872,000 77,198,684 77,202,585 82,775,747 86,318,946 Finland 0 173,468,079 312,385,821 219,532,843 180,738,191 73,468,328 Mozambique 0 18,272,917 30,316,373 37,577,900 50,226,633 63,149,458 Zambia 0 18,010,612 36,343,931 63,731,479 66,975,516 56,685,022 France 0 59,714,102 60,365,713 44,830,929 41,888,461 53,980,172 Poland 0 54,170,990 49,222,414 36,884,424 40,361,407 47,644,589 Sweden 0 51,531,772 57,233,779 41,240,370 35,886,361 43,241,917 Switzerland 0 36,082,016 64,810,251 40,381,591 61,225,593 41,790,554 Italy 0 30,808,525 13,275,421 16,616,521 10,793,062 37,294,076 Togo 0 42,891,175 59,352,335 49,865,613 45,316,768 34,376,036 Bahamas 0 22,383,800 22,095,372 25,888,097 28,546,806 31,723,080 Latvia 0 65,594,777 71,700,991 28,413,748 36,437,332 30,277,288 Belgium 0 54,994,136 50,085,342 31,953,628 35,720,611 28,447,532 Panama 0 46,348,350 32,430,347 30,949,636 26,746,433 27,232,587 Zimbabwe 0 6,826,945 9,077,493 10,286,036 18,845,851 23,979,987 Bahrain 0 10,224,870 12,137,427 15,617,076 18,898,421 20,274,958 Spain 0 17,978,463 13,436,551 13,148,621 13,197,903 15,394,859 Malta 0 14,150,236 10,152,127 6,392,147 6,926,177 13,148,344 Denmark 0 7,420,018 4,510,601 6,653,225 6,341,594 12,968,536 Malawi 0 4,264,333 6,025,560 6,125,824 8,780,512 11,343,477 Albania 0 5,484,406 9,436,657 5,809,178 5,792,303 8,714,922 Papua New Guinea 0 11,152,838 14,227,781 16,892,488 10,392,973 7,101,574 Austria 0 4,602,785 3,729,807 6,307,334 10,453,762 7,097,003 Belize 0 6,380,913 5,699,819 6,802,649 7,030,136 6,669,937 Ukraine 0 11,451,756 10,747,671 6,337,794 8,402,080 6,299,052 Bulgaria 0 4,450,688 3,850,373 3,469,586 3,847,579 4,887,721 Ireland 0 2,930,001 1,264,237 881,970 1,844,272 4,793,825 Czech Republic 0 8,573,729 7,065,138 5,573,449 4,338,953 4,757,639 Estonia 0 2,948,151 5,455,831 3,962,483 4,951,821 4,756,741 Armenia 0 17,973,191 8,860,763 4,873,541 5,575,965 4,579,369

Examining Barriers to Trade in Used Vehicles
U.S. International Trade Commission | 35
Importer Restrict 2010 2011 2012 2013 2014 Tunisia 0 4,605,742 5,547,250 5,011,053 3,356,536 3,573,092 Burundi 0 2,307,009 3,111,708 1,662,152 2,307,173 3,308,120 Greece 0 9,447,882 3,328,895 1,690,200 3,602,819 3,236,912 Maldives 0 823,353 1,648,045 1,329,305 1,449,452 3,118,483 Luxembourg 0 2,991,953 404,855 828,093 410,278 2,742,187 Lao People's Democratic Republic
0 38,166,035 57,746,329 18,199,495 2,311,086 2,687,921
Burkina Faso 0 588,634 1,131,394 1,357,024 3,527,566 2,239,483 Saint Vincent and the Grenadines
0 2,875,378 2,210,603 2,184,653 1,766,064 1,955,966
Mali 0 470,188 1,138,087 945,306 1,952,303 1,890,738 Slovakia 0 2,411,033 2,262,148 1,523,529 760,458 1,860,299 Croatia 0 5,054,028 2,910,115 2,037,291 1,796,461 1,547,790 Rwanda 0 1,104,708 1,341,538 1,816,923 1,090,588 950,035 Iceland 0 1,413,639 1,114,173 1,286,879 1,044,781 836,168 Kiribati 0 568,191 787,960 1,317,760 1,750,879 742,924 Slovenia 0 1,640,109 696,164 210,678 966,747 547,081 Macedonia, the former Yugoslav Republic of
0 140,298 79,151 178,769 106,067 344,553
Guinea-Bissau 0 66,105 196,015 85,463 111,017 54,227 Russian Federation 1 768,235,355 1,125,966,590 1,479,276,580 1,259,593,018 901,039,991 Nigeria 1 603,862,004 808,621,277 927,662,229 1,006,511,945 781,886,923 New Zealand 1 294,254,329 331,785,337 344,060,167 464,583,355 540,799,889 Kenya 1 248,731,398 227,305,333 252,383,944 350,932,988 390,055,176 Mongolia 1 97,876,199 291,584,990 240,778,214 223,066,759 187,635,393 Ghana 1 138,871,598 233,321,194 255,970,614 267,390,932 158,552,156 Japan 1 198,554,977 297,446,672 314,688,437 202,108,303 114,239,883 Tanzania, United Republic of
1 77,024,006 75,994,691 83,749,855 96,419,263 113,960,394
Guatemala 1 60,594,872 75,027,266 70,227,881 64,266,046 57,441,586 Costa Rica 1 44,267,174 60,618,363 56,670,853 41,331,200 48,010,365 Congo 1 18,897,538 22,469,411 31,340,264 31,479,401 38,324,076 Guyana 1 29,493,430 32,232,681 35,405,803 34,393,109 31,202,810 Honduras 1 32,551,693 35,085,691 39,859,949 31,689,299 23,766,438 El Salvador 1 16,308,837 18,650,215 27,109,788 27,810,919 20,271,752 Senegal 1 12,394,348 11,922,234 14,358,222 12,507,486 18,602,109 Paraguay 1 24,650,191 31,405,797 16,251,396 17,583,744 18,203,841 Kazakhstan 1 93,784,688 146,527,853 22,702,549 24,252,266 17,423,362 Tajikistan 1 12,605,996 10,257,997 11,163,281 9,211,361 13,481,188 Israel 1 26,283,158 28,044,643 17,194,671 12,559,674 11,734,591 Oman 1 2,806,891 4,855,854 6,481,515 8,119,273 8,735,344 Nicaragua 1 8,807,134 9,803,466 9,755,120 8,526,272 7,969,229 Sierra Leone 1 9,560,925 12,878,974 11,419,493 14,423,929 6,926,962 Liberia 1 15,416,178 24,188,881 22,838,897 9,551,069 5,585,169 Gambia 1 2,918,932 3,035,641 3,727,849 4,002,687 4,374,200 Belarus 1 20,482,860 42,288,790 3,079,832 6,496,746 4,116,320 Turkmenistan 1 461,871 743,889 501,506 105,943 980,876 Eritrea 1 245,796 429,386 537,006 729,570 775,564

36 | www.usitc.gov
Importer Restrict 2010 2011 2012 2013 2014 Bosnia and Herzegovina
1 962,825 363,546 288,497 264,834 586,226
Cape Verde 1 31,576 110,154 132,989 4 87,451 Moldova, Republic of 1 71,697 3 59,186 584,064 34,097 Sao Tome and Principe
1 2 16,101 158,788 3 17,567
Mexico 2 329,235,206 324,376,904 333,523,314 643,847,551 748,571,153 Myanmar 2 32,507,404 156,317,893 777,763,557 635,538,386 634,499,753 Sri Lanka 2 258,826,232 457,767,858 125,028,803 268,827,467 559,358,694 Jordan 2 631,100,694 579,952,825 790,379,213 804,514,199 540,788,685 Libyan Arab Jamahiriya
2 259,315,450 101,459,527 626,704,015 516,115,468 295,530,660
Dominican Republic 2 286,215,541 252,958,543 206,038,581 212,038,943 245,427,510 United States 2 70,022,747 90,346,656 122,059,059 134,449,334 229,317,606 Bangladesh 2 231,632,131 168,855,166 76,269,186 122,217,382 220,157,538 Pakistan 2 84,001,500 194,327,856 258,337,300 142,399,063 167,924,310 Yemen 2 88,298,972 72,366,838 134,912,087 174,769,088 155,076,362 South Africa 2 162,839,059 171,940,976 131,461,331 124,303,150 103,289,163 Australia 2 120,085,767 136,766,171 110,991,994 106,532,687 101,828,646 Singapore 2 36,676,813 30,598,990 39,925,244 38,823,225 96,553,862 Trinidad and Tobago 2 37,831,683 35,825,399 57,689,635 80,371,864 78,079,515 Bolivia, Plurinational State of
2 15,185,710 33,650,352 36,921,476 66,685,863 68,469,893
Viet Nam 2 355,627,559 261,766,685 108,839,439 43,898,103 66,471,072 Kuwait 2 93,737,150 133,153,500 120,300,443 76,889,046 64,099,686 Korea, Republic of 2 50,515,433 50,709,564 45,475,394 52,644,144 52,781,206 Mauritius 2 34,777,707 27,114,315 36,494,323 49,031,181 48,249,991 Cyprus 2 34,592,484 16,384,142 14,839,637 16,958,611 29,963,210 Qatar 2 9,033,733 10,452,348 19,772,536 27,050,686 29,737,781 Botswana 2 11,644,574 25,805,807 30,961,779 17,322,891 21,037,270 Angola 2 34,971,487 19,476,875 26,433,045 23,731,390 18,008,467 Fiji 2 3,263,375 4,482,508 7,013,745 12,049,294 15,770,457 Namibia 2 9,044,776 8,015,208 10,373,503 9,381,232 11,097,640 Barbados 2 10,625,307 10,753,589 8,382,001 7,514,219 10,275,397 Afghanistan 2 47,200,104 38,451,908 34,298,811 16,546,885 6,086,296 Morocco 2 7,354,105 9,278,380 4,145,278 3,645,339 4,812,229 Peru 2 132,148,672 61,092,461 60,013,796 7,274,969 4,797,173 Brunei Darussalam 2 12,770,140 2,507,077 3,649,102 13,601,422 4,772,376 Swaziland 2 3,440,390 2,031,909 2,710,874 2,594,398 3,538,434 Argentina 2 5,675,723 5,356,288 3,127,485 2,974,304 3,463,714 Hungary 2 731,304 1,126,685 864,675 2,368,772 2,932,851 Iran, Islamic Republic of
2 6,003,046 6,770,504 9,814,060 4,234,492 1,465,397
Seychelles 2 345,858 267,537 175,389 115,097 554,943 Central African Republic
2 472,209 632,890 199,067 67,701 54,505
Nepal 2 235,328 31,424 3 16,753 10,060 Syrian Arab Republic 2 16,269,535 Chile 3 307,447,303 335,492,778 289,909,191 331,953,852 260,910,232

Examining Barriers to Trade in Used Vehicles
U.S. International Trade Commission | 37
Importer Restrict 2010 2011 2012 2013 2014 Indonesia 3 231,948,339 161,020,351 167,680,972 109,619,968 121,806,306 Turkey 3 70,269,235 66,897,004 159,841,691 139,058,241 97,900,142 Philippines 3 74,518,603 52,916,357 74,518,083 64,717,246 63,827,848 Venezuela, Bolivarian Republic of
3 15,300,376 10,739,851 10,318,044 9,348,192 17,016,194
Ecuador 3 13,062,481 9,964,426 7,438,656 7,444,938 13,932,390 Canada 3 5,151,518 4,474,882 3,998,154 5,125,201 8,237,041 Sudan 3 26,996,297 11,296,244 8,967,323 8,126,741 7,749,831 Colombia 3 7,972,112 5,596,410 6,496,017 9,649,851 7,492,825 Brazil 3 17,500,311 21,004,567 5,253,806 4,066,228 4,435,899 Ethiopia 3 487,933 1,009,812 578,665 611,778 1,035,284 Bhutan 3 8,518 79,911 4 6,731 192,652 China 3 0 0 0 0 0 Comoros 6,305 3 1,614 3 10,350 Source: Authors research and calculations based on GTIS, Global Trade Atlas Database (accessed January 19, 2016).
38 | www.usitc.gov
Appendix B Data from Figures Used in Report
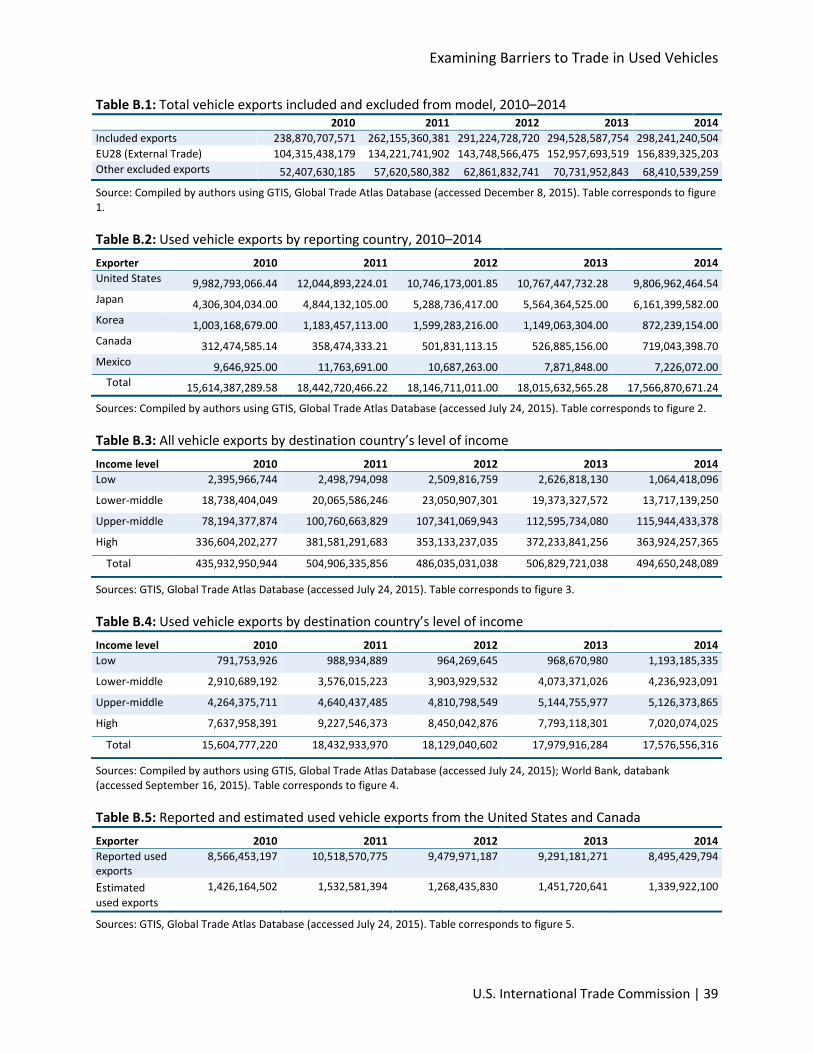
Examining Barriers to Trade in Used Vehicles
U.S. International Trade Commission | 39
Table B.1: Total vehicle exports included and excluded from model, 2010–2014 2010 2011 2012 2013 2014 Included exports 238,870,707,571 262,155,360,381 291,224,728,720 294,528,587,754 298,241,240,504 EU28 (External Trade) 104,315,438,179 134,221,741,902 143,748,566,475 152,957,693,519 156,839,325,203 Other excluded exports 52,407,630,185 57,620,580,382 62,861,832,741 70,731,952,843 68,410,539,259
Source: Compiled by authors using GTIS, Global Trade Atlas Database (accessed December 8, 2015). Table corresponds to figure 1.
Table B.2: Used vehicle exports by reporting country, 2010–2014 Exporter 2010 2011 2012 2013 2014 United States 9,982,793,066.44 12,044,893,224.01 10,746,173,001.85 10,767,447,732.28 9,806,962,464.54 Japan 4,306,304,034.00 4,844,132,105.00 5,288,736,417.00 5,564,364,525.00 6,161,399,582.00 Korea 1,003,168,679.00 1,183,457,113.00 1,599,283,216.00 1,149,063,304.00 872,239,154.00 Canada 312,474,585.14 358,474,333.21 501,831,113.15 526,885,156.00 719,043,398.70 Mexico 9,646,925.00 11,763,691.00 10,687,263.00 7,871,848.00 7,226,072.00
Total 15,614,387,289.58 18,442,720,466.22 18,146,711,011.00 18,015,632,565.28 17,566,870,671.24
Sources: Compiled by authors using GTIS, Global Trade Atlas Database (accessed July 24, 2015). Table corresponds to figure 2.
Table B.3: All vehicle exports by destination country’s level of income Income level 2010 2011 2012 2013 2014 Low 2,395,966,744 2,498,794,098 2,509,816,759 2,626,818,130 1,064,418,096
Lower-middle 18,738,404,049 20,065,586,246 23,050,907,301 19,373,327,572 13,717,139,250
Upper-middle 78,194,377,874 100,760,663,829 107,341,069,943 112,595,734,080 115,944,433,378
High 336,604,202,277 381,581,291,683 353,133,237,035 372,233,841,256 363,924,257,365
Total 435,932,950,944 504,906,335,856 486,035,031,038 506,829,721,038 494,650,248,089
Sources: GTIS, Global Trade Atlas Database (accessed July 24, 2015). Table corresponds to figure 3.
Table B.4: Used vehicle exports by destination country’s level of income Income level 2010 2011 2012 2013 2014 Low 791,753,926 988,934,889 964,269,645 968,670,980 1,193,185,335
Lower-middle 2,910,689,192 3,576,015,223 3,903,929,532 4,073,371,026 4,236,923,091
Upper-middle 4,264,375,711 4,640,437,485 4,810,798,549 5,144,755,977 5,126,373,865
High 7,637,958,391 9,227,546,373 8,450,042,876 7,793,118,301 7,020,074,025
Total 15,604,777,220 18,432,933,970 18,129,040,602 17,979,916,284 17,576,556,316
Sources: Compiled by authors using GTIS, Global Trade Atlas Database (accessed July 24, 2015); World Bank, databank (accessed September 16, 2015). Table corresponds to figure 4.
Table B.5: Reported and estimated used vehicle exports from the United States and Canada Exporter 2010 2011 2012 2013 2014 Reported used exports
8,566,453,197 10,518,570,775 9,479,971,187 9,291,181,271 8,495,429,794
Estimated used exports
1,426,164,502 1,532,581,394 1,268,435,830 1,451,720,641 1,339,922,100
Sources: GTIS, Global Trade Atlas Database (accessed July 24, 2015). Table corresponds to figure 5.

40 | www.usitc.gov
Appendix C Formulas

Examining Barriers to Trade in Used Vehicles
U.S. International Trade Commission | 41
This section explains the formulas used to calculate the effect different independent variables in our model have on the dependent variable based on the type of independent variable in question.
Suppose you have a model lnY = a*lnX + b*DummyVariable, where Y and X are continuous variables and DummyVariable is 0/1;
• The percentage change in Y for a 1 percentage change in X is equal to a. For this type of variable, in logs, the estimated coefficient is the elasticity. This is the case for Distance, TotalVehicles, GDPcap, Vehicleproduction , and Tariff in our estimations.
• The percentage change in Y when DummyVariable goes from zero to one is equal to: (e(b*1) - e(b*0)) / e(b*0) = eb-1. This is the case for Language, Landlocked, Contiguous, Colony, FTA, EU, and Sameside in our estimations.