examination of the measurement of absorption using the ... · pdf fileexamination of the...
TRANSCRIPT

29th Aerospace Testing Seminar, October 2015
Examination of the Measurement of Absorption Using the Reverberant
Room Method for Highly Absorptive Acoustic Foam
William O. Hughes
Anne M. McNelis
NASA Glenn Research Center at Lewis Field
Cleveland, OH
Chris Nottoli
Eric Wolfram
Riverbank Acoustical Laboratories
Geneva, IL
ABSTRACT
The absorption coefficient for material specimens are needed to quantify the expected acoustic
performance of that material in its actual usage and environment. The ASTM C423-09a standard,
“Standard Test Method for Sound Absorption and Sound Absorption Coefficients by the
Reverberant Room Method” is often used to measure the absorption coefficient of material test
specimens. This method has its basics in the Sabine formula. Although widely used, the
interpretation of these measurements are a topic of interest. For example, in certain cases the
measured Sabine absorption coefficients are greater than 1.0 for highly absorptive materials. This
is often attributed to the diffraction edge effect phenomenon. An investigative test program to
measure the absorption properties of highly absorbent melamine foam has been performed at the
Riverbank Acoustical Laboratories. This paper will present and discuss the test results relating to
the effect of the test materials’ surface area, thickness and edge sealing conditions. A follow-on
paper is envisioned that will present and discuss the results relating to the spacing between multiple
piece specimens, and the mounting condition of the test specimen.
KEY WORDS: Absorption, absorption coefficient, acoustic energy absorption coefficient,
acoustics, acoustic testing, ASTM C423, diffraction edge effect, Eyring absorption, payload
fairing acoustics, reverberation room, sabins, Sabine absorption coefficient, Sabine formula.
INTRODUCTION
NASA has an ongoing interest in utilizing melamine acoustic foam for noise reduction in their
future launch vehicles. In order to properly design the sound absorption systems used in aerospace,
architecture, and other noise control applications, the characterization of the absorption properties
of materials is needed. Normal incidence impedance and absorption may be obtained from
impedance tube test measurements. However, for many practical applications the measurement of
the random incidence absorption coefficient obtained from a reverberant chamber test is desired.
Indeed, it is the random incident absorption coefficient, 𝑎, also known as the Sabine absorption
https://ntrs.nasa.gov/search.jsp?R=20150023091 2018-05-10T17:10:32+00:00Z

29th Aerospace Testing Seminar, October 2015
coefficient, which is the parameter most available and widely used today in acoustic design to
specify the absorption performance of materials.
The reverberant chamber method is a well-established method which utilizes Sabine’s formula
(Sabine 1922, Sabine 1964), Equation 1, for the decay of sound for the determination of absorption
coefficients within a reverberant room.
𝑹𝑻𝟔𝟎 = 𝟎.𝟏𝟔𝟏 𝑽
𝑨 (1)
Here RT60 is the reverberation time (in seconds) for the sound in the reverberant room to decay 60
decibels (dB) once the sound source is turned off, V is the volume of the reverberant room (in m3),
and A is the total area of sound absorption (in m2, or also denoted as metric sabins), as defined by
Equation 2. (Note the English units for sound absorption are sabins, where one sabin was
originally described as “1 ft.2 of open window”.) The 0.161 value is a result of the numerical
calculation of [24 ln (10)]/c, where c is the speed of sound in air (in m/s) at 20° C (Celsius), and
ln is the natural logarithm.
𝑨 = 𝑺�̅� (2)
S is the total surface area of the reverberant room (in m2), and �̅� is the average Sabine absorption
coefficient of the reverberant room as defined by Equation 3.
�̅� = 𝒔𝟏𝒂𝟏+ 𝒔𝟐𝒂𝟐+⋯…+ 𝒔𝒏𝒂𝒏
𝑺 (3)
Here, 𝑎𝑖 is the Sabine absorption coefficient of the ith surface, 𝑠𝑖 (in m2).
By calculating the total area of sound absorption, A, with and without the test specimen in the
reverberant room, a measurement of the absorption of the test specimen can be calculated. The
American Society for Testing and Materials (ASTM) C423-09a standard “Standard Test Method
for Sound Absorption and Sound Absorption Coefficients by the Reverberant Room Method”
provides a method to achieve such results. This reverberant room method, although widely used
and rigorously defined by industry testing standards (such as the ASTM C423 and ISO 354
standards), has some conditions and inherent issues that may complicate the interpretation of the
measured absorption, including the values of the Sabine absorption coefficient. Some of these
considerations will be discussed later in this paper. Nonetheless, the Sabine absorption coefficients
have and continued to be used successfully for acoustic design problems. This success is
accomplished in spite of the fact that the actual “in-field” applications often take place in non-
diffuse fields, and with different surface areas and different diffraction edge effects than what is
experienced in the reverberant room test conditions.
For illustration purposes, Figure 1 provides an example of three plots of Sabine absorption
coefficients plots as a function of one-third octave band (OTOB) frequency (Hughes and McNelis
2014). Note that values greater than 1.0 for the Sabine absorption coefficient were measured.
Eyring (1930) pointed out that Sabine’s formula is really a special case of a more general equation
and should be used when the absorption coefficient is small, i.e. for “live” rooms, but not used for
surfaces with large absorption coefficients, i.e. for “dead” rooms. Using the Sabine formulation
can result in inaccurate absorption coefficients for highly absorptive materials. Various sources
(including Cox 2009, Crocker 1998) suggests that other formulations such as Eyring or Millington
be used instead of the Sabine formulation for such cases.

29th Aerospace Testing Seminar, October 2015
Figure 1. Examples of Sabine Absorption Coefficients for two thicknesses of melamine foam
(ML G, with no coversheet and unsealed edges), and fiberglass batting with a coversheet.
ASTM C423 METHODOLOGY (RIVERBANK ACOUSTICAL LABORATORIES)
ASTM C423, “Sound Absorption and Sound Absorption Coefficients by the Reverberation Room
Method”, provides a method to calculate the total absorption of a specimen by using the difference
in absorption obtained with an empty chamber and with a chamber with the test specimen. This
ASTM standard requires the measured frequency range of 100 Hz to 5 kHz (and that is the
frequency range of data presented in this paper). The following describes the implementation of
this standard test method at the Riverbank Acoustical Laboratories (RAL) located in Geneva, IL.
The RAL was founded in 1918 by Wallace Clement Sabine.
Measurements were made in the RAL’s 291.73 m3 (10,302.29 ft3) reverberation chamber (with the
following approximate dimensions: length = 8.27 m (27.16 ft.), width = 5.85 m (19.19 ft.), height
= 6.03 m (19.77 ft.)). A rotating microphone boom with a 7.98 m (314.17 in) circumferential
traverse was placed at a location such that the microphone is always at least 0.75 m (29.5 in) from
any surface. The rotating boom was set at 32 seconds per revolution. The temperature (°C), relative
humidity (%), and atmospheric pressure (kPa) were recorded and used to correct the measured
decay time for air absorption above 1,000 Hz using ANSI S1.26, Method for Calculation of the
Absorption of Sound by the Atmosphere.
The reverberation chamber also contains 5 stationary diffuser vanes and 2 rotating diffuser vanes
(rotating at 18 seconds per revolution). These large diffusers, scattered over the reverberation
room’s walls and ceiling, disrupt any acoustic standing waves and help improve the diffusivity of
the room’s acoustic field.

29th Aerospace Testing Seminar, October 2015
ASTM C423 requires that testing be performed to qualify the reverberation room in the frequency
range from 100 Hz to 5 kHz. The RAL reverberation room has been qualified to perform ASTM
C423 testing per the Reverberation Room Qualification criteria provided in ASTM C423
Appendix A.3. The diffusivity of the empty RAL reverberation room likely extends even lower
than the qualified 100 Hz OTOB, perhaps as low as the 63 Hz OTOB.
With the chamber cleared of all extraneous material (including the test specimen), pink noise
(equal sound power per octave) is generated in the chamber until a steady state signal is reached.
When the signal noise generator ceases, the decay of the sound pressure level in each frequency
band is measured every 0.034 second for 6.8 second (a total of 200 measurement points). This
process was repeated 80 times and averaged. ASTM C423 requires a minimum of 50 decays,
however RAL uses 80 decays in order to improve their average and minimize uncertainties. The
decay measurement is evaluated starting at approximately 100 milliseconds (ms) after the initial
decay until the sound pressure level decays 25 dB. The sound absorption of the empty chamber,
A1, is then computed using Equation 4.
𝑨 = 𝟎. 𝟗𝟐𝟏𝑽𝒅
𝒄 (4)
Where, V is the volume of the test chamber (m3), d is the sound decay rate (dB/s), and c is the
speed of sound in air (m/s).
The RT60 measurement originated with Wallace Clement Sabine’s experiments measuring the
practical human dynamic range of the decay of organ pipe sound to inaudibility with his ears and
a stopwatch. Today, the RT60 measurements are usually extrapolated from shorter, say 25 dB,
sound decay measurements. This allows the decay rate to be measured while the decay is linear
and still above the background noise levels of the room.
The test specimen is then placed on the floor asymmetrically relative to the test chamber walls at
a distance of at least 0.75 m (29.5 in.) from any reflective surface (except the floor surface) and
from the microphone traverse. The aforementioned steps are repeated and the sound absorption of
the chamber with specimen, A2, is computed using Equation 4. The total sound absorption added
to the room by the specimen, A, is then calculated as follows:
A = A2 - A1 (5)
Where, A is the Sabine absorption of the test specimen (m2), A1 is the Sabine absorption of the
empty reverberation chamber (m2), and A2 is the Sabine absorption of the chamber with the test
specimen present (m2).
Finally, the Sabine absorption coefficient can be computed by dividing the absorption of the test
specimen, A, by the test specimen’s surface area, S (m2). Under most normal conditions, S is the
top surface area of the material.
𝜶 = 𝑨
𝑺 (6)
Figure 2 is a photograph of the RAL ASTM C423 sound absorption test setup. This Figure shows
the test specimen (standard density Soundfoam® melamine foam, ML G, for this test) on the floor
with unsealed edges. Per ASTM C423, the edges of a test specimen are normally sealed off with
a mixture of reflective steel beams and Masonite wood strips to avoid any added absorption being
contributed by the side edge areas. Figure 2 also illustrates other aspects of the RAL reverberation
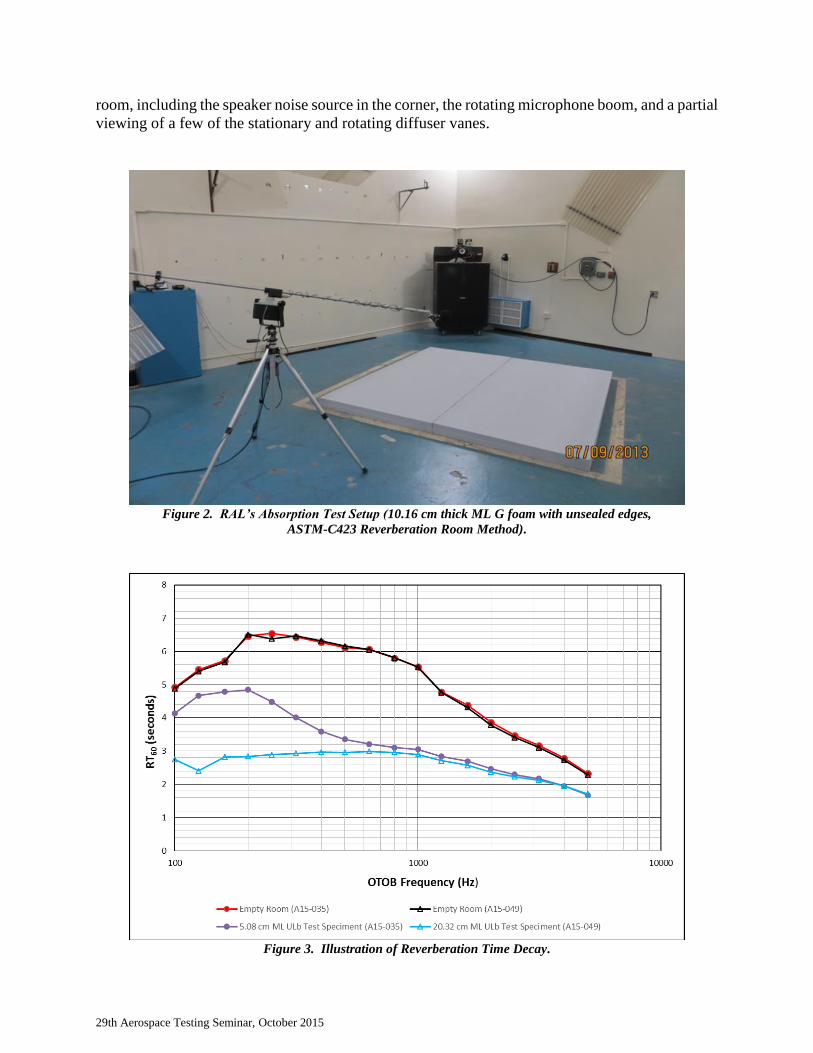
29th Aerospace Testing Seminar, October 2015
room, including the speaker noise source in the corner, the rotating microphone boom, and a partial
viewing of a few of the stationary and rotating diffuser vanes.
Figure 2. RAL’s Absorption Test Setup (10.16 cm thick ML G foam with unsealed edges,
ASTM-C423 Reverberation Room Method).
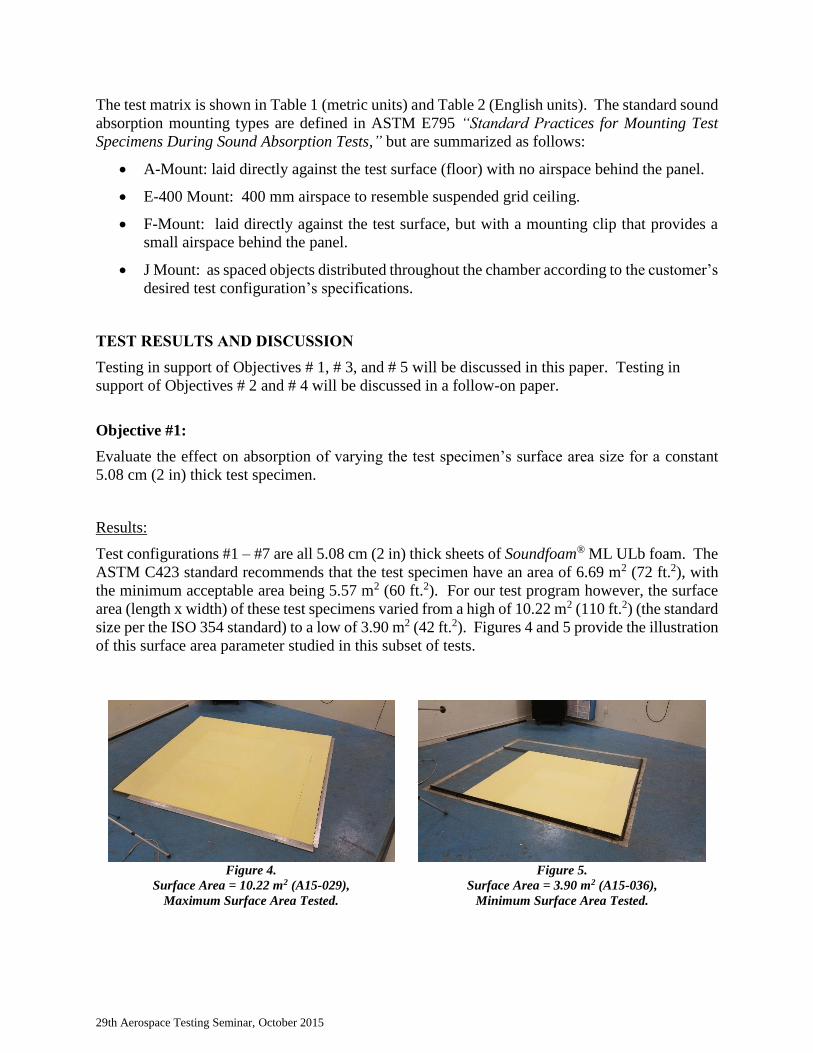
Figure 3. Illustration of Reverberation Time Decay.

29th Aerospace Testing Seminar, October 2015
Figure 3 is an illustration on how the RT60 decay times of the RAL reverberant room changes with
the introduction of an absorptive test specimen. The RT60 times for two measurements of the
empty room (with no test specimen) is shown; note that even though these two empty room tests
were performed five days apart they are in excellent agreement in all OTOBs. When a “good” test
specimen absorber (5.08 cm of melamine foam) is present the RT60 times become smaller. When
a “better” test specimen absorber (20.32 cm of melamine foam) is present the RT60 times become
even smaller still, especially at the lower frequencies.
INVESTIGATIVE TEST PROGRAM
As shown in Figure 1, it is possible to get Sabine absorption coefficients greater than 1.0. A
number of tests performed for NASA Glenn Research Center at RAL in the past few years on
highly absorptive, and relatively thick, melamine foam resulted in several such occurrences
(Hughes and McNelis 2014). ASTM C423 and others sources (Cox 2009, Sauro 2009) associate
Sabine absorption coefficients greater than 1.0 with the diffraction edge effect phenomenon. That
is, diffraction of the sound wave over the edges of the test specimen causes the apparent surface
area of the test specimen (“its acoustic footprint”) to be larger than its actual physical surface area.
When the test specimen is highly absorptive this can result in Sabine absorption coefficients
greater than 1.0.
In an effort to further investigate the diffraction edge effect the authors proposed a test program to
explore these issues in a study using highly absorptive melamine foam. The Soundcoat Company
Inc. (Irvine, CA) donated their newest melamine ultralight acoustic foam product for this test
program. All testing was done using the Soundfoam® ML ULb (melamine ultralight) foam. This
foam product is a lightweight, flexible, open-cell acoustic foam, with a mass density of 6.0 kg/m3
(0.375 lb/ft3). Soundcoat’s Soundfoam® ML ULb foam is formulated to have lower formaldehyde
emissions, while maintaining similar acoustic properties, than their original ML UL product. The
Riverbank Acoustical Laboratories donated the use of their test facility and engineering services
for the performance of the ASTM C423 test series for this study. The testing was performed in
March – April 2015 at RAL.
The objectives for this test program, relative to measuring the test specimen’s absorption, are:
Objective # 1: Evaluate the effect on absorption of varying the test specimen’s surface
area size for a constant 5.08 cm (2 in) thick test specimen.
Objective # 2: Evaluate the effect on absorption of varying an airspace gap between the
test specimen and the floor.
Objective # 3: Evaluate the effect on absorption of changing the test specimen’s thickness
for a constant surface area of 6.69 m2 (64 ft.2).
Objective # 4: Evaluate the effect on absorption of separating the test specimen into several
pieces with air gaps between these pieces.
Objective # 5: Evaluate the effect on absorption of keeping the overall (both top and side
edges) surface area constant for two different shape test specimens.
29th Aerospace Testing Seminar, October 2015
The test matrix is shown in Table 1 (metric units) and Table 2 (English units). The standard sound
absorption mounting types are defined in ASTM E795 “Standard Practices for Mounting Test
Specimens During Sound Absorption Tests,” but are summarized as follows:
A-Mount: laid directly against the test surface (floor) with no airspace behind the panel.
E-400 Mount: 400 mm airspace to resemble suspended grid ceiling.
F-Mount: laid directly against the test surface, but with a mounting clip that provides a
small airspace behind the panel.
J Mount: as spaced objects distributed throughout the chamber according to the customer’s
desired test configuration’s specifications.
TEST RESULTS AND DISCUSSION
Testing in support of Objectives # 1, # 3, and # 5 will be discussed in this paper. Testing in
support of Objectives # 2 and # 4 will be discussed in a follow-on paper.
Objective #1:
Evaluate the effect on absorption of varying the test specimen’s surface area size for a constant
5.08 cm (2 in) thick test specimen.
Results:
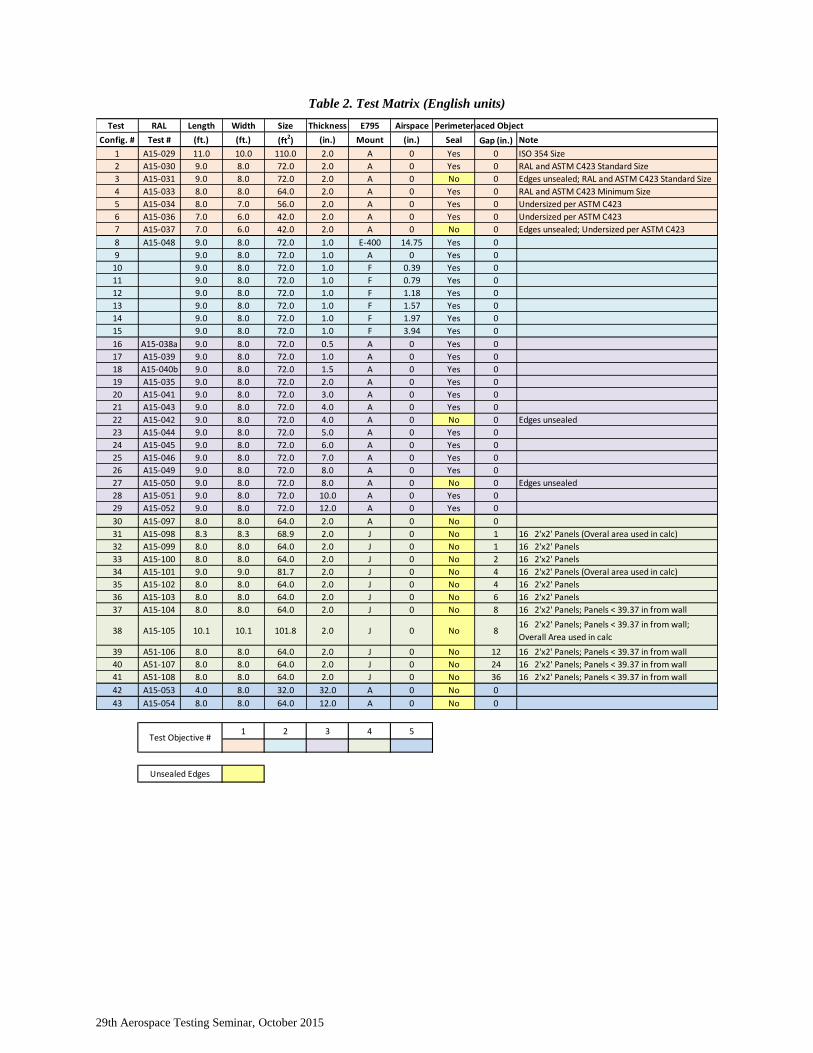
Test configurations #1 – #7 are all 5.08 cm (2 in) thick sheets of Soundfoam® ML ULb foam. The
ASTM C423 standard recommends that the test specimen have an area of 6.69 m2 (72 ft.2), with
the minimum acceptable area being 5.57 m2 (60 ft.2). For our test program however, the surface
area (length x width) of these test specimens varied from a high of 10.22 m2 (110 ft.2) (the standard
size per the ISO 354 standard) to a low of 3.90 m2 (42 ft.2). Figures 4 and 5 provide the illustration
of this surface area parameter studied in this subset of tests.
Figure 4.
Surface Area = 10.22 m2 (A15-029),
Maximum Surface Area Tested.
Figure 5.
Surface Area = 3.90 m2 (A15-036),
Minimum Surface Area Tested.

29th Aerospace Testing Seminar, October 2015
Table 1. Test Matrix (metric units)
Test RAL Length Width Size Thickness E795 Airspace Perimeter Spaced Object
Config. # Test # (m) (m) (m2) (cm) Mount (mm) Seal Gap (cm) Note
1 A15-029 3.35 3.05 10.22 5.08 A 0 Yes 0 ISO 354 Size
2 A15-030 2.74 2.44 6.69 5.08 A 0 Yes 0 RAL and ASTM C423 Standard Size
3 A15-031 2.74 2.44 6.69 5.08 A 0 No 0 Edges unsealed; RAL and ASTM C423 Standard Size
4 A15-033 2.44 2.44 5.95 5.08 A 0 Yes 0 RAL and ASTM C423 Minimum Size
5 A15-034 2.44 2.13 5.21 5.08 A 0 Yes 0 Undersized per ASTM C423
6 A15-036 2.13 1.83 3.90 5.08 A 0 Yes 0 Undersized per ASTM C423
7 A15-037 2.13 1.83 3.90 5.08 A 0 No 0 Edges unsealed; Undersized per ASTM C423
8 A15-048 2.74 2.44 6.69 2.54 E-400 375 Yes 0
9 2.74 2.44 6.69 2.54 A 0 Yes 0
10 2.74 2.44 6.69 2.54 F 10 Yes 0
11 2.74 2.44 6.69 2.54 F 20 Yes 0
12 2.74 2.44 6.69 2.54 F 30 Yes 0
13 2.74 2.44 6.69 2.54 F 40 Yes 0
14 2.74 2.44 6.69 2.54 F 50 Yes 0
15 2.74 2.44 6.69 2.54 F 100 Yes 0
16 A15-038a 2.74 2.44 6.69 1.27 A 0 Yes 0
17 A15-039 2.74 2.44 6.69 2.54 A 0 Yes 0
18 A15-040b 2.74 2.44 6.69 3.81 A 0 Yes 0
19 A15-035 2.74 2.44 6.69 5.08 A 0 Yes 0
20 A15-041 2.74 2.44 6.69 7.62 A 0 Yes 0
21 A15-043 2.74 2.44 6.69 10.16 A 0 Yes 0
22 A15-042 2.74 2.44 6.69 10.16 A 0 No 0 Edges unsealed
23 A15-044 2.74 2.44 6.69 12.70 A 0 Yes 0
24 A15-045 2.74 2.44 6.69 15.24 A 0 Yes 0
25 A15-046 2.74 2.44 6.69 17.78 A 0 Yes 0
26 A15-049 2.74 2.44 6.69 20.32 A 0 Yes 0
27 A15-050 2.74 2.44 6.69 20.32 A 0 No 0 Edges unsealed
28 A15-051 2.74 2.44 6.69 25.40 A 0 Yes 0
29 A15-052 2.74 2.44 6.69 30.48 A 0 Yes 0
30 A15-097 2.44 2.44 5.95 5.08 A 0 No 0
31 A15-098 2.53 2.53 6.41 5.08 J 0 No 2.54 16 0.61 m x 0.61 m Panels (Overal area used in calc)
32 A15-099 2.44 2.44 5.95 5.08 J 0 No 2.54 16 0.61 m x 0.61 m Panels
33 A15-100 2.44 2.44 5.95 5.08 J 0 No 5.08 16 0.61 m x 0.61 m Panels
34 A15-101 2.76 2.76 7.60 5.08 J 0 No 10.16 16 0.61 m x 0.61 m Panels (Overal area used in calc)
35 A15-102 2.44 2.44 5.95 5.08 J 0 No 10.16 16 0.61 m x 0.61 m Panels
36 A15-103 2.44 2.44 5.95 5.08 J 0 No 15.24 16 0.61 m x 0.61 m Panels
37 A15-104 2.44 2.44 5.95 5.08 J 0 No 20.32 16 0.61 m x 0.61 m Panels; Panels <1m from wall
38 A15-105 3.08 3.07 9.46 5.08 J 0 No 20.3216 0.61 m x 0.61 m Panels; Panels <1m from wall
(Overall Area used in calc)
39 A51-106 2.44 2.44 5.95 5.08 J 0 No 30.48 16 0.61 m x 0.61 m Panels; Panels <1m from wall
40 A51-107 2.44 2.44 5.95 5.08 J 0 No 60.96 16 0.61 m x 0.61 m Panels; Panels <1m from wall
41 A51-108 2.44 2.44 5.95 5.08 J 0 No 91.44 16 0.61 m x 0.61 m Panels; Panels <1m from wall
42 A15-053 1.22 2.44 2.97 81.28 A 0 No 0
43 A15-054 2.44 2.44 5.95 30.48 A 0 No 0
1 2 3 4 5
Unsealed Edges
Test Objective #
29th Aerospace Testing Seminar, October 2015
Table 2. Test Matrix (English units)
Test RAL Length Width Size Thickness E795 Airspace PerimeterSpaced Object
Config. # Test # (ft.) (ft.) (ft2) (in.) Mount (in.) Seal Gap
(in.) Note
1 A15-029 11.0 10.0 110.0 2.0 A 0 Yes 0 ISO 354 Size
2 A15-030 9.0 8.0 72.0 2.0 A 0 Yes 0 RAL and ASTM C423 Standard Size
3 A15-031 9.0 8.0 72.0 2.0 A 0 No 0 Edges unsealed; RAL and ASTM C423 Standard Size
4 A15-033 8.0 8.0 64.0 2.0 A 0 Yes 0 RAL and ASTM C423 Minimum Size
5 A15-034 8.0 7.0 56.0 2.0 A 0 Yes 0 Undersized per ASTM C423
6 A15-036 7.0 6.0 42.0 2.0 A 0 Yes 0 Undersized per ASTM C423
7 A15-037 7.0 6.0 42.0 2.0 A 0 No 0 Edges unsealed; Undersized per ASTM C423
8 A15-048 9.0 8.0 72.0 1.0 E-400 14.75 Yes 0
9 9.0 8.0 72.0 1.0 A 0 Yes 0
10 9.0 8.0 72.0 1.0 F 0.39 Yes 0
11 9.0 8.0 72.0 1.0 F 0.79 Yes 0
12 9.0 8.0 72.0 1.0 F 1.18 Yes 0
13 9.0 8.0 72.0 1.0 F 1.57 Yes 0
14 9.0 8.0 72.0 1.0 F 1.97 Yes 0
15 9.0 8.0 72.0 1.0 F 3.94 Yes 0
16 A15-038a 9.0 8.0 72.0 0.5 A 0 Yes 0
17 A15-039 9.0 8.0 72.0 1.0 A 0 Yes 0
18 A15-040b 9.0 8.0 72.0 1.5 A 0 Yes 0
19 A15-035 9.0 8.0 72.0 2.0 A 0 Yes 0
20 A15-041 9.0 8.0 72.0 3.0 A 0 Yes 0
21 A15-043 9.0 8.0 72.0 4.0 A 0 Yes 0
22 A15-042 9.0 8.0 72.0 4.0 A 0 No 0 Edges unsealed
23 A15-044 9.0 8.0 72.0 5.0 A 0 Yes 0
24 A15-045 9.0 8.0 72.0 6.0 A 0 Yes 0
25 A15-046 9.0 8.0 72.0 7.0 A 0 Yes 0
26 A15-049 9.0 8.0 72.0 8.0 A 0 Yes 0
27 A15-050 9.0 8.0 72.0 8.0 A 0 No 0 Edges unsealed
28 A15-051 9.0 8.0 72.0 10.0 A 0 Yes 0
29 A15-052 9.0 8.0 72.0 12.0 A 0 Yes 0
30 A15-097 8.0 8.0 64.0 2.0 A 0 No 0
31 A15-098 8.3 8.3 68.9 2.0 J 0 No 1 16 2'x2' Panels (Overal area used in calc)
32 A15-099 8.0 8.0 64.0 2.0 J 0 No 1 16 2'x2' Panels
33 A15-100 8.0 8.0 64.0 2.0 J 0 No 2 16 2'x2' Panels
34 A15-101 9.0 9.0 81.7 2.0 J 0 No 4 16 2'x2' Panels (Overal area used in calc)
35 A15-102 8.0 8.0 64.0 2.0 J 0 No 4 16 2'x2' Panels
36 A15-103 8.0 8.0 64.0 2.0 J 0 No 6 16 2'x2' Panels
37 A15-104 8.0 8.0 64.0 2.0 J 0 No 8 16 2'x2' Panels; Panels < 39.37 in from wall
38 A15-105 10.1 10.1 101.8 2.0 J 0 No 816 2'x2' Panels; Panels < 39.37 in from wall;
Overall Area used in calc
39 A51-106 8.0 8.0 64.0 2.0 J 0 No 12 16 2'x2' Panels; Panels < 39.37 in from wall
40 A51-107 8.0 8.0 64.0 2.0 J 0 No 24 16 2'x2' Panels; Panels < 39.37 in from wall
41 A51-108 8.0 8.0 64.0 2.0 J 0 No 36 16 2'x2' Panels; Panels < 39.37 in from wall
42 A15-053 4.0 8.0 32.0 32.0 A 0 No 0
43 A15-054 8.0 8.0 64.0 12.0 A 0 No 0
1 2 3 4 5Test Objective #
Unsealed Edges

29th Aerospace Testing Seminar, October 2015
One might expect that the measured total sound absorption (in m2) would be proportional to the
exposed top surface area. If so, then the sound absorption measured in the 10.22 m2 configuration
would be a factor of 2.62 times (10.22 m2 / 3.90 m2) the measured sound absorption for the 3.90
m2 configuration. However, per the sound absorption data of Figure 6, it is found that in the 315
Hz to 5 kHz OTOBs frequency range, the ratio is slightly less, being between 2.22 to 2.53. That
is, the test specimens with the larger surface area produce sound absorption measurements smaller
than what would be predicted purely by scaling absorption levels from the smaller test specimens.
The Sabine absorption coefficient can be computed per Equation 6 and these values are shown in
Figure 7. A review of the data in Figure 7 illustrates that although the Sabine absorption coefficient
for the 5.08 cm (2 in) thick Soundfoam® ML ULb foam is close for these various test specimens
with varying surface areas, they are not the same. Again, the larger surface area test specimens
have smaller Sabine absorption coefficients than does the smaller surface area test specimens.
Discussion:
It has been well documented (Bartel 1981, Nelson 1990, Sauro 2009, Cox 2009, and others) that
the measured apparent Sabine absorption coefficient will be greater for test specimens with a
smaller surface area, compared to the identical material with a larger surface area. This effect is
dependent upon the ratio of the specimen’s perimeter to its area, and will vary with both
wavelength and with the specific material (i.e., foam will behave differently than fiberglass, wood,
and other materials).
Bartel (1981) suggests a linear relationship between the absorption coefficient and the relative
edge length of the test specimen as shown in Equation 7.
𝜶 = 𝜶𝟎 + 𝜷𝑬 (7)
Here, α is the apparent Sabine absorption coefficient of a given test specimen as measured by the
reverberant room method, α0 is the “true” absorption coefficient (i.e. for an infinite size test
specimen and thus with no diffraction edge effect), β is a constant (at each particular frequency for
a specific material), and E (m-1) is the ratio of the test specimen’s perimeter (m) to its surface area
(m2).
Bartel states that this linear relationship is a better approximation for some materials compared to
others. Also, Bartel states that this relationship is approximately true whether or not the side edges
are sealed (covered with a reflective material) during testing or not, although varying the sealing
condition would result in different values of β. Finally, Bartel notes that the extrapolation of this
relationship to a value of E = 0 to obtain α0, the true absorption coefficient for an infinite size
specimen, may in general not always hold. However, this equation does have merit in using
available test measured data to estimate by interpolation or extrapolation the absorption
coefficients for an application of the same material with a different (finite) surface area, thereby
eliminating the need for additional testing with that new size test specimen.
The Sabine absorption coefficient measured in our testing, was used to produce a plot of Sabine
absorption coefficient versus E for various OTOB frequencies using the method outlined by Bartel.
These results are shown in Figure 8. For this Figure, the best linear fit equation was used to fit to
the five data points at each OTOB frequency. From this fit, the values of α0 (y-intercept) and β
(slope) can be derived. This would allow the calculation of the absorption, α, for any size of E.

29th Aerospace Testing Seminar, October 2015
Figure 6. Sound Absorption as a function of Surface Area.
Figure 7. Sabine Absorption Coefficient as a function of Surface Area.

29th Aerospace Testing Seminar, October 2015
The test data shown in Figure 8 isn’t as linearly well behaved as the data that Bartel provides, but
it does present an example of this method. One can see that this type of plot could be useful to
predict Sabine absorption coefficients for the same material of a different surface area size when
you already have Sabine absorption coefficient data for that material from other test specimen
sizes. By extrapolating the linear equation all the way to E=0 (y-axis intercept), as shown in
Figure 8, would in theory give the Sabine absorption coefficient for that material if it were of
infinite size (and therein have no diffraction edge effect).
Figure 8. Sabine Absorption Coefficient as a function of E.

29th Aerospace Testing Seminar, October 2015
Objective # 3:
Evaluate the effect on absorption of changing the test specimen’s thickness for a constant surface
area.
Results:
Test configurations # 16 – 29 all have top surface areas of 2.74 m x 2.44 m = 6.69 m2 (9 ft. x 8 ft.
= 72 ft.2). The thickness of the ML ULb foam is varied from a low of 1.27 cm (0.5 in) to a high
of 30.48 cm (12 in). Photographs of a few of these test configurations are shown in Figures 9-12.
Acoustic foam is often used in today’s aerospace industry. The inside of the launch vehicle’s
payload fairing is lined with foam in order to reduce the amount of the acoustic noise reaching and
possibly damaging the spacecraft. The acoustic noise is generated during the liftoff and ascent
phases of the flight. Typically such foams are on the order of 5.08 – 10.16 cm (2 – 4 in) in
thickness, as stated in launch vehicle payload user guides. Hughes and McNelis (2014) have
recently characterized the absorption (and transmission loss) characteristics of even thicker
melamine foam materials with the expectation of improving the noise reduction at lower
frequencies. Since both weight and the available physical space is important for launch vehicle
fairing applications of acoustic foam, knowing how the foam’s absorption varies with thickness is
of interest, and thus a wide range of thicknesses were tested.
Figure 9. Thickness = 1.27 cm (A15-038a).
Figure 10. Thickness = 7.62 cm (A15-041).
Figure 11. Thickness = 15.24 cm (A15-045).
Figure 12. Thickness = 30.48 cm (A15-052).

29th Aerospace Testing Seminar, October 2015
As the thickness of the foam increases the acoustic performance of the foam typically improves.
As the foam thickness increases, the frequency at which the peak absorption occurs becomes lower
and the overall magnitude of absorption increases, especially at lower frequencies (Hughes and
McNelis 2014, and many others). These trends are illustrated in Figures 13 and 14, for the Sound
Absorption and Sabine absorption coefficient, respectively.
Figure 13. Sound Absorption as a function of the Thickness of the Test Specimen.
Figure 14. Sabine Absorption Coefficient as a function of the Thickness of the Test Specimen.
29th Aerospace Testing Seminar, October 2015
Discussion:
It is thought that the improvement in absorption seen with increasing thickness is primarily due to
the thickness factor itself. Low frequencies have long wavelengths which means the absorbers
have to be large to absorb the low frequencies’ wave fronts.
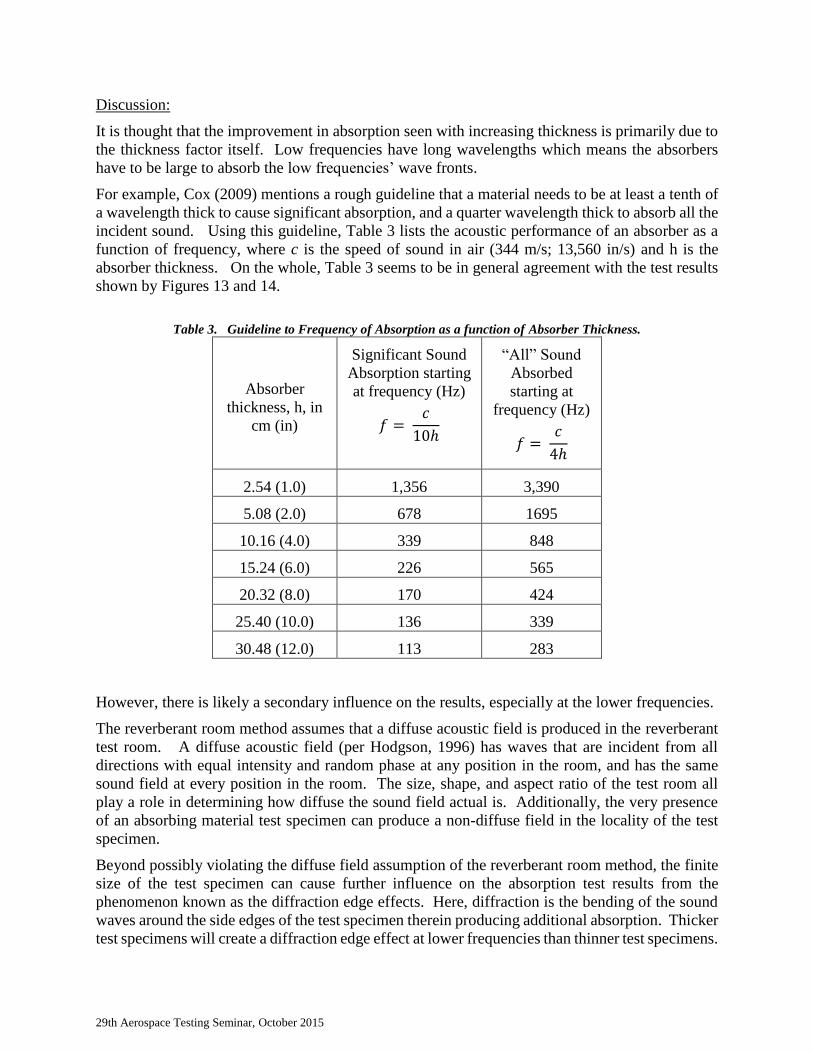
For example, Cox (2009) mentions a rough guideline that a material needs to be at least a tenth of
a wavelength thick to cause significant absorption, and a quarter wavelength thick to absorb all the
incident sound. Using this guideline, Table 3 lists the acoustic performance of an absorber as a
function of frequency, where c is the speed of sound in air (344 m/s; 13,560 in/s) and h is the
absorber thickness. On the whole, Table 3 seems to be in general agreement with the test results
shown by Figures 13 and 14.
Table 3. Guideline to Frequency of Absorption as a function of Absorber Thickness.
Absorber
thickness, h, in
cm (in)
Significant Sound
Absorption starting
at frequency (Hz)
𝑓 = 𝑐
10ℎ
“All” Sound
Absorbed
starting at
frequency (Hz)
𝑓 = 𝑐
4ℎ
2.54 (1.0) 1,356 3,390
5.08 (2.0) 678 1695
10.16 (4.0) 339 848
15.24 (6.0) 226 565
20.32 (8.0) 170 424
25.40 (10.0) 136 339
30.48 (12.0) 113 283
However, there is likely a secondary influence on the results, especially at the lower frequencies.
The reverberant room method assumes that a diffuse acoustic field is produced in the reverberant
test room. A diffuse acoustic field (per Hodgson, 1996) has waves that are incident from all
directions with equal intensity and random phase at any position in the room, and has the same
sound field at every position in the room. The size, shape, and aspect ratio of the test room all
play a role in determining how diffuse the sound field actual is. Additionally, the very presence
of an absorbing material test specimen can produce a non-diffuse field in the locality of the test
specimen.
Beyond possibly violating the diffuse field assumption of the reverberant room method, the finite
size of the test specimen can cause further influence on the absorption test results from the
phenomenon known as the diffraction edge effects. Here, diffraction is the bending of the sound
waves around the side edges of the test specimen therein producing additional absorption. Thicker
test specimens will create a diffraction edge effect at lower frequencies than thinner test specimens.

29th Aerospace Testing Seminar, October 2015
Also, lower frequencies diffract to a greater degree than higher frequencies. Therefore, it is
surmised that some unknown portion of the absorption observed in Figures 13 and 14 is attributable
to diffraction. The observed peaking of the absorption in the 125 Hz OTOB for the test specimens
with thickness of 17.78 cm (7 in) or larger may be a sign of this effect, although diffraction edge
effects are likely to contribute to the measured absorption for test specimens with even smaller
thickness.
There is no doubt that the diffraction edge effect plays a role in increasing the absorption and
Sabine absorption coefficients measured in test using the reverberation room method. Cox (2009)
states that diffraction at the edges of the test specimen creates excess absorption in the
reverberation chamber measurements, and he attributes it to the impedance discontinuity at the
specimen’s edges causing the sound to bend into the sample. Nelson (1990) attributes this
increased absorption to the test specimen disturbing the diffuse sound field directly above it,
thereby drawing the sound energy into itself by diffraction. The end result is that for highly
absorptive materials there can be cases when the absorption footprint (in m2 or metric sabins) is
larger than the physical surface area (in m2), and such the resulting Sabine absorption coefficient
will be greater than 1.0. As previously stated the diffraction effects are more prominent at lower
frequencies. This diffraction edge effect becomes even more prominent when the test specimen is
spread out in an array of pieces as opposed to one continuous piece (Objective # 4).
Objective # 5:
Evaluate the effect on absorption of keeping the overall (both top and side edges) surface area
constant for two different shape test specimens.
Results:
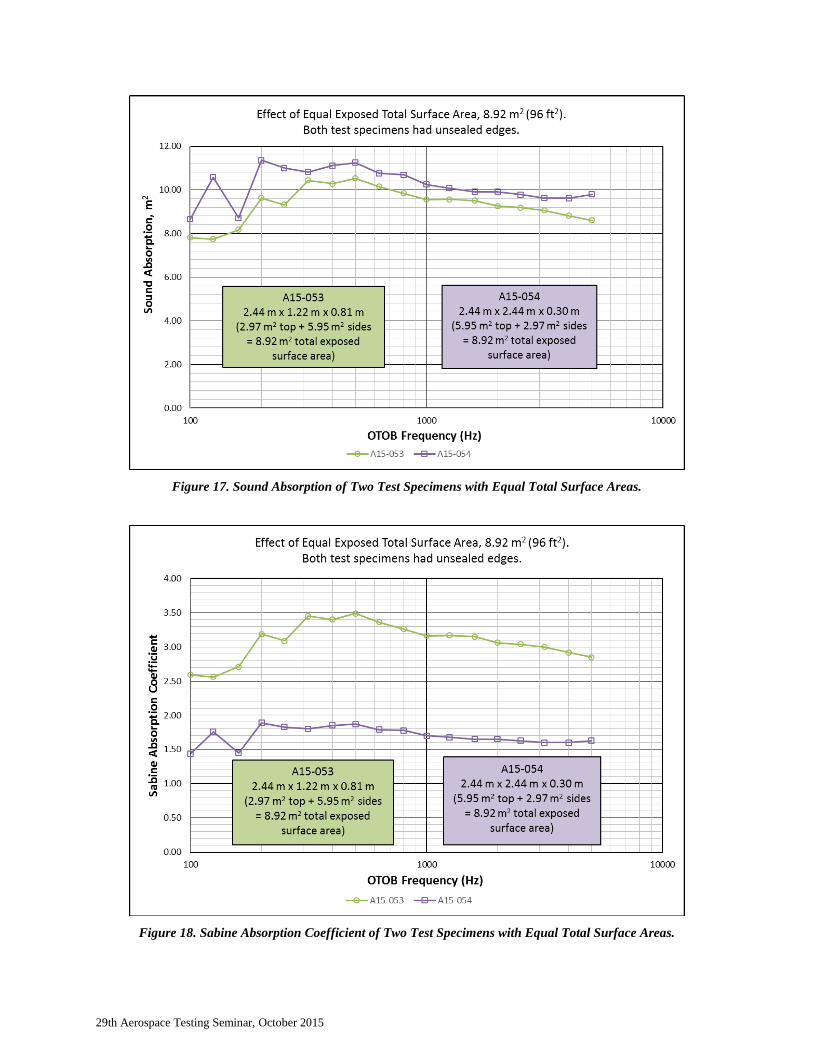
As seen in Figures 15 and 16, Test runs A15-053 and A15-054 were two large, very unusual, test
specimens. They were tested solely to see how the measured absorption of two test specimens
with the same size total surface area, but with different shapes and different top surface area, would
compare. As such all the side edges were left exposed (unsealed edges) as shown in the
photographs.
The test specimen for Test run A15-053 was 1.22 m (4 ft.) x 2.44 m (8 ft.) x 0.81 m (32 in) high.
This resulted in a top surface area of 2.97 m2 (32 ft.2) and a side surface area of 5.95 m2 (64 ft.2)
for a total exposed surface area of 8.92 m2 (96 ft.2).
The test specimen for Test run A15-054 was 2.44 m (8 ft.) x 2.44 m (8 ft.) x 0.30 m (12 in) high.
This resulted in a top surface area of 5.95 m2 (64 ft.2) and a side surface area of 2.97 m2 (32 ft.2)
for a total exposed surface area of 8.92 m2 (96 ft.2).
Thus, the test objective was to observe how or if the measured absorption varied depending upon
the orientation of the exposed surfaces (i.e. top surface versus side surfaces).

29th Aerospace Testing Seminar, October 2015
Figure 15. Test run A15-053.
Figure 16. Test run A15-054.
As can be seen in Figure 17, the total sound absorption were somewhat close, but not the same.
The Test run A15-054 test specimen, which had twice the amount of exposed top surface area, has
more sound absorption than the Test run A15-053 test specimen. Averaged out over the 100 Hz –
5 KHz OTOBs, it was 10% higher in sound absorption (range of minimum of 4% at 1.6 KHz
OTOB to a maximum of 37% higher at 125 Hz OTOB).
Figure 18 shows the comparison of the Sabine absorption coefficient for these two test specimens.
Since the Sound Absorption is divided by the top surface area only one would expect that Test run
A15-054 test specimen’s Sabine absorption coefficient would be approximately 50% less than the
Test run A15-053 test specimen’s Sabine absorption coefficient due to their difference in their
respective top surface areas. Thus, Figure 18 is an unfair comparison and should not be considered
truly meaningful, but is included here for completeness.
Discussion:
These two large and atypical test specimens were designed and chosen to evaluate the stated
objective. However, due to their size and shape they may have violated several underlying
assumptions of the reverberant room method. The mere volume of space that they take up, in
addition to the very large amount of highly absorbent surface area is likely to have disturbed the
diffuse sound field in the test room. There could potentially be blocking or shadowing effects due
to the test specimen’s size and location, and the high amount of absorption is likely to have created
non-diffuse sound fields around the test specimens therein raising the question of the applicability
of the reverberant room method for these particular test specimens. Additionally, one would
expect that the diffraction edge effect would play a very significant role in increasing the sound
absorption, especially at low frequencies.
Despite all these potential concerns, the sound absorption of the two test specimens was within (on
average) 10%. One might surmise that the Test run A15-054 test specimen performed slightly
better than its counterpart, Test run A15-053, because its greater surface area contributor was the
top surface. One would think that the top surface would have a greater likelihood of “seeing” the
reflective sound waves in the room more often, whereas the side surfaces may have somewhat of
a less likelihood of this sound energy exchange.
29th Aerospace Testing Seminar, October 2015
Figure 17. Sound Absorption of Two Test Specimens with Equal Total Surface Areas.
Figure 18. Sabine Absorption Coefficient of Two Test Specimens with Equal Total Surface Areas.
29th Aerospace Testing Seminar, October 2015
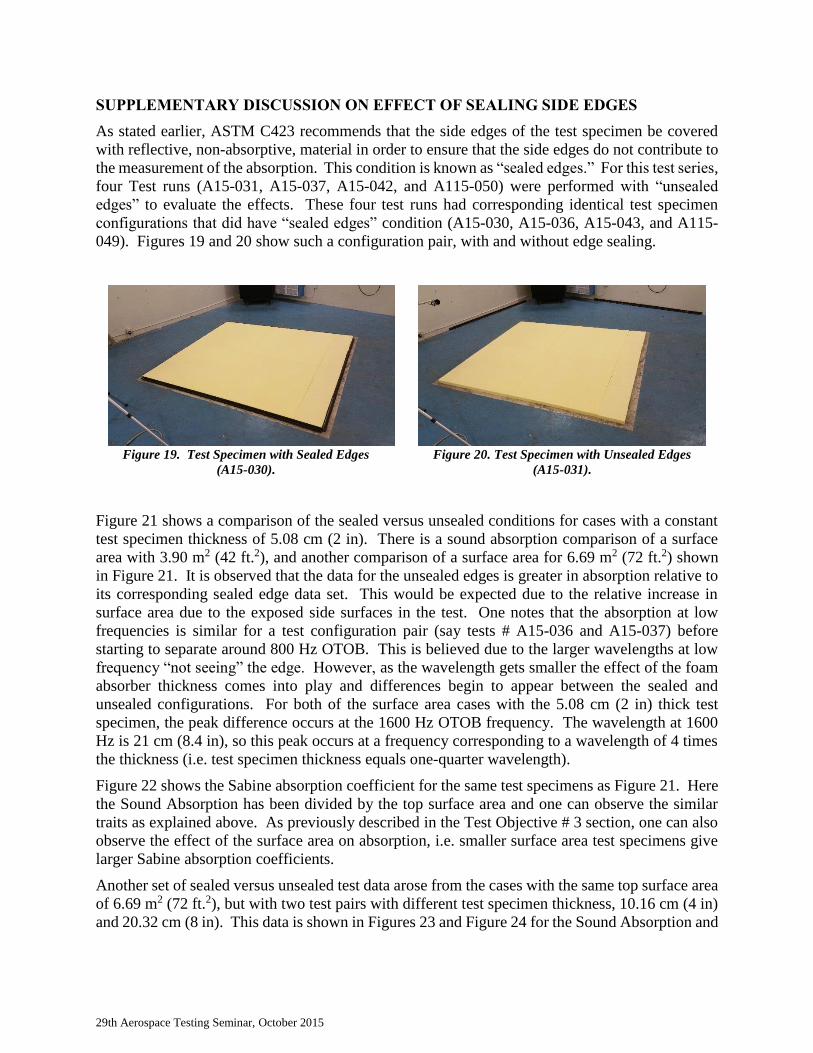
SUPPLEMENTARY DISCUSSION ON EFFECT OF SEALING SIDE EDGES
As stated earlier, ASTM C423 recommends that the side edges of the test specimen be covered
with reflective, non-absorptive, material in order to ensure that the side edges do not contribute to
the measurement of the absorption. This condition is known as “sealed edges.” For this test series,
four Test runs (A15-031, A15-037, A15-042, and A115-050) were performed with “unsealed
edges” to evaluate the effects. These four test runs had corresponding identical test specimen
configurations that did have “sealed edges” condition (A15-030, A15-036, A15-043, and A115-
049). Figures 19 and 20 show such a configuration pair, with and without edge sealing.
Figure 19. Test Specimen with Sealed Edges
(A15-030).
Figure 20. Test Specimen with Unsealed Edges
(A15-031).
Figure 21 shows a comparison of the sealed versus unsealed conditions for cases with a constant
test specimen thickness of 5.08 cm (2 in). There is a sound absorption comparison of a surface
area with 3.90 m2 (42 ft.2), and another comparison of a surface area for 6.69 m2 (72 ft.2) shown
in Figure 21. It is observed that the data for the unsealed edges is greater in absorption relative to
its corresponding sealed edge data set. This would be expected due to the relative increase in
surface area due to the exposed side surfaces in the test. One notes that the absorption at low
frequencies is similar for a test configuration pair (say tests # A15-036 and A15-037) before
starting to separate around 800 Hz OTOB. This is believed due to the larger wavelengths at low
frequency “not seeing” the edge. However, as the wavelength gets smaller the effect of the foam
absorber thickness comes into play and differences begin to appear between the sealed and
unsealed configurations. For both of the surface area cases with the 5.08 cm (2 in) thick test
specimen, the peak difference occurs at the 1600 Hz OTOB frequency. The wavelength at 1600
Hz is 21 cm (8.4 in), so this peak occurs at a frequency corresponding to a wavelength of 4 times
the thickness (i.e. test specimen thickness equals one-quarter wavelength).
Figure 22 shows the Sabine absorption coefficient for the same test specimens as Figure 21. Here
the Sound Absorption has been divided by the top surface area and one can observe the similar
traits as explained above. As previously described in the Test Objective # 3 section, one can also
observe the effect of the surface area on absorption, i.e. smaller surface area test specimens give
larger Sabine absorption coefficients.
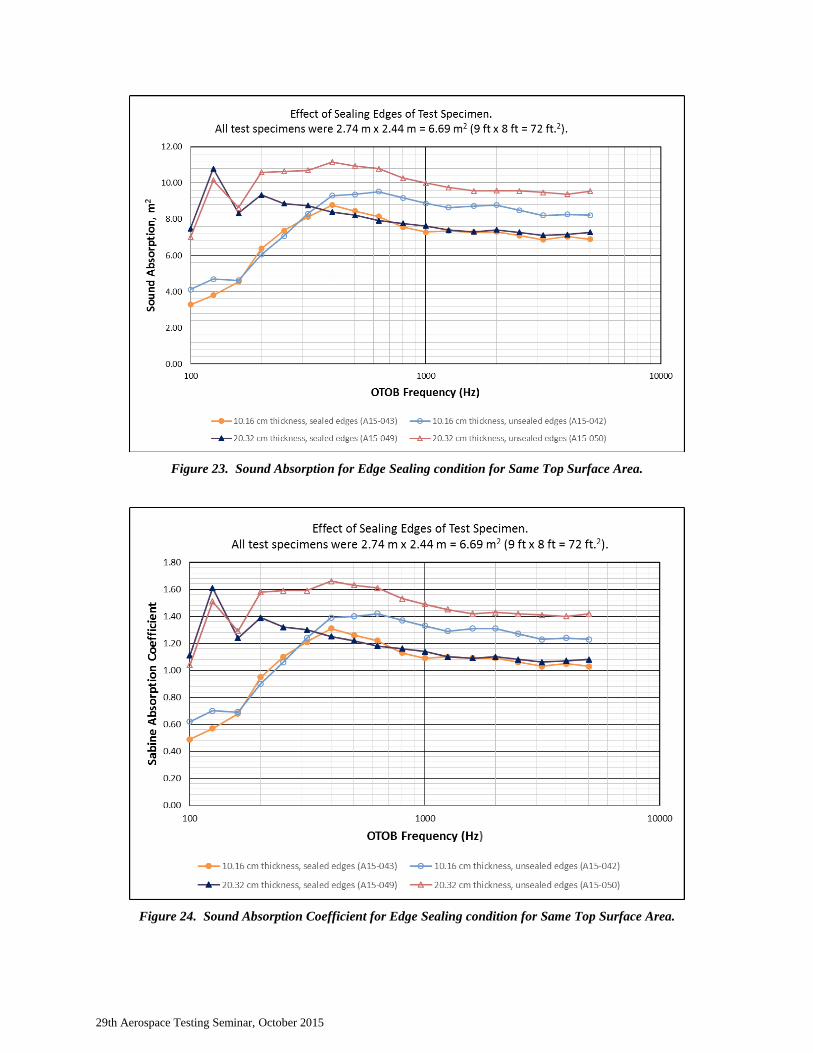
Another set of sealed versus unsealed test data arose from the cases with the same top surface area
of 6.69 m2 (72 ft.2), but with two test pairs with different test specimen thickness, 10.16 cm (4 in)
and 20.32 cm (8 in). This data is shown in Figures 23 and Figure 24 for the Sound Absorption and

29th Aerospace Testing Seminar, October 2015
Figure 21. Sound Absorption for Edge Sealing Condition for Same Test Specimen Thickness.
Figure 22. Sabine Absorption Coefficient for Edge Sealing Condition
for Same Test Specimen Thickness.
29th Aerospace Testing Seminar, October 2015
Figure 23. Sound Absorption for Edge Sealing condition for Same Top Surface Area.
Figure 24. Sound Absorption Coefficient for Edge Sealing condition for Same Top Surface Area.

29th Aerospace Testing Seminar, October 2015
Sabine absorption coefficient, respectively. Again, the increase in absorption for the unsealed
cases are readily apparent. As before, it is noted that the sealed and unsealed test pair are similar
at the lower frequencies, begin to separate and then reach a peak frequency that approximately
corresponds to a wavelength of 4 times the test specimen thickness. This would be ~ 800 Hz for
the 10.16 cm (4 in) thick test specimen, and ~ 400 Hz OTOB for the 20.32 cm (8 in) thick test
specimen. The effect of increasing thickness improving the absorption at low frequencies, as
discussed in Test Objective # 1 section, is again observed in this set of data.
SUPPLEMENTARY DISCUSSION ON SABINE AND EYRING ABSORPTION
In the literature Sabine absorption coefficients greater than 1.0 are usually attributed to the
diffraction edge effect, sometimes dismissed outright as measurement errors that should be
rounded down to 1.0, or even stated to be “just not possible”. This paper has shown that the Sabine
absorption coefficient values can go above 1.0 perhaps due to contributions from size effects and
the diffraction edge effects, but is there also another reason?
The values of the Sabin absorption coefficient measured by the reverberant room method can often
exceed a value of 1.0. Although this may seem impossible, for how can a material absorb more
than 100%, it is indeed a valid measurement. It is a result of the derivation of the Sabin acoustic
coefficient, whose values are then often further enlarged by the diffraction edge effect for test
specimens with significant thickness and high absorptive properties.
The Sabin acoustic coefficient, a product of the Sabine formula and its several underlying
approximations and the Reverberant Room Method, has no limiting value, and would reach infinity
for a perfect absorber. It is different from the physical mechanism associated with sound
absorption at a local boundary (Crocker 1998), defined (Sollner 2015, Young 1959) as the acoustic
Energy Absorption Coefficient, ε, which is defined as the ratio of the energy absorbed by a material
to the energy incident on that material, as shown in Equation 8.
𝜺 =𝑬𝒂
𝑬𝒊=
𝑬𝒊− 𝑬𝒓
𝑬𝒊= 𝟏 −
𝑬𝒓
𝑬𝒊 (8)
Here, Ei is the total acoustic energy incident on a material, Ea is the energy absorbed by the
material, and Er is the total reflected part of that energy. Thus a perfect absorber with no reflected
energy would have an Energy Absorption Coefficient of 1.0.
The Sabine absorption coefficient derived from the reverberant room method is not the same as
this Energy Absorption Coefficient. Young (1959) and Sollner (2015) have stated that the acoustic
Sabine absorption coefficient, α, is related to the Energy Absorption Coefficient, ε, by Equations
9 and 10.
𝜺 = 𝟏 − 𝒆−𝜶 (9)
𝜶 = − 𝐥𝐧(𝟏 − 𝜺) (10)
Thus, for a perfect absorber (ε = 1), α will approach ∞. Therefore, when using the reverberant
room method to compute Sabine absorption coefficients for highly absorptive materials it would
29th Aerospace Testing Seminar, October 2015
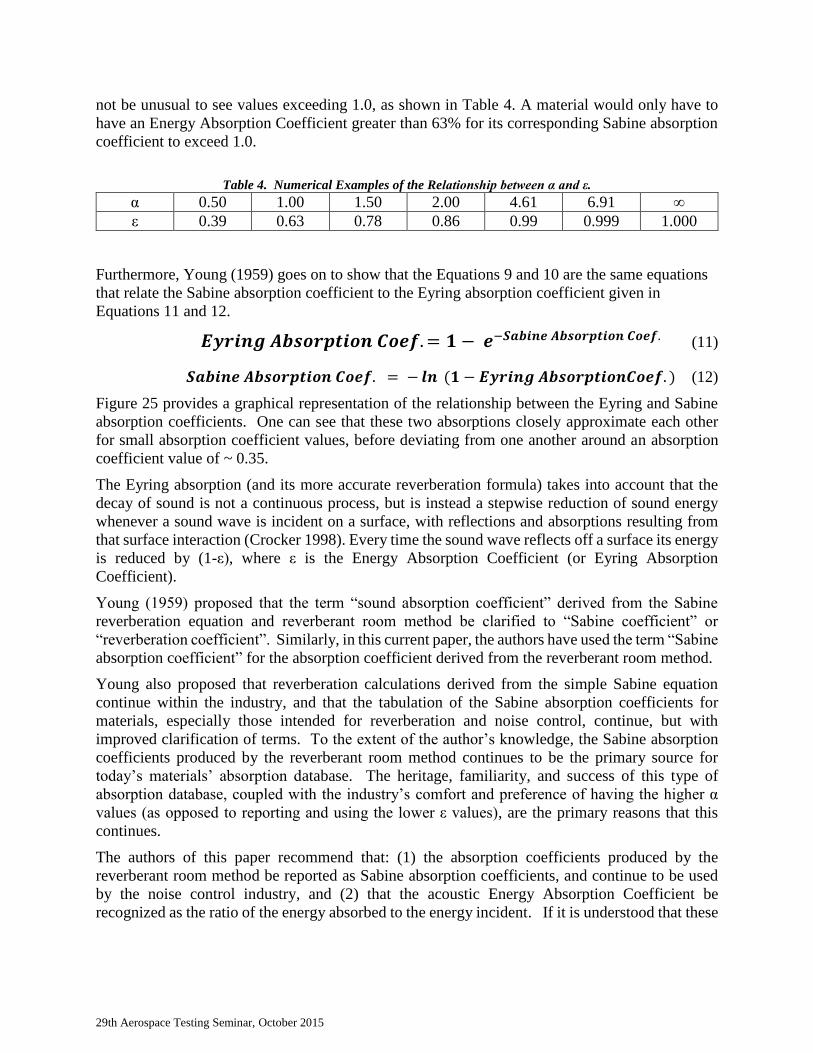
not be unusual to see values exceeding 1.0, as shown in Table 4. A material would only have to
have an Energy Absorption Coefficient greater than 63% for its corresponding Sabine absorption
coefficient to exceed 1.0.
Table 4. Numerical Examples of the Relationship between α and ε.
α 0.50 1.00 1.50 2.00 4.61 6.91 ∞
ε 0.39 0.63 0.78 0.86 0.99 0.999 1.000
Furthermore, Young (1959) goes on to show that the Equations 9 and 10 are the same equations
that relate the Sabine absorption coefficient to the Eyring absorption coefficient given in
Equations 11 and 12.
𝑬𝒚𝒓𝒊𝒏𝒈 𝑨𝒃𝒔𝒐𝒓𝒑𝒕𝒊𝒐𝒏 𝑪𝒐𝒆𝒇. = 𝟏 − 𝒆−𝑺𝒂𝒃𝒊𝒏𝒆 𝑨𝒃𝒔𝒐𝒓𝒑𝒕𝒊𝒐𝒏 𝑪𝒐𝒆𝒇. (11)
𝑺𝒂𝒃𝒊𝒏𝒆 𝑨𝒃𝒔𝒐𝒓𝒑𝒕𝒊𝒐𝒏 𝑪𝒐𝒆𝒇. = − 𝒍𝒏 (𝟏 − 𝑬𝒚𝒓𝒊𝒏𝒈 𝑨𝒃𝒔𝒐𝒓𝒑𝒕𝒊𝒐𝒏𝑪𝒐𝒆𝒇. ) (12)
Figure 25 provides a graphical representation of the relationship between the Eyring and Sabine
absorption coefficients. One can see that these two absorptions closely approximate each other
for small absorption coefficient values, before deviating from one another around an absorption
coefficient value of ~ 0.35.
The Eyring absorption (and its more accurate reverberation formula) takes into account that the
decay of sound is not a continuous process, but is instead a stepwise reduction of sound energy
whenever a sound wave is incident on a surface, with reflections and absorptions resulting from
that surface interaction (Crocker 1998). Every time the sound wave reflects off a surface its energy
is reduced by (1-ε), where ε is the Energy Absorption Coefficient (or Eyring Absorption
Coefficient).
Young (1959) proposed that the term “sound absorption coefficient” derived from the Sabine
reverberation equation and reverberant room method be clarified to “Sabine coefficient” or
“reverberation coefficient”. Similarly, in this current paper, the authors have used the term “Sabine
absorption coefficient” for the absorption coefficient derived from the reverberant room method.
Young also proposed that reverberation calculations derived from the simple Sabine equation
continue within the industry, and that the tabulation of the Sabine absorption coefficients for
materials, especially those intended for reverberation and noise control, continue, but with
improved clarification of terms. To the extent of the author’s knowledge, the Sabine absorption
coefficients produced by the reverberant room method continues to be the primary source for
today’s materials’ absorption database. The heritage, familiarity, and success of this type of
absorption database, coupled with the industry’s comfort and preference of having the higher α
values (as opposed to reporting and using the lower ε values), are the primary reasons that this
continues.
The authors of this paper recommend that: (1) the absorption coefficients produced by the
reverberant room method be reported as Sabine absorption coefficients, and continue to be used
by the noise control industry, and (2) that the acoustic Energy Absorption Coefficient be
recognized as the ratio of the energy absorbed to the energy incident. If it is understood that these

29th Aerospace Testing Seminar, October 2015
two quantities represent different concepts, then the lingering question of why Sabine absorption
coefficients values can exceed a value of 1.0 will be answered.
Figure 25. Relationship between Eyring and Sabine Absorption Coefficients.
SUMMARY
The reverberation room method, with its foundation in the Sabine formula, is a very useful method
to derive the Sabine absorption coefficient of materials. There is a long and successful history of
applying the Sabine absorption coefficient material data to real world problems, even in
applications where the environment is not diffuse.
Users of the material absorption database should realize however that the Sabine absorption
coefficient is not the same as the acoustic Energy Absorption Coefficient. The Sabine absorption
coefficient is a product of using Sabine’s formula and the Reverberant Room Method, and
therefore it is not surprising that the Sabine absorption coefficient values may exceed a value of
1.0, especially for highly absorptive materials. The acoustic Energy Absorption Coefficient,
defined as the ratio of the energy absorbed by a material to the energy incident on the material, is
a coefficient that cannot exceed 1.0. The Energy Absorption Coefficient is recognized to be the
Eyring absorption coefficient.
Further contributing to high Sabine acoustic coefficients are the effects of the test specimen surface
area size, and the diffraction of sound around the side edges of the test specimen. An absorption

29th Aerospace Testing Seminar, October 2015
investigative test matrix was designed and a test program was implemented to measure these types
of effects, and many of its results are presented in this paper.
Test data was presented that showed that test specimens with smaller surface areas result in larger
absorption values (Objective # 1). A method of estimating the true absorption for a test specimen
with an infinite surface area was demonstrated using this test data set.
The diffraction edge effects for test specimens of varying thickness was presented (Objective # 3).
It was observed that as the test specimen’s thickness increases, the frequency of the peak of the
absorption becomes lower in frequency and the overall magnitude of the absorption also increases,
especially at the lower frequencies. Part of this increase in due to the thickness of the test specimen
itself, however a portion of this increase is also attributable to the diffraction of the sound wave
over the edges of the test specimen. The diffraction edge effects are more prominent at lower
frequencies.
A comparison of two large atypical test specimens with equal total surface area (top and side
surfaces) was presented (Objective # 5). Finally, test data showing the effects of sealing or not
sealing the side edges of a test specimen was provided.
The effects of the mounting condition (Test Objective # 2), and the effects of spacing out of the
test specimen into pieces with various gaps (Test Objective # 4), will be covered in a follow-on
paper to this one.
ACKNOWLEDGEMENT
The authors would like to thank The Soundcoat Company Inc., and especially Mr. Tom Pellegrino,
Soundcoat’s Representative for the Aerospace industry, for their generous donation of the
melamine foam (Soundfoam® ML ULb) products used in this test program. The authors would
also like to thank Riverbank Acoustical Laboratories, for contributing their test services and
expertise. This investigative test effort would not have been possible without the support of both
Soundcoat Company and Riverbank Acoustical Laboratories.
REFERENCES
American Society for Testing and Materials, “Standard Test Method for Sound Absorption and
Sound Absorption Coefficients by the Reverberation Room Method,” ASTM C423-09a, October
15, 2009.
Bartel, T. W., “Effect of absorber geometry on apparent absorption coefficients as measured in a
reverberant chamber,” Journal of Acoustical Society of America, 69 (4), April 1981, pages 1065-
1074.
Cox, T. J. and P. D’Antonio, Acoustic Absorbers and Diffusers, Taylor & Francis, New York,
2009, 2nd edition.
Crocker, M. J. (editor), Handbook of Acoustics, Wiley-Interscience, New York, 1998.
Eyring, C. F., “Reverberation Time in “Dead” Rooms,” Journal of the Acoustical Society, January
1930, pages 217-241.
29th Aerospace Testing Seminar, October 2015
Hodgson, M. R., “When is Diffuse-Field Theory Accurate?”, Applied Acoustics 49 (3), pages 197-
207, 1996.
Hughes, W. O., A. M. McNelis, and M. E. McNelis, “Acoustic Test Characterization of Melamine
Foam for Usage in NASA’s Payload Fairing Acoustic Attenuation System,” NASA/TM-2014-
218127, June 2014 (28th Aerospace Testing Seminar, Los Angeles, CA, March 25-27, 2014).
Hughes, W. O., and A. M. McNelis, “Acoustic Test Results of Melamine Foam with Application
to Payload Fairing Acoustic Attenuation Systems,” NASA/TM-2014-218350, August 2014
(Noise-Con 2014, Fort Lauderdale, FL, September 8-10, 2014).
International Standardization Organization, “Measurement of Sound Absorption in a
Reverberation Room,” ISO R354-1963, 1963.
McNelis, A. M., W. O. Hughes and M. E. McNelis, “NASA Engineering and Safety Center (NESC)
Enhanced Melamine (ML) Foam Acoustic Test (NEMFAT),” NASA/TM-2014-218162, February
2014.
Nelson, D. A., “On Quantifying and Using the “Diffraction Effect” for Cost- and Performance
Optimization of Sound Absorption Treatments,” Noise-Con 90, Austin, TX, October 15-17, 1990,
pages 427-432.
Sabine, W. C., Collected Papers in Acoustics, 1922.
Sabine, W. H., Collected Papers in Acoustics, Dover, New York, 1964.
Sauro, R., M. Vargas, and G. Mange, “Absorption coefficients – part 1: is square area enough?”,
Internoise 2009, Ottawa, Canada, August 23-26, 2009.
Sauro, R., M. Vargas, and G. Mange, “Absorption coefficients – part 2: is “edge effect” more
important than expected?”, Internoise 2009, Ottawa, Canada, August 23-26, 2009.
Sollner, G., Email correspondence with E. Wolfram/Riverbank Acoustical Laboratories, April 13-
16, 2015.
Young, R. W., “Sabine Reverberation Equation and Sound Power Calculations,” Journal of the
Acoustical Society of America, Volume 31, Number 7, pages 912-921, July 1959.
29th Aerospace Testing Seminar, October 2015
BIOGRAPHIES
Bill Hughes is a senior Aerospace Engineer at the NASA Glenn Research Center in Cleveland,
Ohio. For over 28 years at NASA, Bill has focused on both the analysis and testing of space-flight
hardware in the areas of structural acoustics, random vibration, and pyroshock. He develops and
directs NASA Glenn’s vibroacoustic environment activities, including the formulation of
requirements, specifications and test plans. Before joining NASA, Bill worked for Raytheon, U.S.
Steel Research Corporation and Analex Corporation. Bill has a B.S. degree in Physics from Penn
State University. He also has a Master Degree in Mechanical Engineering from Carnegie Mellon
University, and a second Master Degree in Acoustics from Penn State University. Mr. Hughes is
an AIAA Associate Fellow. [email protected]
Chris Nottoli is an Acoustician and Test Engineer for Riverbank Acoustical Laboratories in
Geneva, IL. Chris has developed and implemented Riverbank's NVLAP accredited field testing
procedures. Chris also designs custom test procedures for both field and laboratory applications.
In May of 2014, Chris graduated from Columbia College Chicago with a B.S. degree in Acoustics.
Chris is an active member of the Acoustical Society of America. [email protected]
Eric Wolfram is the Laboratory Manager for Riverbank Acoustical Laboratories in Geneva, IL. He
provides leadership for the program's technical expertise, quality management, and business
operations. Eric has over 10 years of experience in the architectural acoustics industry. Prior to
joining the Riverbank team in 2012, Eric served as a consultant in acoustical design and noise
control engineering for Scott R. Riedel & Associates, leading over 120 architectural projects across
the United States. Eric has a Bachelor's Degree in Acoustics from Columbia College Chicago, is
a full member of the Acoustical Society of America, and is a contributing member of the ASTM
E33 Committee on Building and Environmental Acoustics. [email protected]
Anne McNelis is a NASA Glenn Research Center Aerospace Engineer with over 24 years of
experience in analysis, prediction and testing of space flight hardware. She has a B.S. degree in
Systems and Control Engineering from Case Western Reserve University in Cleveland,
Ohio. Anne’s expertise is in the development of test levels and predictions for acoustic, random
vibration, and pyroshock separation environments. Her work in analyzing dynamic environments
has helped determine the design and ensure mission success for various spaceflight projects and
payloads including the International Space Station (ISS), Cassini, EOS-Terra, the Fluid
Combustion Facility (FCF), Atlas V/MRO, Atlas V/Pluto New Horizons, ARES I-X, ARES V,
and the Reverberant Acoustic Test Facility (RATF) at NASA’s Plum Brook Station. She currently
is working to mitigate the interior fairing acoustic levels for NASA's Space Launch System (SLS).