examination of the brain processes - drum
TRANSCRIPT

ABSTRACT
Title of dissertation: EXAMINATION OF THE BRAIN PROCESSES
UNDERLYING EMOTION REGULATION WITHIN
A STRESS RESILIENT POPULATION
Michelle E. Costanzo, Doctor of Philosophy, 2011
Dissertation directed by: Dr. Bradley D. Hatfield, Ph.D., FACSM, FAAKPE
Neuroscience and Cognitive Sciences Program
Emotion robustly affects the quality of cognitive-motor performance under conditions
of mental stress. As such, the regulation of emotion is critical to successful execution
of motor skills during emotional challenge. Previous investigations of the stress-
performance relationship have typically focused on behavioral outcomes, however,
few have adopted a cognitive neuroscience approach to examine the involved
mechanisms underlying this relationship. Furthermore, it is unclear if individuals who
have a history of superior performance under stress (stress resilient population)
exhibit brain responses characterized by an efficiency of neural processing and an
adaptive emotion regulatory strategy. Using functional magnetic resonance imaging
(fMRI), the present study examined activation in critical brain regions during
affective challenge (i.e., presentation of International Affective Picture System
negative images and Sport-Specific negative images) in 13 elite athletes
(intercollegiate football players who have demonstrated successful execution of
cognitive-motor skills under mental stress) relative to an age-matched control group

(n=12). The present dissertation is organized into three main sections. The first
report, entitled Brain Processes during Motor Performance under Psychological
Stress, an Independent Component Analysis of EEG, is an examination of brain
processes during competitive stress. This study revealed non-essential neuromotor
cerebral cortical noise with a quantified increase in complexity during a cognitive-
motor task. The second report is entitled Efficiency of Affective Brain Processes in
Expert Cognitive-Motor Performers during Emotional Challenge. This fMRI
examination of elite athletes revealed processing economy in brain regions critical to
self regulation, management of emotional impulses and social cognition. The third
report, entitled The Specificity of Neural Regulatory Processes during Emotional
Challenge in a Stress Resilient Population, examined with fMRI if elite athletes
spontaneously engage in cognitive reappraisal during the presentation of arousing
sport-specific images. Results suggest that elite athletes process sports-relevant
affective information in an automatic manner, congruent with a cognitive reappraisal
strategy, which neutralized the negative impact of the scenes. In conclusion, the
results suggest that elite performers are important models of stress resilience and
respond not only in an efficient manner to stressful events, but demonstrate an
adaptive regulatory response when challenged within their domain of experience.

EXAMINATION OF THE BRAIN PROCESSES UNDERLYING EMOTION REGULATION WITHIN A STRESS RESILIENT POPULATION
by
Michelle Elizabeth Costanzo
Dissertation submitted to the Faculty of the Graduate School of the University of Maryland, College Park in partial fulfillment
of the requirements for the degree of Doctor of Philosophy
2011
Advisory Committee: Dr. Bradley D. Hatfield, Ph.D., FACSM, FAAKPE (Chair) Dr. Allen R. Braun, M.D. Dr. José L. Contreras-Vidal, Ph.D. Dr. Nathan A. Fox, Ph.D. Dr. John VanMeter, Ph.D.

©Copyright by
Michelle Elizabeth Costanzo
2011

ii
Acknowledgements Dissertation Committee: Brad Hatfield, Allen Braun, Jose Contreras-Vidal, Nathan Fox & John Van Meter University of Maryland: Trent Bradberry, Ron Goodman, Amy Haufler, Li-Chuan Lo, Matt Miller, Hyuk Oh, Jessica Oldham, Jeremy Rietschel, Bart Russell, Mark Saffer University of Florida: Chris Janelle Special Thanks: Rodolphe Gentili Denise Costanzo Mike Costanzo Annie & Count University of Maryland Football Team Ralph & Gloria Friedgen Dwight Galt Banke Adeyemo, Andrew Breeden Gabriella Hancock, Garrett Beatty, Bradley Fawver Dr. Kathy Levit Dr. Kateri McRae Support: Graduate Student Summer Research Fellowship Department of Kinesiology Graduate Research Initiative Project (GRIP) Award William Hodos Dissertation Research Assistantship

iii
Table of Contents
List of Tables. ............................................................................................................................ i
List of Figures. ......................................................................................................................... ii
List of Abbreviations. ............................................................................................................. iv
Chapter 1: General Introduction: The Fundamental Stress and Cognitive-Motor Performance Relationship and the Relevance of Emotion Regulation .............................. 1
Chapter 2: Brief Review of Psychological Stress and Cognitive Motor Performance ...... 8
Psychological Stress ..................................................................................................8
Stress and the Motor Hierarchy ..................................................................................9
Cognitive-Motor Performance under Stress: Neuromotor Noise .............................10
Competition as a Stress Manipulation .....................................................................12
Chapter 3: Brain Processes during Motor Performance under Psychological Stress during Motor Performance, an Independent Component Analysis of EEG ................... 14
Introduction ..............................................................................................................14
Methods ....................................................................................................................18
Participants ...................................................................................................................... 18
Task .................................................................................................................................. 18
Measures .......................................................................................................................... 19
Arousal ....................................................................................................................... 19
Cardiovascular and skin conductance ........................................................... 19
Psychoendocrine ........................................................................................... 19
Self-reported arousal assessment ............................................................................... 20
Visual analog scale ....................................................................................... 20
State anxiety inventory ................................................................................. 21
Brain - EEG ............................................................................................................... 21
Motor behavior .......................................................................................................... 22
Procedure (Manipulations) .............................................................................................. 22
Day 1 - orientation ..................................................................................................... 23
Day 2: performance alone and competition ............................................................... 24
Performance alone ........................................................................................ 25
Competition .................................................................................................. 26
Signal Processing and Data Analysis .............................................................................. 27

iv
Arousal .................................................................................................................. 27 Heart rate and heart rate variability .............................................................. 27
Skin conductance .......................................................................................... 28
Psychoendocrine ........................................................................................... 29
Brain - EEG ............................................................................................................ 29
Independent Component Analysis (ICA) ....................................................... 29
Standardized Low Resolution Brain Electromagnetic Tomography (sLORETA) ............................................................................................................... 32
Motor behavior ....................................................................................................... 33
Statistical Design ............................................................................................................ 34
Arousal .................................................................................................................. 34 Cardiovascular and skin conductance ........................................................... 34
Psychoendocrine ........................................................................................... 34
Self-reported arousal assessment ........................................................................... 34
Brain - ICA ............................................................................................................. 35
Motor behavior ....................................................................................................... 35
Results ......................................................................................................................35
Arousal ............................................................................................................................. 36
Cardiovascular and skin conductance ......................................................................... 36
Self-reported arousal assessment ................................................................................ 36
Psychoendocrine ......................................................................................................... 37
Brain ............................................................................................................................... 38
ICA ............................................................................................................................. 38
sLORETA ................................................................................................................... 39
Motor behavior ............................................................................................................... 41
Discussion ................................................................................................................42
Chapter 4: Examination of Expert Groups to Understand Stress Resilience .................. 48
Chapter 5: Efficiency of Affective Brain Processes in Expert Cognitive-Motor Performers during Emotional Challenge ............................................................................. 52
Introduction ..............................................................................................................52
Methods ....................................................................................................................57
Subjects ............................................................................................................................ 57
Procedure ......................................................................................................................... 58
Stimuli ......................................................................................................................... 58

v
Task ............................................................................................................................. 59
Prior to data collection ................................................................................................ 60
Imaging parameters ..................................................................................................... 62
Dependent Measures ........................................................................................................ 63
Psychometric inventories: to characterize population ................................................ 63
Performance Failure Appraisal Inventory (PFAI) ............................................. 63
State-Trait Anxiety Inventory (STAI) .............................................................. 64
Dispositional Resilience Scale (DRS) ............................................................... 64
Sport Competition Anxiety Test (SCAT) .......................................................... 64
Beck Depression Inventory (BDI) ..................................................................... 65
Emotion Regulation Questionnaire (ERQ) ........................................................ 65
Physiological measures of arousal ............................................................................. 66
Galvanic skin response ....................................................................................... 66
Heart rate ............................................................................................................ 67
Behavioral measures - affective rating ....................................................................... 67
Functional Magnetic Resonance Imaging: BOLD Signal .......................................... 67
Statistical Analysis ........................................................................................................... 68
Psychometric inventories: to characterize population ................................................ 68
Physiological measures of arousal ............................................................................. 69
Galvanic skin response ....................................................................................... 69
Heart rate ............................................................................................................ 69
Behavioral measures - affective rating ....................................................................... 69
Functional Magnetic Resonance Imaging: BOLD Signal .......................................... 70
Results ......................................................................................................................71
Psychometric Inventories to Characterize Population ................................................ 71
Performance Failure Appraisal Inventory (PFAI) ............................................. 71
State-Trait Anxiety Inventory (STAI) .............................................................. 72
Dispositional Resilience Scale (DRS) ............................................................... 72
Sport Competition Anxiety Test (SCAT) .......................................................... 72
Beck Depression Inventory (BDI) ..................................................................... 73
Emotion Regulation Questionnaire (ERQ) ........................................................ 74
Physiological Measures of Arousal ........................................................................... 74
Galvanic skin response ....................................................................................... 74

vi
Heart rate ............................................................................................................ 75
Behavioral Measures - Affective Rating ..................................................................... 76
Functional Magnetic Resonance Imaging: BOLD Response .................................... 77
Comparative (Football vs. Control) descriptive pattern of BOLD response during passive viewing of negative Sports-Specific images ............................................ 78
Football ......................................................................................................... 78
Control .......................................................................................................... 79
Comparative (Football vs. Control) descriptive pattern of BOLD response during passive viewing of negative IAPS images ............................................................ 80
Football ......................................................................................................... 81
Control .......................................................................................................... 81
Comparative (Football vs. Control) descriptive pattern of BOLD response during the cued cognitive reappraisal of negative Sports-Specific images ...................... 83
Football ......................................................................................................... 83
Control .......................................................................................................... 84
Comparative (Football vs. Control) descriptive pattern of BOLD response during the cued cognitive reappraisal of negative IAPS images ...................................... 85
Football ......................................................................................................... 86
Control .......................................................................................................... 86
Direct Comparisons between Group ..................................................................... 88
Passive negative SS condition ...................................................................... 89
Whole brain CONT-FB ................................................................... 89
ROI CONT-FB ................................................................................. 89
Whole brain FB-CONT .................................................................... 90
ROI FB-CONT ................................................................................. 90
Passive negative IAPS condition .................................................................. 92
Whole brain CONT-FB ................................................................... 92
ROI CONT-FB ................................................................................. 92
Whole brain FB-CONT .................................................................... 92
ROI FB-CONT ................................................................................. 93
Cognitive reappraisal SS condition ............................................................... 94
Whole brain CONT-FB ................................................................... 94
ROI CONT-FB ................................................................................. 95
Whole brain FB-CONT .................................................................... 95

vii
ROI FB-CONT ................................................................................. 95
Cognitive reappraisal IAPS condition .......................................................... 97
Whole brain CONT-FB ................................................................... 97
ROI CONT-FB ................................................................................. 97
Whole brain FB-CONT .................................................................... 97
ROI FB-CONT ................................................................................. 98
Discussion ................................................................................................................99
Direct Group Comparisons ............................................................................................ 101
Prefrontal Regions of Interest ....................................................................................... 101
Posterior Regions Revealed from Whole Brain Analysis ............................................. 104
Subcortical Efficiency .................................................................................................... 106
Football Group Greater Than Control ............................................................................ 107
Summary ........................................................................................................................ 108
Chapter 6: Review of the Process Model of Emotion Regulation .................................... 112
Chapter 7: Review of the Neuroanatomy Underlying Emotion Regulation ................... 116
Amygdala ...............................................................................................................117
Insula ......................................................................................................................118
Prefrontal Cortex ....................................................................................................120
Lateral Prefrontal Cortex ............................................................................................... 120
Medial Prefrontal Cortex ............................................................................................... 121
Orbitofrontal cortex ...................................................................................................... 122
Chapter 8: The Specificity of Neural Regulatory Processes during Emotional Challenge in a Stress Resilient Population. ......................................................................................... 125
Introduction ............................................................................................................125
Methods ..................................................................................................................131
Subjects .......................................................................................................................... 131
Procedure ....................................................................................................................... 133
Stimuli ....................................................................................................................... 133
Task ........................................................................................................................... 134
Prior to data collection .............................................................................................. 135
Imaging parameters ................................................................................................... 137
Dependent Measures ...................................................................................................... 138
Psychometric Inventories to characterize population ............................................... 138

viii
Performance Failure Appraisal Inventory (PFAI) ........................................... 138
State-Trait Anxiety Inventory (STAI) ............................................................ 138
Dispositional Resilience Scale (DRS) ............................................................. 139
Sport Competition Anxiety Test (SCAT) ........................................................ 139
Beck Depression Inventory (BDI) ................................................................... 140
Emotion Regulation Questionnaire (ERQ) ...................................................... 140
Physiological measures of arousal ........................................................................... 141
Galvanic skin response ..................................................................................... 141
Heart rate .......................................................................................................... 142
Behavioral Measures - affective rating ..................................................................... 142
Functional Magnetic Resonance Imaging: BOLD Signal ........................................ 142
Statistical Analysis ......................................................................................................... 143
Psychometric inventories to characterize population ................................................ 143
Physiological measures of arousal ........................................................................... 144
Galvanic skin response ..................................................................................... 144
Heart rate .......................................................................................................... 144
Behavioral measures - affective rating ..................................................................... 144
Functional Magnetic Resonance Imaging: BOLD Signal ........................................ 145
Results ....................................................................................................................145
Psychometric Inventories: to Characterize Population ............................................. 145
Performance Failure Appraisal Inventory (PFAI) ........................................... 145
State-Trait Anxiety Inventory (STAI) ............................................................ 147
Dispositional Resilience Scale (DRS) ............................................................. 147
Sport Competition Anxiety Test (SCAT) ........................................................ 147
Beck Depression Inventory (BDI) ................................................................... 148
Emotion Regulation Questionnaire (ERQ) ...................................................... 148
Physiological Measures of Arousal ......................................................................... 149
Galvanic skin response ..................................................................................... 150
Heart rate .......................................................................................................... 150
Behavioral Measures - Affective Rating ................................................................... 151
Functional Magnetic Resonance Imaging: BOLD Response .................................. 153
Direct comparisons between conditions: whole brain and regions of interest ..... 153
FOOTBALL: cognitive reappraisal SS - passive viewing SS .................... 154

ix
FOOTBALL: passive viewing SS- cognitive reappraisal SS ..................... 155
FOOTBALL: cognitive reappraisal IAPS - passive viewing IAPS ............ 155
FOOTBALL: passive viewing IAPS – cognitive reappraisal IAPS ............ 156
CONTROL: cognitive reappraisal SS - passive viewing SS ...................... 158
CONTROL: passive viewing SS- cognitive reappraisal SS ....................... 159
CONTROL: cognitive reappraisal IAPS - passive viewing IAPS .............. 160
CONTROL: passive viewing IAPS – cognitive reappraisal IAPS .............. 160
Condition Region of Interest Analysis ................................................................. 162
Prefrontal Cortex ......................................................................................... 163
FOOTBALL: cognitive reappraisal Sports-Specific – neutral baseline contrast ................................................................................................... 163
FOOTBALL: passive negative Sports-Specific – neutral baseline Contrast ................................................................................................................ 163
FOOTBALL: cognitive reappraisal IAPS – neutral baseline contrast ... 164
FOOTBALL: passive negative IAPS – neutral baseline contrast ........... 165
CONTROL: cognitive reappraisal Sports-Specific – neutral baseline contrast ................................................................................................... 166
CONTROL: passive negative Sports-Specific – neutral baseline contrast ................................................................................................................ 166
CONTROL: cognitive reappraisal IAPS – neutral baseline contrast ..... 167
CONTROL: passive negative IAPS– neutral baseline contrast .............. 168
Insula and amygdala ................................................................................... 169
FOOTBALL: cognitive reappraisal Sports-Specific – neutral baseline contrast ................................................................................................... 169
FOOTBALL: passive negative Sports-Specific – neutral baseline contrast ................................................................................................................ 169
FOOTBALL: cognitive reappraisal IAPS – neutral baseline contrast ... 169
FOOTBALL: passive negative IAPS – neutral baseline contrast ........... 170
CONTROL: cognitive reappraisal Sports-Specific – neutral baseline contrast ................................................................................................... 170
CONTROL: passive negative Sports-Specific – neutral baseline contrast ................................................................................................................ 170
CONTROL: cognitive reappraisal IAPS – neutral baseline contrast ..... 170
CONTROL: passive negative IAPS – neutral baseline contrast ............. 171

x
Discussion ..............................................................................................................174
Direct Comparisons Cognitive Reappraisal-Passive Negative ...................................... 176
Football group - Sports-Specific .............................................................................. 176
Football group – IAPS: prefrontal cortex ................................................................. 177
Football group – IAPS: regions beyond the prefrontal cortex .................................. 178
Control Group- Sports Specific and IAPS ................................................................ 179
Similarities between the Football and Control Group .............................................. 180
Activations during cognitive reappraisal .......................................................... 180
Deactivation during cognitive reappraisal ........................................................ 181
Condition Region of Interest Analysis .......................................................................... 182
Football – Sports-Specific ....................................................................................... 182
Football – IAPS ..................................................................................................... 183
Control SS and IAPS ................................................................................................ 185
Summary ....................................................................................................................... 187
Chapter 9: General Summary ............................................................................................ 188
Appendices. ........................................................................................................................... 195
Appendix A: Institutional Review Board Documentation. ....................................... 195
Appendix B: Data Collection Documents. ................................................................ 212
Appendix C: Task Order and Stimuli. ...................................................................... 268
References. ............................................................................................................................ 272

xi
List of Tables
Chapter 3: Brain Processes during Motor Performance under Psychological Stress during Motor Performance, an Independent Component Analysis of EEG
Table 1, sLORETA Results ......................................................................................40
Chapter 5: Efficiency of Affective Brain Processes in Expert Cognitive-Motor Performers during Emotional Challenge
Table 2, Whole Brain results PN SS-NB (Football and Control) ............................80
Table 3, Whole Brain results PN IAPS-NB (Football and Control) ........................82
Table 4, Whole Brain results CR SS-NB (Football and Control) ............................85
Table 5, Whole Brain results CR IAPS-NB (Football and Control) ........................88
Table 6, Direct Group Comparison results PN SS ..................................................91
Table 7, Direct Group Comparison results PN IAPS ..............................................94
Table 8, Direct Group Comparison results CR SS ..................................................96
Table 9, Direct Group Comparison results CR IAPS ..............................................99
Chapter 8: The Specificity of Neural Regulatory Processes during Emotional Challenge in a Stress Resilient Population
Table 10, Direct Comparison between conditions: FOOTBALL .........................158
Table 11, Direct Comparison between conditions: CONTROL ...........................162
Table 12, ROI results for Sports Specific Conditions: FOOTBALL ....................172
Table 13, ROI results for IAPS Conditions: FOOTBALL ....................................173
Table 14, ROI results for Sports Specific Conditions: CONTROL ......................173
Table 15, ROI results for IAPS Conditions: CONTROL ......................................174

xii
List of Figures
Chapter 1: General Introduction: The Fundamental Stress and Cognitive-Motor Performance Relationship and the Relevance of Emotion Regulation
Figure 1, Stress and Performance Relationship .........................................................3
Chapter 3: Brain Processes during Motor Performance under Psychological Stress during Motor Performance, an Independent Component Analysis of EEG
Figure 2, Task Protocol ............................................................................................25
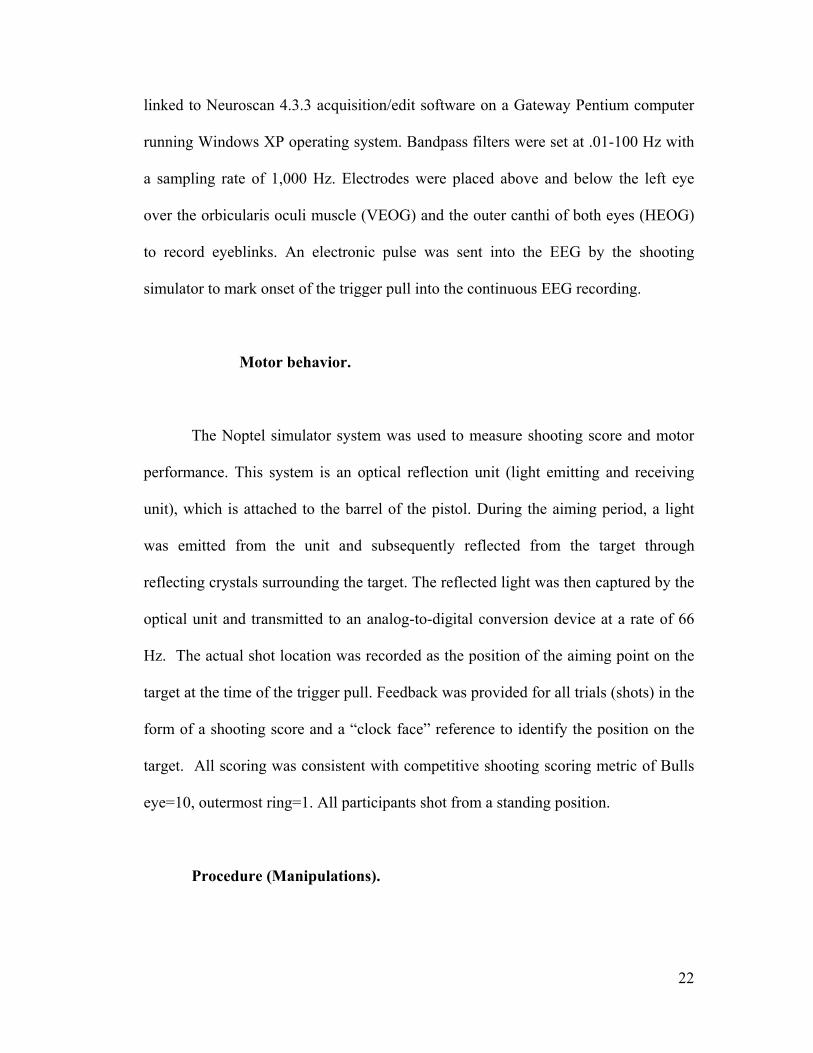
Figure 3, Kinematics of Worst Performer ................................................................31
Figure 4, Neuromotor Noise Template ...................................................................31
Figure 5, Self Report Results ...................................................................................37
Figure 6, Cortisol Results .........................................................................................38
Figure 7, Clustering Results .....................................................................................39
Figure 8, sLORETA Results ....................................................................................40
Figure 9, Kinematic Results .....................................................................................41
Chapter 5: Efficiency of Affective Brain Processes in Expert Cognitive-Motor Performers during Emotional Challenge
Figure 10, PFAI Results ...........................................................................................71
Figures 11, Psychometric Results ............................................................................73
Figure 12, HR and GSR Results ..............................................................................75
Figure 13, Affective Self Report Results ................................................................77
Figure 14, Whole Brain Results: PN SS -NB (Football and Control) .....................79
Figure 15, Whole Brain Results: PN IAPS -NB (Football and Control) ................82
Figure 16, Whole Brain Results: CR SS -NB (Football and Control) ....................84
Figure 17, Whole Brain Results: CR IAPS -NB (Football and Control) ................87
Figure 18, Whole Brain Direct Group Comparison Results: PN SS .......................91
Figure 19, Whole Brain Direct Group Comparison Results: PN IAPS ..................93
Figure 20, Whole Brain Direct Group Comparison Results: CR SS ......................96
Figure 21, Whole Brain Direct Group Comparison Results: CR IAPS ..................98
Chapter 8: The Specificity of Neural Regulatory Processes during Emotional Challenge in a Stress Resilient Population
Figure 22 (same as Figure 10), PFAI Results ........................................................146
Figure 23 (same as Figures 11), Psychometric Results ..........................................149
Figure 24 (same as Figure 12), HR and GSR Results ...........................................151
Figure 25 (same as Figure 13), Affective Self Report Results ..............................153

xiii
Figure 26, Whole Brain Direct Comparison between conditions: FOOTBALL SS ................................................................................................................................155
Figure 27, Whole Brain Direct Comparison between conditions: FOOTBALL IAPS ................................................................................................................................157
Figure 28, Whole Brain Direct Comparison between conditions: CONTROL SS ................................................................................................................................159
Figure 29, Whole Brain Direct Comparison between conditions: CONTROL IAPS ................................................................................................................................161
Figure 30, Prefrontal CR SS –NB & PN SS – NB: FOOTBALL ........................164
Figure 31, Prefrontal CR IAPS –NB & PN IAPS – NB: FOOTBALL ...............165
Figure 32, Prefrontal CR SS –NB & PN SS – NB: CONTROL ..........................167
Figure 33, Prefrontal CR IAPS –NB & PN IAPS – NB: CONTROL ..................168
Figure 34, Insula CR SS –NB , PN SS – NB, CR IAPS –NB & PN IAPS – NB: CONTROL & FOOTBALL ..................................................................................171
Figure 35, Amygdala CR SS –NB , PN SS – NB, CR IAPS –NB & PN IAPS – NB: CONTROL & FOOTBALL ..........................................................................172

xiv
List of Abbreviations
Abbreviation Region ACC Anterior Cingulate Cortex
DLPFC Dorsolateral Prefrontal Cortex DMPFC Dorsomedial Prefrontal Cortex
IFG Inferior Frontal Gyrus IOG Inferior Occipital Gyrus ITG Inferior Temporal Gyrus
LOFC lateral Orbitofrontal Cortex MOFC medial Orbitofrontal Cortex MOG Middle Occipital Gyrus MTG Middle Temporal Gyrus PCC Posterior Cingulate Cortex SMA Supplementary Motor Area SOG Superior Occipital Gyrus SPL Superior Parietal Lobule STG Superior Temporal Gyrus
VLPFC Ventrolateral Prefrontal Cortex VMPFC Ventromedial Prefrontal Cortex

1
Chapter 1: General Introduction -- The Fundamental Stress and Cognitive-Motor Performance Relationship and the Relevance of Emotion Regulation
Converging neuroimaging data suggest that experts require less neuronal
resources compared to novices to accomplish the same task in their domain of
expertise, and that this cortical refinement can be characterized as psychomotor
efficiency (Hatfield & Hillman, 2001; Hatfield & Kerick, 2007). Thus, one of the
hallmarks of highly skilled individuals is the ability to perform using minimal effort
and refined cortical processing specific to the action demands (Del Percio et al., 2008;
Del Percio et al., 2009; Hatfield & Hillman, 2001). Many investigators have
employed precision aiming tasks (shooting tasks) to explore this notion of efficiency
since these kinds of tasks involve control of movement, and the advantage of
ecological validity, because the study participants are critically involved with the task
while motionless, allowing for artifact-free neuroimaging (electroencephalography,
EEG) (e.g. Del Percio et al., 2009; Deeny, Haufler, Saffer, & Hatfield, 2009; Haufler,
Hatfield, Spalding & Santa-Maria, 2000). This research has consistently revealed that
the cerebral cortex decreases in activity during task execution, particularly in the left
temporal region (associated with verbal analysis), is indicative of an automaticity of
motor control (Hatfield et al., 1984; Haufler, Hatfield, Spalding & Santa-Maria,
2000). In addition, recent studies have suggested that expert precision aiming
performance requires a selective engagement of thalamocortical and cortico-cortical
oscillatory networks for successful task execution (Del Percio et al., 2009).
Collectively, these findings imply a refined recruitment of the essential neural
networks required for skilled performance. But critical for the present dissertation, is

2
when the efficiency of brain dynamics is disrupted by mental stress leading to
performance decline under pressure (Beilock, 2010; Beilock & Carr, 2001).
Traditionally, the relationship between stress and performance can be
characterized by the organizing principle of the inverted-U, termed the Yerkes-
Dodson law (Hancock & Szalma, 2008). According to this model, performance varies
as a function of the stress activation continuum: with an under-aroused-state resulting
in sub-optimal performance (in part due to decrements in attention & lack of
engagement); a central zone or maximal adaptability zone where stress levels are
consistent with behavioral adaptability, optimal performance and psychomotor
efficiency (Hancock & Szalma, 2008; Hatfield & Kerick, 2007); extreme excitation,
which can become manifested as anxiety, also resulting in performance decline
(Yerkes & Dodson, 1908) (see Figure 1).
As such, the management of high levels of arousal is critical to the
performance of tasks under conditions of mental stress. State anxiety is characterized
by negative valence expressed by apprehension and threat, resulting in a heighted
stage of arousal. Anxiety-induced disruption of the central zone of optimal arousal
may act to perturb the refined process associated with psychomotor efficiency
(Hancock & Szalma 2008). Such negative appraisal accompanied by elevated arousal,
is typically coupled with increased amygdala activity, which, in turn, influences the
thalamus, hypothalamus, striatum, and brainstem areas in addition to numerous
sensory and association cortical areas (Haines, 2006) creating neuromotor noise. Thus
the regulation of emotion (which can be manifested as anxiety), is critical in
determining the quality of cognitive-motor performance (Figure 1).

3
Figure 1. Relationship between stress and performance indicating the range during which performance decline is observed (adapted from Hancock & Szalma 2008).
Nonetheless, some individuals are able to maintain a high level of
performance during stressful events and, therefore, demonstrate qualities of stress
resilience. Stress resiliency encompasses the ability to adaptively cope with adversity
and can be examined at behavioral, psychological, and neural levels (Feder et al.,
2009). For the purpose of the dissertation we define our stress resilient population as
individuals who have a history of successful performance (1) senior varsity athletes 2)
letter award winners 3) typically play a starting role on the team 4) on a partial or full
athletic scholarship) under conditions of emotional challenge (high-level
competition). Examination of elite performers (intercollegiate athletes) holds promise
for understanding the neural basis for such abilities to adaptively cope with stressful
events, and more specifically, elite athletes may be uniquely resilient to stress
perturbation through the ability to regulate their emotions.

4
There are numerous strategies through which to engage emotion regulatory
brain networks, but one strategy, cognitive reappraisal, is a particularly adaptive
means of emotion regulation (based on behavioral comparisons (Gross & Thompson,
2007) and neuroimaging comparisons with other emotion regulation techniques ((e.g.,
expressive suppression (Goldin, McRae, Ramel, & Gross, 2008), distraction (McRae,
et al., 2010), cognitive load (Van Dillen, Heslenfeld, & Koole, 2009)). Cognitive
Reappraisal is a “cognitive-linguistic strategy that alters the trajectory of emotional
responses by reformulating the meaning of a situation” p 1, (Goldin, et al., 2008) and
this results in a decrease in the reported negative emotion (Wager, Davidson, Hughes,
Lindquist, & Ochsner, 2008). In other words, the result of cognitive reappraisal is
that it attenuates negative emotional experience resulting in an enhancement in
cognitive control of emotion. This implies it is important to consider not only the
stressful event, but the individual’s perception of the stressor, to understand how
skilled performers maintain consistency under various challenges and during mental
stress.
In support of this notion, the dynamics between stress (i.e. state anxiety) and
performance can be further characterized by the transactional model described by
Staal (2004). Specifically, stress is conceived as the aggregate result of the
interpretation of the environmental challenge, as well as the objective challenge. In
particular, this model integrates human performance and information processing
capacity with the notion of appraisal of threat, controllability, and predictability for
understanding how stress affects performance. As such, a key element is the
individual’s appraisal of the situation. This implies that a great deal of individual

5
variation in the response to the stressor may be a consequence of the perception of the
event rather than the actual environmental stressor. Therefore, the perception of the
stimulus is essential rather than the objective stimulus and, furthermore, the
perception may be highly related the individual’s experience (i.e. domain specific).
Consequently, elite athletes may have developed a domain specific reaction to
stressful challenge, which through experience and training, allows them to
endogenously regulate their affective response to known stressors and efficiently
respond to affective challenge.
In summary, the present work examined the neuropsychological processes that
promote psychomotor efficiency under stress. Using elite athletes as a model for a
stress resilience population this study attempted to provide insight into the mental
approach these individuals employ to maintain stability as they engage in sports-
specific challenges. A model of stress resiliency is proposed which is characterized
by an economy of affective neural processing and an experience-dependent
automaticity of neural processes associated with cognitive reappraisal.
The present dissertation is organized into three empirical papers accompanied
by relevant literature reviews and discussion sections. The chapter 2 of the
dissertation will provide a brief review of psychological stress and cognitive-motor
performance to set a context for the first paper (chapter 3), entitled Brain Processes
during Motor Performance under Psychological Stress, an Independent Component
Analysis of EEG. The goal of this paper is to focus on the effect of mental stress on
human performance, discussing results from a study in which electrocortical
dynamics were examined during competitive precision aiming (target shooting)

6
performance. This paper serves an important role in developing the background and
motivation for the subsequent empirical papers since it examines the relationship
between mental stress, brain dynamics and human performance in a non-expert
group. Importantly, the deleterious effects of stress noted in this paper were likely due
to non-expert status of the group. This paper is followed by a rationale for examining
expert groups (such as elite athletes) in order to understand the unique features that
enable them to adaptively deal with stress (chapter 4). This section is followed by the
second empirical report (chapter 5), entitled Efficiency of Affective Brain Processes
in Expert Cognitive-Motor Performers during Emotional Challenge. This paper
reports that compared to age-matched controls, elite athletes demonstrate an economy
of neural processing in the affective domain, which parallels findings in the literature
for the cognitive motor domain. This paper serves to underscore the adaptive nature
of neural processing efficiency and suggests this type of response may be
characteristic of a stress resilience population. The next chapter (7) provides a
literature review on various emotion regulation approaches and the critical brain
regions involved in emotion regulation. This, in turn, leads to the third and final
empirical paper (chapter 8) entitled, The Specificity of Neural Regulatory Processes
during Emotional Challenge in a Stress Resilient Population. This paper reports an
automaticity of cognitive reappraisal in elite athletes within their domain of expertise.
This finding provides further understanding of the role of experience-
dependent/adaptive coping in individuals who a have history of high performance
under competitive stress. Lastly, the dissertation concludes (chapter 9) with an overall

7
summary, with the goal of linking the three papers to develop a model of stress
resiliency.

8
Chapter 2: Brief Review of Psychological Stress and Cognitive Motor Performance
Psychological Stress
The biological consequence of the affective stress response is the activation of
both the endocrine system and autonomic nervous system (ANS). The following
physiological details illustrate the changes in the body related to the emotional state.
The endocrine system acts through the hypothalamus, anterior pituitary, adrenal
cortex system or HPA axis. Through a biochemical cascade, the hypothalamus
releases corticotropin-releasing hormone (CRH) which travels through the median
eminence to the anterior pituitary. The anterior pituitary releases
AdrenoCorticoTrophic Hormone (ACTH) which targets the cortex of the adrenal
gland, which releases glucocorticoids (eg, cortisol). Cortisol acts catabolically in the
muscles to synthesize new glucose thus providing more energy for aerobic and
anaerobic action. Lastly, the ANS response to stress acts primarily through the
sympathetic nervous system which results in increased cardiovascular output to
muscle, decreased immune response, and inhibition of growth, digestion, tissue
repair, and reproduction (Fox, 2008). The change in physiology during stress
illustrate the importance of emotion regulation in orchestrating the quality of motor
performance. If unregulated, these systems initiated by stress response can introduce
non-essential elements into the action and disrupt the automaticity associated with
skilled motor performance.

9
Stress and the Motor Hierarchy
Poor performance may thus be caused by increased noise from mental stress
adding unwanted complexity to the motor hierarchary. Thus stress-related non-
essential activity may directly affect the tactical level of the motor loop which is part
of the motor hierarchy consisting of the 1) strategic level 2) tactical level 3)
implementation level (Bear, Connor, & Paradiso, 1996). The tactical level is
responsible for the execution and planning of the action. The primary neural
substrates are the motor areas (area 6, 4) with input from the cerebellum to construct
the appropriate coordinative structure.
Stress also acts to disrupt motor performance at the strategic and
implementation levels of the motor hierarchy. At the strategic level, behavioral
regulation and action identification are mediated through the prefrontal cortex and the
posterior parietal cortex areas. In particular the prefrontal cortex (PFC) is a key region
sensitive to stress (Arnsten, 2009). Succinctly, converging evidence indicates that
stress exposure impairs prefrontal function involved in cognitively complex behaviors
that require flexible thinking, and coordination of action (Arnsten, 2009). Thus
without effective emotion regulation, the impairment of PFC function (such as
working memory and attentional control) is coupled with amygdala (a critical
emotion center of the brain) activation of stress pathways thus representing a shift
from a cognitively controlled state to an affectively mediated state (Arnsten, 2009)
(Figure 3). What is particularly interesting is in the affective state, simple movements
such as reaction time are unimpaired or actually better (Arnsten, 2009; Hancock &

10
Szalma, 2008). This type of task requires very little information integration, memory
demands or manipulation and is related to the basal ganglia, another motor region
involved in the strategic level (Hancock & Szalma, 2008). But complex motor tasks
suffer performance decrements without emotional control. Thus under conditions of
stress the amygdala acts to direct action towards habitual responses that are rapid
rather than maintaining flexible and adaptive prefrontally mediate action coordination
(Arnsten, 2009).
The remaining level of the motor hierarchy, the implementation level, reflects
the quality of output from the motor loop and thus may also be modulated by the
stress response. This would result in changes in task execution mediated by brainstem
structures (postural adjustments) and the spinal cord (reflexes). In summary, from the
tactical level increased noise can be manifested in the periphery through loss of
reciprocal inhibition leading to co-contraction of agonist and agontagonist muscles
(Hatfield & Kerick, 2007). At the strategic level a loss of prefrontal coordination
(regulation of goal directed action) increases variability (dysfluency) in performance
and represents a shift from adaptive flexibility behavior to habitual action thus
resulting in performance decline under pressure. In this manner effective emotion
regulation could decrease the likelihood of such a negative performance state.
Cognitive-Motor Performance under Stress: Neuromotor Noise
As stated earlier, skilled motor execution requires essential cortical networks,
leading to greater coordination and a more direct mapping between intended and

11
realized action (Hatfield & Hillman, 2001). But under pressure, some individuals may
experience increased input from limbic sources (i.e., the amygdala), in addition to
recruitment of associative areas leading to “neuromotor noise.” Van Galen & van
Huygevoort (2000) defined this concept of neuromotor noise as the primary source of
human error under workload and time pressure conditions (i.e., mental stress) (van
Galen & van Huygevoort, 2000). These authors argued that such noise reflects a
mismatch between an intended movement and the outcome of that movement. In
particular the authors attempt to make a connection between functional neural activity
and the way in which this information processing is disrupted by neuromotor noise.
They suggest that motor performance is inherently noisy due to the degrees of
freedom in behavioral repertoire, but psychological and physical stress result in,
“…non-specific neural activation spreading” (van Galen & van Huygevoort, 2000).
This increased neuromotor noise results in heighted probability in the action error.
Thus, anxiety induced activity, possibility originating from the amygdala,
would result in hyperactivity of non-essential associative areas leading to neuromotor
noise in the motor system during task execution (Hatfield et al., 2010; van Galen &
van Huygevoort, 2000). The behavioral consequence of neuromotor noise derived
from the psychological stress, may result in directing deliberate attention and control
to well learned motor skills (reinvestment), which results in performance degradation
(Beilock & Carr, 2001).
This injection of neuromotor noise acts to interfere with the refinement of
skilled action, representing a reversion to earlier stages of motor learning.
Consequently the performer reverts from the stage of automaticity (advanced)

12
returning to effortful analysis (beginning) (Fitts & Posner, 1967). Thus, unless the
performer can manage their emotion, they regress in their performance abilities.
Competition as a Stress Manipulation
Recent work from our laboratory supports the model of increased neuromotor
noise during stressful challenge. University of Maryland Reserve Officers' Training
Corps (ROTC) members engaged in a self-paced shooting task where they performed
alone and under conditions of competition. Using this competitive shooting paradigm
as a proxy for stress manipulation, we successfully increased arousal in a laboratory
setting, as indicated by objective self report, heart rate, skin conductance and salivary
cortisol (Hatfield et al., 2010). Recent work from Cerin and Barnett (2009) has
supported this notion that competition is a significant and stressful event and affects
the performer’s emotional state (Cerin & Barnett, 2009). The authors reported that
competition related concerns resulted in high self reported fear compared to
competition extraneous concerns and can be characterized a threatening and
challenging event.
From a neural perspective our work supports these data. Relative to
performance alone, competition resulted in an increase in attentional engagement
(indexed by high alpha desychrony) and increased cortical networking (indexed by
frontal and central to Fz increased theta and alpha coherence) (Hatfield et al., 2010).
The results suggest that increases in psychological stress and the consequential
neuromotor noise are reflected not only physiologically and behaviorally but in the

13
cortical dynamics recruited during task execution. In particular, the coherence results,
which demonstrate networking with a premotor site (Fz), suggest that neuromotor
noise targets regions associated with the tactical level of the motor hierarchy. What
we see is a loss of psychomotor efficiency during stressful challenge.
The next section of the dissertation is a paper entitled Brain Processes during
Motor Performance under Psychological Stress, an Independent Component Analysis
of EEG. This paper seeks to provide additional evidence of the disruption of
psychomotor efficiency under mental stress. Such a finding further supports the
importance of emotion regulation for the management of physiological arousal to
maintain motor performance under pressure.

14
Chapter 3: Brain Processes during Motor Performance under Psychological Stress, an Independent Component Analysis of EEG
Introduction
Classically, the relationship between mental stress and behavioral
performance is explained by the organizing principle of the inverted-U, termed the
Yerkes-Dodson law (Yerkes & Dodson, 1908). Accordingly stress is a dimension of
activation across a continuum, with an under-aroused state resulting in sub-optimal
performance (in part due to decrements in attention & lack of engagement), to the
zone of optimal performance (see (Rietschel, et al., 2010), and finally, to an extreme
excitation state resulting in anxious arousal and leading to performance decline
(Hatfield & Brody, 2008; Staal, 2004). Although this arousal-performance
relationship is useful, few investigators have offered mechanisms to explain the
phenomenon. One promising explanation is the direction of explicit attention and
control to well learned motor skills during stress exposure, which, in turn, results in
performance degradation (Beilock & Carr, 2001; Chell, Graydon, Crowley, & Child,
2003; Kinrade, Jackson, & Ashford, 2010; Maxwell, Masters, & Poolton, 2006).
Consequently, the performer reverts from the advanced stage of automaticity to
effortful analysis (Fitts & Posner, 1967). Thus the confluence of increased state
anxiety and explicit self monitoring leads to a conscious control of essential motor
control processes (Masters, 1992; Masters & Maxwell, 2008). The result is a
maladaptive regulatory response by which performers ‘reinvest’ in control strategies
associated with early explicit stages of learning leading to performance decline under

15
pressure in a number of tasks (beyond the shooting task described above) (Jackson,
Ashford, & Nosworthy, 2006; Lam, Maxwell, & Masters, 2009; Wan & Huon, 2005).
Although promising, this explanation is also incomplete in terms of offering an
underlying mechanism.
In attempt to address this limitation, we examined the manner by which
mental stress alters the performers neural state during stressed conditions. During
skilled motor execution, expert performers demonstrate psychomotor efficiency,
relying on essential brain networks in a focused and efficient manner leading to
greater skeletal muscle coordination and a more direct mapping between intended and
realized cognitive motor action (Baumeister, Reinecke, Liesen, & Weiss, 2008; Del
Percio, et al., 2007; Hatfield, Haufler, Hung, & Spalding, 2004; Hatfield & Hillman,
2001). Precision aiming tasks such as pistol shooting have been employed to explore
the notion of efficiency during motor performance since they require visual-spatial
processing, planning, and perceived control of movement. Such tasks hold the
advantage of ecological validity since participants are critically involved and
motivated to perform while motionless, allowing for artifact-free psychophysiological
recording (Deeny, Haufler, Saffer, & Hatfield, 2009; Del Percio, Babiloni, Bertollo,
et al., 2009; Haufler, Spalding, Santa Maria, & Hatfield, 2000). Numerous studies
employing electroencephology (EEG) have revealed that the left temporal region
(T3), associated with verbal-cognitive analysis, decreases in activity (reflected by T3
EEG alpha synchrony) during the aiming period of expert shooting (Hatfield,
Landers, & Ray, 1984; Haufler, et al., 2000; Kerick, et al., 2001; Lawton, Hung,
Saarela, & Hatfield, 1998) and that left temporal activity is progressively reduced

16
during learning (Kerick, Douglass, & Hatfield, 2004). In this manner, increased EEG
alpha power indexes cortical relaxation, suggesting attenuation of nonessential
processes during skilled performance of a motor task thus reflecting the economical
automaticity of task-specific functioning (Babiloni, et al., 2008; Babiloni, et al., 2009;
Babiloni, et al., 2010; Del Percio, Babiloni, Bertollo, et al., 2009; Del Percio,
Babiloni, Marzano, et al., 2009; Del Percio, et al., 2010; Del Percio, et al., 2008). The
brain dynamics observed in the left temporal region suggests that experts employ less
verbal-analytical processing during the aiming period (possibly due to a shift to
reliance on subcortical structure) since it appears to contribute non-essential neural
activity or noise, greater complexity and less consistency in motor performance
(Hatfield & Brody, 2000).
Importantly, such studies have been conducted under conditions of low stress
particularly under non-competitive, non-evaluative conditions, but they do provide a
logical framework from which to predict the effects of mental stress on brain
dynamics during motor performance. In this manner, if skilled aiming performance
depends on relative visuospatial engagement and relative suppression of left
hemispheric verbal analytical processes (a sensitive marker of performance outcomes
in situations of non-stress (Hatfield & Hillman, 2001)) than it follows that left
temporal activation should occur during mental stress. In turn, the efficiency of
skilled motor performance may become disrupted under mental stress leading to
behavioral changes (i.e. degradation) in task performance. In this manner, stress
induced alterations in performance may be caused by increased neuromotor noise
from verbal analytical processing adding unwanted complexity to the motor

17
hierarchy, which is similar to the notion of reinvestment from a different level of
analysis. Thus, the injection of neuromotor cortical noise acts to interfere with the
refinement of skilled action, adding non-essential cortical complexity to the motor
task. Therefore the purpose of this study is to examine changes in cortical dynamics
associated with mental stress specifically by examination of left temporal region in
order to understand how stress affects brain dynamics during motor performance.
To achieve this end, we used competition as a stress manipulation.
Participants engaged in a self-paced precision aiming target shooting task during
which they performed alone and under conditions of competition. Altering the social
environment we attempted to enhance mental stress while measuring EEG to examine
the brain dynamics during action execution under pressure. Using a theoretical model
that predicts that the left temporal region is sensitive to precision aiming performance
(Hatfield & Hillman, 2001), independent component analysis (ICA) was used to
identify a functional cortical component that represents non-essential activity in the
left temporal region (associated with elevated linguistic function or self talk utilized
during reinvestment). This neural noise component was used as a means to quantify
non-essential activity during the stress exposure condition (competition) compared to
the reference condition (performance alone). Increased complexity (indexed by
increased clustering to noise template) reflects recruitment of non-essential cortical
activity during competitive stress. We also examined the neural sources of this
functional component by using standardized low-resolution brain electromagnetic
tomography (sLORETA) to determine the source of the component. We predict an
increase in complexity of cortical dynamics during stress of competition which will

18
translate into increased variability in the activation of motor effectors as expressed by
lack of steadiness during aiming movement.
Methods
Participants.
Nineteen participants (2 female) were enrolled from the Reserve Officers’
Training Corps (ROTC) program of a large State university. All participants were
right-hand dominant (Oldfield, 1971) and ipsilateral-eye dominant. Participants were
between the ages of 18-38 (M=22 yrs, SD=4.33) and were screened with a health
history questionnaire to ensure that they were free of neurological and psychiatric
disorders and psychotropic medications. Lastly, all participants met a performance
threshold for study inclusion such that each individual had to place their shot on the
target 80% of the time. Prior to testing, all participants provided written informed
consent approved by the University Institutional Review Board and were instructed
they were free to withdraw from the study at any time.
Task
Participants used their right (dominant) hand to complete a dryfire, pistol
shooting task in which the Noptel ST-2000 was used to monitor shooting
performance (shot placement on the target). Participants stood 5 m from the target to
complete the task. Accordingly the target was scaled down to maintain a

19
proportionate target diameter consistent with that of an official competitive target
(i.e., 50 ft, or 15.24 m). Participants assumed a standard shooting posture; feet were
positioned approximately shoulder-width apart and nearly perpendicular to the
shooting lane to minimize sway. Participants extended the shooting arm while aiming
and sighted the target with their right eye, while the left eye was occluded.
Measures.
Arousal.
Cardiovascular and skin conductance.
Autonomic measures were recorded from the left hand, and the chest area
about the heart using a Thought Technology Procomp2 system, (encoder model #
SA7400). Electrocardiogram (EKG) and Skin Conductance (SC) were collected:
EKG was sampled at 256 Hz through a single lead consisting of three electrodes
(model # SA9306M), sensor placement consistent with manufacturers
recommendations. SC (model #SA9309M) was sampled at 32 Hz; sensors were
attached to the 2nd digit of the 2nd and 4th finger.
Psychoendocrine.
Saliva collection (Saliva Oral Swab) tubes were labeled in accordance with
sample time. The participants were then instructed to gather saliva in his or her

20
mouth, and place the collector in the middle of the mouth until the pad was saturated.
The participant then inserted the Oral Swab into the uncapped tube, recap firmly, and
put the tube in the storage tray. The tubes were stored in plastic zipper bags in the
freezer. After all other data were collected for this study the frozen tubes were
analyzed by Salimetrics (State College, PA) for cortisol assays. All samples were
assayed for salivary cortisol in duplicate using a highly sensitive enzyme
immunoassay (Salimetrics, State College, PA). The test used 25 µl of saliva per
determination, has a lower limit of sensitivity of 0.003 µg/dl, standard curve range
from 0.012 µg/dL to 3.0 µg/dL, an average intra-assay coefficient of variation of
3.5% and an average inter-assay coefficient of variation of 5.1%. Method accuracy
determined by spike and recovery averaged 100.8% and linearity determined by serial
dilution averaged 91.7%. Values from matched serum and saliva samples show the
expected strong linear relationship, r (47)=0.91, p < 0.0001.
Self-reported arousal assessment.
Visual analog scale.
The Visual Analog Scale (VAS) asks participants to draw a vertical line on a
100 mm horizontal line that is anchored by adjectives consistent with the dimensions
listed below. The mark represents the degrees of a psychological state. The following
questions were posed: VAS 1: How competitive do I feel? (0=not competitive,
100=ultra competitive); VAS 2: How stressed am I? (0=no stress, 100=completely
stressed); VAS 3: How confident do I feel? (0=extremely confident, 100=no

21
confidence); VAS 4: How relaxed am I? (0=not relaxed, 100=completely relaxed).
The VAS was scored through a measurement of where the participant drew a vertical
line on a 100 mm horizontal line that was anchored by adjectives consistent with the
dimensions listed above (approach adapted from (Bixby, Spalding, & Hatfield,
2001)).
State anxiety inventory.
The participants were assessed by the State-Trait Anxiety Inventory-State
(STAI-S) indicating momentary anxiety (Spielberger, Gorsuch, & Lushene, 1970).
The STAI-S consists of a total of 42 items rated on a 4-point Likert-type scale
ranging from ‘not at all’ to ‘very much so’ in terms of how the participant feels at the
moment. The STAI-S score ranges from 20 to 80, with increasing scores reflecting
greater anxiety.
Brain – EEG.
Scalp electroencephalographic data were collected using tin electrodes housed
within a stretchable lycra cap, (Electro-Cap International, Inc.). Data were acquired
from 30 sites referenced to linked earlobes and a common ground (FP2), labeled in
accordance with the 10-20 international system (Jasper, 1958). At all sites of interest
(FP2, FP3, Fz, F3, F4, C3, C4, P3, P4, T3, T4, O1, O2), impedances were maintained
below 10 kΩ. All channels were amplified 500 times using Neuroscan Synamps 1,
22
linked to Neuroscan 4.3.3 acquisition/edit software on a Gateway Pentium computer
running Windows XP operating system. Bandpass filters were set at .01-100 Hz with
a sampling rate of 1,000 Hz. Electrodes were placed above and below the left eye
over the orbicularis oculi muscle (VEOG) and the outer canthi of both eyes (HEOG)
to record eyeblinks. An electronic pulse was sent into the EEG by the shooting
simulator to mark onset of the trigger pull into the continuous EEG recording.
Motor behavior.
The Noptel simulator system was used to measure shooting score and motor
performance. This system is an optical reflection unit (light emitting and receiving
unit), which is attached to the barrel of the pistol. During the aiming period, a light
was emitted from the unit and subsequently reflected from the target through
reflecting crystals surrounding the target. The reflected light was then captured by the
optical unit and transmitted to an analog-to-digital conversion device at a rate of 66
Hz. The actual shot location was recorded as the position of the aiming point on the
target at the time of the trigger pull. Feedback was provided for all trials (shots) in the
form of a shooting score and a “clock face” reference to identify the position on the
target. All scoring was consistent with competitive shooting scoring metric of Bulls
eye=10, outermost ring=1. All participants shot from a standing position.
Procedure (Manipulations).

23
The study required that participants to complete three testing sessions,
orientation, practice-alone and competition, over a two-day period.
Day 1 – orientation.
The purpose of the orientation was to familiarize the participants with the
procedure of the study and to measure that all of them met the performance threshold
of hitting the target 80% of the time. Upon arrival at the laboratory, participants were
informed of the requirements of the experiment and provided an opportunity to ask
questions before they signed the consent form. A health history questionnaire was
given to ensure all participants were free from neurological abnormalities and
handedness was assessed. In order to reduce any novelty effect that might be
observed on the actual testing day, the electroencephalographic and autonomic
nervous system (heart rate (HR), and skin conductance (SC)) monitors were placed
on the participants for familiarization, and they completed the behavioral assessments
(VAS, State Spielberger Self-Evaluation Questionnaire), and were instructed on the
acquisition of salivary cortisol (i.e., oral swab). Participants viewed a videotape made
by a National Collegiate Athletic Association Division I pistol shooting coach in
which instructions about shooting position and pistol safety were provided.
Participants were then asked to begin a shooting practice session of three blocks of 20
trials (shoots) each for a total of 60 practice trials. The first block was considered
“warm up” and did not contribute to the study selection criteria. Selection criteria for
participation in the rest of the study required that 80% of their shots during blocks 2

24
and 3 of the orientation practice sessions must “hit” inside the outermost ring of the
target. This performance criterion was established to assure that study participants
were relatively similar in their ability to complete the shooting task successfully.
Participants were also informed of the two testing conditions: performance alone
(PA) and competition (C)
Day 2: performance alone and competition.
Participants were asked to refrain from consuming any alcoholic or
caffeinated beverages on the day of testing and asked to get 7-8 hours of sleep the
prior night. Upon arrival the participants were provided with a brief review of the
instructional video and were refamiliarized with the tasks associated with the two
testing phases (PA and C) (see Figure 2). Participants were prepared for
electroencephalographic as well as autonomic nervous system (HR and SC)
monitoring. The testing sessions were counter-balanced for testing order such that
half of the participants engaged in performance alone first, followed by competition
and the other half of the participants completed competition first and then
performance alone with rest periods in between. Participants were allowed 10
sighting shots prior to each of their Day 2 testing sessions. For both PA and C,
feedback was provided after every shot in the form of their score and a “clock face”
reference to indicate shot placement. Prior to both conditions, cortisol, VAS, STAI-S
behavioral questionnaires and baselines (1 minute standing in shooting position
without pistol) were collected prior to session commencement. In between PA and C

25
there was an approximately 15 minute rest period. Within a testing sessions the
subjects were standing continuously thus these periods were when subjects were
considered ‘engaged’ in relation to the baseline period.
Figure 2. Schematic illustration of task protocol. Participant 1 arrived prior to the competition for his/her performance alone session whereas participant 2 executed his/her performance alone after the competition.
Performance alone.
The performance alone session was executed in a quiet environment.
Participants were informed that their score in the performance alone session had no
impact on the competition and they were instructed to remain focused and relaxed
during this period. Following the baseline measures and the sighting shots, a second
cortisol sample was collected just prior to the first 20 test shots. After shooting, the
participants received approximately a 5 minute break during which they completed a
second battery of VAS and STAI behavioral assessments. The final 20 test shots were
then executed followed by a third cortisol sample. After an additional 5-minute delay,
the final cortisol sample was obtained for that session.

26
Competition.
The competition session (C) involved the same order of measurements, but
included shooting against another study participant. During the competition,
participants took turns shooting and alternated between shooting order such that in
one trial, shooter A shot first followed by shooter B, but the next trial shooter B shot
first, etc. Participants were instructed to set the gun down between each shot and to
remain standing throughout the shooting session. After each trial scores were
presented to the competitors and a winner of that trial was declared. During
competition the following psychological pressures - in addition to peer-competition -
were imposed on the subjects: 1) social evaluation by a superior officer who
conspicuously took notes and evaluated participants’ shooting stance and accuracy; 2)
financial loss or gain of 50 cents per round, from a starting sum of $20 (in the case of
equal scores, the sum at stake carried over to the next shot), a dollar bonus for a
bull’s-eye and a dollar loss for missing the target completely; 3) a 30 second time
constraint for each shot, beginning when the subject grasped the pistol; 4) video
camera recording; and 5) participants were placed on teams such that their score
contributed to overall team score, both of which were displayed outside the ROTC
field house. Participants were informed of all of these pressures during the
instructional period prior to task execution and were told to attempt to “beat” their
competitors’ score.

27
Signal Processing and Data Analysis.
All data were co-registered such that trials were only included if
cardiovascular, SC, motor behavior and EEG data were artifact free. Arousal
measures were analyzed during the PA and C conditions and by block (first 20 shots,
second 20 shots). EEG was measured according to condition PA and C, four seconds
prior to trigger pull. EEG spectral and coherence results will be presented in
companion manuscript.
Arousal.
Heart rate and heart rate variability.
The first and last 10% of each EKG time series was discarded in order to
remove transient portion associated with beginning and end of a block. The remaining
80% of EKG represented a stable measure of cardiac activity during a particular level
of engagement (competition and performance alone). The inter-beat-interval (ibi),
defined as the time in ms between positive peaks of the QRS complex in the EKG
signal, was determined using customized software written for Matlab (Mathworks).
HR in beats per minute (bpm) was computed from the average ibi. The respiratory
sinus arrhythmia (RSA) was computed from the ibi using MXedit software. RSA is
an index of vagal influence with higher values of RSA associated with an increase in
vagal influence. The same analysis was performed on the 1-minute standing baseline
EKG time series.

28
Skin conductance.
The first and last 10% of each signal was discarded in order to remove
transient portion associated with beginning and end of a block. The remaining 80% of
signal represented a stable measure of SC during a particular level of engagement (C
and PA). Tonic skin conductance (SC-t) was computed as the average SC across this
interval. Phasic skin conductance (SC-ph) measures the amount of fluctuation of SC
in a given time period. It is computed by calculating the area between the SC signal
and a straight line connecting the initial and ending value of SC for the defined time
period regardless of direction, positive or negative (Senior, Russell, & Gazzaniga,
2006). The time window used to examine phasic SC was determined by computing
the dynamic change in SC-ph. The dynamics of SC-ph for both competition and
performance alone were computed using a 5s moving window from 10s before the
trigger pull to 5s after. The dynamics for each condition were averaged across shots
for each subject and then across subjects. The difference between the dynamics of
SC-ph during competition and performance alone was examined to find the maximum
difference. The maximum difference was used as the center of a time window
between 1.5s prior to trigger pull and 3.5s after. In order to determine the nature of
the difference in SC-ph between performance alone and competition, the percentage
of negative deflection in SC-ph was computed. A negative deflection represents a
decrease in SC. The phasic SC was determined for the 1-minute standing baseline as
the average of the phasic SC computed with a 5s moving window across the entire
minute.

29
Psychoendocrine
The salivary cortisol levels were computed for each sample time (1, 2, 3, 4)
for each condition (PA and C). A first order polynomial was fit to the slope of the
values of the cortisol over the sample times (1, 2, 3, 4) for each testing session (PA
and C).
Brain – EEG.
In order to reduce the influence of eye blinks on the EEG data an ocular
artifact reduction filter was applied (Semlish et al., 1986). The 4-s period of
continuous data prior to the completion of each shot was then partitioned into four
successive 1-s epochs. The termination of the final epoch was coincident with the
trigger pull (i.e., the numbering of epochs was based on a temporal sequence during
the aiming period so that Epoch 4 represented the initial 1-s period preceding
sequentially Epoch 3, Epoch 2, Epoch 1, and the shot). The data were then baseline
corrected and linear detrended. A final visual inspection of all sweeps was performed
to remove any epochs that still contained artifact.
Independent Component Analysis (ICA).
ICA (Bell & Sejnowski, 1995) using an extended infomax algorithm (Lee,
Girolami, & Sejnowski, 1999) of artifact-free EEG time series was executed on both

30
conditions. The data was epoched 2 seconds prior to trigger pull and 3 sequential
trials were concatenated to produce a time series 6 seconds in length. Twenty eight
independent components (IC) were generated for each 6 seconds (2 second epoch,
three trials) concatenated time series and from the artifact-free EEG.
For selection of the neuromotor noise template, the worst performer, who
showed degradation of motor performance under psychological stress, was
determined by kinematic analysis of the shot score (C 5.20, PA 4.59) and shot
standard deviation (C 2.60, PA 2.48) (see Figure 3). Also critical to this selection
process was the participant’s behavioral self report which reveal for the VAS1 scale
(How competitive do I feel? (0=not competitive, 100=ultra competitive)) a score for
PA of 89.5 and for C of 99.5; VAS2 scale (How stressed am I? (0=no stress,
100=completely stressed)) a score for PA of 65 and for C of 82; VAS3 (How relaxed
am I? (0=not relaxed, 100=completely relaxed)) a score for PA of 58.5 and for C of
18.5. For the STAI state (20-80, low to high) questionnaire he reported a score of
36.5 for PA and 68 for C. These metrics indicated both psychometrically and
behaviorally that this individual found the stress of competition maladaptive.
Visual inspection of the independent components from this poor performer
resulted in the selection of the neuromotor noise template based on our conceptual
model (Figure 4, left panel). Power spectral density (PSD) plots of the time series
associated with the neuromotor noise component illustrated the frequency domain
characteristics of the cortical network spatially represented by the ICA scalp map.
The PSD of the noise component shows desynchrony of alpha power and increased
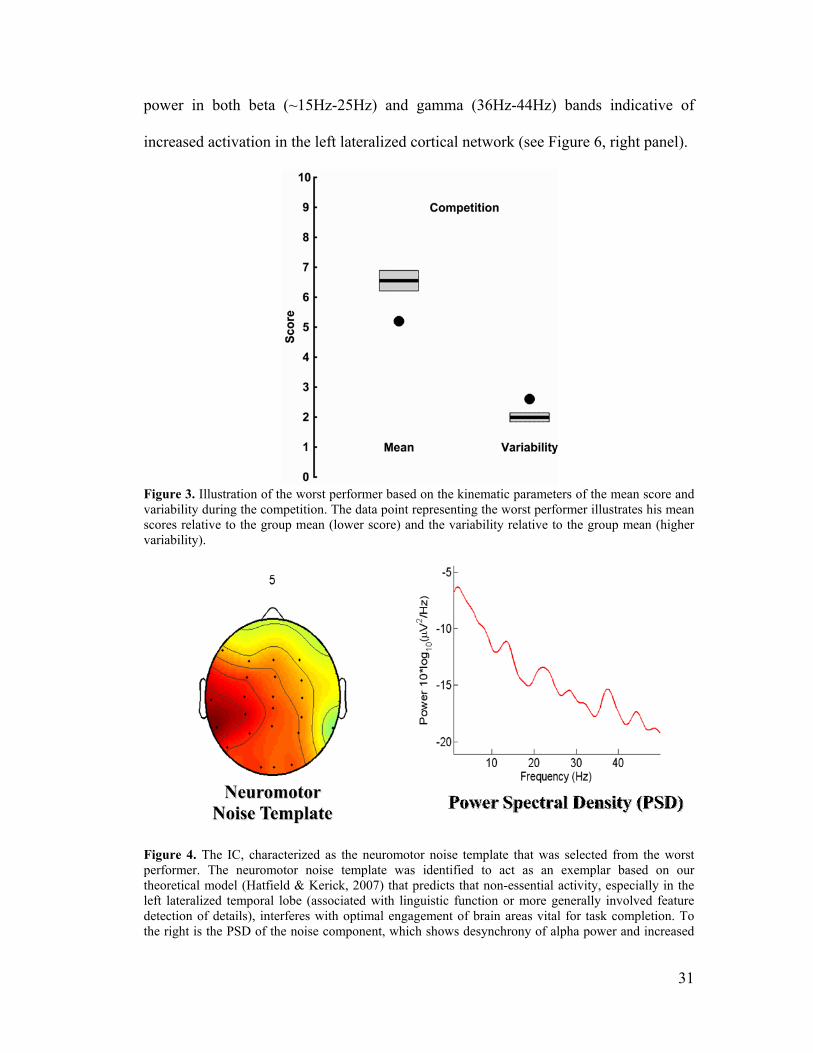
31
power in both beta (~15Hz-25Hz) and gamma (36Hz-44Hz) bands indicative of
increased activation in the left lateralized cortical network (see Figure 6, right panel).
Figure 3. Illustration of the worst performer based on the kinematic parameters of the mean score and variability during the competition. The data point representing the worst performer illustrates his mean scores relative to the group mean (lower score) and the variability relative to the group mean (higher variability).
Figure 4. The IC, characterized as the neuromotor noise template that was selected from the worst performer. The neuromotor noise template was identified to act as an exemplar based on our theoretical model (Hatfield & Kerick, 2007) that predicts that non-essential activity, especially in the left lateralized temporal lobe (associated with linguistic function or more generally involved feature detection of details), interferes with optimal engagement of brain areas vital for task completion. To the right is the PSD of the noise component, which shows desynchrony of alpha power and increased

32
power in both beta and gamma bands indicative of increased activation in the left lateralized cortical network.
Next four feature values of the ICs were investigated to isolate the neuromotor
noise component across the population using threshold based clustering algorithm
(Rong & Contreras-Vidal, 2006): topographic distance, activation entropy, kurtosis,
and spectral distance of the independent components. Threshold selection was
identified by plotting entropy and kurtosis compared to the spectral and spatial
features of all the independent components of three randomly selected subjects. In the
feature plots, each threshold was approximately ranged from 2.80 to 2.81 for entropy,
5.0 for kurtosis, 0.5 to 1.5 for spatial distance, and 0.22 to 0.4 for spectral distance.
This threshold was applied across all subjects in both conditions to serve as a
quantitative means of assessing cortical complexity.
Standardized Low Resolution Brain Electromagnetic Tomography (sLORETA).
To estimate the sources of the neuromotor noise IC time series, we used
standardized low-resolution brain electromagnetic tomography (sLORETA) (Pascual-
Marqui, 2002) in a fashion similar to (Bradberry, Gentili, & Contreras-Vidal, 2010).
First, preprocessed EEG signals from all channels were fed to sLORETA to estimate
current sources. Second, Pearson’s correlation coefficients (r values) were computed
between the squared time series of each of the preprocessed EEG signals and the
6239 time series from the sLORETA solution. Third, the mean of the |r values|
multiplied by the |IC weights| of their associated sensors was assigned to each voxel
(where | | means absolute value). Fourth, for visualization purposes, the upper 15% of

33
voxels were set to the value one, and the rest of the r values were set to zero. Finally
these binary-thresholded r values were plotted onto a surface model of the brain.
Motor behavior.
Mean score was computed based on distance from center target. All scoring
was consistent with competitive shooting scoring metric of Bulls eye=10, outermost
ring=1. The aiming point trajectory on the target in mm was sampled at 66Hz. The
tangential displacement with respect to shot was computed for the 3s period prior to
trigger pull. Variability was computed as the standard deviation of the tangential
displacement with respect to shot. In addition normalize jerk was computed since it is
a unitless measure of the dysfluency based on the third derivative of position (or the
rate of change in acceleration). The dynamic change in normalized jerk was
computed using a 1s moving window. The dynamics for each condition were
averaged across shots for each subject and fitted with a first order polynomial to
determine slope. Normalized jerk was also examined for the final second prior to
trigger pull.

34
Statistical Design.
Arousal
Cardiovascular and skin conductance.
Arousal measures, HR, RSA and SC were statistically analyzed as a 2 x 2 x 2
(Condition x Order x Block) repeated measures ANOVA.
Psychoendocrine.
Cortisol sample values were statistically analyzed with a 2 x 2 x 4 ANOVA
(Condition x Order x Sample). A first order polynomial was fit to the slope of each
line (PA and C) and these slopes were tested by employing a 2 x 2 (Condition x
Order) ANOVA.
Self-reported arousal assessment (visual analog scale and state-trait
anxiety inventory).
The VAS scores were statistically analyzed as a 2 x 2 x 2 (Condition x Order
x Block) repeated measures ANOVA. The STAI-S inventory scores were statistically
analyzed as a 2 x 2 x 2 (Condition x Order x Block) repeated measures ANOVA.

35
Brain – Independent Component Analysis (ICA).
The number of components clustering to the noise template were entered into
a 2 x 2 (Order x Condition) ANOVA.
Motor behavior.
Both score and variability were subjected to a 2 x 2 (Condition x Order)
ANOVA. A 2 x 2 (Condition x Order) ANOVA was executed for both the normalized
jerk value at the final second prior to trigger pull and normalized jerk slope three
seconds prior to trigger pull.
Results
The study design included order and condition factors. All participants
completed both the performance-alone and competitive conditions and the order was
counterbalanced. For the purpose of this report, all observed interactions of condition
and order were characterized by a difference in magnitude. There were no directional
differences due to order. We will highlight the findings for the order that best
illustrates the given prediction.

36
Arousal.
Cardiovascular and skin conductance.
The HR during competition (M=90.46 (SEM+/- 3.29)) is significantly higher
performance alone (M=86.18 (SEM+/- 2.65)). The RSA ANOVA revealed no
significant differences between performance alone (M=5.88 (SEM+/- 0.20)) and
competition (M=5.87 (SEM+/- 0.24)). An Engagement x Condition (interaction
F(1,15)=30.401, p<0.001 indicates that SC-ph is significantly higher when engaged in
task performance compared to baseline for whether performance alone (effect size
(ES)=4.0196) or during competition (ES=1.1796).
Self-reported arousal assessment.
Behavioral measures provide evidence of successful manipulation. The VAS
measures reveal a robust elevation in self-reported competitiveness (F(1,16)=8.869,
p=0.009, ES=0.67). Participants additionally reported that competition was
accompanied by an increase in perceived stress (F(1,16)=7.715, p=0.013, ES=0.39).
In addition state anxiety was elevated during Competition (M=34.62 (SEM+/- 1.9))
relative to the Performance-Alone (M=32.35 (SEM+/- 1.972) (approached
significance, two tailed, F(1,16)=4.177, p=0.058, ES=0.246). No difference between
competition and performance alone was found for confidence and relaxation (see
Figure 5).
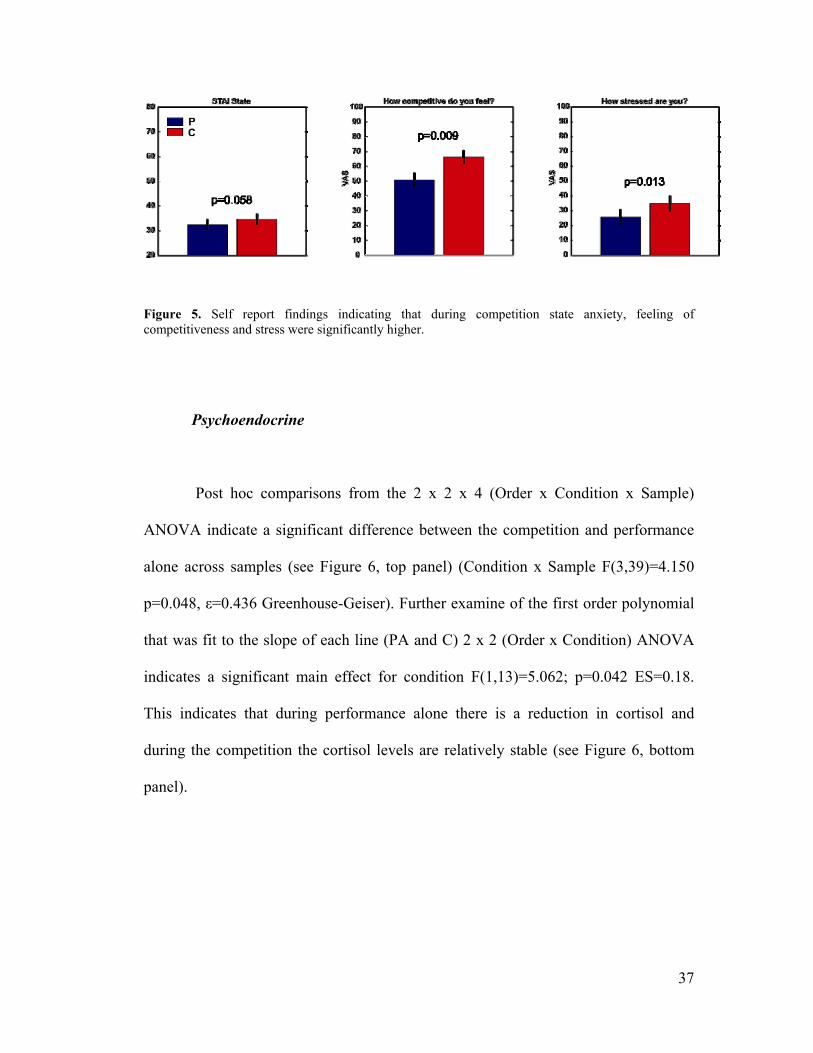
37
Figure 5. Self report findings indicating that during competition state anxiety, feeling of competitiveness and stress were significantly higher.
Psychoendocrine
Post hoc comparisons from the 2 x 2 x 4 (Order x Condition x Sample)
ANOVA indicate a significant difference between the competition and performance
alone across samples (see Figure 6, top panel) (Condition x Sample F(3,39)=4.150
p=0.048, ε=0.436 Greenhouse-Geiser). Further examine of the first order polynomial
that was fit to the slope of each line (PA and C) 2 x 2 (Order x Condition) ANOVA
indicates a significant main effect for condition F(1,13)=5.062; p=0.042 ES=0.18.
This indicates that during performance alone there is a reduction in cortisol and
during the competition the cortisol levels are relatively stable (see Figure 6, bottom
panel).

38
Figure 6 Cortisol results. Panel A indicates the relative stability of the cortisol levels across the competition whereas for the performance alone cortisol levels are progressively reduced over time. Panel B plots the slope of the cortisol samples over time, illustrating the negative slope during performance alone and the stable positive slope during competition.
Brain.
Independent Component Analysis (ICA).
During Performance Alone, 122.23 (SEM+/- 12.799) components across all
subjects clustered to the neuromotor noise template. During competition, 135.03
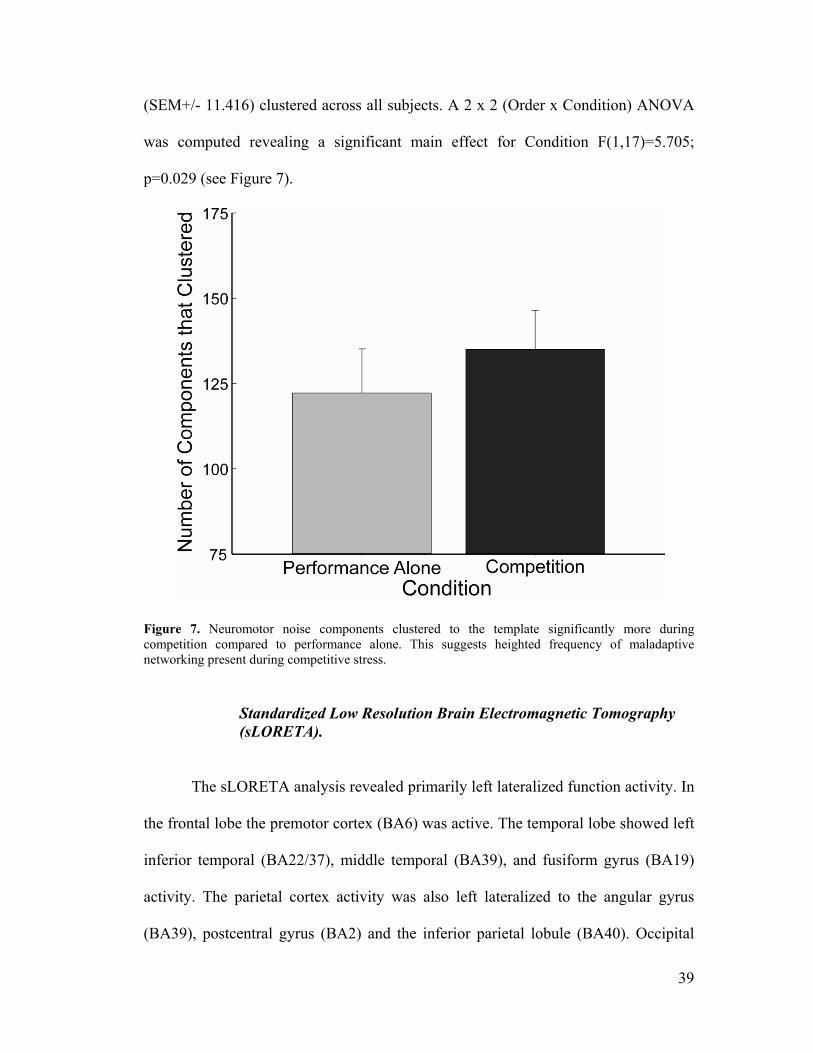
39
(SEM+/- 11.416) clustered across all subjects. A 2 x 2 (Order x Condition) ANOVA
was computed revealing a significant main effect for Condition F(1,17)=5.705;
p=0.029 (see Figure 7).
Figure 7. Neuromotor noise components clustered to the template significantly more during competition compared to performance alone. This suggests heighted frequency of maladaptive networking present during competitive stress.
Standardized Low Resolution Brain Electromagnetic Tomography (sLORETA).
The sLORETA analysis revealed primarily left lateralized function activity. In
the frontal lobe the premotor cortex (BA6) was active. The temporal lobe showed left
inferior temporal (BA22/37), middle temporal (BA39), and fusiform gyrus (BA19)
activity. The parietal cortex activity was also left lateralized to the angular gyrus
(BA39), postcentral gyrus (BA2) and the inferior parietal lobule (BA40). Occipital
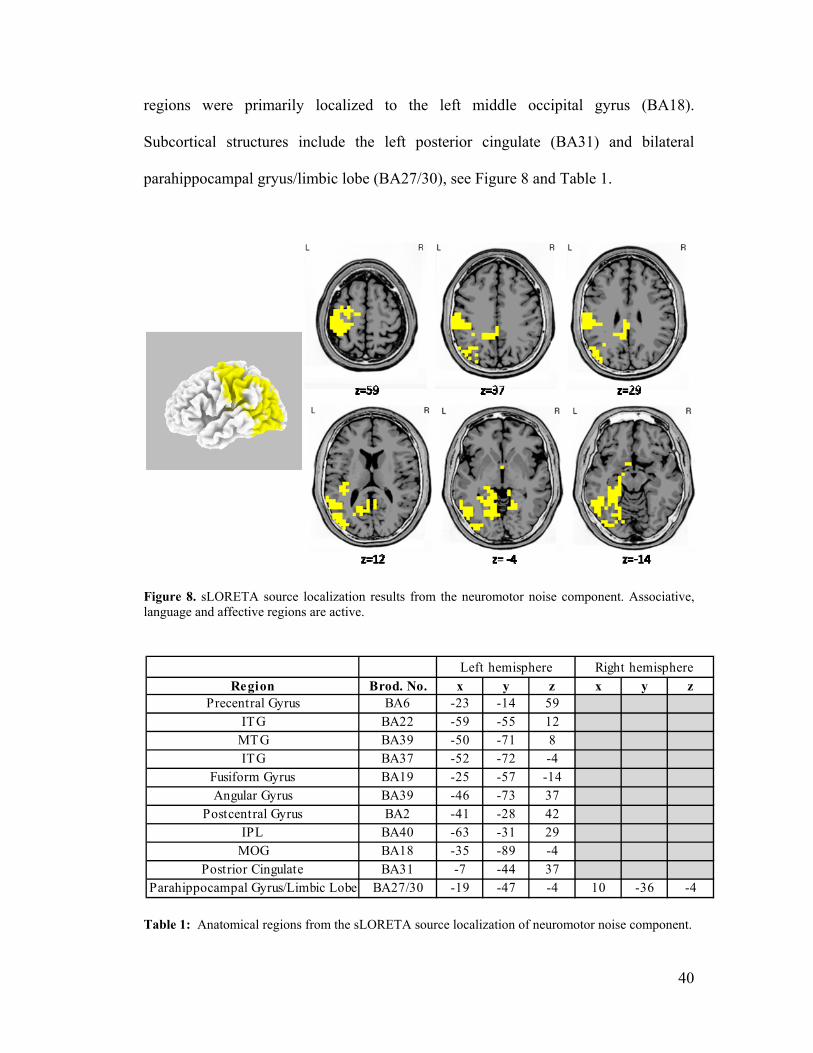
40
regions were primarily localized to the left middle occipital gyrus (BA18).
Subcortical structures include the left posterior cingulate (BA31) and bilateral
parahippocampal gryus/limbic lobe (BA27/30), see Figure 8 and Table 1.
Figure 8. sLORETA source localization results from the neuromotor noise component. Associative, language and affective regions are active.
Table 1: Anatomical regions from the sLORETA source localization of neuromotor noise component.
Right hemisphere
Region Brod. No. x y z x y zPrecentral Gyrus BA6 -23 -14 59
ITG BA22 -59 -55 12MTG BA39 -50 -71 8ITG BA37 -52 -72 -4
Fusiform Gyrus BA19 -25 -57 -14Angular Gyrus BA39 -46 -73 37
Postcentral Gyrus BA2 -41 -28 42IPL BA40 -63 -31 29
MOG BA18 -35 -89 -4Postrior Cingulate BA31 -7 -44 37
Parahippocampal Gyrus/Limbic Lobe BA27/30 -19 -47 -4 10 -36 -4
Left hemisphere

41
Motor behavior.
Examination of shot score and variability reveal no significant differences
between performance alone and competition. The mean score for performance alone
was 6.803 (SEM+/- 0.219) and competition was 6.816 (SEM+/- 0.230), p=0.0941.
Variability during performance alone was 0.014 (SEM+/- 0.001) and during
competition was 0.014 (SEM+/- 0.001), p=0.0293. A significant increase in aiming
dsyfluency was seen during the final second before trigger pull in competition
compared to performance alone (Condition F(1,17)=4.886, p=0.041, ES=0.3501). In
addition analysis of the slope prior to trigger pull reveal significantly steeper slope in
competition compared to performance alone (Condition F(1,17)=12.192, p=0.003,
ES=1.0932), see Figure 9.
Figure 9. Kinematic results from performance alone and competition. Although score and variability were statistically equivalence (panel A), the normalized jerk slope (panel C) and value (second prior to trigger pull, panel C) indicate greater disfluency during competition relative to performance alone.

42
Discussion
This study offers a mechanism that attempts to explain a change in motor
performance under mental stress. Previous investigations of skilled performance have
revealed a psychomotor efficiency of expert task execution. This concept of
efficiency is not only reflected in the biochemical, metabolic changes but also in the
cortical processing which mediate more consistent motor effectors. During
circumstances of low mental stress, left T3 alpha synchrony during expert shooting is
a sensitive indicator of skilled action predicated on the notion of a quiescence of
cognitive analysis (Hatfield et al., 2004; Kerick et al., 2004). In this study we
examined how stress may perturb psychomotor efficiency during a competitive
shooting paradigm by capitalizing on the sensitivity of this performance-relevant
brain region. Thus we used the left lateralized temporal lobe region (associated with
linguistic function or more generally involved feature detection of details) as a means
of assessing unwanted complexity in the motor hierarchy during motor performance.
The results provided validity for the role of such regional activity in the quality of
cognitive motor performance and revealed that increased expression of this
component was produced as consequence of competition which in turn translated into
the quality of motor processes.
Our results indicate that we successfully increased arousal in a laboratory
setting, as signified by objective self report, HR, SC and salivary cortisol. This is
consistent with recent work from Cerin & Barnett (2009) who report that competition
is a significant and stressful event and affects the performer’s emotional state. The

43
authors reported that competition-related concerns resulted in high self-reported fear
compared to competition extraneous concerns and the former can be characterized as
a threatening and challenging event (Cerin & Barnett, 2009). In addition kinematic
comparisons revealed competitive stress exposure produced increased disfluency of
action although with this magnitude of stress we saw no difference in variability and
score. Thus, the performance outcome was constant across conditions but the quality
of the aiming trajectory was compromised during mental stress.
Employing two different analytical tools, ICA and sLORETA, we sought to
provide a more complete understanding of how mental stress disrupts motor
performances. The ICA results indicated an increase in complexity (indexed by
increased clustering to left temporal noise template) in competition compared to
performance alone suggesting that a competitive situation introduced nonessential
noise into the motor cortical areas. The specific features of the neuromotor noise
template indentified here are consistent with the more general concept of neuromotor
noise described by (van Galen & van Huygevoort, 2000). Their model identifies
neuromotor noise as the primary source of human error under workload and time
pressure conditions. These authors argued that such noise reflects a mismatch
between an intended movement and the outcome of that movement. They suggest that
motor performance is inherently noisy due to the degrees of freedom in behavioral
repertoire, but psychological and physical stress result in, “…non-specific neural
activation spreading”. The increased neuromotor noise resulted in heighted
probability in action error thus not only disturbing the refinement of skilled action,
but also resulting in performance decline under pressure (van Galen & van

44
Huygevoort, 2000). Our results indicate that the stress of competition produced
behavioral changes in the disfluency of performance, consistent with the neural
processing efficiency (Eysenck & Calvo, 1992). While the reduction in efficiency
does not always results in performance decline in the short run, it is possible that such
attenuated efficiency could translate to performance decline if mental stress is
sustained over time. In the present study the reduction of efficiency was manifested
by heighted disfluency/jerk indicating a compromised smoothness and economy of
motion (Smith, Brandt, & Shadmehr, 2000).
The anatomical specificity revealed by the sLORETA analysis provides
insight into the nature of the neuromotor noise represented in this functional
component. Left lateralized posterior temporal regions including the middle temporal
gyrus, superior temporal gyrus are involved in language processes, specifically the
mapping of phonological representation onto semantic representation (Hickok &
Poeppel, 2007). In addition, posterior parietal regions and fusiform regions are critical
areas in the neural representation of semantic knowledge (Binder, Desai, Graves, &
Conant, 2009). In particular the angular gyrus is reported to be involved in
information synthesis and conceptual knowledge recall required for language
processing (Binder, et al., 2009; Bright, Moss, & Tyler, 2004; Davis, Meunier, &
Marslen-Wilson, 2004). The parahippocampal gyrus is reported to be sensitive to
negative valence during mental stress exposure (Surguladze, et al., 2006). Lastly the
premotor cortex and the supplementary motor area, or SMA are essential in planning
of planning of complex, coordinated movements (Bear, Connor, & Paradiso, 1996)
suggesting the neuromotor noise extends into motor key element of the motor

45
hierarchy. Thus, the perceived psychological stress produced by competition may
elevate input from limbic sources in mesiotemporal regions, which are connected
with numerous sensory and association cortical areas leading to a cascade of non-
essential activity during motor performance (Haines, 2006). In turn, this stress-
induced perturbation to cortical refinement may lead to maladaptive coping strategies
such as reinvestment that recruits associative areas (left temporal-parietal activity)
which can be characterized as neuromotor noise.
Collectively, the anatomical representations of the neuromotor noise
component are consistent with the self-talk described in the reinvestment hypothesis
during anxious arousal (Masters, 1992). Self talk is a means of interpreting feelings
and perception in an effort to change evaluations of the athletes affective state
(Hardy, Hall, & Alexander, 2001). In turn, this self attention may produce a
reinvestment of explicit knowledge in an effort to promote controlled processing
(Maxwell, Masters, & Eves, 2000). Such control processes implies a regression to a
lower stage of skilled motor behavior (Fitts & Posner, 1967). Thus our data support
this model of conscious control during performance under pressure as a maladaptive
means of self talk. In particular this type of explicit monitoring may be more frequent
in complex motor tasks since the training is typically centered on substantial explicit
technical instruction (Kinrade, et al., 2010).
However there are circumstances when self talk may promote rather than
interfere with motor performance. For example, Gibson reported that motivational
thoughts can sustain effort during exertion acute exercise (St Clair Gibson & Foster,
2007). Thus the type of self talk and the nature of situation are critical to influence on

46
behavior. Higher level cognitive linguistic strategies may be adaptive if used as tools
to maintain optimal arousal, manage emotion and support task engagement. Global
cue words that represent a gestalt of explicit skills reduced reinvestment under
pressure and instead produced self-regulatory approaches that do not require
explicitly learned attention (Gucciardi & Dimmock, 2008; Jackson & Wilson, 1999).
Also an emotion regulation strategy called cognitive reappraisal changes the
emotional responses to stressful challenges by verbally reformulating the meaning of
a situation (Goldin, McRae, Ramel, & Gross, 2008; Wager, Davidson, Hughes,
Lindquist, & Ochsner, 2008). In turn utilizing these approaches when challenged with
a stressful event may create an optimal arousal that maintains psychomotor
efficiency.
In addition, the neuromotor noise quantified in this task suggests that it may
not only be the emergence of counterproductive self talk but also a detrimentally
timed cognitive management. The data presented here were extracted from 4 seconds
prior to trigger pull thus characterizing non-essential features that interfere with the
refinement and efficiency just prior to action execution. In comparison, positive self
talk as part of a mental preparation technique prior to motor performance may
regulate arousal levels and be adaptive in that is can promote emotion regulatory
cognitive linguistic strategies like cognitive reappraisal. Further understanding of
different types of self talk and how they may interact with the timing and execution of
the motor task requires future studies. Although self talk may be adaptive, we cannot
determine from our data whether the individuals where engaged in negative or
positive self talk nonetheless, but our results support the notion of a loss of efficiency

47
during stressful challenge. Thus, self talk (independent of type) is extraneous and
non-essential to the motor loop 4 second prior to trigger pull and our results indicate
that it goes up under the stress of competition leading to neuromotor noise.
In summary the results suggest that a competitive situation introduced non-
essential noise resulting in a quantified increase in complexity during a cognitive
motor task. Investigation of the neural sources of this neuromotor noise component
revealed the anatomical substrates of the neuromotor noise are based in language,
affective, and association regions. In addition we found that this loss of psychomotor
efficiency translates into the quality of motor behavior resulting in an increase in
disfluency during the aiming movement.

48
Chapter 4: Examination of Expert Groups to Understand Stress Resilience
The findings described in the first paper portray the detrimental effects of
stress with a non-expert population. However, experts are generally able to
successfully handle stressful events in a manner that does not interfere with
performance. Thus, expert groups are informative models for understanding how
some individuals are resilient to stress perturbation and have developed adaptive
mental approaches to cope with stressful challenge.
This section will focus on the psychological and physiological characteristics
of elite performers, highlighting a few example populations. The first example comes
from the work of Fenz (1975) who investigated expert parachutists using Galvanic
Skin Response (GSR) and Heart Rate (HR) as indicators of arousal (Fenz, 1975). The
GSR is an index of sympathetic system activity, which is mediated (via the
hypothalamus and brainstem) by brain regions involved in emotional processing and
arousal (Driscoll, Tranel, & Anderson, 2009; Patterson, Ungerleider, & Bandettini,
2002) In particular this measure is well suited for evaluating endogenous affect
control since the neurobiological regulatory cascade involved in the GSR includes the
management of subcortical regions (hypothalamic and brainstem) by the
ventromedial prefrontal cortex (vmPFC) and orbitofrontal cortex (OFC) (Patterson, et
al., 2002). These prefrontal regions play a critical role in the regulation of emotional
processing (described in more depth below). Additionally HR reflects the integration
of both branches of the autonomic nervous system and is sensitive to not only arousal
but valence (Patterson, et al., 2002).

49
Thus, utilizing dependent measures sensitive to emotional processing, Fenz’s
work has the advantage of ecological validity since these measures were recorded in
the field during seven intervals prior to jumping from an airplane (Fenz, 1975). The
investigators were particularly interested in what they termed “learned control of the
involuntary cardiac response” by which experts demonstrated a relationship between
arousal and performance that followed an inverted V, with an initial increase in
arousal (as measured by HR and skin conductance) followed by a sharp decline prior
to the jump (control of emotions). This is consistent with a physical manifestation of
a reduced stress response in terms of a relative decrease in sympathetic response
(increased vagal tone) and reduction in HR and GSR. The authors found that in
experts, certainty and uncertainty (known psychological constructs that manipulate
mental stress) were mediating factors in cardiac anticipatory control. They reported
that if an experienced parachutist experienced a mishap, these individuals regressed
temporary into a GSR pattern that matched novices. Thus with greater uncertainty
and threat, the inverted V shape of the expert is lost. Additionally when a subject was
told that his parachute would malfunction, therefore requiring him to use the
secondary chute, the expert’s physiological response was attenuated with greater
variability (Fenz, 1975). Moreover, recent accounts that have looked at stress
dependent performance decline found stress was attenuated in individuals who had
greater perceived controllability of the situation; it was only during uncontrollable
stress where prefrontal mediated action were impaired (e.g., coordination of complex
motor sequences involving decision making) (Arnsten, 2009). This is consistent with
recent work indicating that elite athletes who have greater perceived personal control
50
over the competition showed reduced anger, fear and sadness, in other words,
management of negative stress-related emotions (Cerin & Barnett, 2009). Cognitive
control may thus be a critical factor in the endogenous emotion regulation of stress
resilient elite performers.
Thus it appears certainty, with “attentive observation of the external
environment,” and greater emphasis on task requirements, produces a stabilizing
effect on autonomic stress responses and enhances performance (Fenz, 1975). The
focus on task-relevant, externally oriented events is, therefore, a hallmark of stress
resilience to maintain cognitive-motor performance. Importantly, the Fenz work
reported that emotional expression was minimized in expert performers while the
narrative from novices illustrates anxious anticipation of the stressful event. This
suggests that emotional reactivity can be managed by execution of cognitive control
with a subsequent effect of maintained flexible adaptive behavior.
Consistent with this concept, psychological constructs such as resilience, grit
and hardiness often characterize elite performers who are resistant to the negative
outcomes of stress exposure (Matthews, 2008). Soldiers have been particularly
studied with respect to these constructs since they encounter extreme adverse and
stressful circumstances with high frequency. Hardiness is reported to protect against
the ill effects of stress exposure, while grit is predictive of success in extreme training
programs (Matthews, 2008). Athletes also share such psychosocial attributes such as
determination, confidence, focus, inspiration and hope (Hanin, 2007 ). These
emerging virtues of character strength have a converging effect of characterizing elite
performers as individuals who may be uniquely resilient to stress perturbation.

51
These unique behavioral and psychophysical characteristics may maintain and
promote efficiency in the cognitive-motor domain. But this raises the question as to
whether or not this psychomotor efficiency translates into an economy of brain
processes in regions sensitive to cognitive control of emotion. The next paper seeks to
examine this question by examining the neural response of elite athletes and an age-
matched control group to mentally stressfully images.

52
Chapter 5: Efficiency of Affective Brain Processes in Expert Cognitive-Motor
Performers during Emotional Challenge
Introduction
Superior cognitive-motor performance is characterized by an economy of
effort (Hatfield & Hillman, 2001). Skilled action is exemplified by remarkable ability
in processing speed and accuracy requiring minimal effort and automaticity of
execution (Schneider & Chein, 2003). This behavioral efficiency is evident in the
form of movement economy, with maximized power output, reduced muscle
activation, and greater movement coordination (compared to novices) (Lay, Sparrow,
Hughes, & O'Dwyer, 2002). Neurobiological investigations of skilled performance
also reveal that efficient nature of brain processes during motor action (Hatfield &
Hillman, 2001). In general, neural processing efficiency bears relevance on the
relative ease with which an individual executes a particular task. In the motor domain,
this concept is understood as psychomotor efficiency, characterized by cortical
refinement critical for adaptive engagement of brain areas that are primarily involved
in performance (leading to a consistent, stable and refined motor behavior) (Babiloni,
et al., 2009; Del Percio, Babiloni, Marzano, et al., 2009; Del Percio, et al., 2008;
Hatfield & Hillman, 2001). Thus, individuals who demonstrate low efficiency are
characterized by greater mental effort during task execution (Gray, et al., 2005)
whereas highly skilled individuals reportedly demonstrate neural efficiency (as
evident by reduced neural activity) accompanied by the automaticity of performance
(Del Percio, et al., 2010). Neural efficiency is revealed not only with skilled

53
performers engaged in sensorimotor tasks, but also short term memory tasks, IQ
scores, intelligence (Haier, Siegel, Tang, Abel, & Buchsbaum, 1992), word fluency,
and spatial skills (see (Neubauer & Fink, 2009) for a review). In turn, efficiency of
processing appears to be an organizing principle of skill. This suggests that economy
in the cognitive-motor domain may extend to efficiency in the emotive domain in
individual who consistently performance well under mental stress, in other words,
these individuals may be skillful at adaptively processing emotional events.
The interconnectivity of the brain suggests that the quality of brain processes
associated with emotion likely influences the ability to maintain psychomotor
efficiency. The amygdala, a region heavily involved in emotional processing,
influences cortical sites across the brain via the basal forebrain which in turn
modulates sensory and motor responses to environmental stimuli (Pessoa, 2010).
Consequently, affective attention is critical to the coordination of information
(affective salience, significance, ambiguity, unpredictability and overall ‘biological
value’) about an external event to the cerebral cortex, thus influencing action plans
and serving as the foundation for the interaction between affective and cognition
(Pessoa, 2010; Pessoa & Adolphs, 2010). This suggests that an economy of
processing in the amygdala and other regions critical to the assessment of affective
information (e.g., parahippocampal gyrus) may be essential to the refinement of brain
activity necessary for effective task execution particularly under conditions of
stressful challenge (i.e., competition, social evaluation, etc.). Therefore, using
functional magnetic resonance imaging (fMRI) this study seeks to examine if
individuals who have demonstrated superior cognitive-motor performance under
54
stress expend less brain activity (relative to control comparison) during emotional
challenge.
Athletes are individuals who motorically are faster, stronger, accurate,
consistent, efficient and automatic in their sport compared to non-athletes (Nakata,
Yoshie, Miura, & Kudo, 2010). Practice is an essential mediator of the development
of these unique qualities, since it facilitates both explicit and implicit learning, thus
leading to neurophysiological changes that produce greater efficiency of movement.
From a learning perspective, practice-dependent changes promote 1) the reduction of
explicit regulation of performance, 2) changes in attentional strategies (goal oriented)
and 3) changes in memory processes (greater reliance on declarative and procedural
knowledge are gained as a result of practice) (Kerick et al., 2004). The consequence
is a more automatic performance of task with a reduction in effort and an economy of
neural processing (Chein & Schneider, 2005). Although this principle of efficiency is
a general feature of practice-related cognitive-motor adaptation (Gentili, Bradberry,
Oh, Hatfield, & Contreras Vidal, 2010), neuroscientific investigations of elite athletes
are ideal for examining principles of psychomotor efficiency.
Neuroimaging investigations have consistently revealed that physical training
has produced adaptive changes in neural circuits of elite athletes including faster
motor-related cortical potentials (MRCPs) (increased motor readiness), increased
positive of slow potentials (indicative of an inhibition of neuromuscular activity and
reduce neural activity), structural differences (i.e., larger vermian lobules in human
cerebellum), greater event related alpha synchrony (reduced neural activity), early
P300 latencies (faster speed of stimulus classification), and greater motor planning

55
efficiency (fMRI) compared to non-athletes (for a complete review see (Nakata, et
al., 2010)). Thus the findings reveal that the athlete’s brain demonstrates adaptive
changes in functioning and an automaticity of processing making this population an
exemplar of psychomotor efficiency.
Athletes are also remarkable in that they have distinguished themselves in
situations of competition. Competitive stress has been shown to produce an affective
response in performers (Cerin & Barnett, 2009), but the performance abilities of elite
athletes suggest that they are resilient to such stress perturbation, enabling them to
maintain a high level of motor performance during stressful conditions. In addition,
psychological constructs which promote resilience include commitment, patience,
optimism and self esteem (Vialou, et al., 2010) are congruent with attributes of top
athletes. This suggests that individuals actively involved in high levels of sport are
not only exceptional exemplars of psychomotor efficiency but inform understanding
of stress resilience since this population is not only highly skilled, but is able to
perform at high levels under variable and challenging conditions.
This study will examine elite athletes who have history of high level motor
performance. Since the literature supports neural efficiency in skilled performer
(Hatfield & Kerick, 2007), by deduction, we assume that these individuals are
efficient in cognitive-motor domain. In addition these participants have experience
with performing during an emotionally charged context; therefore it seems reasonable
that they would also exhibit efficiency in the emotive domain, particularly in light of
interconnectivity of affective regions with the cerebral cortex. In summary, these
individuals, through their ability to cope the deleterious effects of mental stress, may

56
show specific adaptive changes in the neural circuits that cognitively control fear,
emotional reactivity and in turn behavior (Feder, Nestler, & Charney, 2009). Thus,
we predict that elite athletes may have developed an economy of neural processing
when faced with stressful challenge but this may be specific to their sport. Through
experience elite athletes may have developed a neural processing efficiency to sport
specific negative events such that overall arousal is efficiently managed promoting a
generalized economy of brain activity (Pfaff, Kieffer, & Swanson, 2008). Thus it
would be logical that such great athletes would be less perturbed affectively which
would help them to be more stable motorically.
In addition, the management of cortical arousal to promote psychomotor
efficiency may be the sequelae of a cognitive interpretation of the stressful event.
Studies have shown that cognitive control and emotion regulation involve the
prefrontal cortical regions (Goldin, et al., 2008; Ochsner, Bunge, Gross, & Gabrieli,
2002), and additionally, the prefrontal cortex is a region particularly sensitive to
motor performance efficiency (Rypma, et al., 2006). Thus, we predict that affective
economy may be particularly robust in the prefrontal cortex, since this region
sensitive to performance efficiency and essential to cognitive control of emotion
(Ochsner & Gross, 2008; Rypma, et al., 2006).

57
Methods
Subjects
Twenty-five male participants between the ages of 18 and 22 were recruited
and of these 13 were football athletes (M=21.46 years; SD=0.776) and 12 were non-
athletes (M= 21.08 years; SD=2.19). The football athletes were 1) senior varsity
athletes 2) letter award winners 3) typically play a starting role on the team 4) on a
partial or full athletic scholarship. The non-athletes were healthy subjects who never
played football at a college level but reported familiarity with the goal and rules of
the sport; this is critical to ensure that all subjects understand the meaning of the
negative sport-relevant images. We developed a metric to quantify the football
experience of the control subjects (Please select the answer that best describes your
football experience : 0=no experience, do not watch or attend games (not a fan); 1=no
experience, but watch occasionally (mild fan); 2=no experience, but watch frequently
(avid fan); 3= some experience playing and watch frequently (e.g., intramurals);
4=several years experience playing competitively (e.g., high school); 5=currently
playing competitively) such that control subjects scored a mean score of 3 (M=3;
SD=0.94) for football experience. We additionally characterize their sport experience
outside of football with a similar metric; mean score of 4.09 (M=4.09; SD 0.51) for
sports experience in general.
Additional selection criteria included that the subjects must have been (a)
native English speakers (b) free of current or past diagnosis of neurological or

58
psychiatric disorders, and (c) MRI compatible (e.g., no metal in body, no tattoos on
face, no medicine delivery patch). All subjects gave their written informed consent
and all experimental procedures were approved by the University of Maryland
Institutional Review Board with proper notification IRB of record for Hyman Subject
Research Projects performed at the Georgetown University Center for Functional and
Molecular Imaging.
Procedure.
Stimuli.
Following the approach developed by (Goldin, et al., 2008; Ochsner, et al.,
2004) the fMRI investigation evaluated the BOLD response during negative and
neutral visually presented images. The neutral images served to provide a baseline to
remove lower-level sensory processing associated with the visual modality and thus
isolate affect specific networks. Negative and neutral images were selected from the
International Affective Picture System (IAPS) (Lang, Bradley, & Cuthbert, 1999). In
addition we developed Sport-Specific (SS) images by searching internet databases
(e.g., Google Images) to find images representing unpleasant events experienced
during football competition: for example: 1) injuries; 2) embarrassment due to loss
(i.e., dejected players); 3) critical coaches.
Undergraduates (n=103) at the University of Florida gave their written
consent (approved by the University of Florida Institutional Review Board) and the

59
rated sport pictures (i.e., sport-specific negative images) (31 performance, 39 injury)
and 48 negative IAPS images using the IAPS self assessment manikins and IAPS
protocol (Lang, Bradley, & Cuthbert, 1999). The top 48 most negative sport images
were selected based on valence scores (38 injury, 10 performance) and, for men, the
SS images resulted in a valence rating mean of 4.131 and arousal mean rating of
4.824. In turn, IAPS images were selected with matching valence means scores of
4.116 and arousal mean scores of 4.896 to create equivalence between the two image
sets. These ranges are consistent with what Patrick and Lavoro (1997) reported as
negative for IAPS images: "Slides with mean valence ratings of less than 4.5 out of 9
were classified as unpleasant, those between 4.5 and 5.5 were classified as neutral,
and those with mean ratings above 5.5 were classified as pleasant” (Patrick & Lavoro,
1997).
Task.
Each trial was composed of four events: First, instructions (watch or decrease)
appeared centrally for 2 seconds. On “decrease” trials, participants were instructed to
engage in cognitive reappraisal and on “watch” trials participants will be instructed
simply to look at the image and let themselves respond naturally. Second, an aversive
or neutral image will appear centrally for 8 seconds. This duration was selected based
on a recent meta–analysis by Kalisch (2009) that suggests that 8 second image
presentation time ensures examination of one concrete dimension of this
psychological construct (implementation of cognitive reappraisal) (Kalisch, 2009).
While the image remained on the screen, participants performed the evaluation

60
operations specified by the prior instructional cue. Third, a rating scale will appear
immediately after presentation of the image for 4 seconds asking “How negative do
you feel” with a rating from 1 to 5 (1 not at all, 3 moderately, 5 extremely). This
scale will allow participants to rate with a joystick the current strength of their
negative affect and serve as a behavioral index of the success of reappraisal. Fourth,
the transition task of fixation cross for 4 seconds in the center of the screen indicating
that participants should relax until the next trial. Each subject was cued to passively
view or reappraise 48 domain non-specific negative images (24 each) and 48 domain
specific negative images (24 each) in addition to the passive viewing of 24 neutral
images during randomly intermixed trials over 4 MRI scanning runs. Each image was
shown only once for a given participant. Upon completion of the MRI, subjects
returned to the Behavioral Testing room to complete questionnaires.
Prior to data collection.
Upon arrival at the Georgetown University Center for Functional and
Molecular Imaging, participants were escorted to a Behavioral Testing room were
written consent and MRI safety screening were attained. Task instructions consisted
of a scripted training manual designed to provide an overall explanation of the goal of
study, provide a detailed overview of the trial structure, review the instructional cues
and describe the rating approach. During this orientation the investigator read aloud
the manual while the participant followed along.
The subject was instructed that the goal of the study was “We are interested in the biological and brain processes related to mental pressure and toughness. In

61
order to make sense of the pattern of your brain response we need to have a consistent comparison condition. Thus, I am going to train you on a task which we will use as the comparison state but we are really interested in how you respond naturally to these pictures.” Next the subject viewed the trial structure and was read the following description: “You will be given an instructional cue of either “Watch” or “Decrease” (I will describe the instructions in greater depth next). Next you will see a picture. Some of the pictures may prompt emotional experiences; others may seem relatively neutral. You will be asked to rate the image using a joystick (which will also be described next). Lastly you will see a cross in the center of the screen; simply fix your eyes on that cross.” Next the rating instructions were given “After viewing a picture we ask that you rate it. You will be asked “how negative do you feel?” and select the numeric value that applies to how you felt when viewing the image. If you felt in between the three descriptors, please select the appropriate intermediate value. There is no right or wrong answers, so simply respond as honestly as you can.” Then the subject was introduced to the meaning of the watch instruction and shown a sample trial with a picture of an injured player: “Next, I will review the instructional cues. Below I have included one example trial in which the instruction will be “watch”, which means you must simply look at the image and let yourself respond naturally.” The decrease instruction was next reviewed (descriptions taken from previous protocols, e.g., (McRae, Ochsner, Mauss, Gabrieli, & Gross, 2008; Ochsner, et al., 2002): “The second instructional cue is “Decrease.” What you will do when you see this instruction is transform your response or interpretation of the picture so it’s not so negative. There are three ways to do this: 1) Transform the scenario depicted into positive terms; imagine that the situation is not as bad as it appears (e.g., a women crying outside of a church could be interpreted as a woman expressing tears of joy from a wedding ceremony rather than from the sorrow of a funeral); 2) Rationalize or objectify the content of the pictures; view the image from the perspective of a distant, detached observer (e.g., consider a woman with facial bruises could be an actor wearing makeup rather than a victim of domestic abuse); 3) Imagine that things will improve with time (e.g., whatever appears to be bad will resolve over time). This is called cognitive reappraisal. Cognitive means how you think and reappraisal means transforming the meaning.” And then the subjects were shown an example trial (IAPS number 6212): “Here’s a sample trial, and the implementation of all three strategies with this one image. Again you may choose 1 of the 3 strategies during the image viewing period: all are appropriate. 1) The Soldier is clearly not aiming at the child but at his adversary in the distance. The child is running to the safety of his family where he will avoid any harm; 2) Action movie trailer for the latest Special Forces flick; 3) The village will be safe again after the Soldiers remove the threat.” Next participants sat at a desktop computer to practice the task using a duplicate MRI compatible joystick that matched the device used in the MRI

62
environment. Participants were introduced to all elements of the experimental protocol including the initial instructional prompt of “Remember when cued to ‘watch’ respond naturally and when cued to ‘decrease’ engage in cognitive reappraisal (as practiced).” Next the participant viewed two “watch” trials and executed their rating selection. After that, the participant viewed an investigator demonstration of reappraisal using three negative images and again executed their rating selection. The participant was then instructed to overtly engage in reappraisal during the viewing of 6 negative images (3 IAPS and 3 SS) to ensure proper use of the cognitive reappraisal strategy. All training was scored during these self paced sessions using a categorically scoring metric that included the following categories identified in (McRae, et al., 2008): 1) It is not real (e.g., it is just a scene from a movie, they are just pretending); 2) Things will improve with time (e.g., whatever is going wrong will resolve over time); 3) Things are not as bad as they appear to me (e.g., the situation looks worse than it is, it could be a lot worse, at least it’s not me in that situation); 4) Expressive Suppression/ Attention Modulation; 5) Failure to Reappraise.
All subjects performed at/or better than 90% correct for the initial training
session (mean percent correct: 92.14%). The final training session occurred in the
MRI during which the subject viewed 6 reappraisal “decrease’ trials which match the
exact timing of the experiment. The subjects then retrospectively reported all of their
reappraisal strategies such that the training success could be scored based on the
categories mentioned above. All subjects performed at/or better than 90% correct for
the in scanner training session (mean percent correct: 90.91%).
Imaging parameters.
Functional and structural magnetic imaging data were acquired on a 3T
Siemens Magnetom Trio system equipped with gradients suitable for echo-planar
imaging sequences. Thirty-eight axial slices (3.2 mm thick in plane) were acquired
using an echo planar imaging (EPI) pulse interleaved sequence (TR 2000 ms; FOV

63
205; TE 30ms). For the possibility of aligning of the functional data to each subject's
individual anatomy, anatomical images were obtained: a high resolution T1 3D
MPRAGE. Image data were transferred via the network for quantitative analysis and
to magnetic tape for backup.
Dependent Measures.
Psychometric inventories: to characterize population.
Performance Failure Appraisal Inventory (PFAI).
This inventory is a multidimensional measure of cognitive-motivational-
relational appraisals associated with fear of failure (FF). FF was associated with (a)
high levels of worry, somatic anxiety, cognitive disruption, and sport anxiety, and (b)
low levels of optimism. General FF was unrelated to either perceived competence or
fear of success. This measure consists of five questions examining failure appraisal:
1) When I am failing, I am afraid that I might not have enough talent; 2) When I am
failing, it upsets my “plan” for the future; 3) When I am not succeeding, people are
less interested in me; 4) When I am failing, important others are disappointed; 5)
When I am failing, I worry about what others think about me. Subjects are asked to
rate these questions based on the following range: Do Not Believe at All, Believe
50% of the Time, Believe 100% of the Time. To compute the general fear of failure
score all 5 item scores are averaged (Conroy, 2001).

64
State-Trait Anxiety Inventory (STAI).
This is a 40-item self-report index of state and trait anxiety consisting 20 state
items and 20 trait items. The STAI-T consists of 20-items rated on a 4-point scale
ranging from ‘not at all’ to ‘very much so’ in terms of how the participant feels at the
moment. The STAI-T score ranges from 20 to 80, with increasing scores reflecting
greater trait anxiety (Spielberger, et al., 1970).
Dispositional Resilience Scale (DRS).
This inventory is a hardiness measure with 5 items each to measure the
hardiness facets of Commitment, Control, and Challenge. Each question asks how
much you think each one is true for you ranging from 0=Not at all true; 1=A little
true; 2=Quite true; 3=completely true. Six items are negatively-keyed, which makes
this scale quite well-balanced for negative and positive items. Results include raw
scores and percentiles for commitment, control, challenge, and total hardiness
(Bartone et al., 2008).
Sport Competition Anxiety Test (SCAT).
This is a 15-item questionnaire gauging an individual’s tendency to perceive
competitive situations as threatening and to respond to these situations with elevated
state anxiety. Subjects are asked to indicate how they generally feel when they

65
compete in sports and games and respond to each item using a three-point scale
(hardly ever, sometimes and often). Scores on the SCAT range from 10 to 30
(Martens, Vealey, & Burton, 1990).
Beck Depression Inventory (BDI).
This is a 21 item self-report questionnaire evaluating depression symptoms. It
is a widely accepted measure consistent with clinician ratings and other depression
scales based its comparable internal consistency and validity. Each question consists
of 4 statements describing increasing intensities of symptoms of depression.
Questions are rated on a scale from 0–3, reflecting how participants have felt over the
past week. Possible scores range from 0– 48; higher scores reflect more severe
depressive symptomotology. (Beck, Rush, Shaw, & Emery, 1979).
Emotion Regulation Questionnaire (ERQ).
This is a 10-item self-report questionnaire indexing the habitual use of
expressive suppression and cognitive reappraisal. This measure consists of 10
questions, 4 measuring suppression (e.g., ‘I keep my emotions to myself’) and 6
measuring reappraisal (e.g., ‘When I want to feel more negative emotion I change
what I’m thinking about’). Higher scores indicate more frequent use of each strategy.

66
Physiological measures of arousal.
Galvanic skin response.
Skin conductance is measured using the Psylab Stand Alone Monitor through
the application of a small voltage across two electrodes and in turn measures the
current that flows between the electrode locations. Electrode placement is constrained
to sites unique to eccrine sweating, which, is related to mental processes and
exclusively under sympathetic control. Electrodes were placed on medial phalanges
on left index and middle fingers. The skin conductance data were recorded
continuously at a rate of 25 samples per second. Off-line analysis of skin conductance
response waveforms using a local peak-detection algorithm was used to compute
stimulus-related skin conductance responses defined as trough-to-peak conductance
differences greater than 3.1 micro Siemens occurring within 100 second windows to
minimize transition points. The amplitude of the largest skin conductance response
associated with each stimulus (skin conductance response magnitude) was used as an
index of the subject’s maximum arousal during that stimulus (if no skin conductance
response was detected, amplitude was considered to be 0) (Butler, et al., 2007). Skin
conductance response were then co-registered with viewing time by examining time
windows 0.5 s to 12 s following stimulus onset (Butler, et al., 2007). The skin
conductance responses were then averaged within the cognitive reappraisal SS, IAPS,
passive negative SS, IAPS, passive neutral conditions for each subject.

67
Heart rate.
HR was measured using the Invivo cart (3150 MRI) using the 4-in-1
Quadtrode® MRI ECG Electrode placed on the subject’s left side, below the left
pectoral, on the bottom of the ribcage. As a secondary measure, we used a pulse
oximeter on the left thumb of the participant in case the ECG recording became
disrupted due to the MRI gradients. HR was then co-registered with viewing time (8
s) and then averaged within the cognitive reappraisal SS, IAPS, passive negative SS,
IAPS, passive neutral conditions for each subject.
Behavioral measures - affective rating.
Mean negative affect ratings will be calculated for the passive negative (SS
and IAPS), passive neutral, and cognitive reappraisal (SS and IAPS) conditions for
“How Negative Do You Feel?” (1= not at all, 3=moderately, 5=extremely).
Functional Magnetic Resonance Imaging: BOLD Signal.
The DICOM images were extracted and imported into the signal processing
software for preprocessing (e.g., Statistical Parametric Mapping, SPM5). Slice timing
correction was followed by correction for head motion during scanning (through the
registration of the time series to the reference first scan). The motion parameters were
saved for later statistical analysis to be used as regressors in the design matrix. This

68
step was followed by creating binary mask so that voxels outside of the brain are
removed. For statistical comparisons to be made across subjects, the data were
normalized into MNI format (template EPI.mni) in order to account for variability in
brain shape and size. Default SPM5 settings were used to warp volumetric MRIs to fit
the standardized template (16 nonlinear iterations), and normalization parameters
were applied to subject’s functional images. Normalized images were resampled into
2 × 2 × 2 mm voxels. Then, a spatial smoothing of the images was performed by
employing a low pass spatial filter which remove high frequency spatial components
resulting in the ‘blur’ of the images (Huettel, Song, & McCarthy, 2003). The
Gaussian filter of 6mm (the width is determined by half of the maximum value, Full-
Width-Half-Maximum, FWHM) essentially acted to spread the intensity of each
voxel in the image to neighboring voxels serving to maximize the signal to noise ratio
and reducing false positives in the later statistical analysis (Huettel, et al., 2003).
Statistical Analysis.
Psychometric inventories: to characterize population.
For the PFAI, STAI, DRS, SCA, BDI and ERQ, mean and standard deviations
for each item were computed. Group comparisons were tested using a paired t-test.

69
Physiological measures of arousal.
Galvanic skin response.
Two way ANOVA (2 x 5) Group (control, football) by Condition (cognitive
reappraisal SS, passive negative SS, cognitive reappraisal IAPS, passive negative
IAPS, passive neutral) was executed. Tukey’s post-hoc tests were employed to
examine all possible comparisons.
Heart rate.
Two way ANOVA (2 x 5) Group (control, football) by Condition (cognitive
reappraisal SS, passive negative SS, cognitive reappraisal IAPS, passive negative
IAPS, passive neutral) was executed. Tukey’s post-hoc tests were employed to
examine all possible comparisons.
Behavioral measures - affective rating.
To examine within group effects one way ANOVAs were executed for each
group with Condition as the factor (cognitive reappraisal SS, passive negative SS,
cognitive reappraisal IAPS, passive negative IAPS, passive neutral). Tukey’s post-
hoc tests were employed to examine all possible comparisons.

70
Functional Magnetic Resonance Imaging: BOLD Signal.
Preprocessed images were entered into a General Linear Model in SPM5 that
modeled the canonical hemodynamic response function convolved with an 8-second
boxcar representing the picture-viewing period. Motion parameters, the instructional
cue period, and the rating period were entered into the model as additional regressors.
The General Linear Model (boxcar models representing the picture-viewing period of
each condition) was used to create contrasts for each condition, for each subject, for
each domain. These individual contrasts were then entered into a Full Factorial design
of a 2 x 4 ANOVA Group by Conditions to perform a random-effects group analysis.
The Group factor consisted of Football and Control and the Condition factor
consisting of Cognitive Reappraisal SS, Passive Negative SS, Cognitive Reappraisal
IAPS, and Passive Negative IAPS. Conditions of interests were examined (Cognitive
Reappraisal SS, Passive Negative SS, Cognitive Reappraisal IAPS, Passive Negative
IAPS) for each group relative to the neutral baseline. Direct contrasts were computed
between group were executed within each condition (Cognitive Reappraisal SS,
Passive Negative SS, Cognitive Reappraisal IAPS, Passive Negative IAPS). Direct
comparisons between groups were reported based on whole brain analysis and a priori
region of interest analysis of the prefrontal cortex (BA 8, 9, 10, 11, 45, 46, 47, taken
from the Wake Forest Pick Atlas indication of Brodmann Areas). The ROI analysis
were FDR corrected for multiple comparisons (p<0.05) (marked as *), adjusted for
search volume.

71
Results
Psychometric Inventories to Characterize Population.
Performance Failure Appraisal Inventory (PFAI).
Paired t-test revealed a significant difference between group (p=0.0073) with
football group showing less fear of failure (M=-1; SD=0.66) compared to the control
group (M=-0.11; SD =0.81). (Figure 10)
Figure 10. The PFAI revealed that the football group demonstrated significantly less fear of failure compared to the control group.

72
State-Trait Anxiety Inventory (STAI).
Paired t-test revealed no difference (p=0.9299) in state anxiety between the
football group (M=27.5; SD=6.7) and the control group (M=27.3; SD=5.9). Paired t-
test also revealed no difference (p=0.2041) between trait anxiety with the football
mean of 32.4 (M=32.4; SD=4.2) and the control mean of 35.3 (M=35.3; SD=5.8)
(Figure 11).
Dispositional Resiliency Scale (DRS).
The paired t-test revealed no difference (p=0.2851) between the control group
(M=34; SD=4) and the football group (M=36; SD=4). The control group was in the
87.7 percentile for total hardiness and the football group was in the 94.2 percentile for
total hardiness (Figure 11).
Sports Competition Anxiety Test (SCAT).
The paired t-test revealed no difference (p=0.885) between the groups with the
control group mean score of 18 (M=18; SD=4) and the football mean score of 18
(M=18; SD=5) (Figure 11).

73
.
Figure 11. Self report results from psychometric inventories. The control group and football group were statistically equivalent on STAI State (A) STAI Trait (B); DRS (C); SCAT (D); BDI (E); ERQ (F).
Beck Depression Inventory (BDI).
The paired t-test revealed no significant difference between group p=0.2512
with the control group mean of 5 (M=5; SD=5) and the football group mean of 3
(M=3; SD=3) (Figure 11).

74
Emotion Regulation Questionnaire (ERQ).
Paired t-tests between group revealed no difference (p=0.6793) between
expressive suppression (Football: M=14; SD=4. Control M=15; SD=3) and no
difference (p=0.2996) between cognitive reappraisal (Football M=32; SD=3. Control
M=30; SD=6). Both groups scored higher on cognitive reappraisal compared to
expressive suppression (Figure 11).
Physiological Measures of Arousal.
Exploratory results from HR and GSR. Datasets were incomplete due to
technical problems with the recording devices (i.e., only 3 control subjects were
recorded for HR).
Galvanic skin response.
A two way ANOVA (Group x Condition) revealed no significant difference
between group or within condition (Condition main effect p=0.089; Group x
Condition interaction p=0.31) (Figure 12).

75
Heart rate.
A two way ANOVA (Group x Condition) revealed no significant difference
between group or within condition (Condition main effect p=0.544; Group x
Condition interaction p=0.273) (Figure 12).
Figure 12. Exploratory results from HR and GSR. Datasets were incomplete due to technical problems with the recording devices (i.e., only 3 control subjects were recorded for HR). Results reveal no significant differences 1) Condition Main Effect: HR: p=0.544; GSR: p=0.089. 2) Group x Condition: HR: p=0.273; GSR: p=0.31.

76
Behavioral Measures- Affective Rating.
Separate 1 way ANOVAs revealed significant main effects for Condition for
each group. The control group (p<0.001) Tukey’s HSD post-hoc analysis revealed
significant differences between all conditions. This indicates that during cued
cognitive reappraisal of SS images (M=1.89; SE=0.19) these affective effects were
perceived as significantly less negative than during the nature response to SS image
(M=2.72; SE=0.25). In addition the cognitive reappraisal of IAPS images (M=1.60;
SE=0.17) were perceived less negative compared to the nature response to IAPS
images (M= 3.2; SE=0.23). Lastly the neutral images were rated significantly less
negative (M=1.42; SE=0.13) compared to the negative IAPS and SS images. The
football group (p=0.001) Tukey’s HSD post-hoc analysis revealed that the passive
viewing of negative SS images (M=2.46; SE=0.24) was significantly more negative
than viewing neutral images (M=1.28; SE=0.12). In addition the cognitive reappraisal
of IAPS images (M=1.65; SE=0.16) was significantly less negative than the passive
viewing of IAPS (M=2.69; SE=0.22) images but more negative than viewing the
neutral images (M=1.28; SE=0.12). The cognitive reappraisal of SS images (M=1.97;
SE=0.19) was rated statistically equal to the natural response of viewing SS negative
images (M=2.46; SE=0.24) (Figure 13).

77
Figure 13. Self report scores from Affective Ratings of “How Negative Do You Feel?” (1=not at all, 3 moderately, 5 extremely) from separate one-way ANOVAs. The control group (left panel) rating of each condition was significantly different. The football group (right panel) rated the cognitive reappraisal of SS images and the passive response to SS images statistically equal, whereas as the generalized images (IAPS) were rated differently. CR-SS: Cognitive Reappraisal of SS Images; PN-SS: Passive (viewing of) Negative of SS Images; CR-IAPS: Cognitive Reappraisal of IAPS Images; PN-IAPS: Passive (viewing of) Negative of IAPS Images; PNEut: Passive (viewing of) Neutral of IAPS Images.
Functional Magnetic Resonance Imaging Results: BOLD Reponses.
The first step of the analysis revealed multiple significant regions in the
comparisons of the different conditions relative to the neutral baseline. Multiple
comparison corrections of the whole brain analysis were done using Family Wise
Error (FWE) thresholded at p<0.05 (marked as **) and False Detection Rate (FDR)
corrected at p<0.05 (marked as *).
0.00
0.50
1.00
1.50
2.00
2.50
3.00
3.50
4.00
CR
-SS
CR
-IA
PS
PN-S
S
PN-I
APS
PNeu
t.
CR
-SS
CR
-IA
PS
PN-S
S
PN-I
APS
PNeu
t.
Self
Rep
ort S
core
s
Control Football
** ****

78
Comparative (Football vs. Control) descriptive pattern of BOLD response during passive viewing of negative Sport-Specific images.
Visual inspection of the results during the natural response of the football
group and control group to SS negative images revealed less activation in the
prefrontal cortex in the elite athlete. Interestingly the efficiency of the football players
is not only manifested as reduced activation (relative to the control group) but also
different spatial patterns: left IFG (versus bilateral IFG in control), lateral OFC
(versus medial OFC in control). Greater efficiency of response was evident in the
premotor cortex and temporal regions but was less apparent in the parietal lobe where
both groups appeared to show shared and distinct bilateral activation. The occipital
areas appeared almost completely overlapped with the football group showing greater
activation than the control group in specific regions (Figure 14, Table 2).
Football.
The results indicate that during passive viewing of SS images, the football
group showed significant activation in the left DMPFC (BA 8), left insula (BA 13),
right lingual gyrus (BA 18), left DLPFC (BA 9), bilateral parahippocampal gyrus
(BA 27), left IFG (BA 47), bilateral premotor cortex (BA 6), bilateral
SPL/precuneous (BA 7), left postcentral gyrus (BA 2), and left thalamus. In addition,
the bilateral ITG (BA 20), the right STG (BA 38), the right lateral OFC (BA11), the
left putamen and the bilateral VMPFC (BA 10) were active with a FDR p<0.05
threshold (Figure 14, Table 2).
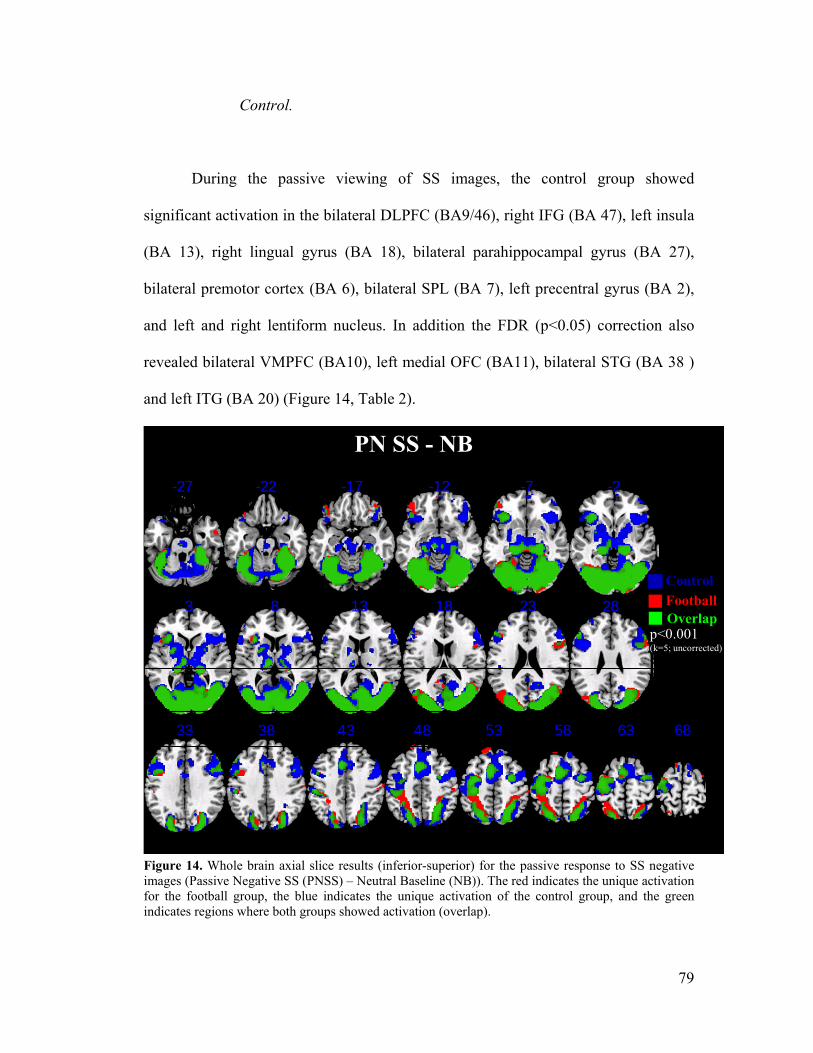
79
Control.
During the passive viewing of SS images, the control group showed
significant activation in the bilateral DLPFC (BA9/46), right IFG (BA 47), left insula
(BA 13), right lingual gyrus (BA 18), bilateral parahippocampal gyrus (BA 27),
bilateral premotor cortex (BA 6), bilateral SPL (BA 7), left precentral gyrus (BA 2),
and left and right lentiform nucleus. In addition the FDR (p<0.05) correction also
revealed bilateral VMPFC (BA10), left medial OFC (BA11), bilateral STG (BA 38 )
and left ITG (BA 20) (Figure 14, Table 2).
FootballOverlap
p<0.001(k=5; uncorrected)
PN SS - NB
Control
Figure 14. Whole brain axial slice results (inferior-superior) for the passive response to SS negative images (Passive Negative SS (PNSS) – Neutral Baseline (NB)). The red indicates the unique activation for the football group, the blue indicates the unique activation of the control group, and the green indicates regions where both groups showed activation (overlap).

80
Table 2. Whole brain results for the passive response to SS negative images (Passive Negative SS (PNSS) – Neutral Baseline (NB)). Top panel: football group. Bottom panel: control group. Multiple comparison corrections of the whole brain analysis were done using Family Wise Error (FWE) thresholded at p<0.05 (marked as **) and False Detection Rate (FDR) corrected at p<0.05 (marked as *).
Comparative (Football vs. Control) descriptive pattern of BOLD response during passive viewing of negative IAPS images.
This economy of processing extends to the natural response of the football
group to generalized negative images (IAPS). Visual examination of the prefrontal
cortex revealed less activation extending from the inferior frontal gyrus to the dorsal
prefrontal cortex (both lateral and medial regions) compared to the control group.
More posterior patterns of economy were evident to a lesser extent in the premotor
cortex, temporal lobe and occipital regions but the magnitude of efficiency was less
apparent than in the prefrontal cortex. The parietal cortex revealed more unique
Volume in Voxels MNI coordinates x, y, z t values Volume in Voxels MNI coordinates x, y, z t values
DLPFC 9 4 -38 4 36 5.07**
DMPFC 8 16 -16 42 54 5.59**VMPFC 10 166 -2 60 -10 3.62* 18 8 68 12 2.66*
IFG 47 1 -38 22 -2 4.88**LOFC 11 210 44 46 -16 4.65*
INSULA 13 13 -32 24 -2 5.09**Precentral Gyrus 4 12 -38 -16 60 5.05**Premotor Cortex 6 194 -6 4 58 7.63** 29 30 -6 56 5.71**
ITG 20 71 -34 -2 -42 3.43* 10 36 -4 -42 2.79*STG 38 5 36 6 -44 2.55*
Postcentral Gyrus 2 1 -50 -26 42 4.91**SPL/precuneous 7 114 -18 -66 52 6.22** 192 26 -54 52 5.85**Lingual Gyrus 18 15607 18 -82 -14 16.2**
Parahippocampal Gyrus 27 199 -20 -30 -2 10.04** 259 20 -32 -2 9.61**Putamen -- 376 -26 2 4 4.37*Thalamus -- 11 -8 -20 6 5.07**
DLPFC 46 33 -52 28 28 5.76** 127 58 30 18 6.65**
DLPFC 9 110 -44 12 32 5.96** 169 48 6 34 6.1**VMPFC 10 3 -4 64 30 2.19* 633 4 60 -8 4.14*
IFG 47 154 40 22 -8 5.49**MOFC 11 26 -2 40 -24 3.66*
INSULA 13 186 -30 24 2 6.22**Premotor 6 780 -4 6 54 9.38** 221 30 -6 56 6.54**
STG 38 5 -46 12 -42 2.15* 47 40 16 -38 3.87*ITG 20 7 -36 -6 -38 2.24*
Postcentral Gyrus 2 20 -52 -26 42 5.5**SPL/precuneous 7 183 -22 -66 56 6.01** 12 14 -82 52 5.29**
MOG 18 19296 16 -94 20 16.94**Lentiform Nucleus -- 14 -16 6 2 5.21** 13 16 -2 0 5.11**
Parahippocampal Gyrus 27 967 -20 -30 -2 12.76** 832 20 -30 -2 10.96**
Left RightGroup Contrast Conditions Region BA
PNSS - NB
FO
OT
BA
LL
PNSS -NB
CO
NT
RO
L

81
patterns for each group, with the football group showing more bilateral activation
while the control group appearing primarily left lateralized (Figure 15, Table 3).
Football.
The results revealed that during the natural response of the football group to
generalized negative images (IAPS) significant signal change was observed in the
bilateral superior parietal lobule (BA 7), right lingual gyrus (BA 18), bilateral
parahippocampal gyrus (BA 27), bilateral premotor cortex (BA 6), right cerebellum
and right MTG. In addition the left DLPFC (BA 9), left IFG (BA 47), left DMPFC
(BA 8), left VLPFC (BA10), bilateral lateral OFC (BA11) and STG (BA 38) were
active during the FDR multiple comparison correction (p<0.05) (Figure 15, Table 3).
Control.
In the control group significant activation was observed in the bilateral
DLPFC (BA 46/9), left DMPFC (BA 8), left IFG (BA 47), right MOG (BA 18), right
OFC (BA 11), right ACC (BA 24), bilateral premotor cortex (BA 6), left SPL (BA 7)
right lentiform nucleaus and right postcentral gyrus (BA 2). In addition the left
VLPFC (BA 10), the left medial OFC (BA 11), the right STG (BA 22), left ITG (BA
20), and right MTG (BA 21) were active under a FDR multiple comparison correction
(p <0.05) (Figure 15, Table 3).

82
PN IAPS- NB
FootballOverlap
p<0.001(k=5; uncorrected)
Control
Figure 15. Whole brain axial slice results (inferior-superior) for the passive response to International Affective Picture System negative images (Passive Negative IAPS (PN IAPS) – Neutral Baseline (NB)). The red indicates the unique activation for the football group, the blue indicates the unique activation of the control group, and the green indicates regions where both groups showed activation (overlap).
Table 3. Whole brain results for the passive response to International Affective Picture System negative images (Passive Negative IAPS (PNIAPS) – Neutral Baseline (NB)). Top panel: football group. Bottom panel: control group. Multiple comparison corrections of the whole brain analysis were
Volume in Voxels MNI coordinates x, y, z t values Volume in Voxels MNI coordinates x, y, z t values
DLPFC 9 185 -38 4 36 3.61*
DMPFC 8 75 -16 52 46 3.58*VLPFC 10 41 -20 60 -4 3.18*
IFG 47 1527 -48 26 -10 4.58*LOFC 11 42 -46 44 -10 4.08* 46 42 42 -18 3.49*
Premotor Cortex 6 74 -6 4 58 6.89** 8 30 -6 56 5.12**MTG 19 40 44 -62 14 5.44**STG 38 116 -32 4 -42 3.13*SPL 7 35 -18 -68 54 5.41** 1 18 -66 56 4.9**
Lingual Gyrus 18 8481 18 -82 -14 11.94**Parahippocampal Gyrus 27 131 -20 -30 -2 8.96** 111 20 -30 -4 6.96**
Cerebellum -- 1 36 -72 -22 5.16**
DLPFC 46 234 -54 28 24 6.78** 530 58 30 18 6.76**
DLPFC 9 331 -44 10 32 7.09** 164 48 6 34 6.04**DLPFC 8 10 -18 48 48 5.16**DMPFC 8 237 -4 36 50 6.4**VLPFC 10 31 -22 54 -12 3.97*
IFG 47 924 -42 28 -6 7.87**LOFC 11 3 40 38 -20 5.18**MOFC 11 46 -4 40 -24 3.79*ACC 24 2 6 0 32 4.96**
Premotor 6 961 -4 6 56 8.87** 186 30 -6 56 6.66**ITG 20 19 -36 -6 -36 2.44*
MTG 21 3 50 -14 -18 2.21*STG 22 15 46 -36 4 2.63*
Postcentral Gyrus 2 12 -52 -26 42 5.23**SPL 7 119 -22 -66 54 5.77**
MOG 18 22511 16 -94 20 15.4**Lentiform Nucleus -- 27 24 6 4 5.17**
FO
OT
BA
LL
PN IAPS - NB
PN IAPS - NB
CO
NT
RO
L
RightGroup Contrast Conditions Region BA
Left

83
done using Family Wise Error (FWE) thresholded at p<0.05 (marked as **) and False Detection Rate (FDR) corrected at p<0.05 (marked as *).
Comparative (Football vs. Control) descriptive pattern of BOLD response during the cued cognitive reappraisal of negative Sport-Specific images.
Examination of the prefrontal cortex during the cued emotion regulation
condition of SS negative events revealed great efficiency in the football group
compared to the control. This anterior economy can be seen not only in terms of
reduced activation (i.e., DMPFC) but also in terms of different spatial patterns such as
the left IFG (compared to bilateral IFG in the control group) and left DLPFC
(compared to bilateral DLPFC in the control group). Visual inspection of posterior
regions suggest more similar processing in occipital and temporal regions with shared
and distinct patterns evident in the posterior parietal regions (Figure 16, Table 4).
Football.
The cued cognitive reappraisal of SS images revealed significant activations
in the left DLPFC (BA 9), right lingual gyrus (BA18), bilateral parahippocampal
gyrus (BA 27), bilateral premotor cortex (BA 6), and bilateral SPL (BA 7) in the
football group. Additionally the FDR correction revealed right lateral OFC (BA 11)
and right medial OFC (BA11), left STG (BA 38), left lentiform nucleus, left MTG
(BA 21), left cerebellum, left STG (BA 22), left VLPFC (BA 10), left supramarginal
gyrus (BA 40), and right postcentral gyrus (BA 3) in the football group (Figure 16,
Table 4).

84
Control.
Activation was observed in the control group in the bilateral DLPFC (BA
46/9), left IFG (BA 47), right cuneus (BA 18), left parahippocampal gyrus, bilateral
premotor cortex (BA 6), bilateral SPL (BA7), bilateral lentiform nucleus, bilateral
STG (BA 38), right motor cortex (BA 4) and bilateral insula (BA 13) (the right side
only survived FDR correction). In addition bilateral medial OFC (BA 11), bilateral
VLPFC (BA 10) and right VMPFC (BA 10), left MTG (BA 21), and left posterior
cingulate (BA 31) were active during FDR correction (p<0.05) in the control group
(Figure 16, Table 4).
Control
FootballOverlap
p<0.001(k=5; uncorrected)
CR SS -NB
Figure 16. Whole brain axial slice results (inferior-superior) for the cued cognitive reappraisal of SS

85
negative images (Cognitive Reappraisal SS (CRSS) – Neutral Baseline (NB)). The red indicates the unique activation for the football group, the blue indicates the unique activation of the control group, and the green indicates regions where both groups showed activation (overlap).
Table 4. Whole brain results for the cued cognitive reappraisal of SS negative images (Cognitive Reappraisal SS (CRSS) – Neutral Baseline (NB)). Top panel: football group. Bottom panel: control group. Multiple comparison corrections of the whole brain analysis were done using Family Wise Error (FWE) thresholded at p<0.05 (marked as **) and False Detection Rate (FDR) corrected at p<0.05 (marked as *).
Comparative (Football vs. Control) descriptive pattern of BOLD response during cued cognitive reappraisal of negative IAPS images.
Visual inspection of the responses of the two groups during cued emotion
regulation of generalized negative images revealed a similar pattern both anteriorly
and posteriorly. This suggests that when elite athletes are asked to cognitively
restructure the meaning of a negative event that is outside their area of experience,
they rely on similar cortical networks to that utilized by age matched controls (Figure
17, Table 5).
Volume in Voxels MNI coordinates x, y, z t values Volume in Voxels MNI coordinates x, y, z t valuesDLPFC 9 11 ‐50 26 38 5.66**
VLPFC 10 2 ‐26 54 ‐12 2.6*
LOFC 11 81 44 46 ‐16 4.02*
MOFC 11 5 2 60 ‐12 2.58*
Premotor Cortex 6 95 ‐6 6 58 7.13** 11 28 ‐4 54 5.22**
MTG 21 35 ‐50 10 ‐38 3.07*
STG 38 95 ‐24 18 ‐26 3.64*
STG 22 12 ‐50 ‐52 18 2.61*
Postcentral Gyrus 3 2 56 ‐20 38 2.38*
SPL 7 44 ‐20 ‐68 52 5.38** 122 18 ‐68 56 5.75**
Supramarginal Gyrus 40 1 ‐48 ‐46 30 2.38*
Lingual Gyrus 18 12463 18 ‐82 ‐14 13.74**
Lentiform Nucleus ‐‐ 172 ‐28 0 2 3.31*
Parahippocampal Gyrus 27 162 ‐20 ‐30 ‐2 9.85** 201 20 ‐30 ‐2 9.1**
Cerebellum ‐‐ 5 0 ‐56 ‐36 2.72*
DLPFC 46 7 ‐54 28 26 5.25** 217 58 28 20 6.06**
DLPFC 9 215 ‐42 12 32 6.33** 7 50 6 36 4.97**
VLPFC 10 11 ‐26 54 ‐12 3.1* 38 56 2 24 3.26*
VMPFC 10 9 10 68 10 2.28*
IFG 47 764 ‐42 28 ‐6 7.81**
MOFC 11 17 ‐4 40 ‐24 2.92* 262 2 60 ‐10 3.78*
Insula 13 73 ‐44 ‐28 24 2.93* 1 36 18 10 4.95**
Precentral Gyrus 4 4 ‐38 ‐18 62 4.94**
Premotor Cortex 6 1356 ‐4 6 56 10.25** 18 42 ‐4 46 5.38**
MTG 21 27 ‐52 ‐12 ‐20 2.64*
STG 38 9 ‐32 18 ‐28 5.28** 3 48 ‐36 2 5.06**
SPL 7 36 ‐22 ‐70 60 5.39** 142 30 ‐54 54 6.35**
Cuneus 18 17332 14 ‐94 20 15.58**
Parahippocampal Gyrus 27 1518 ‐20 ‐30 ‐4 10.45**
Posterior Cingulate 31 16 ‐6 ‐28 46 2.54*
Lentiform Nucleus ‐‐ 93 ‐20 8 2 5.77** 8 16 0 0 4.98**
FO
OT
BA
LL
CRSS ‐ NB
CRSS ‐ NB
CO
NT
RO
L
RightGroup Contrast Conditions Region BA
Left

86
Football.
Cued cognitive reappraisal of generalized negative images (IAPS) resulted in
significant activation of the left DLPFC (BA 46/9), right VLPFC (BA 45), bilateral
lateral OFC (BA 11), right lingual gyrus (BA 18), bilateral premotor cortex (BA 6),
bilateral parahippocampal gyrus (BA 27), left post central gyrus (BA 2), right SPL
(BA 7), and left lentiform nucleus in the football group. In addition the FDR
correction revealed bilateral VMPFC (BA 10), bilateral ITG (BA 20), bilateral
cerebellum, left MTG (BA11), and the left uncus activation in the football group
(Figure 17, Table 5).
Control.
Significant activation in the left DLPFC (BA 9), left DMPFC (BA 8), the right
cerebellum, right SPL (BA 7), left amygdala, bilateral IFG (BA 47), right middle
occipital gyrus (BA18), and bilateral premotor cortex (BA 6) was observed in the
control group during cued reappraisal of IAPS images. In addition bilateral medial
OFC (BA 11), left posterior cingulate (BA31), left supramarginal gyrus (BA 40),
right STG (BA22) and right ITG (BA 20), and left MTG (BA 21) were active after a
FDR correction (p<0.05) (Figure 17, Table 5).

87
FootballOverlap
p<0.001(k=5; uncorrected)
CR IAPS- NB
Control
Figure 17. Whole brain axial slice results (inferior-superior) for the cued cognitive reappraisal of International Affective Picture Sysytem negative images (Cognitive Reappraisal International Affective Picture Sysytem (CR IAPS) – Neutral Baseline (NB)). The red indicates the unique activation for the football group, the blue indicates the unique activation of the control group, and the green indicates regions where both groups showed activation (overlap).

88
Table 5. Whole brain results for the cued cognitive reappraisal to International Affective Picture System negative images (Cognitive Reappraisal IAPS (CRIAPS) – Neutral Baseline (NB)). Top panel: football group. Bottom panel: control group. Multiple comparison corrections of the whole brain analysis were done using Family Wise Error (FWE) thresholded at p<0.05 (marked as **) and False Detection Rate (FDR) corrected at p<0.05 (marked as *).
Direct Comparisons between Groups.
The second step of the analysis determined if the football group demonstrated
relative efficiency compared to the control group. Whole brain direct comparisons
between the groups within each condition revealed significantly greater signal change
in the control compared to the football group. Whole brain analysis was corrected for
multiple comparisons using FDR p<0.05 (marked as *) and for exploratory purposes,
uncorrected regions (p<0.001, k=5) were also be reported (no star is indicated). In
addition a priori region of interest analysis of the prefrontal cortex (BA 8, 9, 10, 11,
45, 46, 47, taken from the Wake Forest Pick Atlas indication of Brodmann Areas)
further support the efficiency hypothesis with elite athletes. The ROI analysis were
Volume in Voxels MNI coordinates x, y, z t values Volume in Voxels MNI coordinates x, y, z t valuesDLPFC 46 245 ‐54 28 26 6.55**
DLPFC 9 62 ‐36 6 36 5.75**
VLPFC 45 2 64 12 20 4.97**
VMPFC 10 15 ‐8 66 28 2.83* 36 26 56 ‐10 3.37*
LOFC 11 1015 ‐46 44 ‐8 6.88** 4 46 44 ‐16 5.29**
Premotor Cortex 6 856 ‐6 6 58 9.59** 12 30 ‐4 56 5.06**
ITG 20 35 ‐34 ‐6 ‐38 2.92* 12 36 ‐4 ‐42 2.82*
MTG 22 8 ‐48 ‐42 4 2.36*
Postcentral Gyrus 2 21 ‐50 ‐26 42 5.62**
SPL 7 73 20 ‐66 56 5.46**
Lingual Gyrus 18 13053 18 ‐82 ‐14 13.73**
Lentiform Nucleus ‐‐ 44 ‐24 2 4 5.38**
Parahippocampal Gyrus 27 290 ‐20 ‐30 ‐2 8.96** 138 20 ‐30 ‐2 7.74**
Uncus ‐‐ 2 ‐22 0 ‐30 2.24*
Cerebellum ‐‐ 5 ‐18 ‐24 ‐28 2.37* 10 2 ‐56 ‐36 2.85*
DLPFC 9 64 ‐30 46 26 5.96**
DMPFC 8 11 ‐18 48 44 5.07**
IFG 47 3739 ‐42 30 ‐6 10.3** 547 48 24 ‐12 6.77**
MOFC 11 12 ‐4 40 ‐24 2.83* 97 4 60 ‐10 3.37*
Premotor 6 2252 ‐4 6 56 11.43** 28 30 ‐6 56 5.6**
ITG 20 1 32 ‐2 ‐40 2.1*
MTG 21 7 ‐52 ‐12 ‐20 2.29*
STG 22 276 48 ‐36 2 4.84*
SPL 7 104 30 ‐54 54 6.22**
Supramarginal gyrus 40 29 ‐50 ‐46 28 2.45*
MOG 18 18923 16 ‐94 20 14.7**
Posterior Cingulate 31 ‐8 ‐28 46 2.82*
Amygdala ‐‐ 32 ‐20 ‐4 ‐18 5.77**
Cerebellum ‐‐ 3 4 ‐72 ‐30 5.02**
FO
OT
BA
LL
CR IAPS ‐ NB
CR IAPS - NB
CO
NT
RO
L
Group Contrast Conditions Region BALeft Right
89
FDR corrected for multiple comparisons (p <0.05) (marked as *), adjusted for search
volume.
Passive negative SS condition.
Whole brain CONT-FB.
The whole brain direct comparisons between the control group minus the
football group revealed that for passive viewing of SS negative images, the control
group demonstrates greater activation in the right MOG (BA 18), right premotor
cortex (BA 6), bilateral cerebellum, bilateral DLPFC (BA9/8), right VLPFC (BA 10),
bilateral VMPFC (BA 10), bilateral lingual gyrus, left ACC (BA 24), right insula
(BA13), right MTG (BA 21) and right thalamus (p<0.001; k=5, uncorrected) (Figure
18, Table 6).
ROI CONT-FB.
The ROI analysis revealed bilateral DLPFC (BA 9), bilateral DMPFC (BA
9/8), right VLPFC (BA 10), bilateral VMPFC (BA 10), and right IFG (BA 47) (FDR
p<0.05 corrected) was significantly more active for the control group compared to the
football group (Figure 18, Table 6).

90
Whole brain FB-CONT.
Whole brain analysis comparing the football group to the control group
revealed activation in the right MOG (BA 18) and left MTG (BA 39) at an
uncorrected threshold of p<0.001 k=5 (Figure 18, Table 6).
ROI FB-CONT.
The ROI analysis revealed no significantly greater BOLD signal in the
football group compared the control group in the prefrontal cortex (Figure 18, Table
6).

91
PN SS
CT - FB
FB - CTp<0.0001(k=5; uncorrected)
CT: Control; FB: Football
Figure 18. Whole brain axial slice results (inferior-superior) from direct comparisons between groups during the passive response to SS images condition (Passive Negative SS (PNSS)). The orange indicates contrast results from Control – Football (CT-FB). The blue indicates contrasts results from Football- Control (FB-CT).
Table 6. Results from direct comparisons between groups during the passive response to SS images condition (Passive Negative SS (PNSS)). Top panel indicates contrast results from Control – Football (CONT-FB). Bottom panel indicates contrasts results from Football- Control (FB-CONT). Whole brain analysis were corrected for multiple comparisons using FDR p<0.05 (marked as *) and for exploratory purposes, uncorrected regions (p<0.001, k=5) will also be reported (no star is indicated). Red text signifies results from region of interest analysis (ROI) derived from Wake Forest anatomical
Volume in Voxels MNI coordinates x, y, z t values Volume in Voxels MNI coordinates x, y, z t valuesDLPFC 9 29 -28 32 38 4.15* 50 30 36 40 4.19*
DLPFC 8 14 30 36 44 3.76*DMPFC 9 2 -2 44 22 3.25*DMPFC 8 18 -2 34 50 3.67* 52 8 36 52 4.4*VLPFC 10 71 28 58 20 4.11*VMPFC 10 19 -2 54 4 3.69* 13 2 56 0 3.7*
IFG 47 14 54 20 -4 3.53*DLPFC 9 131 -28 34 38 4.2DLPFC 8 439 30 36 40 4.19VLPFC 10 143 28 58 20 4.11VMPFC 10 59 0 54 2 3.8
ACC 24 11 -2 54 2 3.63Premotor 6 212 8 34 54 4.57
Insula 13 83 36 20 12 3.58MTG 21 25 58 -36 -2 3.46
Lingual Gyrus 17 43 -6 -96 -2 4.01 61 8 -70 4 3.89MOG 18 102 38 -84 4 4.61
Thalamus -- 5 22 -26 6 3.33Cerebellum -- 152 -22 -74 -16 4.55 91 12 -62 -30 4.09
IOG 18 131 24 -90 -12 4.1
MTG 39 237 -46 -80 28 3.61
Left Right
PNSS [CONT - FB]
PNSS [FB - CONT]
Contrast Conditions Region BA

92
mask. The ROI analysis were FDR corrected for multiple comparisons (p <0.05) (marked as *), adjusted for search volume.
Passive negative IAPS condition.
Whole brain CONT-FB.
The whole brain analysis revealed that the control group demonstrated
significantly greater activation in the right premotor cortex (BA 6), bilateral MOG
(BA 18), bilateral cerebellum, bilateral DLPFC (BA 9/46), bilateral lingual gyrus (BA
18/17), bilateral STG (BA22/38), bilateral claustrum, right caudate, bilateral ACC,
the right insula (uncorrected p<0.001; k=5), left and left parahippocampal gyrus (all
regions survive FDR p<0.05 correction unless noted otherwise) (Figure 19, Table 7).
ROI CONT-FB.
The ROI analysis revealed significant activation in the bilateral DLPFC (BA
46/9), bilateral DMPFC (BA 8/9), right VLPFC (BA 10/45), bilateral VMPFC (BA
10), medial OFC (BA 11), and right IFG (BA 47) in the control group compared to
the football group (Figure 19, Table 7).
Whole brain FB-CONT.
Whole brain analysis comparing the football group to the control group
revealed activation in the left SOG (BA 19) at an uncorrected threshold of p<0.001;
k=5 (Figure 19, Table 7).

93
ROI FB-CONT.
The ROI analysis revealed no significantly greater BOLD signal in the
football group compared the control group in the prefrontal cortex (Figure 19, Table
7).
PN IAPS
CT - FB
FB - CTp<0.0001(k=5; uncorrected)
CT: Control; FB: Football
Figure 19. Whole brain axial slice results (inferior-superior) from direct comparisons between groups during the passive response to International Affective Picture System negative images condition (Passive Negative IAPS (PN IAPS)). The orange indicates contrast results from Control – Football (CT-FB). The blue indicates contrasts results from Football- Control (FB-CT).

94
Table 7. Results from direct comparisons between groups during the passive response to International Affective Picture System negative images condition (Passive Negative IAPS (PNIAPS)). Top panel indicates contrast results from Control – Football (CONT-FB). Bottom panel indicates contrasts results from Football- Control (FB-CONT). Whole brain analysis were corrected for multiple comparisons using FDR p<0.05 (marked as *) and for exploratory purposes, uncorrected regions (p<0.001, k=5) will also be reported (no star is indicated). Red text signifies results from region of interest analysis (ROI) derived from Wake Forest anatomical mask. The ROI analysis were FDR corrected for multiple comparisons (p<0.05) (marked as *), adjusted for search volume.
Cognitive reappraisal SS conditions.
Whole brain CONT-FB.
The whole brain analysis of cued cognitive reappraisal of SS negative images
revealed greater activation in the right MTG (BA 22) (FDR corrected), right premotor
cortex (BA 6), left cerebellum, right MOG (BA 19), right insula (BA 13), left lingual
gyrus (BA 18), and right lentiform nucleus (p <0.001 uncorrected, k =5) in the control
group compared to the football group (Figure 20, Table 8).
Volume in Voxels MNI coordinates x, y, z t values Volume in Voxels MNI coordinates x, y, z t values
DLPFC 46 6 -50 38 20 3.5* 16 58 30 18 3.76*
DLPFC 9 34 -30 32 38 4.38* 51 30 36 30 3.91*DLPFC 8 3 -54 12 42 3.6* 25 30 38 44 3.43*DMPFC 9 69 -2 48 24 3.67* 11 4 46 38 3.33*DMPFC 8 101 -4 36 50 4.34* 100 8 36 52 4.79*VLPFC 10 46 30 56 20 3.79*VLPFC 45 4 58 28 20 3.63*VMPFC 10 86 -4 54 6 3.92* 23 2 56 4 3.72*
IFG 47 23 24 12 -18 3.61*MOFC 11 10 -4 36 -18 3.43*DLPFC 9 245 -30 32 38 4.38*DLPFC 46 13 -50 38 20 3.5* 35 58 30 18 3.76*
ACC -- 10 -2 54 2 3.63* 8 2 56 2 3.67*ACC 32/24 73 -16 16 32 3.76* 10 2 0 34 3.49*
Premotor 6 1711 10 36 54 5.07*Insula -- 21 30 18 -2 3.52STG 22/38 17 -24 6 -24 3.7* 73 48 -36 2 4.15*
Lingual Gyrus 18/17 49 -6 -96 -2 3.92* 62 8 -86 -6 4.23*MOG 18 58 -36 -92 2 3.97* 200 38 -84 4 4.8*
Caudate -- 83 6 8 14 3.68*Claustrum -- 74 -22 22 6 3.55* 230 28 16 0 3.85*
Parahippocampal Gyrus 28 10 -18 -20 -18 3.4*Cerebellum -- 91 -22 -74 -16 4.44* 17 10 -62 -10 3.49*
PN IAPS [FB - CONT] SOG 19 298 -44 -80 32 3.07
Contrast Conditions Region BALeft Right
PN IAPS [CONT - FB]

95
ROI CONT-FB.
The ROI analysis revealed significant activation in the bilateral DLPFC (BA
9), bilateral DMPFC (BA 9/8), bilateral VLPFC (BA 10/45) and bilateral IFG (BA
47) in the control group compared to the football group (FDR corrected p<0.05)
(Figure 20, Table 8).
Whole brain FB-CONT.
Whole brain analysis comparing the football group to the control group
revealed activation in the right IOG (BA 18) and left MTG (BA 39) at an
uncorrected threshold of p<0.001 k=5 (Figure 20, Table 8).
ROI FB-CONT.
The ROI analysis revealed no significantly greater BOLD signal in the
football group compared the control group in the prefrontal cortex (Figure 20, Table
8).

96
CT - FB
FB - CTp<0.0001(k=5; uncorrected)
CR SS
CT: Control; FB: Football
Figure 20. Whole brain axial slice results (inferior-superior) from direct comparisons between groups during the cued cognitive reappraisal of SS negative images condition (Cognitive Reappraisal SS (CR SS)). The orange indicates contrast results from Control – Football (CT-FB). The blue indicates contrasts results from Football- Control (FB-CT).
Table 8. Results from direct comparisons between groups during the cued cognitive reappraisal of SS negative images condition (Cognitive Reappraisal SS (CR SS)). Top panel indicates contrast results from Control – Football (CONT-FB). Bottom panel indicates contrasts results from Football- Control (FB-CONT). Whole brain analysis were corrected for multiple comparisons using FDR p<0.05 (marked as *) and for exploratory purposes, uncorrected regions (p<0.001, k=5) will also be reported (no star is indicated). Red text signifies results from region of interest analysis (ROI) derived from Wake Forest anatomical mask. The ROI analysis were FDR corrected for multiple comparisons (p <0.05) (marked as *), adjusted for search volume.
Volume in Voxels MNI coordinates x, y, z t values Volume in Voxels MNI coordinates x, y, z t valuesDLPFC 9 4 -30 42 32 3.59* 48 26 50 40 3.72*DMPFC 9 10 16 60 32 3.31*DMPFC 8 20 -2 30 56 3.63* 35 8 36 52 4.15*VLPFC 10 2 -28 44 30 3.44* 58 30 56 20 3.84*VLPFC 45 13 60 22 14 3.46*
IFG 47 10 -52 20 -8 3.59* 17 54 20 -4 3.51*Premotor 6 150 6 34 54 4.25
Insula 13 33 36 18 12 3.96MTG 22 238 52 -36 0 5.44*
Lingual Gyrus 18 12 -12 -74 4 3.64MOG 19 65 38 -84 6 4.24
Lentiform Nucleus -- 12 22 8 -12 3.33Cerebellum -- 60 -24 -72 -16 4.24
IOG 18 123 24 -90 -12 3.65
MTG 39 319 -46 -80 28 3.24
RightContrast Conditions Region BA
Left
CRSS [CONT - FB]
CRSS [CONT - FB]

97
Cognitive reappraisal IAPS condition.
Whole brain CONT-FB.
During the cued cognitive reappraisal of generalized negative images (IAPS),
the whole brain analysis of the control group compared to the football group revealed
left and right (FDR corrected) MTG (BA 22/21), left and right (FDR corrected) MOG
(BA 19), bilateral IFG (BA 47), right premotor cortex (BA 6), left parahippocampal
gyrus, bilateral DLPFC (BA 9), right DMPFC (BA 8), right lingual gyrus, left STG
(BA 38), right pulivinar, and left cerebellum (p<0.001 k=5 uncorrected unless
indicated as FDR corrected) (Figure 21, Table 9).
ROI CONT-FB.
The ROI analysis revealed the bilateral DLPFC (BA 9), bilateral DMPFC (BA
8/9), right VLPFC (BA 45) and bilateral IFG (BA 47) were significantly active in the
control group compared to the football group (FDR corrected p<0.05) (Figure
21,Table 9).
Whole brain FB-CONT.
Whole brain analysis revealed no significantly greater BOLD signal in the
football group compared the control group during cued cognitive reappraisal of IAPS
images (Figure 21, Table 9).

98
ROI FB-CONT.
ROI analysis revealed no significantly greater BOLD signal in the football
group compared the control group during cued cognitive reappraisal of IAPS images
(Figure 21, Table 9).
Figure 21. Whole brain axial slice results (inferior-superior) from direct comparisons between groups during the cued cognitive reappraisal of International Affective Picture System negative images condition (Cognitive Reappraisal IAPS (CRIAPS)). The orange indicates contrast results from Control – Football (CT-FB). The blue indicates contrasts results from Football- Control (FB-CT).
CR IAPS
CT - FBFB - CT
p<0.0001(k=5; uncorrected)
CT: Control; FB: Football

99
Table 9. Results from direct comparisons between groups during cued cognitive reappraisal of International Affective Picture System negative images condition (Cognitive Reappraisal IAPS (CRIAPS)). Top panel indicates contrast results from Control – Football (CONT-FB). Bottom panel indicates contrasts results from Football- Control (FB-CONT); nothing survived the current statistical threshold. Whole brain analysis were corrected for multiple comparisons using FDR p<0.05 (marked as *) and for exploratory purposes, uncorrected regions (p<0.001, k=5) will also be reported (no star is indicated). Red text signifies results from region of interest analysis (ROI) derived from Wake Forest anatomical mask. The ROI analysis were FDR corrected for multiple comparisons (p <0.05) (marked as *), adjusted for search volume.
Discussion
The results overall support the prediction of a greater efficiency of response to
emotional stimuli in elite athletes, suggesting that economy of neural processing
during emotional challenge may contribute to the psychomotor efficiency of expert
performance. The comparative descriptive pattern of the two groups revealed during
the four conditions reveal a tendency of anterior efficiency in the football group with
greater similarity between the groups in posterior regions during three of the four
conditions (the passive response to IAPS and SS and the cued cognitive reappraisal of
SS). The cognitive reappraisal of generalized negative events (IAPS) appears unique
in that the anterior efficiency of the football group is less evident and instead both
Volume in Voxels MNI coordinates x, y, z t values Volume in Voxels MNI coordinates x, y, z t values
DLPFC 9 21 ‐28 36 34 3.94* 27 24 48 42 3.42*
DMPFC 9 1 ‐4 50 42 3.27*
DMPFC 8 18 ‐4 48 44 3.86* 18 10 38 52 3.91*
VLPFC 45 1 56 24 2 3.33*
IFG 47 5 ‐52 20 ‐8 3.46* 7 56 22 ‐2 3.82*
DLPFC 9 169 ‐26 34 34 4.02 75 24 48 46 3.62
DMPFC 8 13 ‐18 44 42 3.51
IFG 47 44 ‐42 32 ‐4 4.19 29 30 22 ‐22 4.04
Premotor 6 144 10 36 54 4.14
MTG 22/21 12 ‐52 16 ‐10 3.49 245 50 ‐36 0 5.66*
STG 38 19 ‐34 18 ‐28 3.63
Lingual Gyrus 18 21 8 ‐86 ‐6 3.82
MOG 19 10 ‐40 ‐92 0 3.47 131 38 ‐84 6 4.54*
Parahippocampal Gyrus 28 122 ‐16 ‐20 ‐20 4.07
Pulivinar ‐‐ 11 24 ‐28 8 3.55
Cerebellum ‐‐ 8 ‐4 ‐34 ‐22 3.46
CR IAPS [FB - CONT] ‐‐ ‐‐ ‐‐ ‐‐ ‐‐ ‐‐ ‐‐ ‐‐
Right
CR IAPS [CONT - FB]
Contrast Conditions Region BALeft

100
groups appear more alike in magnitude of BOLD response. This suggests that
experience may be an important mediator in the processing economy during
emotional events. Independent of instructional cue, the football group appears to be
more efficiency in the prefrontal cortex when challenged with SS negative events.
The economy revealed in the natural response to general negative situations (IAPS)
suggests that the default interpretation of the stress resilient group is similar to that
when challenged with sports relevant negative events. It is only when asked to
reinterpret generalized negative events into more positive terms that the football
group requires greater prefrontal resources, perhaps due to a greater effort.
These findings are consistent with those of previous studies that have reported
that efficiency is a hallmark of skilled individuals. In the motor domain there is
evidence that experts require less neuronal resources compared to novices to
accomplish the same task and that this refinement can be characterized as
psychomotor efficiency (Deeny, et al., 2009; Hatfield et al., 2004; Haufler, et al.,
2000). In addition, efficiency has also been examined in the context of intelligence
(Neubauer & Fink, 2009), affective personality (Gray et al., 2005) and cognitive
performance (Rypma et al., 2006) suggesting that a reduction in processing effort is
an indicator of adaptive engagement. Our results extend this work since they indicate
an efficiency in the emotive domain as revealed by a relative reduction in BOLD
signal in elite athletes during affective challenge. These findings are also
complementary with examinations of other stress resilient groups (elite warfighters)
which have reported more focused neural processing with greater neural resources
directed towards salient information (Paulus et al., 2010). Thus, elite athletes appear

101
to have developed a means of responding to emotion in a manner characterized by an
efficiency of effort utilizing minimal resources.
Direct Group Comparisons.
To validate the neural efficiency revealed by visual inspection a direct
comparison between groups was executed. The results supported an overall efficiency
of processing in the football group compared to the control group. Although we only
predicted this in a specificity context, this economy generalized to all negative events.
Consistent with the overview observations, this efficiency is robustly evident in the
prefrontal cortex but the economy is expressed in all four conditions (rather than just
the SS and the natural response to IAPS) and in selective posterior regions.
Prefrontal Regions of Interest.
A priori ROIs analyses of the prefrontal cortex were executed and supported
the predictions of a greater economy of activation in the football group compared to
the control group. Examination of the DLPFC revealed that the football group
demonstrated greater economy independent of condition. This economy may in part
be related to the psychomotor efficiency developed in elite athletes since the outputs
of the DLPFC are directed to the motor systems and play an essential role in motor
plan representation (Salzman & Fusi, 2010). In addition, the DLPFC is sensitive to
the evaluative aspects of affective valence (Grimm et al., 2006), attention, working

102
memory and cognitive control (Ochsner & Gross, 2008). An economy of processing
during all conditions was also revealed in the DMPFC (Passive Negative IAPS,
Passive Negative SS, Reappraisal IAPS, Reappraisal SS) a region particularly
sensitive to emotional intensity and self-relevant processing (Heinzel et al., 2005;
Northoff et al., 2004; Ochsner et al., 2004; Waugh, Hamilton, & Gotlib, 2010). The
football players furthermore demonstrated greater economy during all conditions in
the VLPFC (Passive Negative IAPS, Passive Negative SS, Reappraisal IAPS,
Reappraisal SS) which is involved in assessing external emotional states, externally
guided behaviors (Yamasaki, LaBar, & McCarthy, 2002) and contributes to the
judgmental control of emotional intensity (Grimm et al., 2006). Economy of
processing was also revealed in the inferior frontal gyrus during all conditions
(Passive Negative IAPS, Passive Negative SS, Reappraisal IAPS, Reappraisal SS).
This region is involved in the assessment of negative events for contextually relevant
emotional cues critical for decision making and also has been reported to be critical to
the successful inhibition of emotional influence during behavior (Beer, Knight, &
D'Esposito, 2006). As such, virtually all of these regions show the same pattern of
greater processing economy with the football group compared to the control group
suggesting neural efficiency in cognitive control regions may be a critical factor that
belies their ability to be consistent in their motor performance.
Examinations of prefrontal regions involved in emotional processes revealed
an attenuated response in the football group compared to the control group. In the
VMPFC, a region involved in emotional arousal, the football group showed less
activation during the natural response conditions (Passive Negative SS, Passive
103
Negative IAPS) (Phan et al., 2003). This region is particularly interesting since it is
not only involved in the regulation of the amygdala (Phelps, Delgado, Nearing, &
LeDoux, 2004) but is a key cortical substrate of negative affective processing
(Carretie, Albert, Lopez-Martin, & Tapia, 2009) and emotional valence (Grimm et al.,
2006). This suggests that resilient group naturally process negative events in an
attenuated manner. Congruent with these findings, the activation in mOFC (Passive
Negative IAPS) was also reduced in the football group compared to the control group
suggesting critical differences in representing affective values and emotional
processing (Kringelbach, 2005). Interestingly, this was only apparent during the
natural response to generalized negative images (IAPS) suggesting that encoding of
affective values may be important to understanding emotional sports-relevant
information.
In summary the refinement of activation in prefrontal cortex indicates that
elite athletes, who have distinguished themselves in high stress performance
situations, process emotional challenge in an efficient manner. To our knowledge, this
is the first time that emotional processing has been evaluated in elite athletes
(although similar elite groups have been examined, i.e., Navy Seals in (Paulus et al.,
2010)) revealing a generalized efficiency in neural processing in a region essential to
executive function and cognitive control (the prefrontal cortex). These findings are
congruent with previous work that has reported prefrontal neural efficiency related to
individual affective personality differences, with more approach (positive) oriented
individuals showing less brain activity during a working memory task than inhibited
individuals (negative) (Gray et al., 2005). Beyond the affective domain, the prefrontal

104
cortex is a region particularly sensitive to motor performance efficiency, showing less
cortical activity during skilled performance and in turn, showing increased neural
activity with increases in reaction time in a speeded processing task (Rypma et al.,
2006). This suggests, in part, that psychomotor efficiency developed by elite athletes
may translate into an overall economy in the prefrontal cortex during emotional
challenge.
Posterior Regions Revealed from Whole Brain Analysis.
The affective economy revealed by the whole brain analysis of the direct
group comparisons extends to regions beyond the prefrontal. In particular, many of
these posterior regions are critical to social cognitive processing (Lieberman, 2007).
This is not surprising given the socially relevant nature of the stimuli used, often
characterizing groups of individuals in aversive situations or demonstrating negative
facial emotion (e.g., coach yelling at player (SS), attack (IAPS)). Thus an informative
manner of interpreting the relative economy of processing seen in the football group
is to examine how these regions may promote adaptive response to aversive
interpersonal situations and assessment of emotive human faces (Koenigsberg et al.,
2010; Pessoa, McKenna, Gutierrez, & Ungerleider, 2002). In a particular regions
where the football group demonstrated greater efficiency extended into the STG
(Passive Negative IAPS, Reappraisal IAPS), and premotor cortex (Passive Negative
IAPS, Reappraisal IAPS, Passive Negative SS) which are involved in social
perception (Lawrence, et al., 2006). This efficiency in social perception is found

105
during generalized negative challenge and during SS challenge. On speculation, this
ubiquitous effect may be related to greater sensitivity to biological motion and goal
directed action (essential attributes for representing the mental states of others, see
(Lieberman, 2007)) as a consequence of athletic aptitude. Congruent with this notion,
the middle temporal gyrus (Reappraisal IAPS, Passive Negative SS, Reappraisal SS),
caudate (Passive Negative IAPS), cerebellum (Passive Negative IAPS, Reappraisal
IAPS, Passive Negative SS) which are crucial to attribute intentions and mental states
to others (theory of mind), were more efficient in elite athletes (Brunet, Sarfati,
Hardy-Bayle, & Decety, 2000). Once again relative processing economy in regions
critical to social cognitive processing generalized to all conditions suggesting elite
athletes have developed ability in understanding how other’s minds operate and
respond to environmental cues, although this is speculation (Lieberman, 2007).
Posterior economy of processing was also revealed in the lingual gyrus, a region
involved in perspective taking, during the natural response to negative events
independent of situation (Passive Negative IAPS, Passive Negative SS) and during
cued emotion regulation of generalized negative situations. Perspective taking is an
essential element of social understanding requiring complex cognitive flexibility and
assessing the self relevance of stimuli (Ruby & Decety, 2003). In addition, the
anterior cingulate cortex demonstrated greater efficiency in the football group during
the natural responses to negative challenge (Passive Negative IAPS, Passive Negative
SS). This midfrontal region is critical to self regulation, sensitive to both reward and
pain, suggesting that the innate response of the resilient group is to manage impulse
and control information from the environment (Posner, Rothbart, Sheese, & Tang,

106
2007). Lastly, efficiency in the middle occipital gyrus (Passive Negative IAPS,
Reappraisal IAPS, Passive Negative SS) indicates an economy in valence dependent
modulation of visual attention (proposed to be mediated by amygdala feedback)
(Pessoa et al., 2002) during the natural response to stressful challenge (independent of
stimulus type) and during generalized instructed regulation. Although speculative,
this response could suggest that the elite athletes may naturally respond less severely
to negative events as indicated by this attenuated attentional response. In summary,
regions of emotive economy were congruent with areas reported to be essential to
social cognition and self regulation (Koenigsberg et al., 2010; Lieberman, 2007).
Characteristics such as social assessment, attention modulation and perspective taking
are congruent with the psychosocial attributes of stress resiliency; suggesting that
individuals engaged in successful sport competition may have developed
generalizable coping acuity to promote adaptive response to all types of stressful
events (Feder et al., 2009; Koenigsberg et al., 2010).
Subcortical Efficiency.
Although the direct comparisons between groups did not demonstrate
significant differences in activation in the amygdala (as was initially predicted), other
regions sensitive to negative affective processing were revealed. The
parahippocampal gyrus (Passive Negative IAPS, Reappraisal IAPS) is a region
modulated by the amygdala, particularly during situations of emotionally arousing
events (Kilpatrick & Cahill, 2003). Contrary to expectations, this economy is only

107
apparent with the generalized negative images. In addition, the football group
demonstrated greater economy in the right insula (Passive Negative IAPS, Passive
Negative SS), a region particularly sensitive to bodily states which contribute to the
experience of an emotion (Straube & Miltner, 2010). Interestingly this efficiency of
processing is apparent during the natural response of the football group to both
generalized and SS negative events suggesting a refinement of processing of body-
related information during their natural response to emotional situations. Thus the
relative efficiency of processing in these regions that are critical to assess affective
intensity implies that the emotional appraisals of stress resilient individuals do not
perceive negative events in the same intensity as age-matched controls.
Football Group Greater Than Control.
Although none of the region survived multiple comparison corrections,
exploratory analysis with a more liberal statistical threshold (p<0.001; k=5 voxels)
revealed greater left MTG (Reappraisal SS, Passive Negative SS) activation for the
football group compared to the control group. A recent meta-analysis reported that
this region is particularly sensitive to discrimination of expressive and emotional
faces (Sabatinelli et al., 2010). This is consistent with the activation revealed in the
inferior occipital gyrus (Reappraisal SS, Passive Negative SS) which is reported to be
a critical region involved in the neural basis of human face perception (Sabatinelli, et
al., 2010). The specificity of this regional activation to SS negative images implies
that football players may be particularly sensitive to emotional facial cues within their

108
domain of expertise. Lastly, the left superior occipital gyrus (Passive Negative IAPS)
is reportedly more involved in implicitly processing of emotional faces (i.e., judgment
of other facial cues such as gender) which is also associated with increased amygdala
involvement (Scheuerecker et al., 2007). This suggests that the football group
demonstrated greater affective attention to generalized negative events, although our
data did not reveal amygdala activation in this group comparison.
Summary.
To account for this generalizability of economy, we examined several
possible explanations. The first, is described as the gravitational hypothesis whereby
individuals are drawn to particular experiences based on compatibility with their
interest, personality, values and abilities (Cox, 2002; Wilk, Desmarais, & Sackett,
1995). This suggests that these individuals demonstrate a ubiquitous economy since
they have innate features which have drawn them to a sport where the management of
stress and stress resiliency is rewarded. Alternatively, the general adaptation
syndrome, predicts that adaptive behavior in response to stressors or challenge is a
consequence of repeated exposure to a stressor, resulting in a systematic adaption that
leads to greater efficiency (Selye, 1975). This suggests individuals facing stressful
challenge (e.g., elite athletes) may have developed adaptive and efficient processing
strategies to enhance emotion regulation and maintain cognitive control of behavior
and that these responses are generalized to domains beyond their developmental
experience. Consistent with this notion, evidence from animal models suggestions

109
that individuals who are exposed to early intermittent stress results in enhanced
arousal regulation and resilience (Lyons, Parker, & Schatzberg, 2010). Specifically,
monkeys who experience intermittent separations from their mothers as infants
demonstrated less behavioral indications of anxiety in adulthood, reduced cortisol,
increased sensitivity to glucocorticoid regulation of the hypothalamic–pituitary–
adrenal axis and greater prefrontal cortex volume compared to monkeys who had not
been separated (Lyons et al., 2010). It is impossible to determine which model may
account for this generalized efficiency but elite athletes may be important groups to
examine when evaluating stress resiliency, particularly in connection with human
motor performance.
Although we can only report that the elite athletes have distinguished
themselves in a challenging competitive environment consistently over time, the
psychosocial attributes of athletes are congruent with characteristics of stress resilient
populations. Qualities such as determined, confident, focused, inspired, and hopeful
are reportedly essential attributes that elite athletes report during their best
performances (Hanin, 2007). Stress resiliency is characterized by facing fears and
active coping, optimism and positive emotions, social competence and support,
purpose in life, and engaging in cognitive restructuring or cognitive reappraisal
(Feder et al., 2009). Our pyschometric results support this view since the football
group reported less fear of failure than the control comparison. This suggests that elite
athletes may serve as important models for understanding stress resiliency both
behaviorally and neurobiologically.

110
In summary, the results argue for a neural efficiency that extends into the
affective and social cognitive domain. Elite athletes demonstrate processing economy
in regions critical to self regulation and management of emotional impulses (Ochsner
& Gross, 2008). Efficiency of affective processing may lead to a greater capacity to
handle stressful events and promote an overall refinement of cortical activity
necessary for successful performance under mental stress. This type of affective
economy also suggests that resilient individuals may utilize cognitive processes
allowing them perceive threatening situations as less stressful by re-evaluating the
aversive evident into more positive terms (Feder et al., 2009). In addition this group
demonstrates efficiency in regions essential to representing the psychological states of
others (Lieberman, 2007). Evidences from military populations also supports this
psychosocial attribute and have revealed that emotional intelligence, characterized as
social awareness of others and their emotions, is a critical trait-like predictor of
leadership and related to hardiness (Bartone, 2008). Thus, a hallmark of stress
resiliency is social competence and the ability to accurately assess the emotional
response of others in social situations may be critical to the qualities related to
successful coping with stress (Feder et al., 2009).
By examining elite athletes we can also learn how emotional information is
processed in a manner than attenuates neuromotor noise and promotes psychomotor
efficiency. In conclusion affective neurobiological activity is intimately linked with
the motivation and informational value of emotional experience which serve to
modulate both cognitive and action tendencies (Izard, 2009). In turn, the interaction
between these constructs supports the notion that a refinement of processing would

111
facilitate the automaticity and ease through which an individual copes during extreme
challenge and hence provide insight into the mechanism that contributes to optimal
performance under pressure.

112
Chapter 6: Review of the Process Model of Emotion Regulation
In addition to the efficiency of emotive processing, we sought to examine the
specificity versus generalizability of stress coping strategies. Specifically, emotion
regulation may be a critical component accounting for the stress resiliency of elite
athletes. Emotion regulation can be generally defined as ‘‘the processes by which
individuals influence which emotions they have, when they have them, and how they
experience and express these emotions’’ (Gross, 1998). Gross and Thompson
describe a process model of emotion regulation whereby there are five principal
means through which to engage in behavior which alters emotional response that are
dependent on the timing of the regulation strategy as critical to its impact and success
(Gross & Thompson, 2007). This section will review all components of the process
model and discuss why cognitive reappraisal is a particularly important strategy to
consider when examining stress resilience.
The first four strategies are antecedent-focused strategies since they moderate
affect early-on or before emotional responses are evoked. The first is situation
selection where action is directed by approaching or avoiding situations (people,
places, objects) in a way that gives rise to the desired emotional state. The second
approach, situation modification involves changing the existing external environment
such that the emotional impact of the chosen situation is altered. The third is
described as attention deployment where distraction and concentration can mediate
the emotional experience. Recently the neural substrates of this particular strategy
have been investigated by McRae and colleagues, who utilizes attentional modulation

113
or distraction during emotional stimulus exposure (McRae et al., 2010). Attention
deployment acts as a filter by limiting the amount of attention given to the event,
thereby resulting in reductions of self reported negativity and stress (McRae et al.,
2010). Selective attention recruits prefrontal and parietal regions involved in
externally focused processing (McRae et al., 2010). The authors found that distraction
produces a reduction in bilateral amygdala and increases in dorsolateral prefrontal
and ACC, in particular, greater activity in right prefrontal areas and parietal regions
consistent with the notion of increased selective attention (McRae et al., 2010). Thus
attentionally demanding tasks act to reduce negative affect since selective attention
acts to limit appraisal of emotional events thus reducing their impact.
The last antecedent focused approach is cognitive change which acts by
altering the meaning of the emotional event. In recent years, special attention has
been devoted to one of these strategies, termed cognitive reappraisal. As stated in the
General Introduction, cognitive reappraisal is a “cognitive-linguistic strategy that
alters the trajectory of emotional responses by reformulating the meaning of a
situation” and has a stereotyped result of decreasing reported negative emotion
(Goldin, et al., 2008; Wager, et al., 2008). The result of reappraisal is that it
attenuates negative emotional experience and behavior resulting in an enhancement in
cognitive control of emotion. Reappraisal is postulated to act through prefrontal
mediation (including areas in dorsomedial prefrontal cortex (DMPFC), ventral lateral
prefrontal cortex (VLPFC) and dorsolateral prefrontal cortex (DLPFC), via the
anterior cingulate cortex (ACC)) of subcortical areas that process affect, thus
changing the experience emotion (Goldin, et al., 2008; Wager, et al., 2008). The

114
ACC, which receives input from premotor, prefrontal and visual, auditory and
somatosensory association areas (Haines, 2006) serves to monitor the success of the
regulation (Ochsner & Gross, 2005). Collectively the ACC and DMPFC serve a
monitoring role to evaluate emotional status during emotion regulation and while the
lateral prefrontal regions exert the cognitive inhibition (Ochsner & Gross, 2008).
Reappraisal thus acts to down regulate multiple sources of emotional evaluation
processing (e.g., amygdala) representing a shift from an emotion system into a more
cognitive system during stimulus appraisal (Ochsner, et al., 2002).
The last emotion regulation strategy of the process model is response
modulation, which is no longer antecendent-focused but instead a response-focused
strategy where affect is moderated after emotion has been expressed (Gross &
Thompson, 2007). In particular, expressive suppression, a technique geared towards
inhibition of emotional responses following affective generation, has been studied
extensively. The consequence of this strategy includes attenuating prepotent facial
emotion behaviors which reduce emotional behavior but maintain emotional
experience. Goldin and colleagues reported that “frequent use of expressive
suppression results in diminished control of emotion, interpersonal functioning,
memory, and well-being and greater depressive symptomatology” (Goldin, et al.,
2008). In addition expressive suppression has been linked to increases sympathetic
arousal and maintained or intensified stress response (Gross, 1998). Although this
strategy results in reduced negative affect and facial behavior, it also results in
increased activity in right insula and right amygdala suggesting a lack of reduction in
emotion-related neural activity. In addition this strategy recruits right VLPFC,

115
DMPFC, DLPFC, and visual-sensory multimodal association (posterior occipito-
temporal lobes), and visual-spatial processing (precuneus and occipital areas)
(Goldin, et al., 2008). In sum this strategy has negative consequences by merely
mildly reducing negative affect, but consuming cognitive resources, such that
executive functions such as memory are also impaired (Gallo, Keil, McCulloch,
Rockstroh, & Gollwitzer, 2009).
Although all the strategies are recruited for the purpose of emotion regulation,
cognitive reappraisal has a beneficial outcome of negative affect reduction, while still
engaging with the negative event (Figure 24). Unlike situation selection, situation
modification andattention deployment, cognitive change (cognitive reappraisal) does
not require manipulation of environment, nor workload or attention modulation, but
still effectively alters affective processing and emotional experience. The response
focused strategy, expressive suppression, focuses on action expression and control of
emotional output and thus is less effective at altering negative affect (Figure 24). As
stated above, certain individuals may have an innate capacity which facilitates their
performance and coping abilities under stress. We sought to examine if through
experience, these individuals may automatically engage in cognitive reappraisal of an
emotional event such that the negative consequences are attenuated, altering the
salient features of affective phenomenology.

116
Chapter 7: Review of the Neuroanatomy Underlying Emotion Regulation
The next sections will review the functional and anatomical areas critical to
emotion regulation. The goal is to overview how each region plays a role in emotion
and cognition and, in turn, can contribute to adaptive responses to stressful events.
Neuroanatomically, the relationship between emotion and cognition can be
characterized by the bidirectional pathways of the prefrontal cortex and the amygdala.
Recent work by Ghashghaei and colleagues explored this synergistic association by
mapping input-output laminar zones through tracer injections into the amygdala of
the rhesus monkey (Ghashghaei et al., 2007). The medial prefrontal areas and
orbitofrontal (OFC) cortex demonstrated the densest connectivity between prefrontal
regions and the amygdala (Figure 25). In particular when investigating the percentage
of input from the amygdala relative to the percentage of output from the prefrontal
cortex, the caudal medial prefrontal cortex (PFC) and medial/caudal OFC exhibited
the heaviest amygdala input, typified by substantial feedback input from the
amygdala (feedback input defined by axonal terminations from the amygdala
terminating in layers 1- upper 3 of the prefrontal cortices). Additionally, another
pattern of higher proportion of output from the prefrontal cortices compared to
amygdala input emerged in the lateral/rostral OFC and rostral medial PFC which also
projects feedforward inhibitory inputs (projection neurons from layers 2-3 in the
prefrontal cortex into the amygdala) into the amygdala (Haines, 2006). The sparest
connection between the prefrontal cortex and amygdala was found in the anterior
lateral prefrontal areas. Interestingly this region has been reported to project into the

117
cingulate gyrus which in turn proved to be the primary inhibitory feedforward input
connection into the amygdala (Ghashghaei et al., 2007).
Amygdala
From a neural perspective, psychological stress and anxiety are mediated by
the limbic system, in particular the amygdala, which is reported to play a central role
in fear and novelty processing (Davidson, 2002). Human lesion studies have indicated
that the amygdala is involved in recognition of facial expression of fear,
trustworthiness of strangers, vocal signal of fear, threat recognition, autonomic fear
conditioning and expression of learned fear response (Davidson, 2002).
Neuroimaging investigations have supported these results, and provide additional
insight into the time course of the amygdala response (Goldin, et al., 2008).
Functional asymmetries of activation may also be present with some studies reporting
right amygdala activation as unconscious emotional processing while left amygdala
activation expresses conscious learned emotion (Davidson, 2002). In addition the
amygdala appears to be a key element in early emotional learning as evident by
amygdala habituation after conditioning (Davidson, 2002). Amygdala activity has
also been linked with novelty detection, mediating motor preparation, focal attention
and enhanced memory encoding (McRae, et al., 2010). The amygdala is connected
with numerous sensory and association cortical areas in addition to the thalamus,
hypothalamus, striatum, and brainstem areas (see figure 26; Haines, 2006). These
projections to the brainstem and hypothalamus act to stimulate the release of
118
catecholamines and glucocorticoids which in turn strengthen amygdala dependent
behaviors such as fear conditioning, and emotional memory (Arnsten, 2009). Thus
management of this critical brain region may be essential to promote psychomotor
efficiency during skilled action execution.
Insula
The insular cortex (Figure 27) is connected directly to sensory cortices and
nuclei with outputs to regions such as motor cortex, the striatum and visual cortex
(Carretie et al., 2009). Neuroimaging results indicate that this regions is active during
pain, fear and threat related events in addition to situations that elicit disgust (Heinzel
et al., 2005). Collectively it has been suggested that the insula acts as a “somatic
marker” for optimal decision making suggesting that affective reactions encoded in
the insular cortex provide information for guiding rational choices (Damasio, 1996).
Recent support for the evaluative qualities of the insula were discussed in a review in
which the authors contend that critical regions involved in the assessment of risks and
response selection include the amygdala, anterior insula, and ventromedial prefrontal
cortex (Carretie et al., 2009). These regions work in concert to evaluate negative
challenges and through their interconnectivity act to modulate the activity of each
other (Carretie et al., 2009). Thus management of emotion may require quiescence of
insular activity during adaptive stress coping.

119
The insular cortex region is also critical to individual differences. Paulus and
colleagues challenged US Navy Seals with an emotional face processing task and
found that independent of affective valence, these elite warfighters showed greater
right sided insula and attenuated left sided insula activation compared toa control
group. In particular the angry faces produced bilateral insula activation, which was
interpreted as greater resource allocation for interoception (Paulus et al., 2010).
Furthermore, Iaria and colleagues evaluated the personality trait of emotional
susceptibility (ES), which is defined as “the tendency to experience feelings of
discomfort, helplessness, inadequacy, and vulnerability after exposure to stimuli with
salient emotional content” (Iaria et al., 2008). Thus, individual with high ES are
typically more susceptive to negative and positive emotions whereas low ES
individuals are typically characterized as clear minded, self confident, and efficient
(Iaria et al., 2008). When viewing negative IAPS images, individuals with high ES
were characterized by bilateral insula activation, whereas individuals with low ES
demonstrated left lateralized insula activation (Iaria et al., 2008). The converging
evidence suggests that the insula is a critical region to examine why individuals
respond differently to the same emotional challenge.

120
Prefrontal Cortex
Lateral Prefrontal Cortex.
The lateral PFC is anatomically divided into Brodmann Areas 10, 9 and 46
and these regions are less differentiated thus having more diffuse projections making
them well suited for top down, hierarchical control (Badre & D'Esposito, 2009).
Studies have consistently shown that cognitive control and emotion regulation
involve primarily lateral prefrontal cortical regions (Goldin, et al., 2008; Ochsner &
Gross, 2008). Interestingly, the lateral prefrontal regions and ACC activity are
negatively correlated with the medial OFC cortex and amygdala activity, consistent
with the directional anatomical connectivity described in the monkey model
(Ghashghaei et al., 2007; Northoff et al., 2000; Ochsner & Gross, 2008). In particular
the DLPFC, and VLPFC have been reported to be essential to negative emotion
reassessment (Wager et al., 2008). The DLPFC mediates representation of goals of
the individual and acts to integrate emotional and cognitive functions (Davidson,
2002). Cognitive engagement may recruit the working memory and executive
function of the lateral prefrontal cortex which may subsequently cause a decrease in
amygdala activity (Ochsner et al., 2004). Additionally, during cognitive engagement,
an emergence of an inverse relationship between lateral and medial prefrontal
structures suggests a dynamic relationship between affective and cognitive regions of
the PFC thus collectively indicating a reciprocal modulation between both limbic and

121
prefrontal affective regions and cognitive lateral prefrontal areas (Northoff et al.,
2004).
Medial Prefrontal Cortex.
The medial prefrontal cortex (VMPFC) may be the neural basis for abstract
represent of reward or punishment which behaviorally shapes action and motivation,
termed by Davidson “affective working memory” (Davidson, 2002). This region can
act in an inhibitory capacity, modulating amygdala, the nucleus accumbens and the
hypothalamus response, guiding decision making and extinction learning (classical
conditioning) (Arnsten, 2009; Phelps et al., 2004). The region is associated with
successful operant fear extinction learning in humans suggesting a critical role in
emotion regulation by acting as a means to appropriately recode stimulus–
reinforcement associations (Finger, Mitchell, Jones, & Blair, 2008). Nonetheless, it
should be noted that the VMPFC is often defined as a continuous part of the medial
OFC in certain studies (e.g. (Carretie et al., 2009; Heinzel et al., 2005) due to
sensitivity of this prefrontal region to negative events. Thus the VMPFC acts not only
to intervene in negative affective assessment, but seems a critical neural substrate of
negative event evaluation (Carretie et al., 2009; Phan et al., 2003).
The dorsomedial prefrontal cortex (DMPFC) is reported involved in a range
of processing including decision making (Venkatraman, Rosati, Taren, & Huettel,
2009), referential processing (Yaoi, Osaka, & Osaka, 2009), and default mode

122
network (Greicius, Krasnow, Reiss, & Menon, 2003) but in the affective domain,
there is evidence that it is engaged during higher level appraisals of emotional stimuli
and monitoring of one’s own emotional (Goldin et al., 2008). This self knowledge
extends to semantic information and internal cues about one’s mental state that are
essential for self-evaluations (Beer, Lombardo, & Bhanji, 2010). Thus, this region
acts to integrate not only the self’s actions and abilities but also executed a real time
evaluation of the self’s qualities within goal of the moment (Beer et al., 2010).
Consistent with this notion, a fMRI investigation of individual differences in trait
mindfulness (the ability to represent a particular quality of attentional processing to
the awareness of events) positively related to the BOLD response in the DMPFC and
left amygdala (Frewen et al., 2010). This suggests that emotional processing is also a
central feature of this region. The DMPFC is modulated when emotions are
evaluated, showing valence-dependent sensitivity, suggesting a critical role in both
evaluation and stimulus processing of emotion (Heinzel et al., 2005; Northoff et al.,
2004).
Orbitofrontal Cortex.
The OFC is anatomically connected to regions such as the amygdala,
cingulate cortex, ventral striatum, medial PFC, and entorhinal and perirhinal cortex
(Rolls & Grabenhorst, 2008). The result is that this region is a hub for processing of
multimodal information, influencing behavior, emotion, cognition and memory (Rolls
& Grabenhorst, 2008). The lateral OFC (lOFC) is primarily connected to the

123
amygdala, sensory and premotor areas, DLPFC and related to affective/cognitive
associations (Northoff et al., 2000). Medial OFC (mOFC) activity is often coupled
with amygdala response and is involved in representing the affective valence of a
stimulus, in particular, negative emotion and reactivity to foreign stimuli (Banks,
Eddy, Angstadt, Nathan, & Phan, 2007; Northoff et al., 2000; Ochsner et al., 2002).
This region has also been implicated in a regulatory function in particular playing a
critical role in fear extinguishing and decision making (Quirk & Beer, 2006). The role
this region plays in decision making is further developed by examining its function in
the representation of reward. A recent review by Rolls and Grabenhorst summarized
these functional attributes and discussed how this extends to the representation of
negative and positive reward since this region is critical to the subjective affective
experience of emotionally learned behavior (Rolls & Grabenhorst, 2008). The OFC is
also associated with primary reward reinforcement including taste, touch, texture and
face expression. By learning associations between different stimuli, this region is
essential to encoding expected reward value from multimodal sources. Thus, the role
of the OFC extends into decision making by providing information on the expected
reward value (Rolls & Grabenhorst, 2008).
In summary, the cognitive reappraisal emotion regulatory strategy is a
particularly adaptive approach to altering the experience of negative emotion. The
neural substrates of such a mental strategy involve prefrontal regions that modulate
the amygdala. The last paper will thus examine if such an emotion regulation strategy
is automatically utilized in elite athletes particularly under circumstances of known
124
stressful challenge. The principal brain regions discussed above will be critically
examined to further explore differences between the resilient group and a typical
control population.

125
Chapter 8: The Specificity of Neural Regulatory Processes during Emotional
Challenge in a Stress Resilient Population.
Introduction.
Emotion robustly affects the quality of cognitive-motor performance under
conditions of mental stress. As such, the regulation of emotion is critical to successful
execution of motor skills during competition. Previous investigations of the arousal-
performance relationship have typically focused on behavioral outcomes (Hancock &
Salman, 2008) but it is unclear if those who have demonstrated superior performance
under stress exhibit brain responses characterized by an adaptive emotion regulatory
strategy. Consistent with the reciprocal modulation model (Northoff et al., 2004); an
adaptive regulatory strategy involves cognitive interpretation of emotion-eliciting
stimuli in order to manage emotional responsivity. That is, from a functional
neuroanatomical perspective, activation in the cognitive (lateral) prefrontal region of
the cerebral cortex can be conceived as negatively associated with activation of the
amygdala (a brain region underlying emotional response) and affective prefrontal
regions (medial). Engagement of this network is mediated by an emotion regulation
strategy called cognitive reappraisal and may be spontaneously recruited during
emotional challenge in individuals who have demonstrated superior cognitive-motor
performance under stress. Using functional magnetic resonance imaging (fMRI) this
study seeks to determine if cognitive reappraisal is spontaneously recruited during the
presentation of arousing sport-specific (SS) images in elite athletes who have

126
demonstrated superior cognitive-motor performance under stress. Furthermore, in
order to address the specificity of emotion regulation, the study will determine if such
a pattern of stress resilience will generalize to non-sport emotion-eliciting scenes.
Psychological stress may be caused by social factors such as ego involvement
in the challenge, perceived imbalance between ability and required success standard,
and loss of social approval with failure (Hatfield & Brody, 2008). The dynamics
between stress and performance can be characterized by the transactional model
described by Staal (2004) in which stress is conceived as the aggregate result of the
individual appraisal of the external situation and the actual situation itself. In
particular this model integrates human performance and information processing
capacity with the notion of appraisal of threat, controllability, and predictability into
understanding the stress response. The transactional model of stress and the
interactional model of competitive stress predict that the affective response to stress is
influenced by the appraisal of the situation (personal interpretation) and the
situational factors (environmental stressors; e.g., competition). Such personal
interpretation can range from anxiety to active coping (Endler, 1997) and are
dependent on personal variables such as trait anxiety, vulnerability, physiological
arousal and innate biological features (Endler & Kocovski, 2001). The converging
view from this literature is that a great deal of individual variation in the response to
the stressor may be a consequence of the perception of the event rather than the actual
environmental stressor.
Although the consequence of stress can be performance decline (Beilock &
Carr, 2001), elite athletes appear to be resilient to such stress perturbation, promoting

127
their ability to maintain a high level of performance during stressful conditions. Thus,
based on their performance it is likely that skilled performers who excel during
competitive stress engage in emotion regulation that neutralizes negative experience
and decreases physiological arousal. But an essential question is whether they do this
only in their sport domain or during numerous situations. There are many strategies
through which to engage in emotion regulation (e.g., expressive suppression (Goldin
et al., 2008), distraction (McRae et al., 2010), cognitive load (Van Dillen et al.,
2009)) but one antecedent-focused strategy called cognitive reappraisal is a
particularly adaptive. Cognitive reappraisal, or taking a cognitive interpretation of
emotion-eliciting stimuli, effectively attenuates the emotional response to the
objective stressor (McRae et al., 20010; Ochsner, Bunge, Gross, & Grabrieli, 2002;
Ochsner et al., 2004; Ochsner & Gross, 2005; Ray et al., 2005; Wager et al., 2008).
The result of cognitive reappraisal is that it modulates negative emotional experience
and behavior resulting in an enhancement in cognitive control of emotion.
Neurobiologically, cognitive reappraisal is postulated to act through prefrontal
mediation (including areas in dorsomedial prefrontal cortex (DMPFC), dorsolateral
prefrontal cortex (DLPFC) and ventral lateral prefrontal cortex (VLPFC)) of
subcortical areas that process emotion (amygdala), thus altering the perception of
emotional events (Goldin et al., 2008; Wager et al., 2008). The prefrontal cortex
(PFC) regulates thought, action, emotion and through its capacity to engage in top
down regulation, serves to maintain appropriate actions, monitor errors and execute
goals (Arnsten, 2009). The DLPFC, and VLPFC are regions essential to negative
emotion reassessment (Wager, et al., 2008), while DMPFC is associated with self

128
monitoring (Drabant, McRae, Manuck, Hariri, & Gross, 2009). Emotional prefrontal
areas, specifically the ventromedial (VMPFC) and medial orbitofrontal (mOFC)
cortical areas, play essential roles in the time course of affective response. The
VMPFC encodes abstract representation of reward and can also act in an inhibitory
capacity, modulating amygdala response (Davidson, 2002; Ochsner et al., 2002;
Phelps et al., 2004; Quirk & Beer, 2006). The lateral orbitofrontal (lOFC) cortex is
primarily related to affective/cognitive associations (Northoff et al., 2000), while the
mOFC activity is often coupled with amygdala response and is involved in
representing the affective valence of a stimulus (Banks et al., 2007; Northoff et al.,
2000; Ochsner et al., 2002). Beyond the PFC, limbic regions like the amygdala play a
central role in fear and novelty processing (Davidson, 2002), emotional valence and
intensity (Salzman & Fusi, 2010), and influence the quality of motor preparation,
focal attention and memory encoding (McRae et al., 2010). Also critical to affective
response is the insula, which is part of the neural mechanism that evaluates negative
events (Carretie et al., 2009) and is particularly sensitive to disgust and self-generated
affect (Wright, He, Shapira, Goodman, & Liu, 2004). Thus, in summary, cognitive
reappraisal may be critical to the orchestration of cognitive prefrontal processes that
acts to down-regulate multiple sources of emotional evaluation processing (e.g.,
amygdala and insula), representing a shift from an emotion system into a more
cognitive system during stimulus appraisal (Ochsner et al., 2002).
Through experience, elite athletes may have developed an automaticity of a
cognitive strategy to achieve emotional control when faced with stressful challenge as
a means to preserve psychomotor efficiency. In support of this notion, recent work by

129
Drabant and colleagues (2009) have demonstrated that individuals who behaviorally
reported to use a cognitive reappraisal strategy in their daily lives, recruit similar
prefrontal regions and subsequent amygdala reductions when viewing stressful
events, mirroring regions active during instructed cognitive reappraisal. Since
cognitive reappraisal acts to alter the trajectory of emotional responses by
reformulating the meaning of a situation (Goldin, McRae, Ramel, & Gross, 2008;
Wager et al., 2008), this strategy may be spontaneously recruited in elite athletes
during stressful situations. By specifically examining this mental approach, it could
provide critical insight into the manner through which stress resilience individuals
adaptively cope with mental stress.
The overarching aim of the study is to determine if those who exhibit superior
cognitive-motor performance and stress resilience are characterized by brain
processes that parallel those recruited during cognitive reappraisal. To examine this
model two separate types of stressful stimuli will be employed: Sport-Specific (SS)
negative images and International Affective Picture System (IAPS) generalized
negative images in order to test two competing hypotheses of emotion regulation: 1)
hypothesis one predicts specificity of the endogenous regulatory response to
emotional challenge (i.e., the domain-specific model of emotion regulation) while 2)
the alternative hypothesis predicts an ubiquitous stress resilience independent of
experience (i.e., the domain-general model of emotion regulation). Examination of
these competing hypotheses will be executed through direct statistical comparison of
the BOLD signal during the natural response to SS and generalized negative images
compared to the cued cognitive reappraisal of SS negative images and generalized
130
negative images, respectively (CONTRASTS: 1) Cognitive Reappraisal SS - Passive
Negative SS; 2) Cognitive Reappraisal IAPS - Passive Negative IAPS). With elite
athletes, minimal significant difference in BOLD signal between the sports specific
conditions (Cognitive Reappraisal SS - Passive Negative SS) implies this population
naturally resorts to an adaptive emotion regulation strategy when exposed to images
that are relevant to their expertise, thus accounting for their ability to maintain skilled
cognitive-motor performance during stress. On the other hand, in the case of a general
model of emotion regulation, minimal difference BOLD signal between the
endogenous response of the elite performers to both non-specific and specific
negative images and cued cognitive reappraisal (Cognitive Reappraisal SS - Passive
Negative SS; Cognitive Reappraisal IAPS - Passive Negative IAPS) implies this
population naturally resorts to an adaptive emotion regulation strategy in all situations
of stress.
A region of interest analyses also will be executed in the areas indentified
above that are sensitive to both cognitive (PFC) and affective (insula and amygdala)
processing to further examine differences between the types of emotional challenge.
In the event of a domain specific model of emotion regulation, we predict that during
examination of SS affective challenge, the football group will demonstrate similar
patterns of activation in the PFC during the cued cognitive reappraisal and during
their natural response. In turn, this will translate into attenuated amygdala and insula
activation. In the event of a domain general model this effect would extend to the
IAPS conditions.

131
However based on the transactional model (Staal, 2004) and interactional
model (Endler, 1997) which posits the primarily influence of the situation on human
behavior, the domain specific model of emotion regulation appears to be tenable.
Lastly, a control group will be examined and we predict that this population
will demonstrate no such ability to endogenously engage in cognitive reappraisal,
thus consistent with the literature1, this group should be able to successfully engage in
cognitive reappraisal (attenuated amygdala and insula response, with heightened
lateral prefrontal activation, and reduced negativity of self report) when cued to do so,
yet demonstrate affective processing (heightened amygdala and insula activation)
during passive viewing of negative events (independent of domain).
Methods
Subjects.
Twenty-five male participants between the ages of 18 and 22 were recruited
and of these 13 were football athletes (M=21.46 years; SD=0.776) and 12 were non-
athletes (M= 21.08 years; SD=2.19). The football athletes were 1) senior varsity
athletes 2) letter award winners 3) typically play a starting role on the team 4) on a
partial or full athletic scholarship. The non-athletes were healthy subjects who never
played football at a college level but reported familiarity with the goal and rules of
1 It should be noted that the majority of the literature examining cognitive reappraisal is conducted with female participants (e.g., Goldin et al., 2008; McRae et al., 2010; Ochsner et al., 2002; Ochsner et al., 2004; Ray et al., 2005). Thus, although we base our predictions on current findings, gender-based differences in cued cognitive reappraisal may be revealed, due to the male-only sample in this dissertation.

132
the sport; this is critical to ensure that all subjects understand the meaning of the
negative sport-relevant images. We developed a metric to quantify the football
experience of the control subjects (Please select the answer that best describes your
football experience : 0=no experience, do not watch or attend games (not a fan); 1=no
experience, but watch occasionally (mild fan); 2=no experience, but watch frequently
(avid fan); 3= some experience playing and watch frequently (e.g., intramurals);
4=several years experience playing competitively (e.g., high school); 5=currently
playing competitively) such that control subjects scored a mean score of 3 (M=3;
SD=0.94) for football experience. We additionally characterize their sport experience
outside of football with a similar metric; mean score of 4.09 (M=4.09; SD 0.51) for
sports experience in general.
Additional selection criteria included that the subjects must have been (a)
native English speakers (b) free of current or past diagnosis of neurological or
psychiatric disorders, and (c) MRI compatible (e.g., no metal in body, no tattoos on
face, no medicine delivery patch). All subjects gave their written informed consent
and all experimental procedures were approved by the University of Maryland
Institutional Review Board with proper notification IRB of record for Hyman Subject
Research Projects performed at the Georgetown University Center for Functional and
Molecular Imaging.

133
Procedure.
Stimuli.
Following the approach developed by (Goldin, et al., 2008; Ochsner et al.,
2004) the fMRI investigation evaluated the BOLD response during negative and
neutral visually presented images. The neutral images served to provide a baseline to
remove lower-level sensory processing associated with the visual modality and thus
isolate affect specific networks. Negative and neutral images were selected from the
International Affective Picture System (IAPS) (Lang, Bradley, & Cuthbert, 1999). In
addition we developed Sport-Specific (SS) images by searching internet databases
(e.g., Google Images) to find images representing unpleasant events experienced
during football competition: for example: 1) injuries; 2) embarrassment due to loss
(i.e., dejected players); 3) critical coaches.
Undergraduates (n=103) at the University of Florida gave their written
consent (approved by the University of Florida Institutional Review Board) and the
rated sport pictures (i.e., sport-specific negative images) (31 performance, 39 injury)
and 48 negative IAPS images using the IAPS self assessment manikins and IAPS
protocol (Lang, Bradley, & Cuthbert, 1999). The top 48 most negative sport images
were selected based on valence scores (38 injury, 10 performance) and, for men, the
SS images resulted in a valence rating mean of 4.131 and arousal mean rating of
4.824. In turn, IAPS images were selected with matching valence means scores of
4.116 and arousal mean scores of 4.896 to create equivalence between the two image

134
sets. These ranges are consistent with what Patrick and Lavoro (1997) reported as
negative for IAPS images: "Slides with mean valence ratings of less than 4.5 out of 9
were classified as unpleasant, those between 4.5 and 5.5 were classified as neutral,
and those with mean ratings above 5.5 were classified as pleasant” (Patrick & Lavoro,
1997)
Task.
Each trial was composed of four events: First, instructions (watch or decrease)
appeared centrally for 2 seconds. On “decrease” trials, participants were instructed to
engage in cognitive reappraisal and on “watch” trials participants will be instructed
simply to look at the image and let themselves respond naturally. Second, an aversive
or neutral image will appear centrally for 8 seconds. This duration was selected based
on a recent meta–analysis by Kalisch (2009) that suggests that 8 second image
presentation time ensures examination of one concrete dimension of this
psychological construct (implementation of cognitive reappraisal) (Kalisch, 2009).
While the image remained on the screen, participants performed the evaluation
operations specified by the prior instructional cue. Third, a rating scale will appear
immediately after presentation of the image for 4 seconds asking “How negative do
you feel” with a rating from 1 to 5 (1 not at all, 3 moderately, 5 extremely). This
scale will allow participants to rate with a joystick the current strength of their
negative affect and serve as a behavioral index of the success of reappraisal. Fourth,
the transition task of fixation cross for 4 seconds in the center of the screen indicating

135
that participants should relax until the next trial. Each subject was cued to passively
view or reappraise 48 domain non-specific negative images (24 each) and 48 domain
specific negative images (24 each) in addition to the passive viewing of 24 neutral
images during randomly intermixed trials over 4 MRI scanning runs. Each image was
shown only once for a given participant. Upon completion of the MRI, subjects
returned to the Behavioral Testing room to complete questionnaires.
Prior to data collection.
Upon arrival at the Georgetown University Center for Functional and
Molecular Imaging, participants were escorted to a Behavioral Testing room were
written consent and MRI safety screening were attained. Task instructions consisted
of a scripted training manual designed to provide an overall explanation of the goal of
study, provide a detailed overview of the trial structure, review the instructional cues
and describe the rating approach. During this orientation the investigator read aloud
the manual while the participant followed along.
The subject was instructed that the goal of the study was “We are interested in the biological and brain processes related to mental pressure and toughness. In order to make sense of the pattern of your brain response we need to have a consistent comparison condition. Thus, I am going to train you on a task which we will use as the comparison state but we are really interested in how you respond naturally to these pictures.” Next the subject viewed the trial structure and was read the following description: “You will be given an instructional cue of either “Watch” or “Decrease” (I will describe the instructions in greater depth next). Next you will see a picture. Some of the pictures may prompt emotional experiences; others may seem relatively neutral. You will be asked to rate the image using a joystick (which will also be described next). Lastly you will see a cross in the center of the screen; simply fix your eyes on that cross.” Next the rating instructions were given “After viewing a picture we ask that you rate it. You will be asked “how

136
negative do you feel?” and select the numeric value that applies to how you felt when viewing the image. If you felt in between the three descriptors, please select the appropriate intermediate value. There is no right or wrong answers, so simply respond as honestly as you can.” Then the subject was introduced to the meaning of the watch instruction and shown a sample trial with a picture of an injured player: “Next, I will review the instructional cues. Below I have included one example trial in which the instruction will be “watch”, which means you must simply look at the image and let yourself respond naturally.” The decrease instruction was next reviewed (descriptions taken from previous protocols, e.g., (McRae, Ochsner, Mauss, Gabrieli, & Gross, 2008; K. N. Ochsner, et al., 2002): “The second instructional cue is “Decrease.” What you will do when you see this instruction is transform your response or interpretation of the picture so it’s not so negative. There are three ways to do this: 1) Transform the scenario depicted into positive terms; imagine that the situation is not as bad as it appears (e.g., a women crying outside of a church could be interpreted as a woman expressing tears of joy from a wedding ceremony rather than from the sorrow of a funeral); 2) Rationalize or objectify the content of the pictures; view the image from the perspective of a distant, detached observer (e.g., consider a woman with facial bruises could be an actor wearing makeup rather than a victim of domestic abuse); 3) Imagine that things will improve with time (e.g., whatever appears to be bad will resolve over time). This is called cognitive reappraisal. Cognitive means how you think and reappraisal means transforming the meaning.” And then the subjects were shown an example trial (IAPS number 6212): “Here’s a sample trial, and the implementation of all three strategies with this one image. Again you may choose 1 of the 3 strategies during the image viewing period: all are appropriate. 1) The Soldier is clearly not aiming at the child but at his adversary in the distance. The child is running to the safety of his family where he will avoid any harm; 2) Action movie trailer for the latest Special Forces flick; 3) The village will be safe again after the Soldiers remove the threat.” Next participants sat at a desktop computer to practice the task using a duplicate MRI compatible joystick that matched the device used in the MRI environment. Participants were introduced to all elements of the experimental protocol including the initial instructional prompt of “Remember when cued to ‘watch’ respond naturally and when cued to ‘decrease’ engage in cognitive reappraisal (as practiced).” Next the participant viewed two “watch” trials and executed their rating selection. After that, the participant viewed an investigator demonstration of reappraisal using three negative images and again executed their rating selection. The participant was then instructed to overtly engage in reappraisal during the viewing of 6 negative images (3 IAPS and 3 SS) to ensure proper use of the cognitive reappraisal strategy. All training was scored during these self paced sessions using a categorically scoring metric that included the following categories identified in (McRae, et al., 2008): 1) It is not real (e.g., it is just a scene from a movie, they are just

137
pretending); 2) Things will improve with time (e.g., whatever is going wrong will resolve over time); 3) Things are not as bad as they appear to me (e.g., the situation looks worse than it is, it could be a lot worse, at least it’s not me in that situation); 4) Expressive Suppression/ Attention Modulation; 5) Failure to Reappraise.
All subjects performed at/or better than 90% correct for the initial training
session (mean percent correct: 92.14%). The final training session occurred in the
MRI during which the subject viewed 6 reappraisal “decrease’ trials which match the
exact timing of the experiment. The subjects then retrospectively reported all of their
reappraisal strategies such that the training success could be scored based on the
categories mentioned above. All subjects performed at/or better than 90% correct for
the in scanner training session (mean percent correct: 90.91%).
Imaging parameters.
Functional and structural magnetic imaging data were acquired on a 3T
Siemens Magnetom Trio system equipped with gradients suitable for echo-planar
imaging sequences. Thirty-eight axial slices (3.2 mm thick in plane) were acquired
using an echo planar imaging (EPI) pulse interleaved sequence (TR 2000 ms; FOV
205; TE 30ms). For the possibility of aligning of the functional data to each subject's
individual anatomy, anatomical images were obtained: a high resolution T1 3D
MPRAGE. Image data were transferred via the network for quantitative analysis and
to magnetic tape for backup.
138
Dependent Measures.
Psychometric inventories: to characterize population.
Performance Failure Appraisal Inventory (PFAI).
This inventory is a multidimensional measure of cognitive-motivational-
relational appraisals associated with fear of failure (FF). FF was associated with (a)
high levels of worry, somatic anxiety, cognitive disruption, and sport anxiety, and (b)
low levels of optimism. General FF was unrelated to either perceived competence or
fear of success. This measure consists of five questions examining failure appraisal:
1) When I am failing, I am afraid that I might not have enough talent; 2) When I am
failing, it upsets my “plan” for the future; 3) When I am not succeeding, people are
less interested in me; 4) When I am failing, important others are disappointed; 5)
When I am failing, I worry about what others think about me. Subjects are asked to
rate these questions based on the following range: Do Not Believe at All, Believe
50% of the Time, Believe 100% of the Time. To compute the general fear of failure
score all 5 item scores are averaged (Conroy, 2001).
State-Trait Anxiety Inventory (STAI).
This is a 40-item self-report index of state and trait anxiety consisting 20 state
items and 20 trait items. The STAI-T consists of 20-items rated on a 4-point scale
139
ranging from ‘not at all’ to ‘very much so’ in terms of how the participant feels at the
moment. The STAI-T score ranges from 20 to 80, with increasing scores reflecting
greater trait anxiety (Spielberger, et al., 1970).
Dispositional Resilience Scale (DRS).
This inventory is a hardiness measure with 5 items each to measure the
hardiness facets of Commitment, Control, and Challenge. Each question asks how
much you think each one is true for you ranging from 0=Not at all true; 1=A little
true; 2=Quite true; 3=completely true. Six items are negatively-keyed, which makes
this scale quite well-balanced for negative and positive items. Results include raw
scores and percentiles for commitment, control, challenge, and total hardiness
(Bartone et al., 2008).
Sport Competition Anxiety Test (SCAT).
This is a 15-item questionnaire gauging an individual’s tendency to perceive
competitive situations as threatening and to respond to these situations with elevated
state anxiety. Subjects are asked to indicate how they generally feel when they
compete in sports and games and respond to each item using a three-point scale
(hardly ever, sometimes and often). Scores on the SCAT range from 10 to 30
(Martens, Vealey, & Burton, 1990).

140
Beck Depression Inventory (BDI).
This is a 21 item self-report questionnaire evaluating depression symptoms. It
is a widely accepted measure consistent with clinician ratings and other depression
scales based its comparable internal consistency and validity. Each question consists
of 4 statements describing increasing intensities of symptoms of depression.
Questions are rated on a scale from 0–3, reflecting how participants have felt over the
past week. Possible scores range from 0–48; higher scores reflect more severe
depressive symptomotology. (Beck, Rush, Shaw, & Emery, 1979).
Emotion Regulation Questionnaire (ERQ).
This is a 10-item self-report questionnaire indexing the habitual use of
expressive suppression and cognitive reappraisal. This measure consists of 10
questions, 4 measuring suppression (e.g., ‘I keep my emotions to myself’) and 6
measuring reappraisal (e.g., ‘When I want to feel more negative emotion I change
what I’m thinking about’). Higher scores indicate more frequent use of each strategy.
(J. J. Gross & John, 2003)

141
Physiological measures of arousal.
Galvanic skin response.
Skin conductance is measured using the Psylab Stand Alone Monitor through
the application of a small voltage across two electrodes and in turn measures the
current that flows between the electrode locations. Electrode placement is constrained
to sites unique to eccrine sweating, which, is related to mental processes and
exclusively under sympathetic control. Electrodes were placed on medial phalanges
on left index and middle fingers. The skin conductance data were recorded
continuously at a rate of 25 samples per second. Off-line analysis of skin conductance
response waveforms using a local peak-detection algorithm was used to compute
stimulus-related skin conductance responses defined as trough-to-peak conductance
differences greater than 3.1 micro Siemens occurring within 100 second windows to
minimize transition points. The amplitude of the largest skin conductance response
associated with each stimulus (skin conductance response magnitude) was used as an
index of the subject’s maximum arousal during that stimulus (if no skin conductance
response was detected, amplitude was considered to be 0) (Butler, et al., 2007). Skin
conductance response were then co-registered with viewing time by examining time
windows 0.5 s to 12 s following stimulus onset (Butler, et al., 2007). The skin
conductance responses were then averaged within the cognitive reappraisal SS, IAPS,
passive negative SS, IAPS, passive neutral conditions for each subject.

142
Heart rate.
HR was measured using the Invivo cart (3150 MRI) using the 4-in-1
Quadtrode® MRI ECG Electrode placed on the subject’s left side, below the left
pectoral, on the bottom of the ribcage. As a secondary measure, we used a pulse
oximeter on the left thumb of the participant in case the ECG recording became
disrupted due to the MRI gradients. HR was then co-registered with viewing time (8
s) and then averaged within the cognitive reappraisal SS, IAPS, passive negative SS,
IAPS, passive neutral conditions for each subject.
Behavioral measures - affective rating.
Mean negative affect ratings will be calculated for the passive negative (SS
and IAPS), passive neutral, and cognitive reappraisal (SS and IAPS) conditions for
“How Negative Do You Feel?” (1= not at all, 3=moderately, 5=extremely).
Functional Magnetic Resonance Imaging: BOLD Signal.
The DICOM images were extracted and imported into the signal processing
software for preprocessing (e.g., Statistical Parametric Mapping, SPM5). Slice timing
correction was followed by correction for head motion during scanning (through the
registration of the time series to the reference first scan). The motion parameters were
saved for later statistical analysis to be used as regressors in the design matrix. This

143
step was followed by creating binary mask so that voxels outside of the brain are
removed. For statistical comparisons to be made across subjects, the data were
normalized into MNI format (template EPI.mni) in order to account for variability in
brain shape and size. Default SPM5 settings were used to warp volumetric MRIs to fit
the standardized template (16 nonlinear iterations), and normalization parameters
were applied to subject’s functional images. Normalized images were resampled into
2 × 2 × 2 mm voxels. Then, a spatial smoothing of the images was performed by
employing a low pass spatial filter which remove high frequency spatial components
resulting in the ‘blur’ of the images (Huettel, Song, & McCarthy, 2003). The
Gaussian filter of 6mm (the width is determined by half of the maximum value, Full-
Width-Half-Maximum, FWHM) essentially acted to spread the intensity of each
voxel in the image to neighboring voxels serving to maximize the signal to noise ratio
and reducing false positives in the later statistical analysis (Huettel, et al., 2003).
Statistical Analysis.
Psychometric inventories: to characterize population.
For the PFAI, STAI, DRS, SCA, BDI and ERQ, mean and standard deviations for
each item were computed. Group comparisons were tested using a paired t-test.
144
Physiological measures of arousal.
Galvanic skin response.
Two way ANOVA (2 x 5) Group (control, football) by Condition (cognitive
reappraisal SS, passive negative SS, cognitive reappraisal IAPS, passive negative
IAPS, passive neutral) was executed. Tukey’s post-hoc tests were employed to
examine all possible comparisons.
Heart rate.
Two way ANOVA (2 x 5) Group (control, football) by Condition (cognitive
reappraisal SS, passive negative SS, cognitive reappraisal IAPS, passive negative
IAPS, passive neutral) was executed. Tukey’s post-hoc tests were employed to
examine all possible comparisons.
Behavioral measures - affective rating.
To examine within group effects one way ANOVAs were executed for each
group with Condition as the factor (cognitive reappraisal SS, passive negative SS,
cognitive reappraisal IAPS, passive negative IAPS, passive neutral). Tukey’s post-
hoc tests were employed to examine all possible comparisons.

145
Functional Magnetic Resonance Imaging: BOLD Signal.
Preprocessed images were entered into a General Linear Model in SPM5 that
modeled the canonical hemodynamic response function convolved with an 8-second
boxcar representing the picture-viewing period. Motion parameters, the instructional
cue period, and the rating period were entered into the model as additional regressors.
The General Linear Model (boxcar models representing the picture-viewing period of
each condition) was used to create contrasts for each condition, for each subject, for
each domain. These individual contrasts were then entered into a Full Factorial design
of a 2 x 4 ANOVA Group by Conditions to perform a random-effects group analysis.
The Group factor consisted of Football and Control and the Condition factor
consisting of Cognitive Reappraisal SS, Passive Negative SS, Cognitive Reappraisal
IAPS, and Passive Negative IAPS. Conditions of interests were examined (Cognitive
Reappraisal SS, Passive Negative SS, Cognitive Reappraisal IAPS, Passive Negative
IAPS) for each group relative to the neutral baseline. Direct comparison contrasts
were computed within group between each condition (Cognitive Reappraisal SS-
Passive Negative SS, Passive Negative SS- Cognitive Reappraisal SS, Cognitive
Reappraisal IAPS-Passive Negative IAPS, Passive Negative IAPS- Cognitive
Reappraisal IAPS) for the whole brain and regions of interest (ROI). ROI analysis
was executed using anatomical masks generated by the Wake Forest Pick Atlas. The
ROIs examined were based on a priori theoretical predictions of areas sensitive to
cognitive and affective processing (BA 8, 9, 10, 11, 45, 46, 47, taken from the Wake
Forest Pick Atlas indication of Brodmann Areas for the prefrontal cortex, in addition

146
to the insula and amygdala). ROIs of conditions of interests were examined
separately (Cognitive Reappraisal SS, Passive Negative SS, Cognitive Reappraisal
IAPS, Passive Negative IAPS) for each group with the neutral baseline using the
same Wake Forest Pick Atlas anatomical masks.
Results
Psychometric Inventories: to Characterize Population.
Performance Failure Appraisal Inventory (PFAI).
Paired t-test revealed a significant difference between group (p=0.0073) with
football group showing less fear of failure (M=-1; SD=0.66) compared to the control
group (M=-0.11; SD =0.81) (Figure 22).
Figure 22. The PFAI revealed that the football group demonstrated significantly less fear of failure compared to the control group (same as Figure 8).

147
State-Trait Anxiety Inventory (STAI).
Paired t-test revealed no difference (p=0.9299) in state anxiety between the
football group (M=27.5; SD=6.7) and the control group (M=27.3; SD=5.9). Paired t-
test also revealed no difference (p=0.2041) between trait anxiety with the football
mean of 32.4 (M=32.4; SD=4.2) and the control mean of 35.3 (M=35.3; SD=5.8)
(Figure 23).
Dispositional Resiliency Scale (DRS).
The paired t-test revealed no difference (p=0.2851) between the control group
(M=34; SD=4) and the football group (M=36; SD=4). The control group was in the
87.7 percentile for total hardiness and the football group was in the 94.2 percentile for
total hardiness (Figure 23).
Sports Competition Anxiety Test (SCAT).
The paired t-test revealed no difference (p=0.885) between the groups with the
control group mean score of 18 (M=18; SD=4) and the football mean score of 18
(M=18; SD=5) (Figure 23).
148
Beck Depression Inventory (BDI).
The paired t-test revealed no significant difference between group p=0.2512
with the control group mean of 5 (M=5; SD=5) and the football group mean of 3
(M=3; SD=3) (Figure 23).
Emotion Regulation Questionnaire (ERQ).
Paired t-tests between group revealed no difference (p=0.6793) between
expressive suppression (Football: M=14; SD=4. Control M=15; SD=3) and no
difference (p=0.2996) between cognitive reappraisal (Football M=32; SD=3. Control
M=30; SD=6). Both groups scored higher on cognitive reappraisal compared to
expressive suppression (Figure 23).

149
Figure 23. Self report results from psychometric inventories. The control group and football group were statistically equivalent on STAI State (A) STAI Trait (B); DRS (C); SCAT (D); BDI (E); ERQ (F) (same as Figure 11).
Physiological Measures of Arousal.
Exploratory results from HR and GSR. Datasets were incomplete due to
technical problems with the recording devices (i.e., only 3 control subjects were
recorded for HR).
150
Galvanic skin response.
A two way ANOVA (Group x Condition) revealed no significant difference
between group or within condition (Condition main effect p=0.089; Group x
Condition interaction p=0.31) (Figure 24).
Heart rate.
A two way ANOVA (Group x Condition) revealed no significant difference
between group or within condition (Condition main effect p=0.544; Group x
Condition interaction p=0.273) (Figure 24).
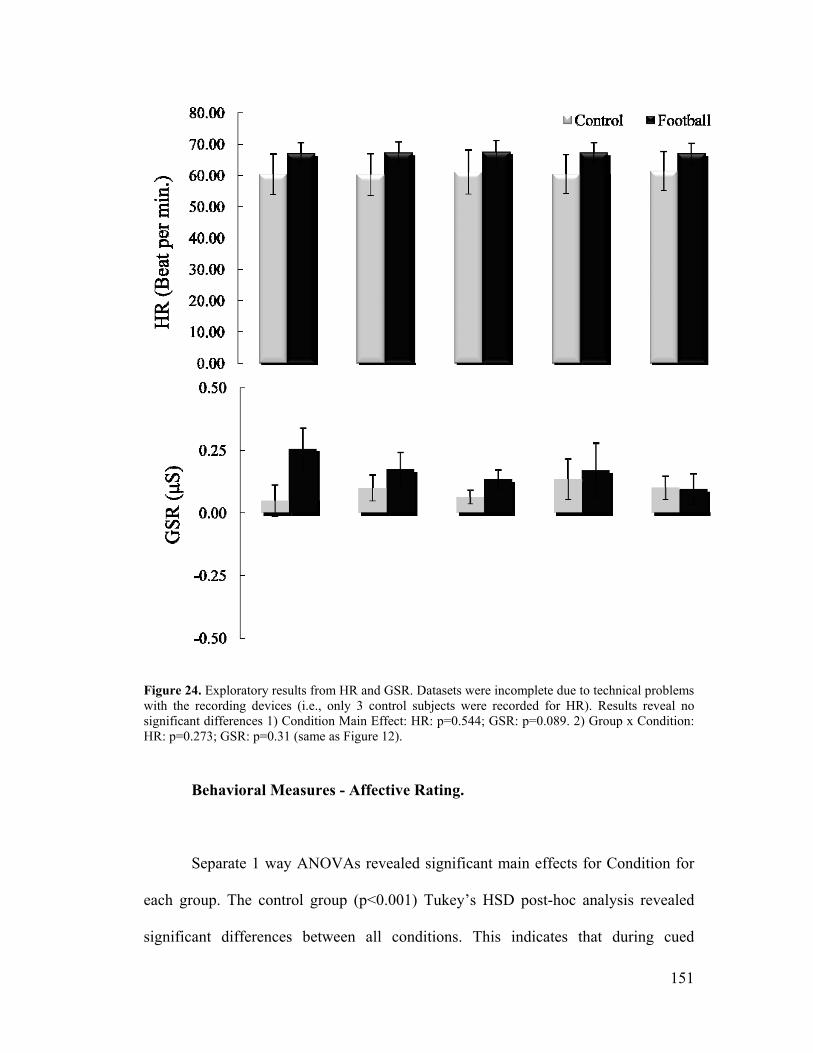
151
Figure 24. Exploratory results from HR and GSR. Datasets were incomplete due to technical problems with the recording devices (i.e., only 3 control subjects were recorded for HR). Results reveal no significant differences 1) Condition Main Effect: HR: p=0.544; GSR: p=0.089. 2) Group x Condition: HR: p=0.273; GSR: p=0.31 (same as Figure 12).
Behavioral Measures - Affective Rating.
Separate 1 way ANOVAs revealed significant main effects for Condition for
each group. The control group (p<0.001) Tukey’s HSD post-hoc analysis revealed
significant differences between all conditions. This indicates that during cued

152
cognitive reappraisal of SS images (M=1.89; SE=0.19) these affective effects were
perceived as significantly less negative than during the nature response to SS image
(M=2.72; SE=0.25). In addition the cognitive reappraisal of IAPS images (M=1.60;
SE=0.17) were perceived less negative compared to the nature response to IAPS
images (M=3.2; SE=0.23). Lastly the neutral images were rated significantly less
negative (M=1.42; SE=0.13) compared to the negative IAPS and SS images. The
football group (p=0.001) Tukey’s HSD post-hoc analysis revealed that the passive
viewing of negative SS images (M=2.46; SE=0.24) was significantly more negative
than viewing neutral images (M=1.28; SE=0.12). In addition the cognitive reappraisal
of IAPS images (M=1.65; SE=0.16) was significantly less negative than the passive
viewing of IAPS (M=2.69; SE=0.22) images but more negative than viewing the
neutral images (M=1.28; SE=0.12). The cognitive reappraisal of SS images (M=1.97;
SE=0.19) was rated statistically equal to the natural response of viewing SS negative
images (M=2.46; SE=0.24) (Figure 25).

153
Figure 25. Self report scores from Affective Ratings of “How Negative Do You Feel?” (1=not at all, 3 moderately, 5 extremely) from separate one-way ANOVAs. The control group (left panel) rating of each condition was significantly different. The football group (right panel) rated the cognitive reappraisal of SS images and the passive response to SS images statistically equal, whereas as the generalized images (IAPS) were rated differently. CR-SS: Cognitive Reappraisal of SS Images; PN-SS: Passive (viewing of) Negative of SS Images; CR-IAPS: Cognitive Reappraisal of IAPS Images; PN-IAPS: Passive (viewing of) Negative of IAPS Images; PNEut: Passive (viewing of) Neutral of IAPS Images (same as Figure 13).
Functional Magnetic Resonance Imaging: BOLD Response.
Direct comparisons between conditions: whole brain and regions of
interest.
The results trend towards support of the Domain-Specific Model of Emotion
Regulation. Although these differences did not survive multiple comparisons
corrections (neither FWE or FDR) the results approached significance (p<0.05,
uncorrected) in a manner that supports the domain-specific model of emotion
regulation: direct comparisons revealed no difference in ROIs between cued
0.00
0.50
1.00
1.50
2.00
2.50
3.00
3.50
4.00
CR
-SS
CR
-IA
PS
PN-S
S
PN-I
APS
PNeu
t.
CR
-SS
CR
-IA
PS
PN-S
S
PN-I
APS
PNeu
t.
Self
Rep
ort S
core
s
Control Football
** ****

154
Cognitive Reappraisal and Passive Negative of SS negative images for the football
group. Furthermore, direct comparisons between the cued Cognitive Reappraisal and
the Passive Negative conditions resulted in differences in regions of interest (PFC,
insula) for the football group during conditions of IAPS challenge. Direct
comparisons also revealed differences in neural processing between cued Cognitive
Reappraisal and the Passive Negative conditions for the control group independent of
stimulus type.
Whole brain direct comparison results were examined in addition to regions of
interest (ROIs). The ROIs of the direct comparison results were executed using
anatomical masks generated by the Wake Forest Pick Atlas. The ROIs examined were
based on a priori theoretical predictions of areas sensitive to cognitive and affective
processing (PFC, amygdala and insula).
FOOTBALL: cognitive reappraisal SS - passive viewing SS.
Direct comparison of the SS conditions (CR SS - PN SS) indicated very little
differences between the natural response of football players to SS challenge and the
cued emotion regulation conditions. There were no differences between these
conditions in all of the ROIs. Beyond the ROIs, the left supramarginal gyrus (BA 40),
the left STG (BA 38) and the left premotor cortex (BA 6) was active during Cognitive
Reappraisal - Passive Negative (Figure 26, Table 10).

155
FOOTBALL: passive viewing SS- cognitive reappraisal SS.
No difference was detected during the Passive Negative SS – Reappraisal SS
contrast (PN SS – CR SS) (Figure 26, Table 10).
CR – PN
PN – CRp <0.05 (uncorrected)
Football - SS
Figure 26: Whole brain axial slice results (inferior-superior) from direct comparisons between conditions for the Football group during SS Negative Images (Football – SS). The orange indicates contrast results from Cognitive Reappraisal – Passive Negative (CR - PN) for SS negative images. The blue indicates contrast results from Passive Negative - Cognitive Reappraisal (PN - CR) for SS negative images.
FOOTBALL: cognitive reappraisal IAPS - passive viewing IAPS.
Direct comparisons between the Cognitive Reappraisal of IAPS images and
the Passive Response (CR IAPS – PN IAPS) to IAPS images indicated activation in
the left DLPFC (BA 8,9, 46), the bilateral DMPFC (BA8), bilateral VLPFC

156
(BA10/45), right VMPFC (BA 10), bilateral ACC (BA 32) , left IFG (BA47), left
insula (BA13), bilateral OFC (BA11), bilateral SMA (BA6), left MTG (BA 21), left
postcentral gyrus (BA 43), bilateral lentiform nucleus, right uncus (BA 28), right
parahippocampal gyrus, bilateral STG (BA 22), bilateral cerebellum, bilateral
clustrum and left caudate (Figure 27, Table 10).
FOOTBALL: passive viewing IAPS – cognitive reappraisal IAPS.
Passive viewing of IAPS images resulted in left DMPFC (BA 10), left MTG
(BA 21), left STG (BA 38), and right motor cortex (BA 4) activation compared to the
Cognitive Reappraisal of IAPS images (contrast (PN IAPS- CR IAPS)) (Figure 27,
Table 10).
The results indicate that there was a difference between the natural response
of football players to generalized negative images (IAPS) and the cued cognitive
reappraisal of IAPS images, supporting the domain-specific model of emotion
regulation.

157
CR – PN
PN – CRp <0.05 (uncorrected)
Football - IAPS
Figure 27. Whole brain axial slice results (inferior-superior) from direct comparisons between conditions for the Football group during IAPS Negative Images (Football – IAPS). The orange indicates contrast results from Cognitive Reappraisal – Passive Negative (CR - PN) for IAPS negative images. The blue indicates contrast results from Passive Negative - Cognitive Reappraisal (PN - CR) for IAPS negative images.

158
Table 2. Results from direct comparisons between conditions for the Football group. Top panel indicates contrast results from the Cognitive Reappraisal of SS images – Passive Negative of SS images (CRSS -PNSS). The second panel indicates contrasts results for Passive Negative of SS images - Cognitive Reappraisal of SS images (PNSS - CRSS). Third panel indicates contrast results from the Cognitive Reappraisal of IAPS images – Passive Negative of IAPS images (CRIAPS - PNIAPS). Bottom panel indicates contrasts results for Passive Negative of IAPS images - Cognitive Reappraisal of IAPS images (PNIAPS - CRIAPS). Whole brain analysis reported at uncorrected threshold p<0.05 (marked without star). Red text signifies results from region of interest analysis (ROI) derived from Wake Forest anatomical mask. ROI analysis is adjusted for search volume, at an uncorrected threshold p<0.05 (marked without star).
CONTROL: cognitive reappraisal SS - passive viewing SS.
Direct comparisons of Cognitive Reappraisal SS and Passive Negative SS
(CR SS – PN SS) revealed greater activation in the left DMPFC (BA 8), left IFG (BA
47), right insula (BA 13), right IFG (BA 44), left SMA (BA 6), left caudate, left
supramarginal gyrus (BA 40), bilateral pulivinar, right MTG (BA 21) and left
Primary Motor cortex (BA 4) during cued emotion regulation (p<0.05, uncorrected)
(Figure 28, Table 11).
Volume in Voxels MNI coordinates x, y, z t values Volume in Voxels MNI coordinates x, y, z t valuesPremotor 6 3 -10 14 70 1.72
STG 38 4 -32 20 -28 1.84Supramarginal Gyrus 40 27 -50 -52 22 1.85
PNSS - CRSS -- -- -- -- -- -- -- --
DLPFC 8 91 -32 26 46 2.89
DLPFC 9 108 -32 24 42 2.63DLPFC 46 11 -56 26 26 1.93DMPFC 8 28 -4 26 56 2.06 2 16 30 56 1.71VLPFC 10 54 -26 50 -2 2.62 183 28 40 20 2.22VLPFC 45 2 64 14 18 1.75VMPFC 10 12 14 52 -6 1.88
IFG 47 1 -40 40 -6 1.7OFC 11 2 -12 48 -18 1.9 2 12 50 -16 1.71ACC 32 56 -8 20 32 1.88 3 10 10 28 1.75Insula 13 154 -36 10 -2 2.36
SMA/Premotor 6 1657 -14 26 56 2.95 7 16 28 58 1.78MTG 21 373 -50 -30 2 2.13STG 22 232 -48 10 0 1.73 3 42 16 -20 1.7
Postcentral Gyrus 43 4 -58 -14 16 1.71Uncus 28 1 28 -8 -26 1.72
Caudate -- 373 -36 -36 0 2.39Claustrum -- 373 -28 -16 18 2.04 17 32 14 0 1.83
Leniform Nucleus -- 2 -24 -6 -8 1.7 22 22 12 18 1.85Cerebellum -- 12 -4 -60 -8 1.85 22 16 -70 -30 2.01
Parahippocampal Gyrus 34 3 14 6 -12 1.86
DMPFC 10 5 -12 60 -2 1.94
Motor Cortex 4 55 32 -14 42 2.03MTG 21 1 -52 4 -38 1.75STG 38 1 -38 14 -40 1.71
CRSS - PNSS
CR IAPS - PN IAPS
PN IAPS - CR IAPS
FO
OT
BA
LL
RightGroup Contrast Conditions Region BA
Left

159
CONTROL: passive viewing SS - cognitive reappraisal SS.
In addition, the bilateral isula (BA13), right VLPFC (BA 10), right
cerebellum, right postcentral gyrus (BA 2), right SPL (BA 7), and right IPL (BA 40)
were active during passive viewing of negative SS images (PN SS- CR SS) (Figure
28, Table 11).
The results indicate that there was a difference between the natural response
of the control group to sports specific negative images and the cued cognitive
reappraisal of sports specific challenge.
Control - SS
CR – PN
PN – CRp <0.05 (uncorrected)
Figure 28. Whole brain axial slice results (inferior-superior) from direct comparisons between conditions for the Control group during SS Negative Images (Control –SS). The orange indicates contrast results from Cognitive Reappraisal – Passive Negative (CR - PN) for Sports Specific negative images. The blue indicates contrast results from Passive Negative - Cognitive Reappraisal (PN - CR) for Sports Specific negative images.

160
CONTROL: cognitive reappraisal IAPS - passive viewing IAPS.
Direct comparisons within the IAPS image set between Cognitive Reappraisal
and Passive Negative (CR IAPS – PN IAPS) revealed that during cued cognitive
reappraisal the left IFG (BA47/44), left parahippocampal gyrus, left SMA (BA 6),
and bilateral MTG (BA 20) were active (Figure 29, Table 11).
CONTROL: passive viewing IAPS - cognitive reappraisal IAPS.
During passive viewing of negative images, right VMPFC (BA 10), right DLPFC
(BA 46/9), the premotor cortex (BA 6), right SPL (BA 7), left PCC (BA 30), bilateral
middle occipital gyrys (BA 18,19), right parahippocampal gyrus, left cerebellum, and
right IT (BA 20) were active compared to the cued cognitive reappraisal of negative
IAPS images (PN IAPS – CR IAPS) (Figure 29, Table 11).
The results indicate that there was a difference between the natural response
of the control group to IAPS negative images and the cued cognitive reappraisal of
generalized challenge.

161
CR – PN
PN – CRp <0.05 (uncorrected)
Control - IAPS
Figure 29. Whole brain axial slice results (inferior-superior) from direct comparisons between conditions for the Control group during IAPS Negative Images (Control – IAPS). The orange indicates contrast results from Cognitive Reappraisal – Passive Negative (CR - PN) for IAPS negative images. The blue indicates contrast results from Passive Negative - Cognitive Reappraisal (PN - CR) for IAPS negative images.

162
Table 11. Results from direct comparisons between conditions for the Control group. Top panel indicates contrast results from the Cognitive Reappraisal of SS images – Passive Negative of SS images (CRSS -PNSS). The second panel indicates contrasts results for Passive Negative of SS images - Cognitive Reappraisal of SS images (PNSS - CRSS). Third panel indicates contrast results from the Cognitive Reappraisal of IAPS images – Passive Negative of IAPS images (CRIAPS - PNIAPS). Bottom panel indicates contrasts results for Passive Negative of IAPS images - Cognitive Reappraisal of IAPS images (PNIAPS - CRIAPS). Whole brain analysis reported at uncorrected threshold p<0.05 (marked without star). Red text signifies results from region of interest analysis (ROI) derived from Wake Forest anatomical mask. ROI analysis is adjusted for search volume, at an uncorrected threshold p<0.05 (marked without star).
Condition Region of Interest Analysis.
Overall the results support a specificity of self regulation, with the football
group only demonstrating amygdala and bilateral insula activity during generalized
negative events (IAPS) while the control group responded aversively to all negative
conditions (SS and IAPS).
Region of Interest (ROI) analyses for each condition relative to the neutral
baseline executed using anatomical masks generated by the Wake Forest Pick Atlas.
Volume in Voxels MNI coordinates x, y, z t values Volume in Voxels MNI coordinates x, y, z t valuesDMPFC 8 11 -2 52 46 1.97
IFG 44 22 -56 14 12 1.75IFG 47 36 -50 28 -12 2.27
Insula 13 17 32 -16 26 1.93Precentral Gyrus 4 69 -48 -8 44 2.12SMA/Premotor 6 426 -4 8 70 3.34
MTG 21 91 50 -34 0 2.51Supramarginal Gyrus 40 16 -48 -50 22 1.86
Caudate -- 27 -2 2 20 2.01Pulivinar -- 128 -4 -32 6 2.15 128 12 -32 4 1.9
VLPFC 10 4 40 58 -4 1.74
Insula 13 3 -38 -18 2 1.73 2 42 -16 10 1.81Postcentral Gyrus 2 3 56 -28 56 1.8
SPL 7 100 42 -62 54 1.91IPL 40 34 50 -40 54 1.83
Cerebellum -- 17 14 -58 -32 1.97
IFG 47 17 -54 20 -6 1.97
IFG 44 6 -56 14 8 1.69SMA/Premotor 6 232 -2 4 68 2.34
MTG 20/21 100 -54 -38 -6 2.14 20 54 -36 -4 1.83Parahippocampal Gyrus -- 25 -22 -12 -26 2.06
DLPFC 46 25 50 40 28 1.83
DLPFC 9 2 2 62 34 1.71VMPFC 10 26 2 62 8 1.89Premotor 6 1 12 36 60 1.71
IT 20 1 52 -50 -12 1.68SPL 7 112 32 -58 42 2.34
MOG 18/19 28 -34 -90 0 1.94 41 42 -62 16 1.85Parahippocampal Gyrus -- 2 36 -24 -20 1.88
PCC 30 34 -18 -54 16 2.21Cerebellum 6 -34 -58 -10 1.73
CRSS - PNSS
PNSS - CRSS
CR IAPS - PN IAPS
PN IAPS - CR IAPS
CO
NT
RO
L
RightGroup Contrast Conditions Region BA
Left

163
The ROIs examined were based on a priori theoretical predictions of areas sensitive
to cognitive and affective processing (PFC, amygdala and insula). Multiple
comparison corrections of the ROIs were done using Family Wise Error (FWE)
thresholded at p<0.05 unless otherwise noted.
Prefrontal cortex.
FOOTBALL: cognitive reappraisal Sport-Specific – neutral baseline contrast.
When engaged in cued cognitive reappraisal of SS negative events the football
group demonstrated similar patterns of activation to that when responding naturally to
SS challenge. In the PFC, there was significant activation in the bilateral DLPFC (BA
46/9) (right region survived FDR correction p<0.05), bilateral DMPFC (BA 8) right
region survived FDR correction p<0.05), bilateral VLPFC (BA 45/10) right region
survived FDR correction p<0.05), left IFG (BA 47) and left lateral OFC (BA11)
(Figure 30, Table 12).
FOOTBALL: passive negative Sport-Specific – neutral baseline contrast.
When challenged with SS negative events the football group naturally
demonstrates significant activation in the bilateral DLPFC (BA 46/9), bilateral
DMPFC (BA 8), bilateral VLPFC (BA 45/10), bilateral IFG (BA 47) (right IFG only
survives FDR correction p<0.05) and bilateral lateral OFC (BA11). In addition

164
VMPFC (BA10) was active bilaterally at a more liberal statistical threshold (p<0.005
uncorrected) (Figure 30, Table 12).
CR
-S
S
IFG (BA 47)
OFC (BA 11)
VPFC (BA 10/45)
DMPFC (BA 8)
DLPFC (BA9)
DLPFC (BA 46)
p<0.001 (k=5, uncorrected)
Football
PN
-S
S
Figure 30. Football group ROI analysis results for the PFC during the SS conditions relative to the neutral baseline. Cognitive Reappraisal of SS images (CR - SS); Passive viewing of Negative SS images (PN –SS).
FOOTBALL: cognitive reappraisal IAPS – neutral baseline contrast.
Examination of the cued cognitive reappraisal of generalized negative images
revealed numerous differences between natural response and instructed emotion
regulation of the football group. In the PFC, significant activation was revealed in the
bilateral DLPFC (BA 46/9), bilateral DMPFC (BA 8), bilateral VLPFC (BA 45/10),

165
bilateral IFG (BA 47) (right IFG only survives FDR correction p<0.05) and bilateral
lateral OFC (BA11) (Figure 31, Table 13).
FOOTBALL: passive negative IAPS- neutral baseline contrast.
When viewing generalized negative images (IAPS) the football group
naturally responded with significant activation in the left DLPFC (BA46)
(uncorrected p<0.002), left DMPFC (BA 8), bilateral VLPFC (BA 45/10) (right
hemisphere p<0.004, uncorrected), left IFG (BA47) and bilateral lateral OFC (BA 11)
(right hemisphere FDR corrected p<0.05) (Figure 31, Table 13).
IFG (BA 47)
OFC (BA 11)
VPFC (BA 10/45)
DMPFC (BA 8)
DLPFC (BA9)
DLPFC (BA 46)
p<0.001 (k=5, uncorrected)
Football
CR
-IA
PS
PN
-IA
PS
Figure 31. Football group ROI analysis results for the PFC during the IAPS conditions relative to the neutral baseline. Cognitive Reappraisal of IAPS images (CR - IAPS); Passive viewing of Negative IAPS images (PN – IAPS).

166
CONTROL: cognitive reappraisal Sport-Specific - neutral baseline contrast.
During cued emotion regulation of SS negative images the control group
demonstrated significant activation in the bilateral DLPFC (BA 46/9), bilateral
DMPFC (BA 8), bilateral VLPFC (BA 45/10), right VMPFC (BA10) (FDR
correction p<0.05), bilateral IFG (BA 47), bilateral lateral OFC (BA11) and bilateral
medial OFC (BA11) (left hemisphere, FDR correction p<0.05) (Figure 32, Table 14).
CONTROL: passive negative Sport-Specific - neutral baseline contrast.
When challenged with SS negative images the control group naturally
demonstrated significant activation in the bilateral DLPFC (BA 46/9), bilateral
DMPFC (BA 8), bilateral VLPFC (BA 45/10), right VMPFC (BA10), bilateral IFG
(BA 47), bilateral lateral OFC (BA11) (left hemisphere, FDR correction p<0.05) and
bilateral medial OFC (BA11) (left hemisphere, FDR correction p<0.05) (Figure 32,
Table 14).

167
CR
-S
S
IFG (BA 47)
OFC (BA 11)
VPFC (BA 10/45)
DMPFC (BA 8)
DLPFC (BA9)
DLPFC (BA 46)
p<0.001 (k=5, uncorrected)
Control
PN
-S
S
Figure 32. Control group ROI analysis results for the PFC during the SS conditions relative to the neutral baseline. Cognitive Reappraisal of SS images (CR - SS); Passive viewing of Negative SS images (PN –SS).
CONTROL: cognitive reappraisal IAPS– neutral baseline contrast.
During the instructed emotion regulation task during generalized negative
events, the control group demonstrated significant activation in the PFC in the
bilateral DLPFC (BA 46/9), bilateral DMPFC (BA 8), bilateral VLPFC (BA 45/10),
right VMPFC (BA10) (FDR correction p<0.05), bilateral IFG (BA 47), bilateral
lateral OFC (BA11) and bilateral medial OFC (BA11) (FDR corrected p<0.05)
(Figure 33, Table 15).

168
CONTROL: passive negative IAPS – neutral baseline contrast.
The control group demonstrated significant activation in the PFC during the
passive response to generalized negative images. Specifically the bilateral DLPFC
(BA 46/9), bilateral DMPFC (BA 8), bilateral VLPFC (BA 45/10), bilateral VMPFC
(BA10) (left hemisphere, FDR correction p<0.05), bilateral IFG (BA 47), bilateral
lateral OFC (BA11) and bilateral medial OFC (BA11) were significantly active
(Figure 33, Table 15).
CONT Pas NegIAPS
IFG (BA 47)
OFC (BA 11)
VPFC (BA 10/45)
DMPFC (BA 8)
DLPFC (BA9)
DLPFC (BA 46)
p<0.001 (k=5, uncorrected)
Control
CR
-IA
PS
PN
-IA
PS
Figure 33. Control group ROI analysis results for the PFC during the IAPS conditions relative to the neutral baseline. Cognitive Reappraisal of IAPS images (CR - IAPS); Passive viewing of Negative IAPS images (PN – IAPS).

169
Insula and amygdala.
FOOTBALL: cognitive reappraisal Sport-Specific – neutral baseline contrast.
The football group demonstrated significant left lateralized activation in the
insula and no amygdala activation during the cued cognitive reappraisal of SS
challenge (Figures 34 and 35, Table 12).
FOOTBALL: passive negative Sport-Specific – neutral baseline contrast.
The insula demonstrated significant left lateralized activation and no
amygdala activation during the natural response of football group to sports specific
challenge (Figures 35 and 36, Table 12).
FOOTBALL: cognitive reappraisal IAPS- neutral baseline contrast.
During the cued cognitive reappraisal of generalized negative images (IAPS)
the football group demonstrated bilateral amygdala activation (left p <0.008, right
p<0.014, uncorrected) and the bilateral insula activation (right hemisphere FDR
corrected p<0.05) (Figures 34 and 35, Table 13).

170
FOOTBALL: passive negative IAPS- neutral baseline contrast.
The football group demonstrated bilateral insula activation (right hemisphere
p<0.004, uncorrected) and no amygdala activation during the natural response to
generalized negative images (IAPS) (Figures 34 and 35, Table 13).
CONTROL: cognitive reappraisal Sport-Specific - neutral baseline contrast.
During the cued cognitive reappraisal of SS negative images, the insula
demonstrated significant bilateral activation and the bilateral amygdala was also
active (right amygdala p<0.012, uncorrected) (Figures 34 and 35, Table 14).
CONTROL: passive negative Sport-Specific-neutral baseline contrast.
During the passive response of the control group to SS challenge, the insula
demonstrated significant bilateral activation and left amygdala was active (p<0.012,
uncorrected) (Figures 34 and 35, Table 14).
CONTROL: cognitive reappraisal IAPS– neutral baseline contrast.
In the control group, during the cued cognitive reappraisal of IAPS images the
insula demonstrated significant bilateral activation and amygdala demonstrated
significant bilateral activation (Figures 34 and 35, Table 15).

171
CONTROL: passive negative IAPS – neutral baseline contrast.
The insula demonstrated significant bilateral activation and significant
bilateral amygdala activation was evident during the natural response of the control
group to generalized negative challenge (IAPS) (Figures 34 and 35, Table 15).
Con
trol
Foo
tbal
l
PN-IAPSCR-IAPSCR-SS PN-SS
p<0.001 (k=5, uncorrected)
Figure 34. ROI results for the insula (BA 13) for the Control and Football group during all conditions (relative to the neutral baseline). Cognitive Reappraisal of SS images (CR - SS); Passive viewing of Negative SS images (PN – SS). Cognitive Reappraisal of IAPS images (CR - IAPS); Passive viewing of Negative IAPS images (PN – IAPS).

172
Con
trol
Foo
tbal
l
CR-IAPSCR-SS PN-SS PN-IAPS
p<0.01 (k=5, uncorrected)Figure 35. ROI results for the amygdala for the Control and Football group during all conditions (relative to the neutral baseline). Cognitive Reappraisal of SS images (CR - SS); Passive viewing of Negative SS images (PN – SS). Cognitive Reappraisal of IAPS images (CR - IAPS); Passive viewing of Negative IAPS images (PN – IAPS).
Table 12. ROI results for the Football Group for each Sports Specific condition relative to the neutral baseline. ROIs are derived from Wake Forest anatomical mask and adjusted for search volume. Top panel: Passive response to SS negative images (Passive Negative Sports Specific (PNSS) – Neutral Baseline (NB)). Bottom panel: cognitive reappraisal of SS negative images (Cognitive Reappraisal SS (CRSS) – Neutral Baseline (NB)). Multiple comparison corrections of the ROIs were done using Family Wise Error (FWE) thresholded at p<0.05 (marked as **), False Detection Rate (FDR) corrected at p<0.05 (marked as *), and uncorrected p values are reported (no star).
Volume in Voxels MNI coordinates x, y, z t values Uncorrected P value Volume in Voxels MNI coordinates x, y, z t values Uncorrected P valueDLPFC 46 51 -54 30 24 4.59** 66 58 26 30 4.12**
DLPFC 9 46 -50 28 34 4.85** 220 60 12 34 4.43**DLPFC 8 2 -48 16 48 3.01*DMPFC 8 70 -16 44 54 5.52** 6 4 18 48 3.74**VLPFC 45 45 -34 24 6 4.25** 62 58 12 22 4.13**VLPFC 10 7 -22 58 -6 2.95 0.002VMPFC 10 5 -10 58 -8 2.78 0.003 13 8 68 12 2.66 0.005
IFG 47 83 -36 22 0 4.73** 9 30 32 -20 2.93*LOFC 11 32 -46 44 -10 4.81** 5 44 48 -14 3.73**
INSULA 13 183 -34 20 6 4.88**
DLPFC 46 10 -54 30 24 4.19** 1 58 26 28 3.13*
DLPFC 9 37 -52 26 36 5.25** 30 60 16 30 3.32*DLPFC 8 1 -50 22 42 3.2*DMPFC 8 27 -4 16 48 4.94** 4 4 18 48 3.41*VLPFC 45 16 -54 26 24 3.79** 31 56 12 22 3.19*VLPFC 10 2 26 58 -8 2.55 0.006
IFG 47 35 -48 44 -10 3.87**LOFC 11 29 -46 44 -10 3.92**
INSULA 13 123 -38 20 0 3.66 0.001
PNSS - NB
CRSS - NB
FO
OT
BA
LL
BALeft Right
Group Contrast Conditions Region

173
Table 13. ROI results for the Football Group for each IAPS condition relative to the neutral baseline. ROIs are derived from Wake Forest anatomical mask and adjusted for search volume. Top panel: passive response to IAPS negative images (Passive Negative IAPS (PN IAPS) – Neutral Baseline (NB)). Bottom panel: cognitive reappraisal of IAPS negative images (Cognitive Reappraisal IAPS (CR IAPS) – Neutral Baseline (NB)). Multiple comparison corrections of the ROIs were done using Family Wise Error (FWE) thresholded at p<0.05 (marked as **), False Detection Rate (FDR) corrected at p<0.05 (marked as *), and uncorrected p values are reported (no star).
Table 14. ROI results for the Control Group for each SS condition relative to the neutral baseline. ROIs are derived from Wake Forest anatomical mask and adjusted for search volume. Top panel: passive response to SS negative images (Passive Negative SS (PNSS) – Neutral Baseline (NB)). Bottom panel: cognitive reappraisal of SS negative images (Cognitive Reappraisal SS (CRSS) – Neutral Baseline (NB)). Multiple comparison corrections of the ROIs were done using Family Wise Error (FWE) thresholded at p<0.05 (marked as **), False Detection Rate (FDR) corrected at p<0.05 (marked as *), and uncorrected p values are reported (no star).
Volume in Voxels MNI coordinates x, y, z t values Uncorrected P value Volume in Voxels MNI coordinates x, y, z t values Uncorrected P valueDLPFC 46 8 -54 30 24 2.91 0.002
DMPFC 8 12 -4 16 48 4.33**VLPFC 45 38 -40 20 4 3.6** 12 56 10 22 2.73 0.004VLPFC 10 6 -22 58 -6 2.82 0.003 3 24 58 -8 2.68 0.004
IFG 47 220 -48 26 -12 4.57**LOFC 11 42 -46 44 -10 4.08** 5 44 46 -14 2.89*
INSULA 13 280 -34 20 8 3.81** 105 42 -2 8 2.68 0.004
DLPFC 46 64 -54 30 24 6.42** 12 60 22 28 3.09*
DLPFC 9 415 -50 28 34 6.25** 195 62 14 26 4.08**DLPFC 8 88 -48 16 48 4.88** 40 48 8 46 3.09*DMPFC 9 26 -6 28 36 3.16*DMPFC 8 113 -4 16 48 6.64** 52 4 18 48 4.79**VLPFC 45 216 -54 26 24 5.89** 67 64 12 20 4.97**VLPFC 10 29 -32 50 28 3.6 0.001 8 26 58 -8 3.11 0.001LOFC 11 47 -46 44 -10 6.8** 15 46 44 -14 4.98**
IFG 47 474 -48 26 -12 6.59** 35 48 42 -14 4.39**INSULA 13 583 -40 16 -2 6.41** 93 36 20 6 3.44*
AMYGDALA -- 65 -22 -4 -14 2.48 0.008 29 30 -4 -18 2.23 0.014
Group Contrast Conditions BALeft Right
Region
PN IAPS -NB
CR IAPS - NB
FO
OT
BA
LL
Volume in Voxels MNI coordinates x, y, z t values Uncorrected P value Volume in Voxels MNI coordinates x, y, z t values Uncorrected P valueDLPFC 46 1 -54 28 30 4.99** 152 58 30 18 6.65**
DLPFC 9 392 -44 12 32 5.96** 472 50 10 36 5.71**DLPFC 8 51 -54 10 42 4.24** 113 50 8 42 4.93**DMPFC 9 44 -8 26 36 3.86** 48 10 26 36 3.6*DMPFC 8 336 -6 16 48 5.88** 295 6 14 54 6.4**VLPFC 45 208 -30 24 6 5.66** 226 58 28 20 6.46**VLPFC 10 5 -32 50 28 4.03** 7 44 54 -4 4.34**VMPFC 10 17 4 58 -8 4.08**
IFG 47 387 -30 20 -4 5.81** 344 42 18 0 5.29**LOFC 11 4 -44 48 -14 3.42* 39 44 34 -14 4.17**MOFC 11 3 -2 40 -24 3.66* 9 4 60 -10 4.04**
INSULA 13 310 -30 24 2 6.22** 295 42 18 0 5.29**AMYGDALA -- 36 -16 -6 -16 2.3 0.012
DLPFC 46 42 -54 28 24 5.21** 87 58 30 18 6**
DLPFC 9 404 -44 12 32 6.33** 382 50 4 38 4.93**DLPFC 8 78 -52 12 42 5.41** 74 50 8 42 4.52**DMPFC 9 43 -8 26 36 4.52** 30 10 26 34 4.11**DMPFC 8 368 -6 16 48 6.31** 328 6 14 54 6.49**VLPFC 45 212 -56 18 6 6.05** 223 58 28 20 6.06**VLPFC 10 45 -30 46 26 4.7**VMPFC 10 7 4 58 -8 3.63*
IFG 47 385 -42 28 -8 7.26** 345 50 22 -8 5.84**LOFC 11 7 -44 34 -14 4.7** 12 44 34 -14 4.45**MOFC 11 1 -4 58 -12 3.43* 2 4 60 -10 3.58**
INSULA 13 396 -30 24 4 5.69** 304 42 16 -2 4.99**AMYGDALA -- 80 -18 -4 -16 3.04** 37 18 -8 -14 2.3 0.012
BALeft Right
PNSS - NB
CRSS - NB
CO
NT
RO
L
Group Contrast Conditions Region

174
Table 15. ROI results for the Control Group for each IAPS condition relative to the neutral baseline. ROIs are derived from Wake Forest anatomical mask and adjusted for search volume. Top panel: passive response to IAPS negative images (Passive Negative IAPS (PN IAPS) – Neutral Baseline (NB)). Bottom panel: cognitive reappraisal of IAPS negative images (Cognitive Reappraisal IAPS (CR IAPS) – Neutral Baseline (NB)). Multiple comparison corrections of the ROIs were done using Family Wise Error (FWE) thresholded at p<0.05 (marked as **), False Detection Rate (FDR) corrected at p<0.05 (marked as *), and uncorrected p values are reported (no star).
Discussion
Previous investigations of performance under stress have focused primarily on
behavioral outcomes (Hancock & Szalma, 2008), but it is unclear if those who have
demonstrated stress resilience (superior performance under pressure) exhibit a
specific pattern of neural responses characterized by adaptive cognitive self
regulation. The study attempted to reveal the specific nature of the proactive
countermeasures to stress that allows individuals to adapt, perform effectively and in
some situations derive positive effects for affective challenge. Consistent with
predictions the elite athletes were less perturbed by emotional challenge within their
domain of experience. Furthermore, the direct comparison between the sport specific
conditions indicates that through experience, these individuals automatically engage
Volume in Voxels MNI coordinates x, y, z t values Uncorrected P value Volume in Voxels MNI coordinates x, y, z t values Uncorrected P value
DLPFC 46 106 -54 28 24 6.78** 165 58 30 18 6.76**
DLPFC 9 436 -44 10 32 7.09** 6 38 4 30 2.96**DLPFC 8 111 -54 12 42 5.59** 100 52 6 42 4.84**DMPFC 9 1 -8 26 36 4.37**DMPFC 8 388 -4 36 50 6.4** 290 6 14 54 6.69**VLPFC 45 216 -54 26 24 6.21** 226 58 28 20 6.71**VLPFC 10 94 -32 50 28 4.58** 38 36 60 20 3.19*VMPFC 10 112 -4 62 30 3.6* 76 4 58 -8 4.2**
IFG 47 484 -42 28 -8 7.38** 434 44 18 0 5.63**LOFC 11 37 -44 34 -14 5.33** 27 42 34 -14 4.12**MOFC 11 6 -4 40 -24 3.79** 13 4 60 -10 4.32**
INSULA 13 633 -30 24 2 6.51** 451 42 18 0 5.6**AMYGDALA -- 139 -18 -4 -18 4.81** 141 18 -8 -16 3.44**
DLPFC 46 81 -54 28 24 5.96** 87 58 30 18 6.07**
DLPFC 9 445 -52 10 38 6.76** 341 50 4 40 4.63**DLPFC 8 113 -52 12 42 5.93** 44 52 6 46 4.46**DMPFC 9 336 -8 26 36 4.98** 49 10 26 34 4.44**DMPFC 8 391 -2 14 56 6.88** 274 4 14 56 6.52**VLPFC 45 216 -56 18 6 7.95** 226 58 28 18 6.05**VLPFC 10 80 -30 46 26 5.96**VMPFC 10 2 4 58 -8 3.21*
IFG 47 477 -44 28 -8 9.66** 396 48 24 -12 6.77**LOFC 11 44 -44 34 -14 7.21** 32 44 34 -14 5.43**MOFC 11 3 -24 52 -12 3.42* 6 4 60 -10 3.37*
INSULA 13 708 -30 24 2 7.16** 367 42 18 0 5.24**AMYGDALA -- 161 -20 -4 -18 5.77** 143 30 -4 -18 3.29**
PN IAPS -NB
CR IAPS - NB
CO
NT
RO
L
Group Contrast Conditions Region BALeft Right

175
in mental transformation of an emotional event such that the negative consequences
are attenuated (use a cognitive reappraisal strategy), supporting the domain specific
model of emotion regulation. This suggests that such resilient individuals
automatically engage in cognitive control and that resilience is not simply the absence
of maladaptive changes that occur in vulnerable individuals, rather, it is mediated by
a unique set of adaptive changes (Feder, et al., 2009).
In addition the results also suggest that a great deal of individual variation in
the response to challenge may be a consequence of the perception/interpretation of
the event rather than the actual environmental stressor; and the perception is highly
related to the individual’s experience, training, and background. This is consistent
with the transactional model of stress (Staal, 2004) and the interactional model of
competitive stress (Endler & Kocovski, 2001). Our results also reveal an experience
dependent “coping” ability to specific stressful challenges that is congruent with a
cognitive reappraisal strategy in the resilient group. This may have developed as a
mean of prohibiting a state were behavior is completely controlled by emotion
(anxiety, panic, and anger have a steering precedence, focusing attention and
interfering with processing of task information) (Hancock & Szalma, 2008).
Nonetheless, this endogenous emotion regulation is lost when elite athletes are
challenged with generalized negative events, supporting the domain specific model of
emotion regulation.

176
Direct Comparisons Cognitive Reappraisal - Passive Negative.
Football group – Sport-Specific.
The results support the predictions that the cognitive reappraisal strategy is
spontaneously utilized by elite athletes during domain specific challenge. Direct
comparison reveal no significant difference in the PFC, amygdala and insula between
the natural response of the football group to sports specific negative challenge and
cued cognitive reappraisal of sports specific negative events. The left supramarginal
gyrus (BA 40), the left STG (BA 38) and the left premotor cortex (BA 6) were more
active during the cued cognitive regulation condition compared to the natural
response, suggesting that instructed transformation of negative events into more
positive terms may have required greater processing of regions involved in action
observation (Lawrence et al., 2006) and self regulation associated with aversive social
events (Koenigsberg et al., 2010). This is not surprising considering the nature of the
sports specific images which often depicted situations of action execution (tackle) and
social exchange (coach yelling at player).
Our findings extend previous work that indicate cognitive reappraisal relative
to other emotion regulation approaches (i.e., expressive suppression (Goldin et al.,
2008), distraction (McRae et al., 2010), cognitive load (Van Dillen et al., 2009)) may
be a particularly adaptive response to affective challenge (see (Gross & Thompson,
2007) for a review). This mental profile to cope with stressful events is automatically
utilized by elite athletes and in turn may promote flexible thinking, goal oriented

177
behavior, and decision making agility; all processes disrupted by acute stress
(Hancock & Szalma, 2008). In addition, these findings are congruent with other
works examining the neural processes involved in the automaticity of self regulation
in individuals who score high psychometric inventories of cognitive reappraisal
(Drabant et al., 2009) and agreeableness (Haas, Omura, Constable, & Canli, 2007).
Football group – IAPS: prefrontal cortex.
When examining the football group’s response to generalized negative images
they demonstrated activation in the DLPFC (BA 8,9, 46), the DMPFC (BA8), VLPFC
(BA10/45), right VMPFC (BA 10), left IFG (BA47), OFC (BA11), and the ACC (BA
32), during cued cognitive reappraisal compared to nature response condition
(Passive Negative IAPS). These findings are consistent with studies that have
examined the down regulation of negative emotion using a cognitive reappraisal
strategy (Ochsner et al., 2002). In particular the DLPFC is associated with a situation-
focused reappraisal, indicative of emotional modulation of external information
which does not have a personal relevance (Ochsner, et al., 2004). In a similar
reappraisal task, the VLPFC was associated with inference control and behavioral
inhibition (Ochsner, et al., 2004). The DMPFC is also a critical region in the
execution of cognitive reappraisal, involved in emotional awareness and self-related
processes(Ochsner, et al., 2002), while the VMPFC is a region that has been linked
with extinction learning and fear reduction during cognitive inhibition (Phelps &
LeDoux, 2005). The ACC is involved in behavioral inhibition and acts as a critical

178
control region, although there is evidence that this region also plays an important role
in affective processing, thus acting as a integrative interface between cognition and
emotion (this functional attribute is also shared by the VMPFC and OFC) (Pessoa,
2008). Lastly, the OFC and inferior IFG are prefrontal regions that act in emotional
processing and show strong reciprocal connections to the basolateral complex of the
amygdala (Pessoa, 2008). Thus the football group appears similar to a typical
population during the cued cognitive reappraisal of generalized negative events.
Football group – IAPS: regions beyond the prefrontal cortex.
In addition to activation in the PFC, the direct comparison between cognitive
reappraisal and passive viewing of negative images revealed more posterior patterns
of activation in the football group during generalized negative images (IAPS). The
premotor cortex (Shamay-Tsoory et al., 2005), MTG (Critchley et al., 2000), STG
(Lawrence et al., 2006), and postcentral gyrus (Adolphs, Damasio, Tranel, Cooper, &
Damasio, 2000) are cortical regions which showed activation and are critical to social
cognition, and empathic response to emotional events; in other words, emotional
processing. Thus, this suggests that although the football group demonstrates
prefrontal activation during the cognitive reappraisal of IAPS images (compared to
the natural response to IAPS images) that there are regions sensitive to affective
processing also engaged. Congruent with this notion, the lentiform nucleus (Adolphs,
2002) the parahippocampal gyrus (Kilpatrick & Cahill, 2003), and insula (Carretie et
al., 2009) were also active during this comparison (CR IAPS - PN IAPS) indicative of

179
emotional recognition of visual events. In summary the results suggest a specificity of
adaptive emotion regulation, since examination of the generalized negative images
revealed a coupling between affective and cognitive regions possibly indicative of
less agility with affective control during unfamiliar events.
Control Group – Sport-Specific and IAPS.
Unlike the football group, in which the direct comparisons between cognitive
reappraisal and passive negative reveal unique patterns of response for sports specific
(very little difference between cued cognitive reappraisal and the natural response)
and IAPS (greater prefrontal activation during cued emotion regulation in addition to
heighted posterior processing in regions sensitive to social cognition and affective
processing) stimuli, the control group demonstrates a very stable response across
stimulus types. Specifically, in the control group, direct comparisons of Cognitive
Reappraisal and Passive Negative revealed similar activation in the IFG, SMA, and
MTG (independent of stimulus type). The IFG is involved in evaluating the
implications of negative events and recently was implicated in emotion regulation
during a gambling task (Beer et al., 2006). The premotor cortex, in the context of
emotional processing, is a component of a network reportedly involved in the
simulation of affective information during empathic response (understanding the
distress of others) (Shamay-Tsoory et al., 2005). This suggests that during cued
emotion regulation, the control group may have been still affectively perturbed by
these images independently of the domain, whereas the football group demonstrates a

180
domain specific management of emotional processing. Lastly, the MTG is a region
sensitive to facial processing, modulated by top down attentional input (Critchley et
al., 2000), thus this ubiquitous findings in this region may be due to attentional effort
in the control population. In summary, the control group approaches the negative
events, independently of domain, in relatively stable manner, showing no specificity
of emotion regulation. Thus, the learned adaptive response of the football players is
unique since the control group appears demonstrated a generalized response
regardless of challenge.
Similarities between the Football and Control Group.
Activations during cognitive reappraisal.
Interestingly the football group and control group do share similar patterns of
activation in the more posterior regions when the football group is engaged the
cognitive reappraisal of IAPS images (relative to passive negative IAPS). The control
group demonstrated activation in the DMPFC (SS), Primary Motor cortex (SS),
supramarginal gyrus (SS), caudate (SS), pulivinar (SS), the insula (SS) and the
parahippocampal (IAPS). The football group also demonstrated activation in parietal,
insula, basal ganglia and parahippocampal regions possibility suggesting an inability
to effectively manage affective response during generalized challenge.

181
Deactivation during cognitive reappraisal.
In addition to examine regions that were more active during cued cognitive
reappraisal (compared to passive negative); there were regions that showed
deactivation during cued cognitive reappraisal. Remarkably, the football group did
not reveal deactivations during sports specific images, but during IAPS challenge,
there was deactivation in the left DMPFC (BA 10). The control group also
demonstrated deactivations in the right VLPFC (BA 10) during negative sports
specific images and the right VMPFC (BA 10), right DLPFC (BA 46/9) during
negative IAPS images. The pattern that emerges is an attenuation of cognitive
recruitment in the PFC for the control group during all conditions and during the
IAPS condition for the football group (Chambers, et al., 2006). In addition, other
regions such as the left MTG (BA 21), left STG (BA 38), and right motor cortex
(BA 4) (Football Group, IAPS images), bilateral insula (BA13), right cerebellum,
right postcentral gyrus (BA 2), right SPL (BA 7), and right IPL (BA 40) (Control
Group, SS images) and the premotor cortex (BA 6), right SPL (BA 7), left PCC (BA
30), bilateral middle occipital gyrys (BA 18,19), right parahippocampal gyrus, right
cerebellum, and right IT (BA 20) (Control Group, IAPS images) were congruent with
emotional modulatory whole brain networks (Damasio, et al., 2000). Thus the results
support the notion that during cued cognitive reappraisal of IAPS images the football
group appeared more similar to the control group supporting a situational specificity
of the football group’s adaptive response.

182
Condition Region of Interest Analysis.
Our results from the direct comparison between cognitive reappraisal and the
natural response to negative challenge support the domain specific model of emotion
regulation in competitive athletes. Nonetheless, this direct comparison only indicates
a lack of difference between the cued cognitive reappraisal of sports specific negative
events and the natural response of the football group to the same type of challenge. It
is thus important to examine each condition (Cognitive Reappraisal SS, Passive
Negative SS, Cognitive Reappraisal IAPS, Passive Negative IAPS, each relative to
neutral baseline) in each group to understand the pattern of activation which accounts
for the differences (or lack of differences) observed in the direct comparisons.
Therefore, examination of theoretically relevant regions of interest is critical to
understand the specificity of the endogenous self regulation of the football group to
sports specific challenge was executed.
Football – Sport-Specific.
Examination of the PFC results from the present study revealed the similarity
of processing during the cued emotion regulation and natural response to sports
specific challenge with the football group. The bilateral DLPFC (BA 46/9), bilateral
DMPFC (BA 8), bilateral VLPFC (BA 45/10), bilateral IFG (BA 47) and bilateral
lateral OFC (BA11) were active during both conditions (passive response to SS and
cognitive reappraisal to SS). In addition, during both conditions the insula was left

183
lateralized. This pattern of left lateralized insula activation may be an index of an
adaptive response to stressful challenge since the literature shows it preserves
executive processing (emotional interference resolution aids conflict resolution in
working memory) (Levens & Phelps, 2010) and is associated with lower emotional
susceptibly (reduced emotion vulnerability) (Iaria et al., 2008). Importantly, the
amygdala was not present during both conditions (cognitive reappraisal of SS, passive
negative SS) suggesting that non-essential networking was attenuated to maintain an
adaptive state in competitive sports situations. Thus, consistent with predictions, the
amygdala, which is highly connected to cortical regions (Pessoa, 2008), responds in
an attenuated manner during domain specific challenge, thereby promoting the ability
to maintain psychomotor efficiency in the football group under stress. In summary,
this descriptive comparison indicates that individuals who excel in sport competitive
reveals an experience-dependent automaticity of cognitive reappraisal exposing a
critical component of their resiliency to stress; elite athletes appear to experience less
negative emotion and in turn avoid maladaptive physiological responding.
Football- IAPS.
Interestingly, this pattern of similarity between the natural response and the
cued cognitive reappraisal is lost during the IAPS images, with the natural response
of the football players, resulting in left DLPFC, left DMPFC (BA 8), bilateral VLPFC
(BA 45/10), left IFG (BA47) and bilateral lateral OFC (BA 11) activation but during
the cued cognitive reappraisal more bilateral patterns are evident: DLPFC (BA 46/9),
184
DMPFC (BA 8), VLPFC (BA 45/10), IFG (BA 47) and bilateral OFC (BA11). Thus
not only do the patterns of activation appear distinct during the cued cognitive
reappraisal of IAPS images, but they also appear more similar to the patterns
observed in the control group during cued cognitive reappraisal (independent of
stimulus type). Furthermore during the generalized negative image conditions
(Cognitive Reappraisal IAPS, Passive Negative IAPS), the football group no longer
shows the adaptive left lateralization of the insula but instead bilateral patterns are
evident, similar to what is seen in the control group during all conditions.
Consequently the adaptive response identified above is specific to domain of
experience. The right insula plays an essential role in increasing attention to self-
generated emotion (Straube & Miltner, 2010) and is associated with high emotionally
susceptibility (Iaria, et al., 2008).
Thus, counter to the expectations that the cued emotion regulation of IAPS
images would attenuate the affective response, the results suggested that in the
resilient group, cognitive restructuring of generalized negative images may have
created a tendency to focus on and enhance the affective value of the event leading to
the maladaptive cognitive process of rumination (Ray et al., 2005). Rumination is
related to reappraisal since it requires cognitive operations that evaluate and maintain
alternative interpretations of events but the consequence is to focus on the negative
aspects and amplify the negative emotion (Ray, et al., 2005). Our results further
support this notion since the football group demonstrated amygdala activation during
the cued cognitive reappraisal of IAPS images. Interestingly this pattern does not
extend to the natural response of the football group to generalized negative events,

185
since during this condition the football group demonstrated efficient prefrontal
activation, and no amygdala regions were active. Nonetheless, this self regulation was
lost when the elite athletes had to cognitively restructure the meaning of the events
outside of their domain of experience, thus supporting the domain specific model of
emotion regulation.
Control SS and IAPS.
The control group revealed activation in the DLPFC (BA 46/9), bilateral
DMPFC (BA 8), bilateral VLPFC (BA 45/10), right VMPFC (BA10) (SS), bilateral
VMPFC (BA10) (IAPS), bilateral IFG (BA 47), bilateral lateral OFC (BA11) and
bilateral medial OFC (BA11) during the natural response to affective challenge
independent of stimulus type. Importantly the control group also demonstrated left
amygdala activation during SS challenges and bilateral amygdala activation during
IAPS challenge. In addition the instructed cognitive reappraisal of negative affective
challenge also revealed bilateral DLPFC (BA 46/9), bilateral DMPFC (BA 8),
bilateral VLPFC (BA 45/10), right VMPFC (BA10), bilateral IFG (BA 47), bilateral
lateral OFC (BA11) and bilateral medial OFC (BA11) and bilateral amygdala
activation independently of image type. These findings are on congruent with other
studies examining amygdala-frontal connectivity during emotion regulation. Banks
and colleagues reported amygdala-frontal coupling during cognitive reappraisal and
suggested that these interactions represented an enhancement of cognitive recruitment
due to the inability to down-regulate the amygdala activity (Banks et al., 2007). These

186
findings are not unique. The OFC and medial PFC are frequently reported as
demonstrating a positive correlation with amygdala activation (Heinzel et al., 2005;
New et al., 2007; Schmitz & Johnson, 2006). These regions are bidirectionally
connected to the amygdala and thus may serve as an emotion generation–regulation
circuit (Ghashghaei et al., 2007). Interestingly, Banks and colleagues also reported
differences in self report (with cued cognitive reappraisal results in lower negative
affect ratings compared to passively viewing) similar to our results and suggested that
this indicated that participants had successfully intended to self-regulate (Banks et al.,
2007).
The results suggest a less successful engagement of self regulation in the
control group relative to the football group since the control group shows activation
in the bilateral DLPFC, lOFC (cognitive control) but still showed mOFC, amygdala
and bilateral insula activation (affective response). In addition, compared to the
football group, the overall pattern observed in the control group shows a remarkable
degree of activation (with a greater spatial extent apparent in all regions), suggesting
that under situations of stress, a loss of neural processing efficiency. Interestingly,
both groups scored high on cognitive reappraisal and are not significantly different on
the emotion regulation questionnaire. This indicates that both the control and football
groups can be considered high reappraisers, which according to Gross & John, is a
relatively stable trait (Gross & John, 2003). Thus, although the control group may use
this adaptive emotion regulation, they are less successful in managing the
maladaptive physiological response (amygdala and insula) in many different

187
emotional contexts, whereas the football group demonstrates this trait primarily
during sports specific challenge.
Summary.
In summary, the results suggest that the football group processes sports
relevant affective information in an automatic manner that neutralized the negative
response (similar network patterns in the PFC for sports specific negative images,
with left lateralized insula, and no amygdala). When challenged with generalized
negative events, the football group appears to be more similar to the control group
(similar prefrontal networking, bilateral insula, and amygdala activation). In
conclusion, examination of elite athletes serves as an important model for revealing
the nature of the attenuation of stress introduced to central nervous system. This may
promote a more stable and controlled affective-cognitive motor response, which, in
turn, may explain how elite performers can achieve high levels of skill under stress.

188
Chapter 9: General Summary
There is a robust relationship between one’s emotional state and the ability to
effectively perform cognitive-motor skills. Elite performers must balance competing
task demands such as physical requirements (dexterity, force), physiological recovery
(metabolic rate, body temperature), psychological focus (memory, decision making),
etc. during high levels of performance (Andre, 2001). Critical to the orchestration of
adaptive responses to the challenge of competitive sport, is the management of the
emotional component of the task. Mental stress can lead to detrimental outcomes like
stat anxiety, burnout, exhaustion, strain, and tension, but it can also evoke adaptations
such as hardiness, resilience and resistance (Tepas & Price, 2001). Thus, these
divergent outcomes must be explained not only in terms of the nature of the stressor
but also in terms of the individual’s perception of the challenge. The transactional
model (Staal, 2004) predicts a high degree of specificity of the response to mental
stress based on an individual’s perception and appraisal of a stressful event. Thus, the
confluence of experience based-factors such as controllability, emotional coping
strategies, motivational efforts, trait/state anxiety and individual personality, in
addition to the qualities of the objective stressor, cumulatively interact to produce the
stress response.
The disruptive effects of stress on human performance have been understood
neurobiologically as a loss of neural processing efficiency (Eysenck & Calvo, 1992)
leading to hyperactivity of non-essential brain regions (van Galen & van Huygevoort,
2000) that interfere with the cognitive-motor task demands. Conceptualized as

189
“neuromotor noise,” this process affects cortical arousal and redistributes processing
resources away from those dedicated to the goal-directed behavior. From a
neurobiological perspective, state anxiety (i.e., negative appraisal accompanied by
elevated arousal) is coupled with increased amygdala activity, which, in turn,
influences numerous sensory and association cortical areas (Haines, 2006) creating
neuromotor noise.
The loss of neural processing efficiency caused by stress-induced neuromotor
noise can explain the phenomenon of “choking” or performance decline under
pressure (Beilock, 2010; Beilock & Carr, 2001). The EEG findings reported in the
first empirical paper support this claim, indicating that non-essential neuromotor
noise is manifested as an increase in complexity of cerebral cortical dynamics
(relative to a relaxed state) during a stressful cognitive-motor challenge. In turn, the
loss of neural efficiency translated into the quality of motor behavior resulting in an
increase in disfluency during the aiming movement. Mechanistically, mental stress
may increase limbic activity, in addition to the recruitment of non-essential
associative areas, resulting in increased cortico-cortical communication. Peripherally,
these central events can lead to a loss of motor coordination via compromised
reciprocal inhibition of agonist and agontagonist muscles (Hatfield & Kerick, 2007).
The loss in motor coordination, in turn, increases movement variability and reduces
the efficiency and smoothness in skeletal muscle performance leading to performance
decline under pressure.
Since stress perturbs the efficiency of neural processing and the quality of
motor behavior in non-experts as employed in study 1, then examination of experts

190
who have a history of high-quality performance during mental stress, may serve as
exemplars for understanding adaptive ways to mentally approach challenge.
However, in the literature, brain processes associated with skilled performance have
been mostly been examined in non-stress situations (Hatfield et al., 2004). In such
non-stressed venues, converging neuroimaging evidence suggests that experts require
less neuronal resources compared to novices to accomplish the same task (Deeny, et
al., 2009; Del Percio, Babiloni, Marzano, et al., 2009). These findings indicate that
experts attend to essential salient features of the task to maximize performance in a
manner that results in cortical (Hatfield, et al., 1984) refinement and effortless
action, which is understood as psychomotor efficiency ( Hatfield & Kerick, 2007).
Thus the maintenance of psychomotor efficiency under mental pressure may be a
hallmark of an adaptive response to stressful challenge.
To examine the validity of this reasoning we studied individuals actively
involved in high levels of sport since they provide exemplars of stress resilience and
superior motor performance. This population is not only highly skilled, but is able to
perform at high levels under variable and challenging psychological conditions. As
noted above, competitive stress produces an affective response in performers, which,
in turn, can affect the quality of behavior and intended action (Cerin & Barnett,
2009). Nonetheless, elite-level athletes are typically resilient to such stress
perturbation, enabling them to maintain a high level of performance during stressful
conditions. Importantly, the results from the second empirical paper reported that
efficiency in the motor domain (this is assumed due to the expert characteristics of the
cohort) extends to emotional domain. This, in turn, would promote an overall
191
refinement of cortical activity necessary for successful performance under mental
stress and allow for a greater capacity to handle stressful events (less neuromotor
noise).
Interestingly, the elite athletes demonstrate efficiency during both specific
(sport-specific) and generalized (IAPS) challenge. On speculation, this pattern may be
a consequence of repeated exposure to competitive stress, which can lead to active
coping strategies that would translate to an ubiquitous planning and problem solving
approach to challenge (Feder et al., 2009). Our results also support efficiency in brain
regions sensitive to social competence and understanding, which may promote
adaptive neural processing mediated by oxytocin (reduces fear response) (Feder et
al., 2009). In addition physical fitness is associated with altered behavioral and
neuromodulator responses to stressors (e.g. Disman, 1997). Lastly, genetic factors
could also contribute to adaptive responses to stress by way of mediating reward
circuits and protecting against depression (Vialou et al., 2010) and trait disposition to
anxiety (Canli, Ferri, & Duman, 2009). Our present design cannot address the
speculations identified here, but we examined one specific element of stress
resiliency, cognitive reappraisal.
Cognitive reappraisal is a cognitive-linguistic strategy that changes the
trajectory of emotional responses by reformulating the meaning of a situation such
that negative affect experience is reduced (Ochsner & Gross, 2008). The notion of
cognitive reappraisal is exemplified by the following examples: transforming the
scenario depicted into positive terms (e.g., woman crying outside of a church could be
alternatively interpreted as expressing tears of joy from a wedding ceremony rather

192
than of sorrow from a funeral) and rationalizing or objectifying the content of the
pictures (e.g., a woman with facial bruises could be translated as an actor wearing
makeup rather than a victim of domestic abuse) (McRae et al., 2010; Ochsner et al.,
2002; Ochsner & Gross, 2005; Ochsner & Gross, 2008; Ray, et al., 2005; Wager, et
al., 2008). Thus cognitive reappraisal serves 1) as a means for understanding the
qualities that contribute to the unique features of stress resilient population compared
to a representative sample population and 2) a critical reference for understanding
what stress resilient individuals do when responding naturally to stressful events.
Neuroimaging studies have examined this cognitive approach to mental stress
and have revealed that frontally mediated executive processes act to manage the
response of the amygdala and medial prefrontal regions (brain regions central to
emotional processing). This relationship has been characterized by a reciprocal
modulation model, which is based on a demonstrated inverse relationship between
affective and cognitive processes during emotional appraisal (Northoff et al., 2004).
This model implies that a cognitive interpretation of emotion-eliciting stimuli
effectively suppresses emotional responsivity in critical brain such that increased
activation in the lateral prefrontal region is associated with attenuated affective
processing.
Therefore, we examined if those who have demonstrated stress resilience
(superior performance under pressure) exhibit such a specific pattern of neural
responses characterized by this adaptive emotion regulatory strategy (cognitive
reappraisal). In addition, as stated earlier, the transactional model (Staal, 2004)
predicts a high degree of specificity of the stress response based on an individual’s

193
perception and appraisal of the stressful event. Consequently, an athlete may have
developed through experience and training a domain-specific reaction to stressful
challenge, which allows them to endogenously regulate their affective response to
familiar stressors. The third empirical paper supports the domain-specific model of
emotion regulation. The direct comparison between the sport specific conditions
(cued cognitive reappraisal and passive viewing of negative sport-specific images)
indicates that through experience, these individuals automatically engage in mental
transformation of an emotional event such that the negative consequences are
attenuated, i.e. they appear to endogenously engaged in cognitive reappraisal. This
equivalence of processing between the natural response to mental stress and cued
cognitive reappraisal is lost during the generalized negative events (IAPS images).
The results suggest that skilled performers who excel during competitive stress
engage in cognitive regulation in their domain of expertise, decreasing physiological
arousal thereby enabling them to sustain elevated performance.
Also critical to understanding the unique set of adaptive changes in elite
athletes, was the region of interest analysis during with which we examined the
prefrontal cortex (both lateral and medial regions), the amygdala and the insula
(regions critical to negative affective processing). The results support the direct
comparison findings, with similar network patterns in the prefrontal cortex revealed
during the natural response and cued cognitive reappraisal of sport-specific negative
images in athletes. In addition adaptive emotional control was found during sport-
specific challenge: left lateralized insula, and no amygdala activation. This pattern
was disrupted when the elite athletes were challenged with generalized negative

194
events (IAPS images), again supporting the specificity of successful emotion
regulation. This specificity suggests that emotion regulation promotes refinement of
brain activity resulting in an optimal state for effective task execution particularly
under conditions of known stressful challenge (i.e., sport competition). By
investigating a stress resilient population (elite athletes), this study provides an
assessment of the postulated dynamic between cognitive (prefrontal) and affective
(limbic and insula) brain networks as related to skilled motor performance. The data
reveal a neural processing efficiency during affective challenge in which elite athletes
are less perturbed by mental stress and suggests this may be a critical quality
contributing to their stress resilience. When examining the specific patterning of
neural processing during the natural response of the elite athletes to stressful
challenges, our data show that they demonstrate similar neural processes to those
used during cognitive reappraisal, but this is only within their domain of expertise.
What emerges is a generalized neural efficiency that appears to be a quality of
resiliency to promote a mental state where neuromotor noise is attenuated. However a
specific element of resiliency (i.e., automaticity of cognitive reappraisal) is dependent
on experience. In the context of performance, cognitive reappraisal, through
prefrontal regulation of the amygdala, may maintain an adaptive level of arousal to
promote a state of psychomotor efficiency during mental stress. The establishment of
this protocol as an effective means through which to probe the emotion regulatory
processes in elite groups, holds promise to facilitate more tactical psychological
interventions that aid in motor performance.

272
References
Adolphs, R. (2002). Neural systems for recognizing emotion. Curr Opin Neurobiol, 12(2), 169-177.
Adolphs, R., Damasio, H., Tranel, D., Cooper, G., & Damasio, A. R. (2000). A role for somatosensory cortices in the visual recognition of emotion as revealed by three-dimensional lesion mapping. J Neurosci, 20(7), 2683-2690.
Andre, A. (2001). The value of workload in the design and analysis of consumer products. Mahwah, NJ: L. Erlbaum.
Arnsten, A. F. (2009). Stress signalling pathways that impair prefrontal cortex structure and function. Nat Rev Neurosci, 10(6), 410-422.
Babiloni, C., Del Percio, C., Iacoboni, M., Infarinato, F., Lizio, R., Marzano, N., et al. (2008). Golf putt outcomes are predicted by sensorimotor cerebral EEG rhythms. J Physiol, 586(1), 131-139.
Babiloni, C., Del Percio, C., Rossini, P. M., Marzano, N., Iacoboni, M., Infarinato, F., et al. (2009). Judgment of actions in experts: a high-resolution EEG study in elite athletes. Neuroimage, 45(2), 512-521.
Babiloni, C., Marzano, N., Infarinato, F., Iacoboni, M., Rizza, G., Aschieri, P., et al. (2010). "Neural efficiency" of experts' brain during judgment of actions: a high-resolution EEG study in elite and amateur karate athletes. Behav Brain Res, 207(2), 466-475.
Badre, D., & D'Esposito, M. (2009). Is the rostro-caudal axis of the frontal lobe hierarchical? Nat Rev Neurosci, 10(9), 659-669.
Banks, S. J., Eddy, K. T., Angstadt, M., Nathan, P. J., & Phan, K. L. (2007). Amygdala-frontal connectivity during emotion regulation. Soc Cogn Affect Neurosci, 2(4), 303-312.
Baumeister, J., Reinecke, K., Liesen, H., & Weiss, M. (2008). Cortical activity of skilled performance in a complex sports related motor task. Eur J Appl Physiol, 104(4), 625-631.
Bear, M. F., Connor, B. W., & Paradiso, M. A. (1996). Neuroscience: exploring the brain. Baltimore MD: Lippincott Williams and Wilkins.
Beck, A. T., Rush, A. J., Shaw, B. F., & Emery, G. (1979). Cognitive Therapy of Depression. New York: Guilford Press.
Beer, J. S., Knight, R. T., & D'Esposito, M. (2006). Controlling the integration of emotion and cognition: the role of frontal cortex in distinguishing helpful from hurtful emotional information. Psychol Sci, 17(5), 448-453.
Beer, J. S., Lombardo, M. V., & Bhanji, J. P. (2010). Roles of medial prefrontal cortex and orbitofrontal cortex in self-evaluation. J Cogn Neurosci, 22(9), 2108-2119.
Beilock, S. L. (2010). Choke: What the Secrets of the Brain Reveal about Getting it Right When You Have. NY, NY: Free Press.
Beilock, S. L., & Carr, T. H. (2001). On the fragility of skilled performance: what governs choking under pressure? J Exp Psychol Gen, 130(4), 701-725.
Bell, A. J., & Sejnowski, T. J. (1995). An information-maximization approach to blind separation and blind deconvolution. Neural Comput, 7(6), 1129-1159.

273
Binder, J. R., Desai, R. H., Graves, W. W., & Conant, L. L. (2009). Where is the semantic system? A critical review and meta-analysis of 120 functional neuroimaging studies. Cereb Cortex, 19(12), 2767-2796.
Bixby, W., Spalding, T. W., & Hatfield, B. D. (2001). Temporal dynamics and dimensional specificity of the affective response to exercise of varying intensity: Differing pathways to a common outcome. Journal of Sport and Exercise Psychology, 23, 171-190.
Bradberry, T. J., Gentili, R. J., & Contreras-Vidal, J. L. (2010). Reconstructing three-dimensional hand movements from noninvasive electroencephalographic signals. J Neurosci, 30(9), 3432-3437.
Bright, P., Moss, H., & Tyler, L. K. (2004). Unitary vs multiple semantics: PET studies of word and picture processing. Brain Lang, 89(3), 417-432.
Brunet, E., Sarfati, Y., Hardy-Bayle, M. C., & Decety, J. (2000). A PET investigation of the attribution of intentions with a nonverbal task. Neuroimage, 11(2), 157-166.
Canli, T., Ferri, J., & Duman, E. A. (2009). Genetics of emotion regulation. Neuroscience, 164(1), 43-54.
Carretie, L., Albert, J., Lopez-Martin, S., & Tapia, M. (2009). Negative brain: an integrative review on the neural processes activated by unpleasant stimuli. Int J Psychophysiol, 71(1), 57-63.
Cerin, E., & Barnett, A. (2009). Predictors of pre- and post-competition affective states in male martial artists: a multilevel interactional approach. Scand J Med Sci Sports.
Chambers, C. D., Bellgrove, M. A., Stokes, M. G., Henderson, T. R., Garavan, H., Robertson, I. H., et al. (2006). Executive "brake failure" following deactivation of human frontal lobe. J Cogn Neurosci, 18(3), 444-455.
Chein, J. M., & Schneider, W. (2005). Neuroimaging studies of practice-related change: fMRI and meta-analytic evidence of a domain-general control network for learning. Brain Res Cogn Brain Res, 25(3), 607-623.
Chell, B. J., Graydon, J. K., Crowley, P. L., & Child, M. (2003). Manipulated stress and dispositional reinvestment in a wall-volley task: an investigation into controlled processing. Percept Mot Skills, 97(2), 435-448.
Conroy, D. E. (2001). Progress in the development of a multidimensional measure of fear of failure: The Performance Failure Appraisal Inventory (PFAI). Anxiety, Stress, & Coping, 14, 431-452.
Cox, R. H. (2002). Sport psychology: Concepts and applications (5th ed.). Boston: WCB/McGraw-Hill.
Critchley, H. D., Daly, E. M., Bullmore, E. T., Williams, S. C., Van Amelsvoort, T., Robertson, D. M., et al. (2000). The functional neuroanatomy of social behaviour: changes in cerebral blood flow when people with autistic disorder process facial expressions. Brain, 123 ( Pt 11), 2203-2212.
Damasio, A. R. (1996). The somatic marker hypothesis and the possible functions of the prefrontal cortex. Philos Trans R Soc Lond B Biol Sci, 351(1346), 1413-1420.

274
Damasio, A. R., Grabowski, T. J., Bechara, A., Damasio, H., Ponto, L. L., Parvizi, J., et al. (2000). Subcortical and cortical brain activity during the feeling of self-generated emotions. Nat Neurosci, 3(10), 1049-1056.
Davidson, R. J. (2002). Anxiety and affective style: role of prefrontal cortex and amygdala. Biol Psychiatry, 51(1), 68-80.
Davis, M. H., Meunier, F., & Marslen-Wilson, W. D. (2004). Neural responses to morphological, syntactic, and semantic properties of single words: an fMRI study. Brain Lang, 89(3), 439-449.
Deeny, S. P., Haufler, A. J., Saffer, M., & Hatfield, B. D. (2009). Electroencephalographic coherence during visuomotor performance: a comparison of cortico-cortical communication in experts and novices. J Mot Behav, 41(2), 106-116.
Del Percio, C., Babiloni, C., Bertollo, M., Marzano, N., Iacoboni, M., Infarinato, F., et al. (2009). Visuo-attentional and sensorimotor alpha rhythms are related to visuo-motor performance in athletes. Hum Brain Mapp, 30(11), 3527-3540.
Del Percio, C., Babiloni, C., Marzano, N., Iacoboni, M., Infarinato, F., Vecchio, F., et al. (2009). "Neural efficiency" of athletes' brain for upright standing: a high-resolution EEG study. Brain Res Bull, 79(3-4), 193-200.
Del Percio, C., Brancucci, A., Vecchio, F., Marzano, N., Pirritano, M., Meccariello, E., et al. (2007). Visual event-related potentials in elite and amateur athletes. Brain Res Bull, 74(1-3), 104-112.
Del Percio, C., Infarinato, F., Iacoboni, M., Marzano, N., Soricelli, A., Aschieri, P., et al. (2010). Movement-related desynchronization of alpha rhythms is lower in athletes than non-athletes: a high-resolution EEG study. Clin Neurophysiol, 121(4), 482-491.
Del Percio, C., Rossini, P. M., Marzano, N., Iacoboni, M., Infarinato, F., Aschieri, P., et al. (2008). Is there a "neural efficiency" in athletes? A high-resolution EEG study. Neuroimage, 42(4), 1544-1553.
Drabant, E. M., McRae, K., Manuck, S. B., Hariri, A. R., & Gross, J. J. (2009). Individual differences in typical reappraisal use predict amygdala and prefrontal responses. Biol Psychiatry, 65(5), 367-373.
Driscoll, D., Tranel, D., & Anderson, S. W. (2009). The effects of voluntary regulation of positive and negative emotion on psychophysiological responsiveness. Int J Psychophysiol, 72(1), 61-66.
Endler, N. S., & Kocovski, N. L. (2001). State and trait anxiety revisited. J Anxiety Disord, 15(3), 231-245.
Eysenck, M. W., & Calvo, M. G. (1992). Anxiety and performance: The processing efficiency theory. Cognition and Emotion, 6, 409-434.
Feder, A., Nestler, E. J., & Charney, D. S. (2009). Psychobiology and molecular genetics of resilience. Nat Rev Neurosci, 10(6), 446-457.
Fenz, W. (1975). Coping Mechanisms and Performance Under Stress. Finger, E. C., Mitchell, D. G., Jones, M., & Blair, R. J. (2008). Dissociable roles of
medial orbitofrontal cortex in human operant extinction learning. Neuroimage, 43(4), 748-755.
Fitts, P. M., & Posner, M. (1967). Human performance. Belmont,CA Brooks/Cole. Fox, S. (2008). Human Physiology: McGraw-Hill.

275
Frewen, P. A., Dozois, D. J. A., Neufeld, R. W. J., Lane, R. D., Densmore, M., Stevens, T. K., et al. (2010). Individual differences in trait mindfulness predict dorsomedial prefrontal and amygdala response during emotional imagery: An fMRI study Personality and Individual Differences, 49( 5), 479-484
Gallo, I. S., Keil, A., McCulloch, K. C., Rockstroh, B., & Gollwitzer, P. M. (2009). Strategic automation of emotion regulation. J Pers Soc Psychol, 96(1), 11-31.
Gentili, R. J., Bradberry, T. J., Oh, H., Hatfield, B. D., & Contreras Vidal, J. L. (2010). Cerebral cortical dynamics during visuomotor transformation: Adaptation to a cognitive-motor executive challenge. Psychophysiology.
Ghashghaei, H. T., Hilgetag, C. C., & Barbas, H. (2007). Sequence of information processing for emotions based on the anatomic dialogue between prefrontal cortex and amygdala. Neuroimage, 34(3), 905-923.
Goldin, P. R., McRae, K., Ramel, W., & Gross, J. J. (2008). The neural bases of emotion regulation: reappraisal and suppression of negative emotion. Biol Psychiatry, 63(6), 577-586.
Gray, J. R., Burgess, G. C., Schaefer, A., Yarkoni, T., Larsen, R. J., & Braver, T. S. (2005). Affective personality differences in neural processing efficiency confirmed using fMRI. Cogn Affect Behav Neurosci, 5(2), 182-190.
Greicius, M. D., Krasnow, B., Reiss, A. L., & Menon, V. (2003). Functional connectivity in the resting brain: a network analysis of the default mode hypothesis. Proc Natl Acad Sci U S A, 100(1), 253-258.
Grimm, S., Schmidt, C. F., Bermpohl, F., Heinzel, A., Dahlem, Y., Wyss, M., et al. (2006). Segregated neural representation of distinct emotion dimensions in the prefrontal cortex-an fMRI study. Neuroimage, 30(1), 325-340.
Gross, J., & Thompson, R. (2007). Emotion regulation: Conceptual foundations. Handbook of Emotion Regulation.
Gross, J. J., & John, O. P. (2003). Individual differences in two emotion regulation processes: implications for affect, relationships, and well-being. J Pers Soc Psychol, 85(2), 348-362.
Gross, J. R. (1998). The emerging field of emotion regulation: an integrated review. Review of General Psychology, 2 (3), 271-299.
Gucciardi, D. F., & Dimmock, J. A. (2008). Choking under Pressure in Sensorimotor Skills: Conscious Processing or Depleted Attentional Resources? . Psychology of Sport and Exercise, 9, 45 - 59
Haas, B. W., Omura, K., Constable, R. T., & Canli, T. (2007). Is automatic emotion regulation associated with agreeableness? A perspective using a social neuroscience approach. Psychol Sci, 18(2), 130-132.
Haier, R. J., Siegel, B., Tang, C., Abel, L., & Buchsbaum, M. S. (1992). Intelligence and changes in regional cerebral glucose metabolic rate following learning. Intelligence 16 415–426.
Haines, D. E. (2006). Fundamental Neuroscience for Basic and Clinical Applications. Philadelphia, Pa: Churchill Livingstone Elsevier.
Hancock, P., & Szalma, J. L. (2008). Performance Under Stress. Burlington VT: Ashgate Publishing.

276
Hanin, Y. L. (2007 ). Emotions in Sport. Current Issues and Perspectives. In G. Tenenbaum & R. C. Eklund (Eds.), Handbook of sport psychology. New York: Wiley & Sons.
Hardy, J., Hall, C. R., & Alexander, M. R. (2001). Exploring self-talk and affective states in sport. J Sports Sci, 19(7), 469-475.
Hatfield, B. D., & Brody, E. B. (2000). The psychology of athletic preparation and performance: The mental management of physical resources. . In B. T. (Ed.), Essentials of Strength Training and Conditioning (2nd ed.). . Champaign, IL: Human Kinetics Publishers.
Hatfield, B. D., & Brody, E. B. (2008). The psychology of athletic preparation and performance: The mental management of physical resources. . In B. T. (Ed.), Essentials of Strength Training and Conditioning (2nd ed.). . Champaign, IL: Human Kinetics Publishers.
Hatfield, B. D., Haufler, A. J., Hung, T. M., & Spalding, T. W. (2004). Electroencephalographic studies of skilled psychomotor performance. J Clin Neurophysiol, 21(3), 144-156.
Hatfield, B. D., & Hillman, C. (2001). The psychophysiology of sport: A mechanistic under standing of the psychology of superior performance. In R. H. Singer, H Janelle, C (Ed.), Handbook of sport psychology. New York: Wiley & Sons.
Hatfield, B. D., & Kerick, S. E. (2007). The psychology of superior sport performance; A cognitive and affective neuroscience perspective. In G. Tenenbaum & R. C. Eklund (Eds.), Handbook of Sport Psychology - 3rd edition (pp. 84-109): J.C. Wiley Publishers.
Hatfield, B. D., Landers, D. M., & Ray, W. J. (1984). Cognitive processes during self-paced motor performance: An electroencephalographic profile of skilled marksmen. Journal of Sport Psychology, 6, 42-59.
Hatfield, B. D., Rietschel, J. C., Costanzo, M. E., Goodman, R. N., Haufler, A. J., Lo, L., et al. (2010). Electrocortical dynamics during competitive psychomotor performance.
Haufler, A. J., Spalding, T. W., Santa Maria, D. L., & Hatfield, B. D. (2000). Neuro-cognitive activity during a self-paced visuospatial task: comparative EEG profiles in marksmen and novice shooters. Biol Psychol, 53(2-3), 131-160.
Heinzel, A., Bermpohl, F., Niese, R., Pfennig, A., Pascual-Leone, A., Schlaug, G., et al. (2005). How do we modulate our emotions? Parametric fMRI reveals cortical midline structures as regions specifically involved in the processing of emotional valences. Brain Res Cogn Brain Res, 25(1), 348-358.
Hickok, G., & Poeppel, D. (2007). The cortical organization of speech processing. Nat Rev Neurosci, 8(5), 393-402.
Huettel, S. A., Song, A. W., & McCarthy, G. (2003). Functional Magnetic Resonance Imaging: Sunderland, MA.
Iaria, G., Committeri, G., Pastorelli, C., Pizzamiglio, L., Watkins, K. E., & Carota, A. (2008). Neural activity of the anterior insula in emotional processing depends on the individuals' emotional susceptibility. Hum Brain Mapp, 29(3), 363-373.
Izard, C. E. (2009). Emotion theory and research: highlights, unanswered questions, and emerging issues. Annu Rev Psychol, 60, 1-25.

277
Jackson, R. C., Ashford, K. J., & Nosworthy, G. (2006). Attentional focus, dispositional reinvestment and skilled motor performance under pressure. Journal of Sport and Exercise Psychology, 28, 49-68.
Jackson, R. C., & Wilson, R. (1999). Using 'swing thoughts' to prevent paradoxical performance effects in golf putting. Leeds: Human Kinetics.
Kalisch, R. (2009). The functional neuroanatomy of reappraisal: time matters. Neurosci Biobehav Rev, 33(8), 1215-1226.
Kerick, S. E., Douglass, L. W., & Hatfield, B. D. (2004). Cerebral cortical adaptations associated with visuomotor practice. Med Sci Sports Exerc, 36(1), 118-129.
Kerick, S. E., McDowell, K., Hung, T. M., Santa Maria, D. L., Spalding, T. W., & Hatfield, B. D. (2001). The role of the left temporal region under the cognitive motor demands of shooting in skilled marksmen. Biol Psychol, 58(3), 263-277.
Kilpatrick, L., & Cahill, L. (2003). Amygdala modulation of parahippocampal and frontal regions during emotionally influenced memory storage. Neuroimage, 20(4), 2091-2099.
Kinrade, N. P., Jackson, R. C., & Ashford, K. J. (2010). Dispositional reinvestment and skill failure in cognitive and motor tasks. Psychology of Sport and Exercise, 11, 312-319.
Koenigsberg, H. W., Fan, J., Ochsner, K. N., Liu, X., Guise, K., Pizzarello, S., et al. (2010). Neural correlates of using distancing to regulate emotional responses to social situations. Neuropsychologia, 48(6), 1813-1822.
Kringelbach, M. L. (2005). The human orbitofrontal cortex: linking reward to hedonic experience. Nat Rev Neurosci, 6(9), 691-702.
Lam, W. K., Maxwell, J. P., & Masters, R. (2009). Analogy learning and the performance of motor skills under pressure. J Sport Exerc Psychol, 31(3), 337-357.
Lang, P. J., Bradley, M. M., & Cuthbert, B. N. (1999). International affective picture system (IAPS): Technical manual and affective ratings. Gainesville: University of Florida.
Lawrence, E. J., Shaw, P., Giampietro, V. P., Surguladze, S., Brammer, M. J., & David, A. S. (2006). The role of 'shared representations' in social perception and empathy: an fMRI study. Neuroimage, 29(4), 1173-1184.
Lawton, G. W., Hung, T. M., Saarela, P., & Hatfield, B. D. (1998). Electroencephalography and mental states associated with elite performance Journal of Sport and Exercise Psychology, 20(1), 35-53.
Lay, B. S., Sparrow, W. A., Hughes, K. M., & O'Dwyer, N. J. (2002). Practice effects on coordination and control, metabolic energy expenditure, and muscle activation. Hum Mov Sci, 21(5-6), 807-830.
Lee, T. W., Girolami, M., & Sejnowski, T. J. (1999). Independent component analysis using an extended Infomax algorithm for mixed sub-gaussian and super-gaussian sources. Neural Computation 11, 417–441.
Levens, S. M., & Phelps, E. A. (2010). Insula and orbital frontal cortex activity underlying emotion interference resolution in working memory. J Cogn Neurosci, 22(12), 2790-2803.

278
Lieberman, M. D. (2007). Social cognitive neuroscience: a review of core processes. Annu Rev Psychol, 58, 259-289.
Lyons, D. M., Parker, K. J., & Schatzberg, A. F. (2010). Animal models of early life stress: Implications for understanding resilience. Dev Psychobiol, 52(7), 616-624.
Martens, R., Vealey, R. S., & Burton, D. (1990). Competitive anxiety in sport. Champaign, IL: Human Kinetics.
Masters, R. (1992). Knowledge, (k)nerves, and know-how: The role of explicit versus implicit knowledge in the breakdown of a complex motor skill under pressure. The British Journal of Psychology 31, 343-358.
Masters, R. S. W., & Maxwell, J. P. (2008). The theory of reinvestment. International Review of Sport and Exercise Psychology, 1, 160-183.
Matthews, M. D. (2008). Positive Psychology: Adaptation, Learning and Performance in Exceptional Circumstances. In A. Publishing (Ed.), Performance Under Stress. Burlington VT.
Maxwell, J. P., Masters, R. S., & Poolton, J. M. (2006). Performance breakdown in sport: the roles of reinvestment and verbal knowledge. Res Q Exerc Sport, 77(2), 271-276.
Maxwell, J. P., Masters, R. S. W., & Eves, F. F. (2000). Explicit versus implicit motor learning: Dissociating selective and unselective modes of skill acquisition via feedback manipulation.
. Journal of Sports Sciences, 18, 559. McRae, K., Hughes, B., Chopra, S., Gabrieli, J. D., Gross, J. J., & Ochsner, K. N.
(2010). The neural bases of distraction and reappraisal. J Cogn Neurosci, 22(2), 248-262.
McRae, K., Ochsner, K. N., Mauss, I., Gabrieli, J. D. E., & Gross, J. J. (2008). Gender differences in emotion regulation: An fMRI study of cognitive reappraisal. Group Processes and Intergroup Relations, 11, 143-162.
Nakata, H., Yoshie, M., Miura, A., & Kudo, K. (2010). Characteristics of the athletes' brain: evidence from neurophysiology and neuroimaging. Brain Res Rev, 62(2), 197-211.
Neubauer, A. C., & Fink, A. (2009). Intelligence and neural efficiency. Neurosci Biobehav Rev, 33(7), 1004-1023.
New, A. S., Hazlett, E. A., Buchsbaum, M. S., Goodman, M., Mitelman, S. A., Newmark, R., et al. (2007). Amygdala-prefrontal disconnection in borderline personality disorder. Neuropsychopharmacology, 32(7), 1629-1640.
Northoff, G., Heinzel, A., Bermpohl, F., Niese, R., Pfennig, A., Pascual-Leone, A., et al. (2004). Reciprocal modulation and attenuation in the prefrontal cortex: an fMRI study on emotional-cognitive interaction. Hum Brain Mapp, 21(3), 202-212.
Northoff, G., Richter, A., Gessner, M., Schlagenhauf, F., Fell, J., Baumgart, F., et al. (2000). Functional dissociation between medial and lateral prefrontal cortical spatiotemporal activation in negative and positive emotions: a combined fMRI/MEG study. Cereb Cortex, 10(1), 93-107.

279
Ochsner, K. N., Bunge, S. A., Gross, J. J., & Gabrieli, J. D. (2002). Rethinking feelings: an FMRI study of the cognitive regulation of emotion. J Cogn Neurosci, 14(8), 1215-1229.
Ochsner, K. N., & Gross, J. J. (2005). The cognitive control of emotion. Trends Cogn Sci, 9(5), 242-249.
Ochsner, K. N., & Gross, J. J. (2008). Cognitive Emotion Regulation Insights From Social Cognitive and Affective Neuroscience. Current Directions in Psychological Science, 17 (2), 153 – 158.
Ochsner, K. N., Ray, R. D., Cooper, J. C., Robertson, E. R., Chopra, S., Gabrieli, J. D., et al. (2004). For better or for worse: neural systems supporting the cognitive down- and up-regulation of negative emotion. Neuroimage, 23(2), 483-499.
Oldfield, R. C. (1971). The assessment and analysis of handedness: the Edinburgh inventory. Neuropsychologia, 9(1), 97-113.
Pascual-Marqui, R. D. (2002). Standardized low-resolution brain electromagnetic tomography (sLORETA): technical details. Methods Find Exp Clin Pharmacol, 24 Suppl D, 5-12.
Patrick, C. J., & Lavoro, S. A. (1997). Ratings of emotional response to pictorial stimuli: Positive and negative affect. Motivation and Emotion 21, 297–321.
Patterson, J. C., 2nd, Ungerleider, L. G., & Bandettini, P. A. (2002). Task-independent functional brain activity correlation with skin conductance changes: an fMRI study. Neuroimage, 17(4), 1797-1806.
Paulus, M. P., Simmons, A. N., Fitzpatrick, S. N., Potterat, E. G., Van Orden, K. F., Bauman, J., et al. (2010). Differential brain activation to angry faces by elite warfighters: neural processing evidence for enhanced threat detection. PLoS One, 5(4), e10096.
Pessoa, L. (2008). On the relationship between emotion and cognition. Nat Rev Neurosci, 9(2), 148-158.
Pessoa, L. (2010). Emotion and cognition and the amygdala: from "what is it?" to "what's to be done?". Neuropsychologia, 48(12), 3416-3429.
Pessoa, L., & Adolphs, R. (2010). Emotion processing and the amygdala: from a 'low road' to 'many roads' of evaluating biological significance. Nat Rev Neurosci, 11(11), 773-783.
Pessoa, L., McKenna, M., Gutierrez, E., & Ungerleider, L. G. (2002). Neural processing of emotional faces requires attention. Proc Natl Acad Sci U S A, 99(17), 11458-11463.
Pfaff, D. W., Kieffer, B. L., & Swanson, L. W. (2008). Mechanisms for the regulation of state changes in the central nervous system: an introduction. Ann N Y Acad Sci, 1129, 1-7.
Phan, K. L., Taylor, S. F., Welsh, R. C., Decker, L. R., Noll, D. C., Nichols, T. E., et al. (2003). Activation of the medial prefrontal cortex and extended amygdala by individual ratings of emotional arousal: a fMRI study. Biol Psychiatry, 53(3), 211-215.
Phelps, E. A., Delgado, M. R., Nearing, K. I., & LeDoux, J. E. (2004). Extinction learning in humans: role of the amygdala and vmPFC. Neuron, 43(6), 897-905.

280
Phelps, E. A., & LeDoux, J. E. (2005). Contributions of the amygdala to emotion processing: from animal models to human behavior. Neuron, 48(2), 175-187.
Posner, M. I., Rothbart, M. K., Sheese, B. E., & Tang, Y. (2007). The anterior cingulate gyrus and the mechanism of self-regulation. Cogn Affect Behav Neurosci, 7(4), 391-395.
Quirk, G. J., & Beer, J. S. (2006). Prefrontal involvement in the regulation of emotion: convergence of rat and human studies. Curr Opin Neurobiol, 16(6), 723-727.
Ray, R. D., Ochsner, K. N., Cooper, J. C., Robertson, E. R., Gabrieli, J. D., & Gross, J. J. (2005). Individual differences in trait rumination and the neural systems supporting cognitive reappraisal. Cogn Affect Behav Neurosci, 5(2), 156-168.
Rietschel, J. C., Goodman, R. N., King, B. R., Lo, L. C., Contreras-Vidal, J. L., & Hatfield, B. D. (2010). Cerebral cortical dynamics and the quality of motor behavior during social evaluative challenge. Psychophysiology.
Rodrigues, S. M., LeDoux, J. E., & Sapolsky, R. M. (2009). The influence of stress hormones on fear circuitry. Annu Rev Neurosci, 32, 289-313.
Rolls, E. T., & Grabenhorst, F. (2008). The orbitofrontal cortex and beyond: from affect to decision-making. Prog Neurobiol, 86(3), 216-244.
Rong, F., & Contreras-Vidal, J. L. (2006). Magnetoencephalographic artifact identification and automatic removal based on independent component analysis and categorization approaches. J Neurosci Methods, 157(2), 337-354.
Ruby, P., & Decety, J. (2003). What you believe versus what you think they believe: a neuroimaging study of conceptual perspective-taking. Eur J Neurosci, 17(11), 2475-2480.
Rypma, B., Berger, J. S., Prabhakaran, V., Bly, B. M., Kimberg, D. Y., Biswal, B. B., et al. (2006). Neural correlates of cognitive efficiency. Neuroimage, 33(3), 969-979.
Sabatinelli, D., Fortune, E. E., Li, Q., Siddiqui, A., Krafft, C., Oliver, W. T., et al. (2010). Emotional perception: Meta-analyses of face and natural scene processing. Neuroimage.
Salzman, C. D., & Fusi, S. (2010). Emotion, cognition, and mental state representation in amygdala and prefrontal cortex. Annu Rev Neurosci, 33, 173-202.
Scheuerecker, J., Frodl, T., Koutsouleris, N., Zetzsche, T., Wiesmann, M., Kleemann, A. M., et al. (2007). Cerebral differences in explicit and implicit emotional processing--an fMRI study. Neuropsychobiology, 56(1), 32-39.
Schmitz, T. W., & Johnson, S. C. (2006). Self-appraisal decisions evoke dissociated dorsal-ventral aMPFC networks. Neuroimage, 30(3), 1050-1058.
Schneider, W., & Chein, J. M. (2003). Controlled & automatic processing: behavior, theory, and biological mechanisms. Cognitive Science, 27, 525–559.
Selye. (1975). Confusion and controversy in the stress field. Journal of Human Stress 1, 37–44.
Senior, C., Russell, T., & Gazzaniga, M. (2006). Methods in mind. Cambridge, Mass.: MIT Press.
Shamay-Tsoory, S. G., Lester, H., Chisin, R., Israel, O., Bar-Shalom, R., Peretz, A., et al. (2005). The neural correlates of understanding the other's distress: a

281
positron emission tomography investigation of accurate empathy. Neuroimage, 27(2), 468-472.
Smith, M. A., Brandt, J., & Shadmehr, R. (2000). Motor disorder in Huntington's disease begins as a dysfunction in error feedback control. Nature, 403(6769), 544-549.
Spielberger, C. D., Gorsuch, R. L., & Lushene, R. E. (1970). STAI manual. Palo Alto, CA: Consulting Psychologists.
St Clair Gibson, A., & Foster, C. (2007). The role of self-talk in the awareness of physiological state and physical performance. Sports Med, 37(12), 1029-1044.
Staal, M. A. (2004). Stress, Cognition, and Human Performance: A Literature Review and Conceptual Framework.
Straube, T., & Miltner, W. H. (2010). Attention to aversive emotion and specific activation of the right insula and right somatosensory cortex. Neuroimage.
Surguladze, S., Russell, T., Kucharska-Pietura, K., Travis, M. J., Giampietro, V., David, A. S., et al. (2006). A reversal of the normal pattern of parahippocampal response to neutral and fearful faces is associated with reality distortion in schizophrenia. Biol Psychiatry, 60(5), 423-431.
Tepas, D. I., & Price, J. M. (2001). What is stress and what is fatigue?. . Mahwah, NJ: L. Erlbaum.
Van Dillen, L. F., Heslenfeld, D. J., & Koole, S. L. (2009). Tuning down the emotional brain: an fMRI study of the effects of cognitive load on the processing of affective images. Neuroimage, 45(4), 1212-1219.
van Galen, G. P., & van Huygevoort, M. (2000). Error, stress and the role of neuromotor noise in space oriented behaviour. Biol Psychol, 51(2-3), 151-171.
Venkatraman, V., Rosati, A. G., Taren, A. A., & Huettel, S. A. (2009). Resolving response, decision, and strategic control: evidence for a functional topography in dorsomedial prefrontal cortex. J Neurosci, 29(42), 13158-13164.
Vialou, V., Robison, A. J., Laplant, Q. C., Covington, H. E., 3rd, Dietz, D. M., Ohnishi, Y. N., et al. (2010). DeltaFosB in brain reward circuits mediates resilience to stress and antidepressant responses. Nat Neurosci, 13(6), 745-752.
Wager, T. D., Davidson, M. L., Hughes, B. L., Lindquist, M. A., & Ochsner, K. N. (2008). Prefrontal-subcortical pathways mediating successful emotion regulation. Neuron, 59(6), 1037-1050.
Wan, C. Y., & Huon, G. F. (2005). Performance degradation under pressure in music: An examination of attentional processes. Psychology of Music, 33, 155-172.
Waugh, C. E., Hamilton, J. P., & Gotlib, I. H. (2010). The neural temporal dynamics of the intensity of emotional experience. Neuroimage, 49(2), 1699-1707.
Wilk, S. L., Desmarais, L. B., & Sackett, P. R. (1995). Gravitation to Jobs Commensurate With Ability: Longitudinal and Cross-Sectional Tests. Journal of Applied Psychology, 80, 79-85.
Wright, P., He, G., Shapira, N. A., Goodman, W. K., & Liu, Y. (2004). Disgust and the insula: fMRI responses to pictures of mutilation and contamination. Neuroreport, 15(15), 2347-2351.

282
Yamasaki, H., LaBar, K. S., & McCarthy, G. (2002). Dissociable prefrontal brain systems for attention and emotion. Proc Natl Acad Sci U S A, 99(17), 11447-11451.
Yaoi, K., Osaka, N., & Osaka, M. (2009). Is the self special in the dorsomedial prefrontal cortex? An fMRI study. Soc Neurosci, 4(5), 455-463.
Yerkes, R. M., & Dodson, J. D. (1908). The Relation of Strength of Stimulus to Rapidity of Habit-Formation. Journal of Comparative Neurology and Psychology, 18, 459-482.