examination of paid travel on the i-85 express lanes burris, and danda 2 abstract the implementation...
TRANSCRIPT

Wood, Burris, and Danda 1
Examination of Paid Travel on the I-85 Express Lanes
Nicholas S. Wood (corresponding author)
Assistant Transportation Researcher
Texas A&M Transportation Institute
505 East Huntland Drive, Suite 455
Austin, TX 78752
Phone: 512-467-0946
Mark Burris, Ph.D., P.E.
Professor & Associate Department Head for Research and Operations
Zachry Department of Civil Engineering
Texas A&M University
CE/TTI Building, Room 301-B
College Station, TX 77843-3136
Phone: 979-845-9875, Fax: 979-845-6481
Santosh Rao Danda
Graduate Research Assistant
Zachry Department of Civil Engineering
Texas A&M University
CE/TTI Building, Room 239
College Station, TX 77843-3136
Phone: 979-676-3603
Submitted for Presentation and Publication at the 2014 TRB 93rd Annual Meeting
March 1, 2014
Word count: 4,555 (body) + 1,500 (6 figures) + 1,250 (5 tables) = 7,305

Wood, Burris, and Danda 2
ABSTRACT
The implementation of the I-85 Express Lanes in Atlanta, Georgia, was the first conversion of a
high-occupancy vehicle lane to high-occupancy toll lane that simultaneously increased the
occupancy requirement (from two or more persons to three or more persons) and implemented
tolls without the creation of additional lanes. This paper presents the findings of an analysis of
tolling data collected during the first year of operation as part of the National Evaluation of
Urban Partnership Agreement and Congestion Reduction Demonstration programs sponsored by
the U.S. Department of Transportation. This analysis found the median willingness to pay for
Express Lane travel time savings to be $19.45 per hour across all time periods and $33.17 per
hour for southbound a.m. peak travel. There was little difference in the willingness to pay
between frequent and infrequent travelers of the Express Lanes. This analysis was based on
actual tolls paid by travelers and therefore represents the minimum these travelers were willing
to pay.
INTRODUCTION
In 2007 and 2008, the U.S. Department of Transportation (USDOT) awarded $1.3 billion to six
regions as part of the Urban Partnership Agreement (UPA) and Congestion Reduction
Demonstration (CRD) programs. The main goal of the programs was to incorporate four key
strategies (referred to as the 4Ts) to relieve urban congestion. These key strategies were tolling,
transit, telecommuting, and technology. Four of the six urban areas (Miami, Florida; Atlanta,
Georgia; Minneapolis, Minnesota; and Los Angeles, California) converted or expanded existing
high-occupancy vehicle (HOV) lanes into high-occupancy/toll (HOT) lanes. Tolls on all four
HOT lanes used congestion pricing to dynamically adjust rates, permitting either an increase or
decrease in toll rate to better manage demand. Ridesharing, telecommuting, and transit programs
were primary components of all UPA/CRD sites that provided users with a non-tolled
alternative.
The Atlanta region was one of the sites selected by USDOT under the CRD program,
with a total of $110 million being awarded to the Georgia Department of Transportation
(GDOT), State Road and Tollway Authority (SRTA), and Georgia Regional Transportation
Authority. The main elements of the Atlanta CRD program were a HOV-to-HOT lane
conversion and expanded express bus service on the I-85 corridor in DeKalb and Gwinnett
Counties. The total expenditure for the program was $182 million, including local contributions,
with roughly two-thirds of the cost going to support transit-related improvements. This research
examines the use of the new tolled Express Lanes (HOT lanes) on I-85 in Atlanta based on data
collected as part of the UPA/CRD National Evaluation sponsored by USDOT.
The use of Atlanta’s I-85 Express Lanes was examined during a six-month period to
better understand travelers’ value of time (VOT) and their willingness to pay (WTP) for travel
time savings. Specifically, researchers:
determined an empirical WTP based on real-world traveler choices between a tolled,
faster trip and an untolled, slower trip;
examined if the WTP varied based on time of day or direction of travel; and
examined if the WTP varied by frequency of Express Lane use (it was hypothesized
that travelers who rarely used the ELs were using them only when they desperately needed a
Wood, Burris, and Danda 3
faster trip or reliable trip time, and were willing to pay a higher amount than those travelers who
used the lanes frequently).
LITERATURE REVIEW
Transportation agencies may consider implementing HOT lanes (often called express lanes) on
their freeways as a way to optimize performance of existing HOV facilities. With operating
HOV facilities, agencies can control demand by adjusting occupancy requirements (e.g., from
two- to three-person carpools). However, any adjustment in the occupancy requirement can
cause a large change in usage, causing the facility to be either under- or overused. Tolling an
HOV lane provides much more control, so agencies can better adjust for demand by altering the
toll rate to encourage or discourage users from traveling on the facility.
However, a number of limitations are associated with congestion pricing that can cause a
facility to perform poorly. Prior literature has cited that congestion pricing was developed as a
second-best solution because the optimal toll rate cannot be precisely known due to a lack of
knowledge about demand (1). Specifically, exogenous factors such as fuel prices, weather
conditions, media stories, and local school schedules can all influence demand. In Atlanta, it
was found that a local traffic reporter had impacted demand on the I-85 Express Lanes by giving
real-time information on the radio (2). Given these complexities, most operators of HOT lanes
constantly monitor traffic on the lanes and adjust the toll rate accordingly.
Negative public perceptions also present a challenge when implementing congestion
pricing projects. A study conducted by the Metropolitan Washington Council of Governments
found that people are often skeptical about how pricing would work and want to see how it
would specifically impact them (3). Other surveys have concluded that the public is receptive to
real and specific examples; people generally care about the use of toll revenues and want
simplicity in a pricing structure (4). Research also suggests that congestion pricing can be more
acceptable to the public if they have used and experienced similar facilities. However,
implementing the first congestion pricing project within a region can be a challenge because the
public cannot readily refer to a similar local project.
The VOT is defined in this paper as the amount of money that a traveler is willing to pay
for travel time savings. Specifically, the VOT is the marginal rate of substitution between cost
and travel time in behavior-choice models (5, 6). Agencies use VOT as empirical evidence of
how travelers value time. Agencies also use VOT to help them understand travel behavior
decisions, which in turn are used to plan and implement improvements to the transportation
system and optimize the use of limited resources. The value of travel time reliability (VOR) is
the value that travelers place on the ability to reach a destination on time with a reasonable
expectation of certainty, matched with the WTP to reduce travel time variability (5).
Estimates of VOT and VOR can vary widely depending upon how data are collected and
analyzed. Prior studies have shown that VOR can have a considerable range among travelers,
from as low as 55 percent of VOT (7) to 322 percent of VOT (8). Surveys are often used to ask
travelers how much they are willing to pay for travel time savings. Revealed-preference surveys
use actual trip and price information to help discern VOT, as opposed to stated-preference

Wood, Burris, and Danda 4
surveys that ask what drivers would pay under hypothetical situations. VOT often varies widely
across travelers because some groups of users have a higher VOT than others. One hypothesis is
that infrequent express and HOT lane users tend to have a higher VOT for the limited number of
trips they make on the tolled lanes.
Various factors appear to influence how individual users select to travel in a HOT lane as
opposed to using the general-purpose lanes (GPLs). Common reasons cited by HOT lane
travelers include saving travel time, having reliable trip times, and making important trips on
time. A stated-preference survey of users on the Katy Freeway (I-10) Managed Lanes in
Houston, Texas, found that travelers who have an important appointment or are worried they will
be late have the highest WTP to use the lanes. A study of real-world data collected on the Katy
Freeway Managed Lanes calculated the average WTP to be $51 per hour of travel time savings
(9). Attitudinal surveys of I-15 Express Lane users in San Diego, California, expressed that
travel time savings and reliability, especially during morning commutes, were important
characteristics of usage after the facility first opened in 1998 (10). Travel time savings were also
important for users of the SR-91 Express Lanes in Orange County, California. A revealed-
preference survey using trip data from SR-91 Express Lanes and I-15 HOT lane travelers in
Southern California estimated the VOR to be 95 to 140 percent of the median travel time (5).
However, one-third of SR-91 Express Lanes users had indicated in a survey that driver safety
and comfort were primary factors in their choosing the ELs (11).
THE ATLANTA CRD PROJECT
The existing HOV lanes on I-85 in DeKalb and Gwinnett Counties were considered by some to
be congested and poorly performing. A study of data obtained during 2007 and 2008 from the
Georgia NaviGAtor, Georgia’s Advanced Transportation Management System, showed the I-85
HOV lane to be operating under constrained conditions during most of the morning and
afternoon peak periods. To improve operations, the region considered an increase in the
occupancy requirement from two or more persons (HOV2+) to three or more persons (HOV3+).
However, there was a consensus that demand in the HOV lane would drop so severely that
congestion in the GPLs would increase (12). A conversion from an HOV2+ lane to a HOT3+
lane would, in theory, still allow carpools to use the managed lane while metering access for
others through the use of tolling. The operation of a HOT lane was believed to optimize flow
and carry more vehicles overall, causing the GPLs to improve because the HOT lane remained in
free-flow conditions, carrying more vehicles than when it became congested.
The Atlanta CRD project converted 15.5 miles of HOV2+ lanes into dynamically priced
HOT3+ lanes on I-85 from Chamblee-Tucker Road in DeKalb County, just south of I-285, to
just north of Old Peachtree Road in Gwinnett County. The HOT lanes from the Atlanta CRD
project were officially branded as the I-85 Express Lanes. GDOT was responsible for the
construction component of the lane conversion, while SRTA was responsible for the operation of
the tolling system. The tolling system operated for 24 hours per day, 7 days per week, in both the
northbound and southbound directions. SRTA publically stated that toll rates could vary
between $0.01 and $0.90 per mile during the first year of operation (13).

Wood, Burris, and Danda 5
The I-85 Express Lanes were notable because the project was the first HOV-to-HOT lane
conversion project that simultaneously introduced tolling and increased the occupancy
requirement without adding additional lanes. The project opened for full operation on October 1,
2011, and tolling occurred on all segments in both the northbound and southbound directions.
Carpools of three or more people, motorcycles, alternatively fueled vehicles (AFVs) with
Georgia AFV license plates, transit services, and emergency vehicles were all exempt from
paying tolls. Under the operating rules for the I-85 Express Lanes, HOVs and other exempt
vehicles had to register for a transponder. This was not required when the lane operated as an
HOV lane. The transponder was a sticker-based unit that could be affixed to windshields, based
on the ISO 18006-C standard. Users had to self-declare their occupancy status to qualify for toll-
exempt trips by calling the SRTA customer service center or declaring themselves on the mobile
phone application. A self-declaration had to occur at least 15 minutes before a trip was made to
be properly entered into the system.
The ELs used the footprint of the double-white striped buffer from the existing HOV
lanes and kept most of the access points where vehicles could enter and exit. There were four
intermediate access points in each direction, ranging from roughly 0.50 to 0.82 miles in length,
interspersed between five main tolling segments. Users could also access the ELs at the termini
at both ends of the corridor and at a separate access ramp off GA 316. Each tolling segment was
about 1.5 to 3.5 miles in length. Users were not permitted to cross the double-white buffer, or
else they would be given a citation or violation for illegal movement. Alterations in striping
were only made in the southbound direction near GA 316, where an additional access point was
created because that toll segment was originally 7 miles. Users had expressed a desire to access
the ELs at GA 316 after the first few months of operation.
A unique element of the I-85 Express Lanes was the introduction of an automated
enforcement system that aided officers with visual occupancy checks and identified users who
crossed the double-white line. The system incorporated the use of 34 overhead gantries
equipped with radio frequency identification (RFID) readers and mobile automatic license plate
reader (ALPR) cameras placed in enforcement vehicles. The gantries were installed at roughly
0.5-mile intervals along the corridor. Officers who enforced the ELs had the capability of using
the ALPR to identify the occupancy status of users in real time. The automated system also
identified users who crossed the double-white line by checking the sequence of transponder
reads across all gantries to determine where a vehicle first entered and exited a lane. If either the
first or last read from a transponder was not near an access point, a toll violation was posted to
the user’s account. In theory, ensuring a reduction in the number of weaving movements
between the ELs and the GPLs would improve vehicle flow and the performance of the managed
lane. The frequently placed RFID readers and the fact that many travelers had transponders also
provided a wealth of data on travel choices and travel times on the I-85 facility. These data are
the foundation of this research and are discussed in more detail in the next section of this paper.
DATA SOURCES
The WTP for travel time savings on the I-85 Express Lanes was determined using archived data
that noted when users traveled on the GPLs versus the ELs. The analysis used automatic vehicle
identification (AVI) data to represent non-tolled trip activity from the GPL, and toll transactions

Wood, Burris, and Danda 6
were used to define tolled activity and toll status (e.g., HOV versus non-HOV) from the ELs.
Data for the analysis from both the AVI readers and the toll systems represented the period from
February 25, 2012, to August 24, 2012. The timeframe was limited due to the AVI sensors being
deactivated during the first few months of operation and concerns about data quality.
There were 73 AVI readers in the northbound direction and 65 AVI readers in the
southbound direction. The AVI readers provided extremely accurate location and time data for
over 207,000 unique transponder IDs. From the unique transponder IDs from the AVI records,
the travel times and distances for all trips of transponder-equipped vehicles were obtained along
the GPLs. Toll transaction data provided similar information on paid EL trips, along with
specific data on the trip starting point, ending point, and amount of toll paid. The two datasets
included over 5.6 million total trips spanning the six-month period. At the onset of the analysis,
3.45 million trips came from the GPLs, and 2.15 million trips came from the ELs. An
approximately even number of trips were from the northbound and southbound directions.
RESULTS AND ANALYSIS
The WTP values were only determined for EL trips that could be matched to corresponding GPL
trips that occurred at the same time, in the same direction, and between the same locations. This
reduced the total number of trips used for analysis from 2.15 million EL trips to 1.28 million EL
trips. Next, each of the 1.28 million EL trips was compared to equivalent GPL trips. The toll
paid by the EL traveler was divided by the amount of time saved on the EL as compared to the
GPL. Some trips were toll free and paid zero tolls (e.g., registered transit vehicles, HOV3+
carpools). The percentage of trips that were removed due to having a toll-exempt status did not
represent the proportion of all toll-exempt trips made on the ELs.
In some cases the traveler paid a toll for very small, zero, or even negative travel time
savings—in the case when the ELs were slower than the GPLs. These distinctions are interesting
to note but were excluded from further analysis, leaving 1.15 million trips to analyze. Table 1
shows the number of outlier trips that were removed from the analysis. Including this additional
6 percent of trips would have only changed the WTP a small amount but added considerable
confusion in the diagrams and interpretation of results.
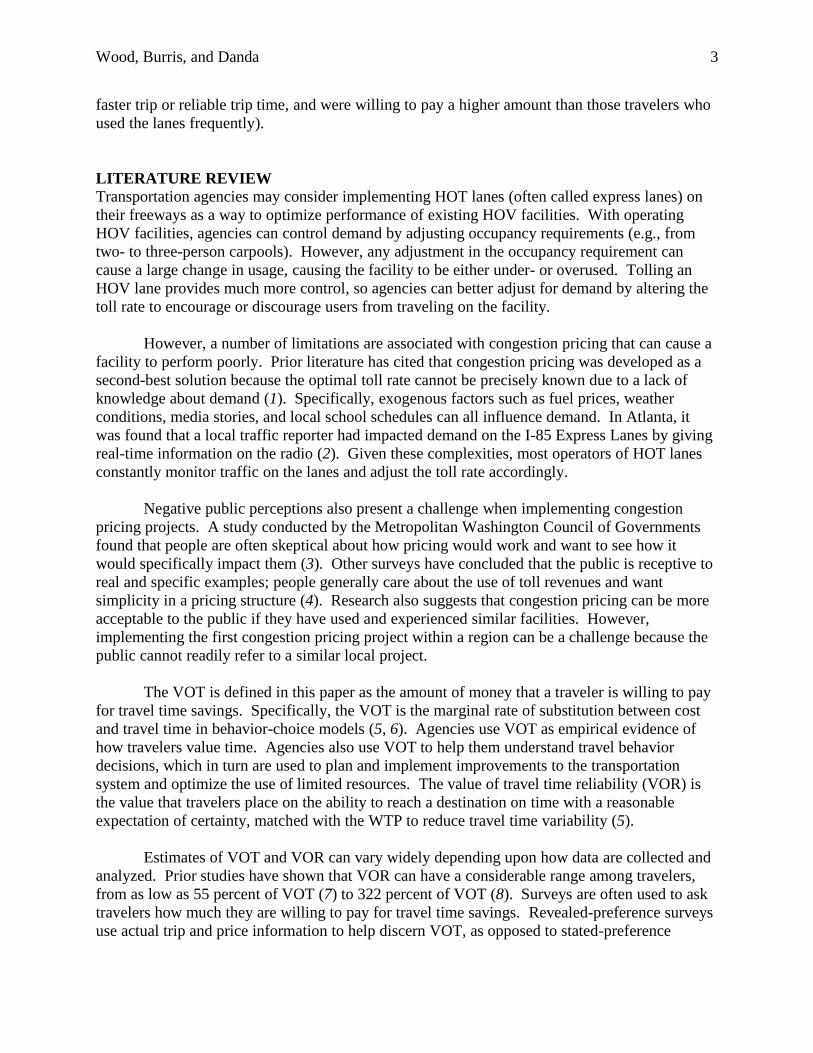
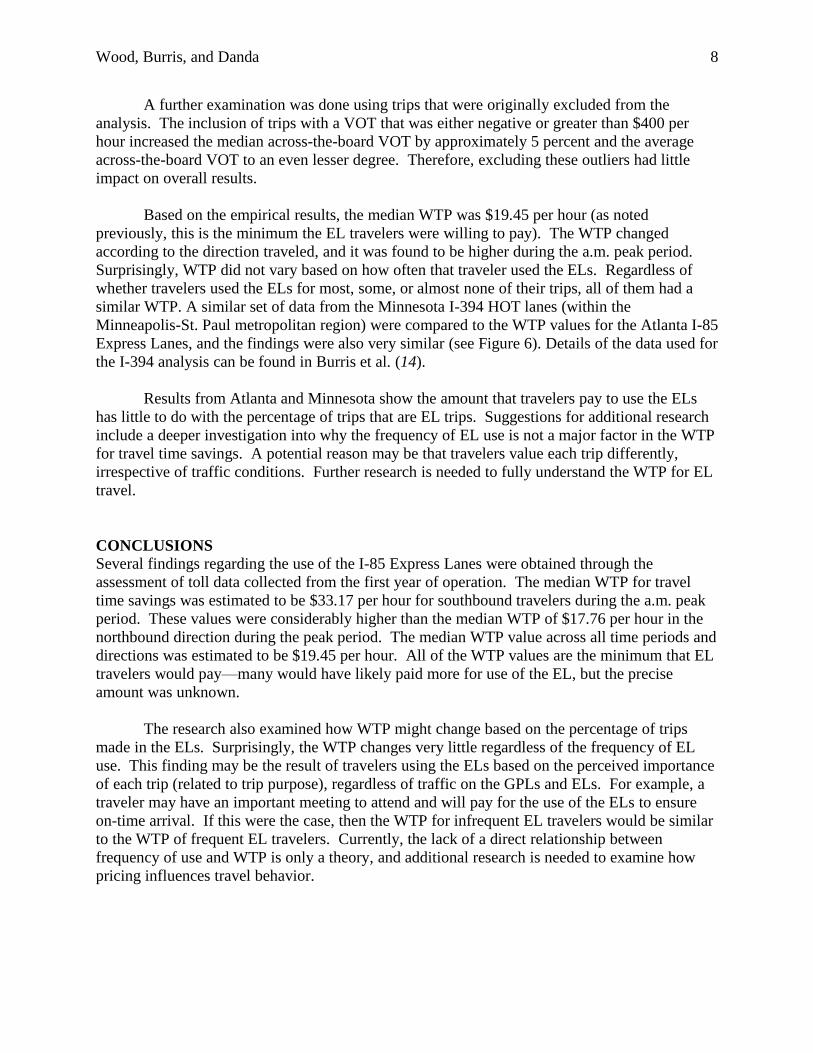
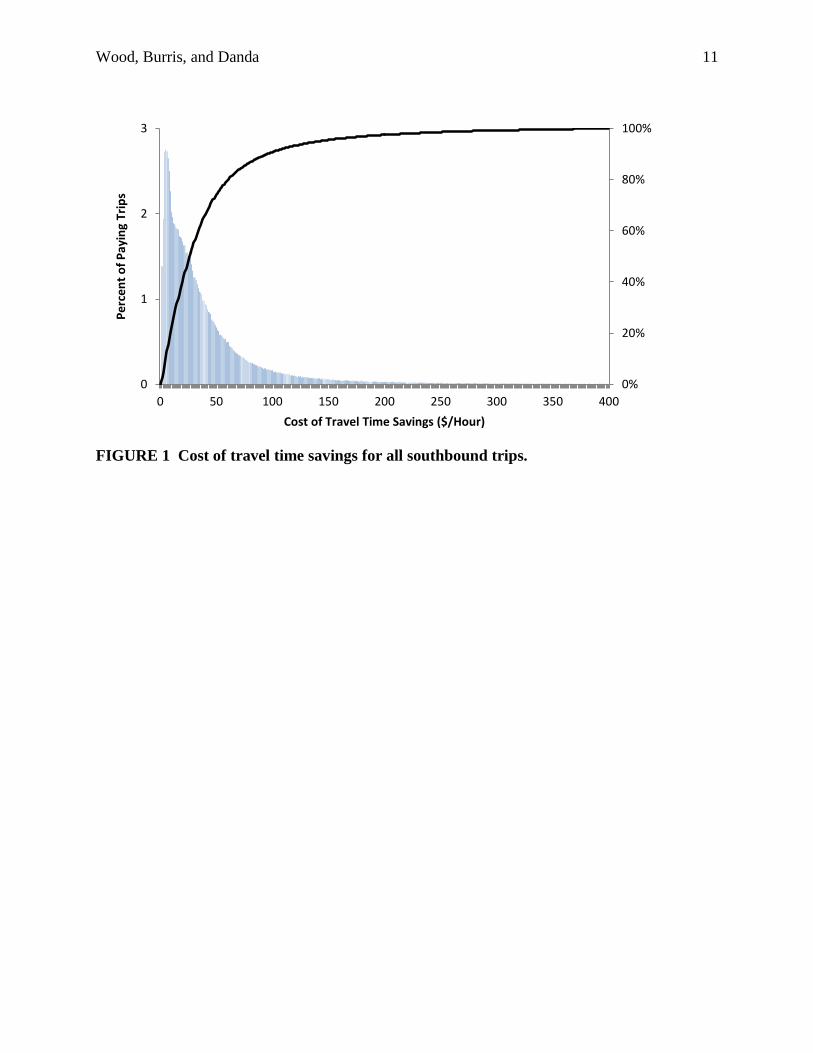
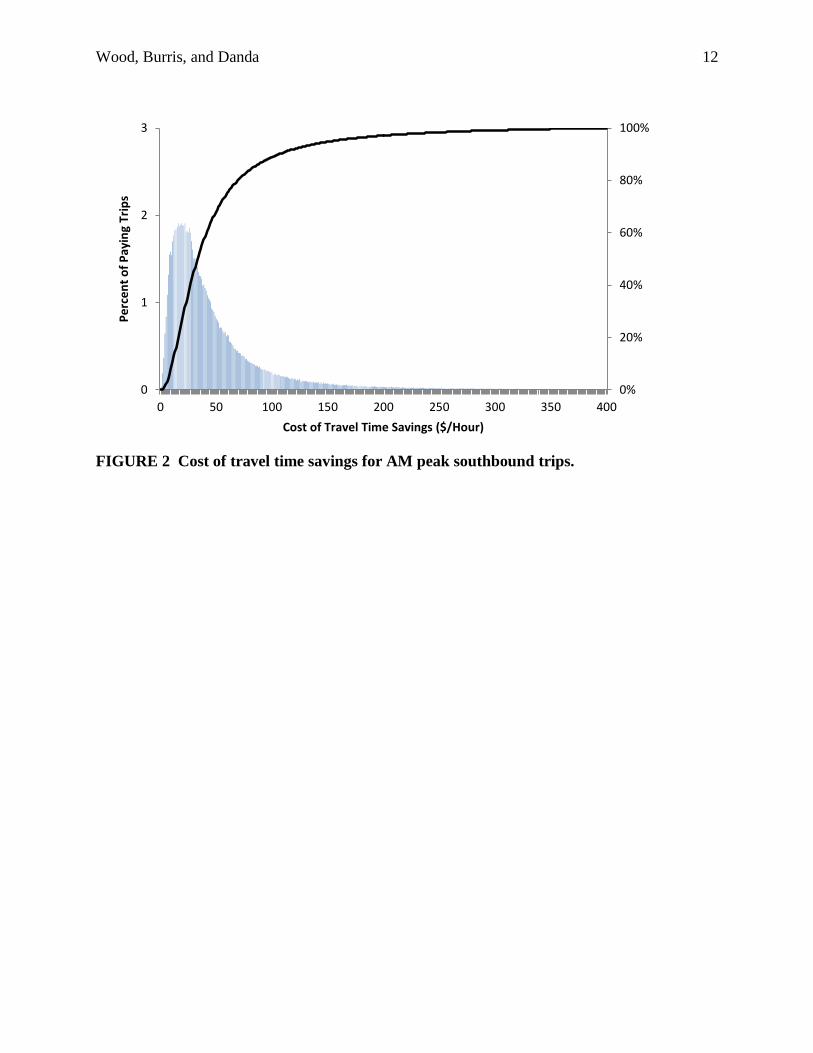
The distribution of WTP values for travelers who used the EL is shown in Figures 1 and
2 and is summarized in Table 2. The solid line in both WTP graphs specifically represents the
cumulative distribution frequency. The long tail of the distribution toward the right of the
figures is a result of travelers paying a toll for a very small amount of travel time savings. For
example, a $0.50 toll for a five-second travel time savings equates to a $360 per hour WTP
value. The WTP graphs had an arbitrary cutoff at $400 per hour. However, a much lower cutoff
point would result in only a small percentage of trips removed, such as using a cutoff at $100 per
hour. Due to the long-tailed distribution, the median WTP was believed to better reflect what
most EL travelers were willing to pay. The median WTP value was $19.45 per hour for all EL
trips on the CRD corridor. The median a.m. peak-period WTP value was $33.17 per hour for
southbound traffic, the highest WTP for all the time periods. This represents the morning trip to
work for many travelers, and thus it is not surprising that it had a higher WTP. However, other

Wood, Burris, and Danda 7
HOT lanes had mixed results, with some having their highest demand on the morning trip to
work (I-394) and some on the afternoon trip home (SR-91).
A closer assessment of the WTP was made by looking at how frequently users took the
I-85 Express Lanes as opposed to the GPLs and the toll they paid. This analysis was done to
investigate if infrequent EL users paid a toll only when they observed unusual congestion on the
GPLs. At the same time, frequent tolled EL users were investigated to determine if they used the
EL regardless of congestion in the GPLs. If correct, these hypotheses would improve
understanding of traveler behavior. The information could also lead to improved traffic and
revenue forecasts for managed lanes.
The frequency of EL usage was grouped according to the percent of total trips taken in
the EL. No users were counted if they did not take any EL trips during the six-month period. The
specific bins were defined as Rare (0.01 to 15.00 percent of all trips taken in the ELs),
Occasional (15.01 to 30.00 percent), Irregular (30.01 to 50.00 percent), and Frequent (50.01 to
100.00 percent). The number of trips and transponders associated with this part of the analysis is
shown in Table 3, with 100,000 travelers represented. Roughly half of the users from the
sample, defined as the number of active transponders, took the EL less than 30 percent of the
time.
The day of the week and time of day that travelers used the ELs was investigated for both
the northbound and southbound directions (Tables 4 and 5, respectively). Very little difference
was found in the travel patterns of EL use based on the percentage of trips made in the ELs.
However, travelers who took more frequent tolled trips (more than half of their trips were in the
ELs) were more likely to travel during peak periods.
The travel time savings and the amount of tolls paid were examined for each group, and
the results are graphically displayed in Figures 3 and 4, respectively. The southbound and
northbound results were similar in shape, but the toll paid and travel time savings were slightly
lower on average for the northbound direction. As shown, frequent users tended to save a little
more travel time and pay slightly higher tolls on average. A very small difference was found to
exist between the rare, occasional, and irregular paying EL traveler groups. Any difference is a
true difference because the entire sample was analyzed. Based on these data, it is not surprising
that when considering the toll paid divided by travel time saved, all four groups had a nearly
identical WTP for EL travel time savings (see Figure 5).
This WTP analysis had a few limitations. The largest was that the tolls paid for each
transaction give an indication of the minimum amount that travelers would pay to access the
ELs. Individuals who had a higher demand, and would potentially pay more for travel, could not
be discerned from the data. Drivers with transponders who drove in the GPLs may have had a
lower VOT, and that VOT may have been anything between $0 per hour and anything just below
the toll at that time divided by the travel time savings at that time. To summarize, the values
from the WTP analysis indicate the minimum WTP values of only the EL users, but their
possible VOT is likely higher.
Wood, Burris, and Danda 8
A further examination was done using trips that were originally excluded from the
analysis. The inclusion of trips with a VOT that was either negative or greater than $400 per
hour increased the median across-the-board VOT by approximately 5 percent and the average
across-the-board VOT to an even lesser degree. Therefore, excluding these outliers had little
impact on overall results.
Based on the empirical results, the median WTP was $19.45 per hour (as noted
previously, this is the minimum the EL travelers were willing to pay). The WTP changed
according to the direction traveled, and it was found to be higher during the a.m. peak period.
Surprisingly, WTP did not vary based on how often that traveler used the ELs. Regardless of
whether travelers used the ELs for most, some, or almost none of their trips, all of them had a
similar WTP. A similar set of data from the Minnesota I-394 HOT lanes (within the
Minneapolis-St. Paul metropolitan region) were compared to the WTP values for the Atlanta I-85
Express Lanes, and the findings were also very similar (see Figure 6). Details of the data used for
the I-394 analysis can be found in Burris et al. (14).
Results from Atlanta and Minnesota show the amount that travelers pay to use the ELs
has little to do with the percentage of trips that are EL trips. Suggestions for additional research
include a deeper investigation into why the frequency of EL use is not a major factor in the WTP
for travel time savings. A potential reason may be that travelers value each trip differently,
irrespective of traffic conditions. Further research is needed to fully understand the WTP for EL
travel.
CONCLUSIONS
Several findings regarding the use of the I-85 Express Lanes were obtained through the
assessment of toll data collected from the first year of operation. The median WTP for travel
time savings was estimated to be $33.17 per hour for southbound travelers during the a.m. peak
period. These values were considerably higher than the median WTP of $17.76 per hour in the
northbound direction during the peak period. The median WTP value across all time periods and
directions was estimated to be $19.45 per hour. All of the WTP values are the minimum that EL
travelers would pay—many would have likely paid more for use of the EL, but the precise
amount was unknown.
The research also examined how WTP might change based on the percentage of trips
made in the ELs. Surprisingly, the WTP changes very little regardless of the frequency of EL
use. This finding may be the result of travelers using the ELs based on the perceived importance
of each trip (related to trip purpose), regardless of traffic on the GPLs and ELs. For example, a
traveler may have an important meeting to attend and will pay for the use of the ELs to ensure
on-time arrival. If this were the case, then the WTP for infrequent EL travelers would be similar
to the WTP of frequent EL travelers. Currently, the lack of a direct relationship between
frequency of use and WTP is only a theory, and additional research is needed to examine how
pricing influences travel behavior.

Wood, Burris, and Danda 9
ACKNOWLEDGMENT
This research was conducted as part of the National Evaluation of the UPA/CRD programs for
the USDOT, with support from the Office of Operations within the Federal Highway
Administration. The authors would like to directly recognize Greg Jones, Andrew Edwards, and
Angela Jacobs from the Federal Highway Administration for their support. Gena Major and
Carlos Campo from SRTA in Georgia were gracious enough to provide AVI data and explain its
caveats. The data from Minnesota came from research funded by the Southwestern University
Transportation Center, which is funded in part by the State of Texas. The authors also thank the
Minnesota Department of Transportation and for providing the I-394 traffic and toll data. Ginger
Goodin and Katie Turnbull from Texas A&M Transportation Institute and Carol Zimmerman
from Battelle Memorial Institute provided overall guidance throughout the project.
REFERENCES
1. Small, K. A., and E. Verhoef. The Economics of Urban Transportation. Routledge, New
York, 2007.
2. Vu, P. SRTA Tolling Overview. Presented at 91st Annual Meeting of the Transportation
Research Board, Washington, D.C., 2012.
3. Swanson, J., and B. Hampton. What Do People Think about Congestion Pricing: A
Deliberative Dialogue with Residents of Metropolitan Washington. National Capital
Region Transportation Planning Board, Metropolitan Washington Council of Governments.
Washington, DC. 2013.
4. Zmud, J., and C. Arce. NCHRP Synthesis 377: Compilation of Public Opinion Data on
Tolls and Road Pricing. National Cooperative Highway Research Program, Washington,
D.C., 2008.
5. Brownstone, D., and Small, K. A. Valuing Time and Reliability: Assessing the Evidence
from Road Pricing Demonstrations. Transportation Research Part A: Policy and Practice
39, 2005, pp. 279–293.
6. De Jong, G., Y. Tseng, M. Kouwenhoven, E. Verhoef, and J. Bates. The Value of Travel
Time and Travel Time Reliability. Technical report prepared for the Netherlands Ministry
of Transport, Public Works and Water Management, 2007.
7. Black, I. G., and J. G. Towriss. Demand Effects of Travel Time Reliability. UK Department
of Transportation, Her Majesty’s Stationery Office, London, 1993.
8. Small, K. A., C. Winston, and J. Yan. Uncovering the Distribution of Motorists’
Preferences for Travel Time and Reliability. Econometrica, Vol. 73, 2005, pp. 1367–1382.
9. Devarasetty, P. C., M. Burris, and W. D. Shaw. The Value of Travel Time and Reliability
of Houston Managed Lane Travelers: Evidence from Stated Preference Survey and Actual
Usage Data. Presented at 91st Annual Meeting of the Transportation Research Board,
Washington, D.C., 2012.
10. Supernak, J., J. Golob, T. F. Golob, C. Kaschade, C. Kazimi, E. Schraffler, and D. Steffey.
San Diego’s Interstate 15 Congestion Pricing Project: Attitudinal, Behavioral, and
Institutional Issues. In Transportation Research Record: Journal of the Transportation
Research Board, No. 1812, Transportation Research Board of the National Academies,
Washington, D.C., 2002, pp. 78–86.
11. Sullivan, E. C. Continuation Study to Evaluate the Impacts of the SR 91 Value-Priced
Express Lanes: Final Report. California Polytechnic State University, San Luis Obispo,
2000.

Wood, Burris, and Danda 10
12. Rountree, R., J. Miller, P. Vu, T. Slack, and R. Guensler. Georgia’s Approach to
Congestion with the Four T’s: Tolling, Transit, Telework, and Technology. Presented at
87th Annual Meeting of the Transportation Research Board, Washington, D.C., 2008.
13. State Road and Tollway Authority. Tolls Reduced on I-85 Express Lanes. January 19,
2011. http://www.peachpass.com/uploads/SRTAtollrate_Rangeadjustments_
Jan192012.pdf. Accessed on November 15, 2013.
14. Burris, M., S. Nelson, P. Kelly, P. Gupta, and Y. Cho. Willingness to Pay for HOT
Lanes—Empirical Analysis from I-15 and I-394. In Transportation Research Record:
Journal of the Transportation Research Board, No. 2297, Transportation Research Board
of the National Academies, Washington, D.C., 2012, pp. 47–55.
Wood, Burris, and Danda 11
FIGURE 1 Cost of travel time savings for all southbound trips.
0%
20%
40%
60%
80%
100%
0
1
2
3
0 50 100 150 200 250 300 350 400
Pe
rce
nt
of
Pay
ing
Trip
s
Cost of Travel Time Savings ($/Hour)
Wood, Burris, and Danda 12
FIGURE 2 Cost of travel time savings for AM peak southbound trips.
0%
20%
40%
60%
80%
100%
0
1
2
3
0 50 100 150 200 250 300 350 400
Pe
rce
nt
of
Pay
ing
Trip
s
Cost of Travel Time Savings ($/Hour)

Wood, Burris, and Danda 13
FIGURE 3 Travel time savings by frequency of use (southbound direction).

Wood, Burris, and Danda 14
FIGURE 4 Toll paid by frequency of use (southbound direction).

Wood, Burris, and Danda 15
FIGURE 5 Willingness to pay by frequency of use (southbound direction).

Wood, Burris, and Danda 16
FIGURE 6 Cumulative VOT distribution of I-394 HOT lane travelers based on frequency
of HOT lane use.
0
20
40
60
80
100
120
0 50 100 150 200 250 300 350 400
Cu
mu
lati
ve P
erce
nta
ge o
f Tr
avel
ers
WTP ($/Hour)
Rare
Occasional
Irregular
Frequent

Wood, Burris, and Danda 17
TABLE 1 Data Outliers Type of Trip Data Northbound Trips
Removed
Southbound Trips
Removed
No travel time savings 3,237 (0.5%) 3,612 (0.6%)
WTP > $400/hour 7,579 (1.1%) 10,415 (1.7%)
WTP < $0/hour 35,472 (5.4%) 32,854 (5.3%)
WTP = $0/hour (toll-free vehicles)a 23,477 (3.6%) 17,642 (2.8%)
Total trips remaining 591,273 (89.4%) 560,015 (89.7%) a This does not mean there were a total of 3.6 percent and 2.8 percent toll-exempt trips on the
ELs; trips were eliminated due to not having a corresponding trip in the other lanes.

Wood, Burris, and Danda 18
TABLE 2 Willingness to Pay (Dollars per Hour) Direction Statistical
Measure
Time of Day—
All Day
Time of Day—
Peak
Northbound Mean 30.19 34.75
Median 14.83 17.76
Southbound Mean 42.29 49.95
Median 26.11 33.17
Both Mean 36.07 42.08
Median 19.45 24.89

Wood, Burris, and Danda 19
TABLE 3 Grouping Based on Frequency of EL Usage Group Percent of
EL Trips
Northbound—
Number of
Trips
Northbound—
Number of
Transponders
Southbound—
Number of
Trips
Southbound—
Number of
Transponders
Rare 0.01–15 41,254 14,622 33,561 12,332
Occasional 15.01–30 69,912 12,622 52,690 10,035
Irregular 30.01–50 112,400 14,797 90,174 12,285
Frequent 50.01–100 325,974 12,533 332,124 12,784

Wood, Burris, and Danda 20
TABLE 4 Northbound EL Trips Based on Frequency of EL Use
Characteristic Frequent
Traveler
Group
Irregular
Traveler
Group
Occasional
Traveler
Group
Rare
Traveler
Group
Number of transponders 12,533 14,797 12,622 14,662
Percentage of transponders 22.9 27.1 23.1 26.8
Number of trips 325,974 112,400 69,912 41,254
Percentage of trips 59.3 20.5 12.7 7.5
Sunday (percentage) 2.2 4.0 4.4 4.8
Monday (percentage) 18.8 15.7 14.8 14.2
Tuesday (percentage) 19.0 16.6 16.0 15.0
Wednesday (percentage) 18.6 16.7 15.7 14.9
Thursday (percentage) 19.7 19.9 19.7 19.7
Friday (percentage) 18.6 21.9 23.8 25.6
Saturday (percentage) 3.2 5.3 5.6 5.9
Peak (3–7 p.m.)a (percentage) 80.4 71.1 70.0 66.5
Off-peak (all other times)a (percentage) 19.6 28.9 30.0 33.5
a Weekdays only

Wood, Burris, and Danda 21
TABLE 5 Southbound EL Trips Based on Frequency of EL Use
Characteristic Frequent
Traveler
Group
Irregular
Traveler
Group
Occasional
Traveler
Group
Rare
Traveler
Group
Number of transponders 12,784 12,285 10,035 12,332
Percentage of transponders 26.9 25.9 21.2 26
Number of trips 332,124 90,174 52,420 33,561
Percentage of trips 65.34 17.74 10.31 6.6
Sunday (percentage) 2.9 5.3 4.9 5.3
Monday (percentage) 19.1 17.3 16.8 15.3
Tuesday (percentage) 19.0 18.3 18.2 19.1
Wednesday (percentage) 19.0 18.3 17.9 17.5
Thursday (percentage) 19.3 18.8 19.1 19.7
Friday (percentage) 16.9 16.3 16.9 17.1
Saturday (percentage) 3.7 5.6 6.2 6.0
Peak (6–10 a.m.)a (percentage) 81.3 71.1 66.0 60.9
Off-peak (all other times)a (percentage) 18.7 29.0 34.0 39.1
a Weekdays only