examination of market foods for coliform organismsaem.asm.org/content/15/5/1062.full.pdfexamination...
TRANSCRIPT

APPuED MICROmoLOGY, Sept. 1967, p. 1062-1069Copyright © 1967 American Society for Microbiology
Vol. 15, No. 5Printed in U.S.A.
Examination of Market Foods forColiform Organisms
HERBERT E. HALL, DAVID F. BROWN, AND KEITH H. LEWIS
Milk and Food Research Section, National Center for Urban and Industrial Health, Public Health Service,Cincinnati, Ohio 45226
Received for publication 16 March 1967
Food specimens (490) in nine categories were examined for total aerobic platecount and numbers and types of coliform organisms, including the enteropathogenicEscherichia coli (EEC). The total counts were compared with various suggestedstandards, and a limit of 100,000/g appeared to be a realistic goal, except for certainfood types with a high level of natural flora. Plate counts in VRB were compared tocounts obtained by isolation by enrichment in LST Broth, and the latter methodproduced a higher percentage of isolations. The presence of E. coli was determined byuse ofEC Medium incubated at 44.5 + 0.1 C. Only 40.4% of the positive EC tubes,however, contained E. coli. It appeared that a limit of 10 coliform organisms per g asa suggested standard could be met with several types of foods. Isolation of EEC wasobtained only three times, or in 0.6% of the specimens.
Most workers who examine food of varioustypes (raw, frozen, or prepared for purposes ofsurvey, product control, or the determination ofthe etiology of foodborne disease) accept the factthat some level of coliform contamination may bepresent (12). The exact significance of the pres-ence of these organisms, however, is not clearlydefined. In recommended standards for variousfoods, the allowable numbers range from none ininfant food formulas (2) to 90/g in grade A drymilk (supplement 1 to Milk Ordinance and Codeof 1953, Public Health Service, 1959) with, mostof the recommendations centering around levelsof 0/0.1 g (10) to 20/g (17; Grade A PasteurizedMilk Ordinance, Public Health Service, 1965).Other suggested standards require the determina-tion of numbers of fecal coliform organisms, ascompared to the number of bacteria capable ofgiving a positive reaction when grown in mostprobable number (MPN) tubes containing lac-tose, Lauryl Sulfate Tryptose (LST) Broth (BBLor Difco), or Brilliant Green Bile (BGLB) Broth,2% (BBL or Difco) (National Shellfish Sanita-tion Workshop, 1964). The importance of thepresence of enteropathogenic Escherichia coli(EEC) in foods has rarely been considered in thiscountry, except when all environmental factorsare being studied in outbreaks of infantile diar-rhea. In the literature from Europe and Japan,however, incidents of foodborne disease causedby EEC are frequently reported (3, 18).The study reported in this paper was designed
to determine the frequency of occurrence of EEC
in market foods and to evaluate methods ofdetection and quantification of total coliformorganisms and of E. coli.
MATERIALS AND METHODSFood specimens. All foods used in this study were
selected from the shelves or self-service cold boxes ofvarious chain stores in the Cincinnati, Ohio, area orwere purchased over-the-counter or from vendingmachines. No attempts at selection were made otherthan to determine that the wrapping materials on pre-wrapped goods were intact.The types of foods and the number of specimens of
each type examined were: frozen ready-to-eat desserts,23; cheese and cheese products, 26; baby foods injars, 33; frozen fish and seafoods, 36; dry cereals andmixes, 46; raw and frozen vegetables, 49; preparedand convenience foods, 81; raw meats, 88; and pre-wrapped sandwiches, 108.
Media. Commercially available dehydrated mediawere used throughout the study and prepared accord-ing to the manufacturers directions with the exceptionof the LST broth, which was used in 30-ml volumes at1.33 strength to yield single-strength compositionwhen a 10-ml volume of inoculum was added.
Procedure. Of each food specimen, 50 g was re-moved aseptically from the original package, placedin a Waring Blendor jar (either glass or metal, 1-litercapacity) with 450 ml of buffered dilution water (2),and blended, at the speed of the "low" switch position(approximately 8,000 rev/min) for 2 min. Furtherdilutions of the food (10" through 10-7) were pre-pared in buffered dilution water (2). Total aerobicplate counts were obtained by plating 1-ml volumesof dilutions of 10-1 through 107 in duplicate in PlateCount Agar (Difco or BBL), incubating for 48 hr at
1062
on June 13, 2018 by guesthttp://aem
.asm.org/
Dow
nloaded from

EXAMINATION OF MARKET FOODS FOR COLIFORMS
35 C, and counting the colonies in duplicate platescontaining between 30 and 300 colonies.
Coliform counts were obtained by plating 10 ml ofthe 1:10 blend in three plates and 1-ml volumes ofdilutions of 10-' through 10-' in duplicate in VioletRed Bile (VRB) Agar (BBL or Difco). Plates werepoured with approximately 15 ml of VRB agar andoverlaid with 4 to 5 ml of the same agar. The plateswere incubated for 24 hr at 35 C, and all of the redcolonies in the 10-ml plates or dilution plates contain-ing 150 or fewer colonies were counted; 10 colonieswere picked from the plates counted, or, when lessthan 10 colonies were present in the 10-ml plates, allcolonies were picked. When both typical (colonies>0.5 mm in diameter, with a zone of precipitatedbile) and atypical colonies were present, some of eachwere picked. The colonies were inoculated into tubesof BGLB Broth, incubated for 48 hr at 35 C, and ob-served for gas formation at 24 and 48 hr. All tubesshowing gas formation were subcultured by streakingonto Eosin Methylene Blue (EMB) Agar (BBL or
Difco). Tubes of EC Medium (BBL or Difco) werealso inoculated from the positive BGLB tubes, andincubated for 48 hr at 44.5 (40.1) C in a thermo-statically controlled water bath; those showing gasformation at 24 or 48 hr were subcultured to EMB.A 10-ml volume of the 1:10 dilution was added to a
tube containing 30 ml of LST Broth at 1.33 strength.The tube was incubated for 48 hr at 35 C and, whengas was produced in 24 or 48 hr, it was subcultured toBGLB and EC broth. All positive BGLB and ECtubes were streaked on EMB Agar.
All EMB plates were incubated for 24 hr at 35 Cand examined for types of colonies present. Examplesof each type on plates inoculated from both BGLBand EC were transferred to Veal Infusion Agar slants(Difco). The growth on these slants was used todetermine the types of coliforms present by inoculat-ing MR-VP medium broth (BBL), Simmons CitrateAgar (BBL), and Tryptose Broth (Difco) to obtainIMViC patterns. All strains giving patterns indicativeof the E. coli types (++-- or -+--) were testedwith antisera for EEC by the methods recommendedby Edwards and Ewing (4).
RESULTSThe total aerobic counts obtained with the
various types of food ranged from no organismsdetected in 1 ml of 10-' dilution to over 100million organisms per g. The ranges, mean, andmedian counts are shown in Table 1. Consistentlylow counts (median <100 per g) were obtained inbaby foods in jars; of the 33 specimens, 18 failedto show any growth at the 10-1 dilution. Thehighest count in baby foods (110/g) was obtainedfrom a specimen of creamed corn; the nexthighest (75/g) was in vegetables with bacon.Most of the growth obtained from these speci-mens was of aerobic spore-forming bacilli; no
attempts were made to determine the species.The highest mean and median counts were
obtained with cheese and cheese products ( >10million per g); the highest count obtained in thestudy, however, was a specimen of giblet gravy inthe prepared and convenience food category.Because mean values tend to be overinfluenced bythe occurrence of one or two very high values,the median counts give a more realistic picture ofthe microbial levels in these foods. The medianvalues indicated that most of the foods examinedhad relatively low counts (Table 1). Cheese andcheese products, as well as sandwiches made withcheese, had high levels of residual organismsrelated to cheese production; raw meats and rawand frozen vegetables also had relatively highresidual or natural levels of bacterial contamina-tion. Frozen desserts, dry cereals and mixes,frozen fish and seafoods, and most prepared andconvenience foods had relatively low levels (afew thousand per g) due to effects of processingor terminal heat treatment. Recommendedstandards of 50,000 to 100,000 organisms per ghave been suggested for frozen precooked foods,shellfish and some milk products (11, 13; Quar-termaster Food and Container Institute of theArmed Forces, MIL-M-13966, 1955). Of the
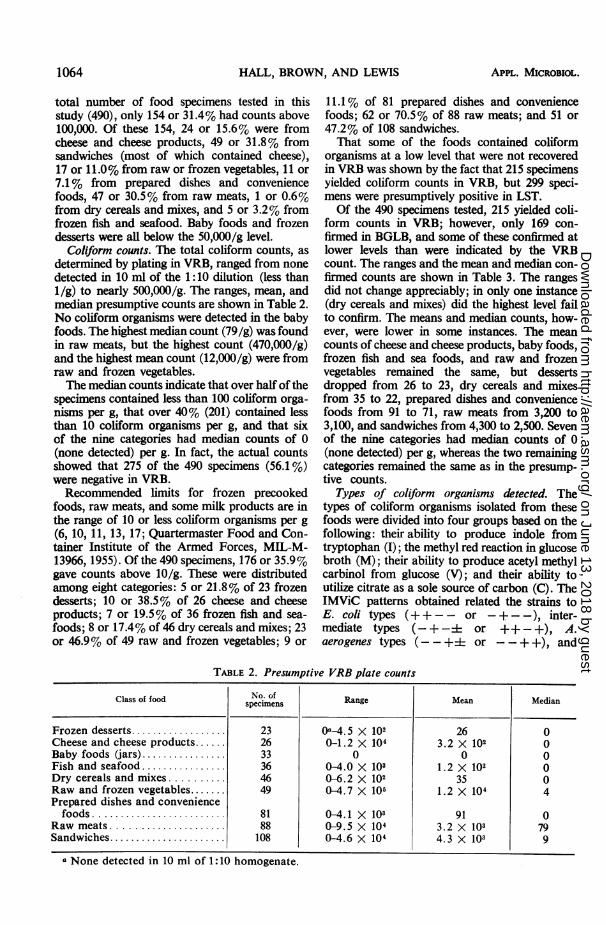
TABLE 1. Aerobic plate counts
Class of food sNeomeof Range Mean Median
Frozen desserts............... 23 0a_4.5 X 104 3.5 X 10³ 5.9 X 10²Cheese and cheese products... 26 0-5 X 10⁷ 2.1 X 10⁷ 1.7 X 10⁷Baby foods (jars) ............. 33 0-1 .1 X 102 < 100/g <100/gFish and seafoods.36 4.0 X 10O-4.0 X 10⁵ 7.6 X 10⁴ 7.0 X 10³Dry cereals and mixes....... 46 1.2 X 10⁶ 5.6 X 10³ 1.7 X 10²Raw and frozen vegetables.... 49 1.2 X 10²-4.2 X 10⁷ 3.3 X 10⁶ 4.0 X 10⁴Prepared and conveniencefoods ...................... 81 0-1.2 X 10⁸ 2.7 X 10⁶ 3.3 X 10³
Raw meats .................. 88 1.5 X 10L3.2 X 107 2.5 X 10⁶ 2.8 X 10⁵Sandwiches ................... 108 0-3.0 X 10⁷ 2.7 X 10⁶ 8.1 X 10⁴
a None detected in 1 ml of 1:10 dilution.
VOL. 15, 1967 1063
on June 13, 2018 by guesthttp://aem
.asm.org/
Dow
nloaded from
HALL, BROWN, AND LEWIS
total number of food specimens tested in thisstudy (490), only 154 or 31.4% had counts above100,000. Of these 154, 24 or 15.6% were fromcheese and cheese products, 49 or 31.8% fromsandwiches (most of which contained cheese),17 or 11.0% from raw or frozen vegetables, 11 or7.1% from prepared dishes and conveniencefoods, 47 or 30.5% from raw meats, 1 or 0.6%from dry cereals and mixes, and 5 or 3.2% fromfrozen fish and seafood. Baby foods and frozendesserts were all below the 50,000/g level.
Coliform counts. The total coliform counts, as
determined by plating in VRB, ranged from nonedetected in 10 ml of the 1:10 dilution (less thanI/g) to nearly 500,000/g. The ranges, mean, andmedian presumptive counts are shown in Table 2.No coliform organisms were detected in the babyfoods. The highest median count (79/g) was foundin raw meats, but the highest count (470,000/g)and the highest mean count (12,000/g) were fromraw and frozen vegetables.The median counts indicate that over half of the
specimens contained less than 100 coliform orga-nisms per g, that over 40% (201) contained lessthan 10 coliform organisms per g, and that sixof the nine categories had median counts of 0(none detected) per g. In fact, the actual countsshowed that 275 of the 490 specimens (56.1 %)were negative in VRB.Recommended limits for frozen precooked
foods, raw meats, and some milk products are inthe range of 10 or less coliform organisms per g(6, 10, 11, 13, 17; Quartermaster Food and Con-tainer Institute of the Armed Forces, MIL-M-13966, 1955). Of the 490 specimens, 176 or 35.9%gave counts above 10/g. These were distributedamong eight categories: 5 or 21.8% of 23 frozendesserts; 10 or 38.5% of 26 cheese and cheeseproducts; 7 or 19.5% of 36 frozen fish and sea-foods; 8 or 17.4% of 46 dry cereals and mixes; 23or 46.9% of 49 raw and frozen vegetables; 9 or
11.1% of 81 prepared dishes and conveniencefoods; 62 or 70.5% of 88 raw meats; and 51 or47.2% of 108 sandwiches.That some of the foods contained coliform
organisms at a low level that were not recoveredin VRB was shown by the fact that 215 specimensyielded coliform counts in VRB, but 299 speci-mens were presumptively positive in LST.Of the 490 specimens tested, 215 yielded coli-
form counts in VRB; however, only 169 con-firmed in BGLB, and some of these confirmed atlower levels than were indicated by the VRBcount. The ranges and the mean and median con-firmed counts are shown in Table 3. The rangesdid not change appreciably; in only one instance(dry cereals and mixes) did the highest level failto confirm. The means and median counts, how-ever, were lower in some instances. The meancounts of cheese and cheese products, baby foods,frozen fish and sea foods, and raw and frozenvegetables remained the same, but dessertsdropped from 26 to 23, dry cereals and mixesfrom 35 to 22, prepared dishes and conveniencefoods from 91 to 71, raw meats from 3,200 to3,100, and sandwiches from 4,300 to 2,500. Sevenof the nine categories had median counts of 0(none detected) per g, whereas the two remainingcategories remained the same as in the presump-tive counts.
Types of coliform organisms detected. Thetypes of coliform organisms isolated from thesefoods were divided into four groups based on thefollowing: their ability to produce indole fromtryptophan (I); the methyl red reaction in glucosebroth (M); their ability to produce acetyl methylcarbinol from glucose (V); and their ability toutilize citrate as a sole source of carbon (C). TheIMViC patterns obtained related the strains toE. coli types (++-- or -+--), inter-mediate types (-+-i or ++-+), A.aerogenes types (-- +4 or - - + +), and
TABLE 2. Presumptive VRB plate counts
Class of food No. of Range Mean MedianspecimensRaeMenedn
Frozen desserts.................. 23 Oa-4. 5 X 10² 26 0Cheese and cheese products ...... 26 0-1.2 X 10⁴ 3.2 X 10² 0Baby foods (jars)................ 33 0 0 0Fish and seafood ................ 36 0-4.0 X 10³ 1.2 X 10² 0Dry cereals and mixes.46 0-6.2 X 10² 35 0Raw and frozen vegetables ....... 49 0-4.7 X 10⁵ 1.2 X 10⁴ 4Prepared dishes and conveniencefoods ......................... 81 0-4.1 X 10³ 91 0
Raw meats ..................... 88 0-9.5 X 10⁴ 3.2 X 10³ 79Sandwiches...................... 108 0-4.6 X 10⁴ 4.3 X 10³ 9
a None detected in 10 ml of 1:10 homogenate.
1064 APPL. MICROBIOL.
on June 13, 2018 by guesthttp://aem
.asm.org/
Dow
nloaded from
EXAMINATION OF MARKET FOODS FOR COLIFORMS
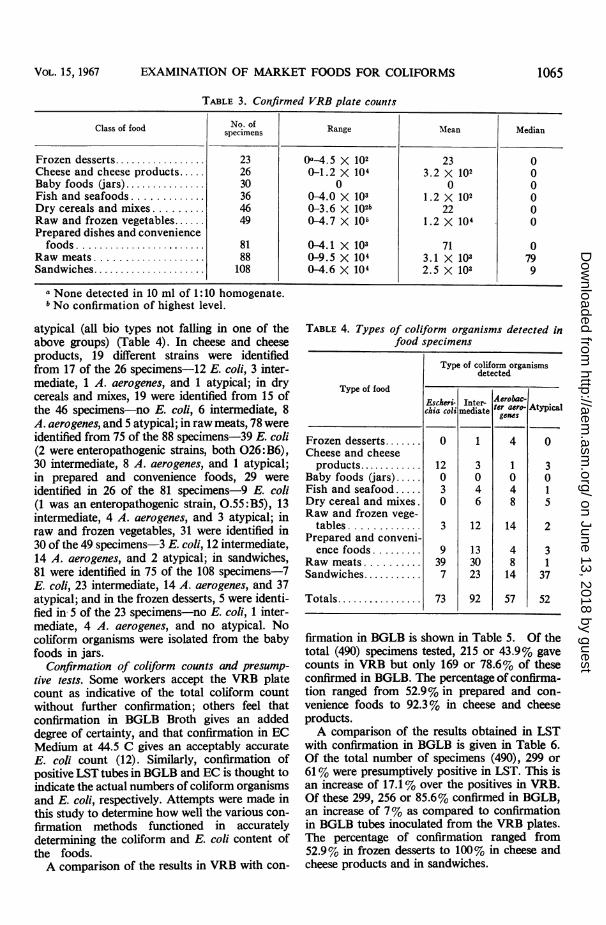
TABLE 3. Confirmed VRB plate counts
No. ofClass of food seinsRange Mean Median
Frozen desserts................. 23 Oa 4.5 X 10² 23 0Cheese and cheese products ..... 26 0-1.2 X 10⁴ 3.2 X 10² 0Baby foods (jars)............... 30 0 0 0Fish and seafoods ................36 0-4.0 X 10³ 1.2 X 10² 0Dry cereals and mixes ......... 46 0-3.6 X 10²b 22 0Raw and frozen vegetables ...... 49 0-4.7 X 10⁵ 1.2 X 10⁴ 0Prepared dishes and conveniencefoods........................ 81 0-4.1 X 10³ 71 0
Raw meats .................... 88 0-9.5 X 10⁴ 3.1 X 10³ 79Sandwiches..................... 108 0-4.6 X 10⁴ 2.5 X 10³ 9
a None detected in 10 ml of 1:10 homogenate.b No confirmation of highest level.
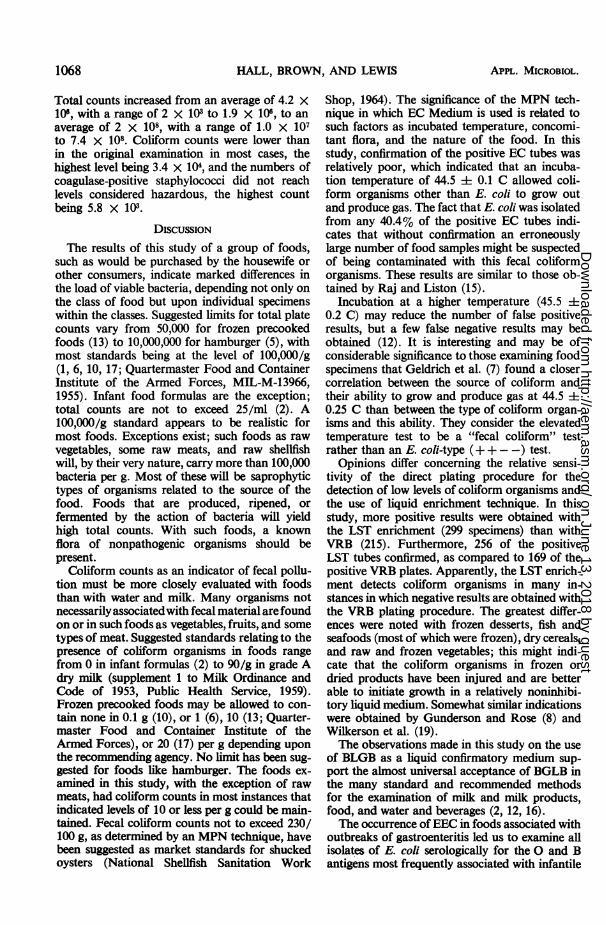
atypical (all bio types not falling in one of theabove groups) (Table 4). In cheese and cheeseproducts, 19 different strains were identifiedfrom 17 of the 26 specimens-12 E. coli, 3 inter-mediate, 1 A. aerogenes, and 1 atypical; in drycereals and mixes, 19 were identified from 15 ofthe 46 specimens-no E. coli, 6 intermediate, 8A. aerogenes, and 5 atypical; in raw meats, 78 wereidentified from 75 of the 88 specimens-39 E. coli(2 were enteropathogenic strains, both 026:B6),30 intermediate, 8 A. aerogenes, and 1 atypical;in prepared and convenience foods, 29 wereidentified in 26 of the 81 specimens-9 E. coli(1 was an enteropathogenic strain, 0.55:B5), 13intermediate, 4 A. aerogenes, and 3 atypical; inraw and frozen vegetables, 31 were identified in30 of the 49 specimens-3 E. coli, 12 intermediate,14 A. aerogenes, and 2 atypical; in sandwiches,81 were identified in 75 of the 108 specimens-7E. coli, 23 intermediate, 14 A. aerogenes, and 37atypical; and in the frozen desserts, 5 were identi-fied in' 5 of the 23 specimens-no E. coli, 1 inter-mediate, 4 A. aerogenes, and no atypical. Nocoliform organisms were isolated from the babyfoods in jars.
Confirmation of coliform counts and presump-tive tests. Some workers accept the VRB platecount as indicative of the total coliform countwithout further confirmation; others feel thatconfirmation in BGLB Broth gives an addeddegree of certainty, and that confirmation in ECMedium at 44.5 C gives an acceptably accurateE. coli count (12). Similarly, confirmation ofpositive LST tubes in BGLB and EC is thought toindicate the actual numbers of coliform organismsand E. coli, respectively. Attempts were made inthis study to determine how well the various con-firmation methods functioned in accuratelydetermining the coliform and E. coli content ofthe foods.A comparison of the results in VRB with con-
TABLE 4. Types of coliform organisms detected infood specimens
Type of coliform organismsdetected
Type of foodEscheri- Inter- Acrobac-chis coli mediate teroOacr- Atypical
genes
Frozen desserts.. 0 1 4 0Cheese and cheeseproducts.. 12 3 1 3
Baby foods (jars) 0 0 0 0Fish and seafood 3 4 4 1Dry cereal and mixes. 0 6 8 5Raw and frozen vege-
tables ............. 3 12 14 2Prepared and conveni-ence foods......... 9 13 4 3
Raw meats.... 39 30 8 1Sandwiches ........ 7 23 14 37
Totals ........... 73 92 57 52
firmation in BGLB is shown in Table 5. Of thetotal (490) specimens tested, 215 or 43.9% gavecounts in VRB but only 169 or 78.6% of theseconfirmed in BGLB. The percentage of confirma-tion ranged from 52.9% in prepared and con-venience foods to 92.3% in cheese and cheeseproducts.A comparison of the results obtained in LST
with confirmation in BGLB is given in Table 6.Of the total number of specimens (490), 299 or61% were presumptively positive in LST. This isan increase of 17.1% over the positives in VRB.Of these 299, 256 or 85.6% confirmed in BGLB,an increase of 7% as compared to confirmationin BGLB tubes inoculated from the VRB plates.The percentage of confirmation ranged from52.9% in frozen desserts to 100% in cheese andcheese products and in sandwiches.
VoL. 15p1967 1065
on June 13, 2018 by guesthttp://aem
.asm.org/
Dow
nloaded from

HALL, BROWN, AND LEWIS
TABLE 5. Positive specimens in VRB and confirmed in BGLB
Specimens positive Specimens confirmedin VRB positive in BGLB
Type of food No. of specimensin VRB_positive_in_BGLB
No. Per cent' No. Per centb
Frozen desserts ................... 23 10 43.5 6 60.0Cheese and cheese products ....... 26 13 50 12 92.3Baby foods (jars) ................. 33 0 0.0Fish and seafood................... 36 10 27.8 8 80.0Dry cereals and mixes.............. 46 9 19.6 8 88.9Raw and frozen vegetables ......... 49 26 53.1 18 69.2Prepared and convenience foods... 81 17 21.0 9 52.9Raw meats......................... 88 67 76.1 61 91.0Sandwiches ....................... 108 63 58.3 47 74.6
All types.... 490 215 43.9 169 78.6
a Of number of specimens.Of specimens positive in VRB.
TABLE 6. Positive specimens in LST and confirmed positives in BGLB
Specimens positive in Specimens confirmedLST in BGLB
Type of food No. of specimens _
No. Per centa No. Per cent5
Frozen desserts.................... 23 17 73.9 9 52.9Cheese and cheese products........ 26 16 61.5 16 100.0Baby foods (jars) .................. 33 0 0 _Fish and seafood.................... 36 20 55.6 16 80.0Dry cereals and mixes............... 46 15 32.6 12 80.0Raw and frozen vegetables .......... 49 35 71.4 28 80.0Prepared and convenience foods 81 38 46.9 28 73.7Raw meats.......................... 88 81 92.0 70 86.4Sandwiches........................ 108 77 71.3 77 100.0
All types............................ 490 299 61.0 256 85.6
a Of number of specimens.Oof specimens positive in LST.
A second comparison was made of the resultsobtained with LST; the number of positive tubesconfirming as E. coli based on positive EC tubeswas compared with the number shown culturallyto contain this organism (Table 7). Of the 299specimens positive in LST, 166 or 55.5% con-firmed in EC Medium; the percentage of confirm-ation ranged from 20% in dry cereals and mixesto 100% in cheese and cheese products. Subcul-tures made from the EC Medium, however,showed a much lower confirmation as deter-mined by IMViC results; only 73 or 43.9% of thepositive EC tubes (166) confirmed as E. coli. Thecultural confirmation ranged from none in drycereals and mixes and in frozen desserts to 76.5%in raw meats.The above findings show that coliform orga-
nisms other than E. coli gave positive EC tubes.
Some of the EC tubes contained mixtures of E.coli and other coliform organisms. Such tubesare considered to have been positive because ofthe presence of E. coli; other positive EC tubes,however, failed to yield isolates of E. coli. Thedistribution of the types is shown in Table 8.Of the EC tubes, 166 were positive, but isolateswere not obtained from six of these. Of the 160from which isolates were made, 65 or 40.4% con-tained E. coli either alone or in combination withother organisms, 41 or 25.4% contained inter-mediate, 29 or 18.1% contained A. aerogenes, and26 or 16.1% contained atypical strains.Of the 73 E. coli isolated from the foods, 65
or 89.0% were from positive EC tubes, but 41 or44.5% of the 92 intermediates, 29 or 50.9% of the57 A. aerogenes, and 26 or 50% of the 52 atypicalstrains were also positive in EC broth. In this
1066 APPL. MIICROBIOL.
on June 13, 2018 by guesthttp://aem
.asm.org/
Dow
nloaded from

EXAMINATION OF MARKET FOODS FOR COLIFORMS
TABLE 7. Positive specimens in LST and confirmed in EC broth and by culture as Escherichia coli
Specimens positive Confirmed as E. coli Confirmed as E. coli
Type of food No. of in LST in EC by culturespecimens
No. Per cent' No. Per centb No. Per centC
Frozen desserts ...... ........ 23 17 73.9 6 35.3 0 0.0Cheese and cheese products. 26 16 61.5 16 100.0 12 75.0Baby foods (jars).3.... .. .. .. ..33 0 0Fish and seafood.............. 36 20 55.6 10 50.0 3 30.0Dry cereals and mixes......... 46 15 32.6 3 20.0 0 0.0Raw and frozen vegetables.... 49 35 71.4 19 54.3 3 15.8Prepared and conveniencefoods....................... 81 38 46.9 18 47.4 9 50.0
Raw meats.................... 88 81 92.0 51 63.0 39 76.5Sandwiches .................. 108 77 71.3 43 55.8 7 16.3
All types...................... 490 299 61.0 166 55.5 73 43.9
a of number of specimens.b Of specimens positive in LST.c Of specimens positive in EC.
TABLE 8. Types of coliform organisms present in positive EC tubes
Poiietubes Positive tubes Positive Positive
Po.ositivE.cl with inter- tubes with tubes with
No. of No.itof wthpes ol mediate A. aerogeises atypicalType of food specimens pstEive wtyst types types types
tubes
No. Per cent No. Per cent No. Per cent No. Per cent
Frozen desserts ........................ 23 6a 0 0.0 1 33.3 2 66.7 0 0.0Cheese and cheese products ............ 26 16 11 68.7 2 12.5 1 6.3 2 12.5Baby foods (jars)...................... 33 0 0 0 0 0Fish and seafood...................... 36 l1a 3 42.1 3 42.9 1 14.2 0 0.0Dry cereals and mixes................ 46 3 0 0.0 0 0.0 2 66.7 1 33.3Raw and frozen vegetables............. 49 19 3 15.8 7 36.8 9 47.3 0 0.0Prepared and convenience foods ....... 81 18 8 44.4 7 38.8 2 11.1 1 5.5Raw meats ........................... 88 51 33 64.8 13 25.5 5 9.8 1 1.9Sandwiches............................ 108 43 7 16.3 8 18.5 7 16.3 21 48.8
All types .............................. 490 1668 65 40.4 41 25.4 29 18.1 26 16.1
a No isolates of coliform organisms were obtained from three of the positive EC tubes. Percentagescalculated on basis of 3, 7, and 160, respectively.
study, only about 40% of the positive EC tubesconfirmed as E. coli; the remaining 60% werecaused by other coliform organisms.
Additional examinations of prewrapped sand-wiches. The prewrapped sandwiches were studiedas a group and were tested more extensively thanthe other categories. These 108 specimens wereexamined for the presence of coagulase-positivestaphylococci, Clostridium perfringens, Bacilluscereus, salmonellae, shigellae, and enterococci.The methods used were essentially those pre-viously described (12, 14).No isolations of salmonellae or shigellae were
obtained. In 18 or 16.7% of the specimens, therewere coagulase-positive staphylococci, but in
numbers that were detectable by enrichmentonly; 10 or 9.2% contained C. perfringens, andthese also were isolated by enrichment methods.Typical B. cereus strains in very low numberswere found in four or 3.7 %; counts of enterococciranged from 220 to 450,000/g, with 37 or 34.2%containing these organisms.
One-half of each sandwich was originally ex-amined for the above organisms, and the otherhalf was stored frozen at -15 C. Twelve of the18 sandwiches showing the presence of coagulase-positive staphylococci were subjected to mishand-ling by exposing the remaining half to roomtemperature (24 to 27 C) for 48 hr and then testingfor total, coliform, and staphylococcal counts.
VOL. 15, 1967 1067
on June 13, 2018 by guesthttp://aem
.asm.org/
Dow
nloaded from
HALL, BROWN, AND LEWIS
Total counts increased from an average of 4.2 X10⁶, with a range of 2 X 10³ to 1.9 X 10⁶, to anaverage of 2 X 10⁸, with a range of 1.0 x 10⁷to 7.4 x 10⁸. Coliform counts were lower thanin the original examination in most cases, thehighest level being 3.4 X 10⁴, and the numbers ofcoagulase-positive staphylococci did not reachlevels considered hazardous, the highest countbeing 5.8 X 10³.
DISCUSSIONThe results of this study of a group of foods,
such as would be purchased by the housewife orother consumers, indicate marked differences inthe load of viable bacteria, depending not only onthe class of food but upon individual specimenswithin the classes. Suggested limits for total platecounts vary from 50,000 for frozen precookedfoods (13) to 10,000,000 for hamburger (5), withmost standards being at the level of 100,000/g(1, 6, 10, 17; Quartermaster Food and ContainerInstitute of the Armed Forces, MIL-M-13966,1955). Infant food formulas are the exception;total counts are not to exceed 25/ml (2). A100,000/g standard appears to be realistic formost foods. Exceptions exist; such foods as rawvegetables, some raw meats, and raw shellfishwill, by their very nature, carry more than 100,000bacteria per g. Most of these will be saprophytictypes of organisms related to the source of thefood. Foods that are produced, ripened, orfermented by the action of bacteria will yieldhigh total counts. With such foods, a knownflora of nonpathogenic organisms should bepresent.
Coliform counts as an indicator of fecal pollu-tion must be more closely evaluated with foodsthan with water and milk. Many organisms notnecessarily associatedwith fecal material are foundon or in such foods as vegetables, fruits, and sometypes of meat. Suggested standards relating to thepresence of coliform organisms in foods rangefrom 0 in infant formulas (2) to 90/g in grade Adry milk (supplement 1 to Milk Ordinance andCode of 1953, Public Health Service, 1959).Frozen precooked foods may be allowed to con-tain none in 0.1 g (10), or 1 (6), 10 (13; Quarter-master Food and Container Institute of theArmed Forces), or 20 (17) per g depending uponthe recommending agency. No limit has been sug-gested for foods like hamburger. The foods ex-amined in this study, with the exception of rawmeats, had coliform counts in most instances thatindicated levels of 10 or less per g could be main-tained. Fecal coliform counts not to exceed 230/100 g, as determined by an MPN technique, havebeen suggested as market standards for shuckedoysters (National Shellfish Sanitation Work
Shop, 1964). The significance of the MPN tech-nique in which EC Medium is used is related tosuch factors as incubated temperature, concomi-tant flora, and the nature of the food. In thisstudy, confirmation of the positive EC tubes wasrelatively poor, which indicated that an incuba-tion temperature of 44.5 i 0.1 C allowed coli-form organisms other than E. coli to grow outand produce gas. The fact that E. coli was isolatedfrom any 40.4% of the positive EC tubes indi-cates that without confirmation an erroneouslylarge number of food samples might be suspectedof being contaminated with this fecal coliformorganisms. These results are similar to those ob-tained by Raj and Liston (15).
Incubation at a higher temperature (45.5 ±t0.2 C) may reduce the number of false positiveresults, but a few false negative results may beobtained (12). It is interesting and may be ofconsiderable significance to those examining foodspecimens that Geldrich et al. (7) found a closercorrelation between the source of coliform andtheir ability to grow and produce gas at 44.5 i0.25 C than between the type of coliform organ-isms and this ability. They consider the elevatedtemperature test to be a "fecal coliform" testrather than an E. coli-type (+ + - -) test.
Opinions differ concerning the relative sensi-tivity of the direct plating procedure for thedetection of low levels of coliform organisms andthe use of liquid enrichment technique. In thisstudy, more positive results were obtained withthe LST enrichment (299 specimens) than withVRB (215). Furthermore, 256 of the positiveLST tubes confirmed, as compared to 169 of thepositive VRB plates. Apparently, the LST enrich-ment detects coliform organisms in many in-stances in which negative results are obtained withthe VRB plating procedure. The greatest differ-ences were noted with frozen desserts, fish andseafoods (most of which were frozen), dry cereals,and raw and frozen vegetables; this might indi-cate that the coliform organisms in frozen ordried products have been injured and are betterable to initiate growth in a relatively noninhibi-tory liquid medium. Somewhat similar indicationswere obtained by Gunderson and Rose (8) andWilkerson et al. (19).The observations made in this study on the use
of BLGB as a liquid confirmatory medium sup-port the almost universal acceptance of BGLB inthe many standard and recommended methodsfor the examination of milk and milk products,food, and water and beverages (2, 12, 16).The occurrence ofEEC in foods associated with
outbreaks of gastroenteritis led us to examine allisolates of E. coli serologically for the 0 and Bantigens most frequently associated with infantile
1068 APPL. MICROBIOL.
on June 13, 2018 by guesthttp://aem
.asm.org/
Dow
nloaded from
EXAMINATION OF MARKET FOODS FOR COLIFORMS
diarrhea. Two isolates of 026:B6 and one of055:B5 were obtained. The two 026:B6 strainswere obtained from cubed beef steak and porkliver, and the 055:B5, from frozen gravy andsliced beef.The organisms present in the steak and liver at
levels of 410/g were the only coliform typesdetected, but the meat was raw, and they prob-ably would have been killed by cooking. The gravyand sliced beef, on the other hand, was a prepareddish, and mishandling might have allowed an in-crease in numbers. In this instance, however, thestrain was isolated only after enrichment in LSTbroth, the VRB plate count being negative.The results obtained indicate that the occur-
rence of EEC in outbreak foods is more apt to bedue to contamination by a food handler than tothe presence of the organisms in the food itself.Studies carried out in this laboratory showed thatabout 6% of 219 specimens of feces from healthyfood handlers contained one or more strains ofEEC (9), whereas only 0.6% of the 490 food speci-mens in this study contained EEC. The implica-tion of food handlers in this type of foodbornedisease is substantiated by observations in othercountries (3).
LITERATURE CITED1. ABRAHAMSON, A. E., L. BUCHBINDER, J. GUENKEL,
AND M. HELLER. 1959. A study of frozen pre-cooked foods: Their sanitary quality and micro-biological standards for control. Assoc. FoodDrug Officials U.S. Quart. Bull. 23:63-72.
2. AMERICAN PUBLIC HEALTH ASSOCIATION. 1960.Standard methods for the examination of dairyproducts, p. 130, 11th ed. American PublicHealth Association, Inc., New York.
3. COSTIN, I. D., D. VOICULESCU, AND V. GORCEA.1964. An outbreak of food poisoning in adultsassociated with Escherichia coli serotype86:B7:H34. Pathol. Microbiol. 27:68-78.
4. EDWARDS, P. R., AND W. H. EWING. 1962. Iden-tification of the enterobacteriaceae. BurgessPublishing Co., Minneapolis.
5. ELFORD, W. C. 1936. Bacterial limitations inground fresh meat. Am. J. Public Health.26:1204-1206.
6. FiTZGERALD, G. A., AND W. S. CONWAY. 1937.Sanitation and quality control in the fisheryindustries. Am. J. Public Health 27:1094.
7. GELDREICH, E. E., R. H. BORDNER, C. B. HUFF,H. F. CLARK, AND P. W. KABLER. 1962. Typedistribution of coliform bacteria in the feces ofwarm-blooded animals. J. Water PollutionControl Federation. 34:295-301.
8. GUNDERSON, M. F., AND K. D. ROSE. 1948. Sur-vival of bacteria in a precooked fresh frozenfood. Food Res. 13:254-263.
9. HALL, H. E., AND G. H. HAUSER. 1966. Examina-tion of feces from food handlers for salmonellae,shigellae, enteropathogenic Escherichia coli andClostridium perfringens. Appl. Microbiol.14:928-933.
10. HOBBS, B. C. 1959. Sampling and examination offoodstuffs and interpretation of results.Munici. Eng. Motor Public Health 136:469-470.
11. KELLY, C. B. 1960. Bacteriological criteria formarket oysters. Robert A. Taft Sanitary Eng.Center Tech. Rept. F60-2.
12. LEWiS, K. H., AND R. ANGELoTrI. 1964. Examina-tion of foods for enteropathogenic and in-dicator bacteria. U.S. Public Health Serv.Publ. 1142.
13. MASSACHUSETTS DEPARTMENT OF PUBLIC HEALTH.1960. Rules and regulations relative to thestorage and distribution of frozen foods.Bureau of Consumer Products Protection.Division of Food and Drugs. Boston.
14. MOSSEL, D. A. A., M. J. KOOPMAN, AND E.JONERIUS. 1966. The enumeration of Bacilluscereus in foods. Antonie von LeeuwenhoekJ. Microbiol. Serol. 32:453-456.
15. RAJ, H., AND J. LISTON. 1961. Detection andenumeration of fecal indicator organisms infrozen sea foods. I. Escherichia coli. AppI.Microbiol. 9:171-174.
16. SHARF, J. M. 1966. Recommended methods forthe microbiological examination of foods, 2nded. American Public Health Association, Inc.,New York.
17. THATCHER, F. S. 1963. The microbiology ofspecific frozen foods in relation to publichealth: Report of an international committee.J. Appl. Bacteriol. 26:266-285.
18. UEDA, S., S. SOAKI, AND M. KOHUTO. 1959. Thedetection of Escherichia coli 055 in an outbreakof food poisoning. Nippon Saikingaku Zasshi14:48-49.
19. WILKERSON, W. B., J. C. AYERS, AND A. A. KRATr.1961. Occurrence of enterococci and coliformorganisms on fresh and stored poultry. FoodTechnol. 15:286-292.
VOL. 15, 1967 1069
on June 13, 2018 by guesthttp://aem
.asm.org/
Dow
nloaded from