ex-post/final evaluation of the trans- european transport … · derycke, stefaan de corte from...
TRANSCRIPT

Deloitte Consulting SCRL
Société coopérative à responsabilité limitée
Siège social: Avenue Louise 240, B-1050 Bruxelles
TVA BE 0474.429.572 - RPM Bruxelles - KBC 437-7505991-72
European Commission
DG TREN Contract TREN/06/ADM/S07.67266 2006
Ex-post/Final evaluation of the Trans-European Transport Network Multi-annual Indicative Programme 2001-2006
Final Report –November 2007

Ex-post / Final evaluation of the TEN-T MIP –Final Report – November 2007
2
TABLE OF CONTENTS 1. EXECUTIVE SUMMARY 8
1.1. TEN-T PRIORITY PROJECTS AND THE MIP 8 1.2. METHODOLOGY 8 1.3. CONCLUSIONS AND RECOMMENDATIONS 11
2. INTRODUCTION 14 2.1. INTRODUCTION 14 2.2. PURPOSE AND EXPECTED CONTRIBUTION OF THE EVALUATION 14 2.3. KEY FEATURES OF THE EVALUATION WORK 15
3. THE TEN-T MIP - CONTEXT 16 3.1. THE TRANS-EUROPEAN NETWORK TRANSPORT 16 3.2. THE MULTI-ANNUAL INDICATIVE PROGRAMME 20 3.3. THE EUROPEAN TRANSPORT POLICY FOR 2010: A PROGRESS STATUS 21
4. METHODOLOGY 22 4.1. KEY ELEMENTS RELATING TO THE EVALUATION PROCESS 22
4.1.1. Scope of our intervention 22 4.1.2. Overall evaluation approach and data sources 23
4.2. KEY ISSUES TO BE CONSIDERED 24 4.2.1. Evaluation at programme level 24 4.2.2. Availability and comparability of quantitative data 24 4.2.3. Definition of objectives and assessment of effectiveness and impact 24
4.3. EVALUATION DESIGN 25 4.3.1. Tools and techniques used during the evaluation process 25
4.4. ELEMENTS IN RELATION TO THE LIMITS OF VALIDITY AND HYPOTHESES IN RELATION TO THE EVALUATION METHODS 27
4.4.1. Lack of quantitative information 27 4.4.2. Interviewees 27 4.4.3. Evaluation of theme A – at project level 28
5. ANSWERS TO EVALUATION QUESTIONS 29 5.1. THEME A: ASSESSMENT AT PROJECT LEVEL 29
5.1.1. Projects included in the sample 31 5.1.2. Evaluation criteria and limitations of the approach 34 5.1.3. Findings from the analysis by project 35 5.1.4. Conclusions of the analysis by project 40
5.2. THEME C: EVALUATION AT PROGRAMME LEVEL 41 5.2.1. Evaluation sub-questions 41 5.2.2. Limitation of the approach 41 5.2.3. Effectiveness 41 5.2.4. Relevance 54 5.2.5. Impacts 57 5.2.6. Efficiency 71 5.2.7. Sustainability 73
5.3. THEME B: ASSESSMENT OF THE MANAGEMENT OF THE TEN-T MIP 75 5.3.1. Evaluation Judgement criteria and limitations of the approach 75 5.3.2. Effectiveness and efficiency of the MIP procedures 75 5.3.3. Influence of the recent changes on the overall MIP management 88 5.3.4. Performance comparison between MIP and TEN-T annual calls 90 5.3.5. Overall conclusions 91

Ex-post / Final evaluation of the TEN-T MIP –Final Report – November 2007
3
6. CONCLUSIONS 93
7. RECOMMENDATIONS 96
8. ANNEXES 100 8.1. ANNEX 1 – LIST OF INTERVIEWEES 100 8.2. ANNEX 2 – INTERVIEW GUIDES 100 8.3. ANNEX 3 – STRUCTURE OF THE DATABASE DEVELOPED DURING THE EVALUATION STUDY 100 8.4. ANNEX 4 – BIBLIOGRAPHY 100 8.5. ANNEX 5 – INDIVIDUAL PROJECT RESULTS (PROJECTS DATABASE) 100 8.6. ANNEX 6 – BACKGROUND INFORMATION ON EUROPEAN TRANSPORT 100

Ex-post / Final evaluation of the TEN-T MIP –Final Report – November 2007
4
LIST OF TABLES Table 1 : Interviews – distribution by category of interviewees .......................................................... 26
Table 2 : Project cycle Phases.............................................................................................................. 30
Table 3 : List of projects included in the sample................................................................................. 31
Table 4 : Absorption rate of projects ................................................................................................... 37
Table 5 : MIP support in relation to eligible costs. ............................................................................. 37
Table 6 : Absorption rate by member state .......................................................................................... 38
Table 7 : Absorption rate by type of project (new/upgrading) ............................................................ 38
Table 8 : Absorption rate in relation to eligible costs ......................................................................... 39
Table 9 : Absorption rate by maturity rate at outset............................................................................ 39
Table 10 : Absorption rate as a function of national interest ............................................................. 40
Table 11: Absorption Rate by Phase and by Year ............................................................................... 45
Table 12 Average number of AFD’s not adopted by project............................................................... 45
Table 13: Cost Types and Description of Activities............................................................................. 52
Table 14: Projects in operation ............................................................................................................ 59
Table 15: TEN-T operational objectives.............................................................................................. 61
Table 16: TEN-T Strategic Objectives ................................................................................................. 64
Table 17: Overview of the profitability indicators received per project (amounts in million €) ........ 72
Table 18: Project distribution by project phase (sample).................................................................... 84
Ex-post / Final evaluation of the TEN-T MIP –Final Report – November 2007
5
LIST OF FIGURES Figure 1 : Variation around the mean of annual funding ................................................................. 36
Figure 2 : Procedures for MIP and Annual Calls .............................................................................. 42
Figure 3: Absorption Rate of Projects by Year ................................................................................... 44
Figure 4: Smooth and Timely Financing ............................................................................................ 53
Figure 5 : Existence of the project without the MIP........................................................................... 56
Figure 6: Logic Tree: Strategic/Operational Objectives ..................................................................... 58
Figure 7: Main Operational Objectives of the Projects (one per project) .......................................... 62
Figure 8: Amount invested in each operational objective .................................................................. 64
Figure 9: First and second expected project impacts on the TEN-T strategic objectives.................. 66
Figure 10: Total amount invested by strategic objective..................................................................... 67
Figure 11: Transport modality sharing among the projects ............................................................... 69
Figure 12: Overall MIP process .......................................................................................................... 76
Figure 13: MIP planning and project planning (hypothetical).......................................................... 77
Figure 14: MIP selection process ........................................................................................................ 79
Figure 15: Interest of the MIP preliminary application form ............................................................ 81
Figure 16: Overall follow-up process .................................................................................................. 85
Figure 17: Annual Financial Decision closing................................................................................... 87
Figure 18: Tangible results of the 2004 MIP revision........................................................................ 89
Ex-post / Final evaluation of the TEN-T MIP –Final Report – November 2007
6
LIST OF ACRONYMS
AFD Annual Financial Decision
EIA Environmental Impact Assessment
EP European Parliament
GR Coherent Group of Projects
ISC Interservice Consultation
ISIC International Standard Industrial Classification
MIP Multi-annual Indicative Programme
MS Member State
PMS Project Management System
PP Priority Project
PPP Public-Private Partnerships
Pr Project
PSR Project Status Report
TEN-T Trans-European Transport network
TEN-T FAC TEN-T Financial Assistance Committee

Ex-post / Final evaluation of the TEN-T MIP –Final Report – November 2007
7
Disclaimer
The views and comments expressed in this text are the responsibility of Deloitte and do not necessarily reflect the opinion of the European Commission.
Acknowledgements
This assignment was conducted by a team of Deloitte, headed by Richard Doherty and Luc Chalsège, and with the support of:
• Gilles Devillers, Benoît Vandresse, Lydia Da Silva Gaspar, Liesbet Bonnarens, Marc Derycke, Stefaan De Corte from Deloitte,
• Amandine Stevens, Hugues Duchâteau from Stratec.
The production of this report would not have been possible without the efforts of the many interviewees that we met during our fieldwork. The authors would like to express their gratitude to all of them.
Finally, the evaluation team would like to thank the many Commission officials who have been helpful and co-operative in providing information and feedback during the course of the assignment.

Ex-post / Final evaluation of the TEN-T MIP –Final Report – November 2007
8
1 . E X E C U T I V E S U M M A R Y
The objective of this evaluation was to assist the European Commission in assessing the appropriateness and the effectiveness of the Multi-annual Indicative Programme (MIP) 2001-2006 in the context of the Trans-European Transport Networks (TEN-T).
The Report contains:
• an assessment of the policy context in which the Commission worked during this period; • a presentation of our methodology; • the findings of our analysis, presented according to the three main levels of assessment:
o project level o management level o programme level
• conclusions and recommendations.
A comprehensive searchable database for DG TREN to use as a repository of data on the TEN-T and the MIP was also constructed and has been made available to the Commission for future use.
The evaluation did not aim at evaluating individual projects or the entire TEN-T initiative but to evaluate only the MIP at programme level as a policy tool, and as an innovation in the overall TEN-T process in terms of:
• Relevance • Utility • Sustainability • Effectiveness • Efficiency • Impact
1.1. TEN-T priority projects and the MIP
In 2000 there were 14 TEN-T Priority Projects. They have target dates for completion of 2010 at the latest. Three are already complete, and several are already partially operational. They include road projects as well as more environmentally friendly projects. These projects can obtain funding of up to 50% from the MIP for preparatory studies and 10% for investment (20% since 2005 for cross-border projects).
The MIP was a break with the past in that it offered the possibility of multi-year funding. The funding decisions are still made annually, but the procedures were streamlined. It was also intended that the MIP should act as a catalyst for public-private partnerships, and that the system’s new procedures would offer greater flexibility when projects hit technical, financial, legal or environmental obstacles.
1.2. Methodology
Qualitative and existing quantitative data were evaluated in particular from:
• a large and well structured consultation of the main parties involved in the MIP; • existing data available at Member States level and/or at project level;

Ex-post / Final evaluation of the TEN-T MIP –Final Report – November 2007
9
• key policy documents and studies1; • interviews with the stakeholders.
Theme A: Assessment at project level
48 of the 177 MIP projects co-financed during 2001-2006 and accounting for more than 50% of the funding were assessed. The performance of these projects was based on:
• the absorption rates of funding; • the ratio of the support awarded to the total eligible cost.
These ratios are a proxy for the projects' performance. Overall, the projects best able to absorb the MIP funding were large, mature, high profile projects in new infrastructure. In general, these projects were already a national priority. Only thanks to these projects the objective to support the most sizable projects was essentially met.
Theme B: Assessment of the management of the TEN-T MIP
The evaluation of the effectiveness and efficiency of the MIP considered whether the procedures contributed to achieving the objective of the MIP in terms of support to achievement of the objectives of the TEN-T, and whether the MIP mechanisms for implementation were optimal and cost-efficient, in other words whether the same result have been achieved at less cost.
The procedures were considered under our headings:
• Programme Planning • Project Selection • Project Follow-up • Financial Processes
In terms of planning, the MIP was intended to provide greater predictability over a period of six years. However, the fact that national planning cycles and systems vary meant that the MIP did not always fit well with Member State frameworks. The projects which fitted best were those which were so mature that they were no longer subject to political, technical or other delays. This created a paradox since the MIP was intended to leverage projects facing implementation obstacles. Where the MIP characteristically succeeded in that respect was in ensuring that the mature projects were implemented when others were facing budget cuts.
Once a project was successful in the selection process in 2001, it was assured of funding for the whole MIP period providing it went ahead. A revision in 2004 opened up the possibility for new application or for existing projects to obtain more funding following withdrawal from the list of projects. The selection process originally consisted of a preliminary application form followed by a detailed application form. In the 2004 revision, only the detailed application form was used.
The principal selection criteria were the degree of contribution to TEN-T objectives and European policies, economic viability, timing and maturity, impact on environmental and socio-economic development and financial need.
Ex post it is possible to say that the projects did comply with the criteria on contribution to TEN-T objectives and European policies, and on economic viability. However, insufficient information ex
1 A bibliography is to be found in Annex 4.

Ex-post / Final evaluation of the TEN-T MIP –Final Report – November 2007
10
ante is available to judge the selection process. Upfront environmental and socio-economic impact assessments were largely lacking or out-of-date. A number of the projects selected proved not to be mature enough to sustain their funding plans. In part, this appears to be attributable to the ‘political’ element and a prior negotiation process which preceded the formal application process. That process was positively valued by the beneficiaries.
Delays were created due to complexity in recovery of payments, amendments to annual financing decisions and a MIP revision.
Estimates show that 26 of 50 projects would have gone ahead without MIP funding so it is hard to judge whether the financial need criterion was met. The monitoring process consisted mainly of the project status report (PSR), a tool for technical and financial reporting that in the MIP has been used for releasing further funding and to trigger decision modification. Beneficiaries recognise the need for reporting, but expressed some dissatisfaction with the PSR format. Reasons included frequent changes, delays and problems with translations, differing reporting requirements for the MIP and the Structural Funds. From the Commission’s point of view, the PSR was too focused on budgets and compliance with EU legislation and did not provide adequate information needed for monitoring technical contents and changes. Moreover, from the Commission management side, the PSR data cannot be automatically uploaded into the Project Management System (PMS) and remain practically without follow up.
The key financial procedure is the triggering of the payment. This procedure is highly control-oriented and often creates a dual workload in meeting the requirements of Member State reporting. The time Commission officials require to verify payments leaves them little time to look at the broader picture.
Management procedures were revised in 2004 to reflect new TEN-T guidelines, enlargement and experience with the MIP. The main impact was the redistribution of funds. More technical changes were less well understood because of problems in communicating the content of the Revision both at Commission and Member State level. Communication of procedural changes during the life of the MIP was generally an area which could have been improved, particularly had officials not needed to devote so much time to control procedures.
The MIP procedures turned out to be more complex than initially expected, but were nevertheless an advantage over the parallel non-MIP funding.
Theme C: Evaluation at programme level
At programme level, the evaluation dealt with effectiveness, relevance, impact, efficiency and sustainability.
Effectiveness took into account predictability of the MIP, the accountability of the beneficiaries, the extent to which the MIP promoted public-private partnerships and the degree of flexibility of the MIP in dealing with unforeseen technical or financial events.
By the end of the MIP period, only 10% of the projects had received exactly the initially planned amount. 32% received more and 58% received less. Those who received more did so because the system rewarded performance and/or because they were in a position to benefit from and were aware in time of the redistribution of funds at the 2004 Revision. For others, the lack of predictability lay as much with unforeseen problems with their projects than with the MIP.
However, the analysis of the time required for payments also threw up concerns about smoothness and timeliness of the payment flows and the impact this had on the predictability of non-MIP/TEN-T projects as Member States gave MIP projects priority for working capital in the interim.

Ex-post / Final evaluation of the TEN-T MIP –Final Report – November 2007
11
The management procedures did not make accountability more effective and had no impact on the project decisions. On the contrary, they generally created a significant administrative burden.
The flexibility of the MIP was not well communicated. The fact that the MIP penalises under-performance was well grasped but the contrary for over-performers was not. The beneficiaries recognized the need for accountability; however, the procedures did not necessarily improve accountability. Technical issues and high staff turnover were the reasons.
In relation to Public-Private Partnership (PPP), the MIP did not play a relevant role. The MIP projects were almost without exception non-PPP. This can be explained by the fact that this type of large infrastructure project does not generally meet the criteria that will generate private sector investment. While MIP financing can signal to private investors that the public sector is committed to the project, it can also ‘crowd out’ alternative sources of financing, thus undermining the desired result of promoting PPP initiatives. But the analysis goes beyond the MIP and pointed out the absence in most Member States of a policy of encouraging PPP. More EC resources and a higher profile for PPP in selection criteria were needed.
In general, the political dimension of TEN-T and the signalling function of MIP funding act as a catalyst to implement projects at a faster rate.
Evaluating the impact of such long-term projects is intrinsically difficult. Many projects in the sample were already operational, but these ‘projects’ were in most cases just part of much vaster TEN-T schemes. The TEN-T objectives are broad and not always well defined and their full impact will only be realised when the full TEN-T network is operational.
The impacts are so far national, and are primarily on missing links between large cities and isolated regions, bottlenecks and upgrading infrastructure to speed up traffic flows. At a strategic level, the impact is mainly on the free movement of people and goods, traffic, cross-border/transnational cooperation, regional development and sustainable development.
Very little existing analysis of the MIP projects was made available in terms of net present value, cost-benefit ratios, internal rates of return of payback periods, making it difficult to draw conclusions about efficiency
1.3. Conclusions and Recommendations
The 2001-2006 MIP was effective, efficient and relevant in many respects. Predictability combined with flexibility were overriding success factors even if procedural issues cloud the picture. The value attached by beneficiaries to not losing the funding through underperformance meant that the MIP was a key factor in on-time implementation of these projects. The 2004 Revision was in some instances an additional performance incentive.
The downside was the tendency of mature projects with high national commitment to self-select. These were frequently projects which would often have proceeded in any event, though not necessarily quite as fast. We conclude that the Commission could reduce the rate of funding for such projects and still retain political leverage, while at the same time freeing funds for projects where the European interest is greater than the national interest. These are typically cross-border projects in the broadest sense of the word.
The MIP was not effective in achieving its objective of encouraging public-private partnerships. The instability of the management procedures over the life of the MIP affected the effectiveness, efficiency and relevance of the programme. Minimising the administrative burden and the need to demand accountability and transparency were controversial. These issues would have been less prominent if

Ex-post / Final evaluation of the TEN-T MIP –Final Report – November 2007
12
more attention had been paid to communicating on them and on dialogue with beneficiaries. The ‘control culture’ left insufficient time for this.
As part of the streamlining of procedures, account should be taken of placing more emphasis on providing upfront indicators which will make it possible to evaluate impact ex post. It must be recognised that this will always be a challenge for individual MIP projects whose full benefit depends on completion of other projects, and often on the full implementation of the complete TEN-T project of which they are part. Ex post, we conclude that the MIP funds did go in the 2001-2006 period to projects which did have a socio-economic impact, particularly at national level. However, the Commission could play a greater role in ensuring that more attention is paid to this and also in developing basic indicators and criteria which will give it a much enhanced ability to compare different projects, and thus significantly improve its ability to be sure ex ante that it has selected the projects which will make the best use of the MIP funds.
Finally, the streamlining of the procedures can and should save time for desk officers of the TEN-T Agency to take a broader view of MIP projects, so that they have a better understanding of their context and their respective merit. Desk research and site visits should be regarded as an integral part of their work. All this is in the interest of improved project selection and dialogue with Member States and project promoters, and therefore of the TEN-T.
Main recommendations for maximising effectiveness, efficiency, relevance and impact of the MIP are the following:
Objectives and funding rates
• The primary objective of the MIP be to fund projects of high European interest, which will fill missing links or eliminate bottlenecks;
• the rate at which studies for projects of high European interest and low national interest is funded be increased;
• the rates at which investment projects are funded be modified, with projects of high European interest and low national commitment being eligible for grants of 30% and other projects be restricted to grants of 5% of total eligible cost;
• the TEN-T coordinators be asked to define which are the projects of high European interest and low national commitment.
PPPs
• Encouragement of Public-Private Partnerships (PPP) continue to be an objective, and; • the European Commission collect and disseminate in a structured manner information on best
practice in transport infrastructure PPP or other instruments designed in order to facilitate access to private sources of financing, such as the EIB loan guarantee or the risk capital facility;
• the financing rate be increased for studies on the suitability of investment projects for PPP; • the financing rate be 30% for any project financed by a PPP.
Procedures
• A revision of the MIP Framework Decision in order to redistribute funds likely to be under-utilised be automatic after four years, and that any other revisions be announced six months in advance;
• the Commission further refine its work on the definition of concepts, using standard terminology and international classifications, and launch a consultation with Member States on a core set of standardised definitions for indicators, including net present value, cost-benefit analysis and internal rate of return;

Ex-post / Final evaluation of the TEN-T MIP –Final Report – November 2007
13
• the Commission launch discussion on whether Member States could choose between annual and biannual instalments in order to provide greater flexibility and be better adapted to the range of planning processes which exists across the EU;
• the initial Framework Decision be flanked by an Annual Financial Decision in order to make a clear distinction between documents containing a general description of activities and those containing specific descriptions which are used to trigger payments;
• the application form, project appraisal forms and project status report forms be redesigned to incorporate information which will serve as a starting point for ex post evaluation;
• the Commission’s Project Management System be upgraded to enable it to accept data from web-based forms, and to aggregate information from financial decisions.
Communication
• Clear communication of all procedural changes be regarded as a priority; • time saved as a result of improved procedures be seen as an opportunity for desk officers to devote
time to deepening their understanding of individual projects and of TEN-T’s in general and to promote dialogue with Member States and project promoters.
Ex-post / Final evaluation of the TEN-T MIP –Final Report – November 2007
14
2 . I N T R O D U C T I O N
2.1. Introduction
This evaluation is intended to assist the European Commission to assess the appropriateness and the effectiveness of the Multi-annual Indicative Programme (MIP) 2001-2006 in the context of the Trans-European Transport Networks (TEN-T).
The evaluation study ran from late December 2006 to October 2007. This is the Final Report accompanied by a PowerPoint presentation of the main results of the study and an overview of the recommendations. This report also includes an Executive Summary.
This Report contains:
• an assessment of the policy context in which the Commission has been working (section 3);
• a presentation of the methodology we have followed (section 4);
• the findings of our analysis, presented according to the three main themes of the evaluation (section 5); and
• conclusions and recommendations (section 6).
The contract also required us to construct a comprehensive searchable database for DG TREN to use as a repository of data concerning the TEN-T and the MIP. This database naturally remains usable for the Commission in the future.
2.2. Purpose and expected contribution of the evaluation
The general objectives of the evaluation are summarised as follows:
• to assess the main descriptive elements of the Multi-annual Indicative Programme 2001-2006;
• to carry out an ex-post/final evaluation of the TEN-T MIP 2001-2006, establishing to what extent it has been able to stimulate the development of the TEN-T and to what extent it has contributed to the achievement of the TEN-T Guidelines’ priorities, and in particular to promote the modal split to more environmental friendly transport modes, to improve interoperability, to give access to outlying areas, and to promote multi-modality;
• to appraise the chosen mechanisms of programme implementation - and the impacts of each relevant modification of procedures and priorities;
• to identify the Community added value of the programme at national and EU level;
• to identify lessons to be learned from the selection, design and implementation of the projects, in order to improve the next TEN-T Multi-annual Programme 2007-2013;
• to perform a final evaluation of the contribution of the TEN-T MIP to the completion of the 14 Essen projects, mainly in terms of effectiveness, efficiency, Community added value, impact at network level, management and implementation systems.

Ex-post / Final evaluation of the TEN-T MIP –Final Report – November 2007
15
It is important to note that we have not sought to evaluate the projects or the overall TEN-T initiative as such. That work is carried out under other frameworks, and we have focused on the specific issues mentioned above, concentrating chiefly on the MIP as an innovation in the overall TEN-T process. We have benefited, nevertheless, from available relevant information, both descriptive and evaluative.
The evaluation covers three themes:
• Theme A – Assessment at project level: the evaluation focused on effectiveness, as well as on the relevance of the Community intervention. The emphasis was upon distilling from the project level output an overall understanding of the programme implementation and results;
• Theme B – Assessment of the management of the TEN-T MIP: at the programme management level, the evaluation concentrates on whether the systems, structure and procedures in place contributed to the effective and efficient implementation of the Programme. It also investigates the impact of various procedural changes introduced during the period under review;
• Theme C – Evaluation at programme level: finally, the relevance, utility, sustainability, effectiveness, efficiency and impact (development of the TEN-T and contribution to the objectives promoted by the Guidelines) of the programme have been evaluated.
2.3. Key features of the evaluation work
While section 4 below describes our methodology and approach in more detail, it is worthwhile noting some key points at this initial stage of the report:
• by spending significant effort in consulting with national- and project-level stakeholders and the managers of the projects, we gained valuable insight into the programme and its operational issues and;
• we used these insights to overcome the relative shortage and/or lack of comparability of data that exists at European level;
• we encouraged stakeholders to volunteer experiences and ideas regarding the management of the programme – and took both a “national government” and “operational project” perspective, by visiting many projects throughout the EU as well as holding structured consultations with Transport Ministry officials;
• we mobilised transport economists and experts to complement our core evaluation team, thereby ensuring that “traditional” evaluation skills were enriched with sector expertise;
• we sought to unearth the key differentiating effect brought by the MIP to the overall TEN-T process. This remained a leitmotiv throughout the evaluation.

Ex-post / Final evaluation of the TEN-T MIP –Final Report – November 2007
16
3 . T H E T E N - T M I P - C O N T E X T
3.1. The Trans-European Network Transport
The trans-European networks concept has existed since the Maastricht Treaty was signed in 1992 and entered into force in 1993. Under the terms of Chapter XV of the Treaty (Articles 154, 155 and 156), the European Union must aim to promote the development of Trans-European Networks as a key element for the creation of the Internal Market and the reinforcement of Economic and Social Cohesion. This development includes the interconnection and interoperability of national networks as well as the access to such networks.
Fourteen priority projects were identified by the Essen European Council and included in the first Decision of the European Parliament and of the Council on Community Guidelines for the development of the trans-European transport network2 (TEN-T) in 1996. This Guidelines Decision defined the TEN-T. According to this Decision, the objectives and priorities of the TEN-T are to:
a) Objectives
- ensure the sustainable mobility of persons and goods within an area without internal frontiers under the best possible social and safety conditions, while helping to achieve the Community's objectives, particularly in regard to the environment and competition, and contribute to strengthening economic and social cohesion;
- offer users high-quality infrastructure on acceptable economic terms;
- include all modes of transport, taking account of their comparative advantages;
- allow the optimal use of existing capacities;
- be, insofar as possible, interoperable within modes of transport and encourage intermodality between the different modes of transport;
- be, insofar as possible, economically viable;
- cover the whole territory of the Member States of the Community so as to facilitate access in general, link island, landlocked and peripheral regions to the central regions and interlink without bottlenecks the major conurbations and regions of the Community;
- be capable of being connected to the networks of the European Free Trade Association (EFTA) States, the countries of Central and Eastern Europe and the Mediterranean countries, while at the same time promoting interoperability and access to these networks, insofar as this proves to be in the Community's interest.
2 “Decision 1692/96 on Community guidelines for the development of the trans-European transport network” as amended by Decision 1346/2001

Ex-post / Final evaluation of the TEN-T MIP –Final Report – November 2007
17
b) Priorities
- establishment and development of the connections, key links and interconnections needed to eliminate bottlenecks, fill in missing sections and complete major routes;
- establishment and development of infrastructure for access to the network, making it possible to link island, landlocked and peripheral regions with the central regions of the Community;
- the optimum combination and integration of the various modes of transport;
- integration of environmental concerns into the design and development of the network;
- gradual achievement of interoperability of network components;
- optimization of the capacity and efficiency of existing infrastructure;
- establishment of and improvement in interconnection points and intermodal platforms;
- improved safety and network reliability;
- the development and establishment of systems for the management and control of network traffic and user information with a view to optimizing use of the infrastructures;
- studies contributing to improved design and better implementation of the trans-European transport network.
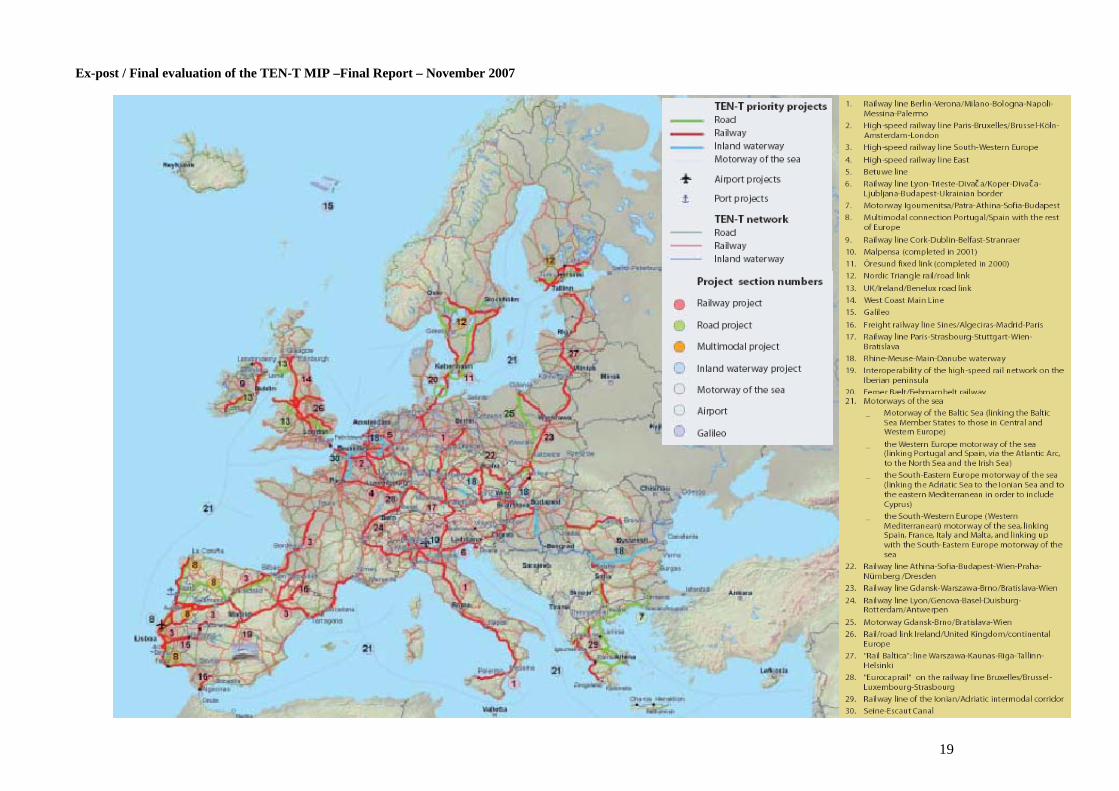
In 2004, the list of the 14 projects was extended to take account of the accession of 10 and then 12 new Member States to the EU in the amending Decision3 on Community guidelines for the development of the trans-European transport network. The TEN-T now comprises 30 priority projects which are due to be completed by 2020. The TEN-T objectives and priorities were also supplemented in this Decision in order to enhance concerns on:
- sustainable mobility;
- safety and the environment;
- development of infrastructure which promotes the interconnection of national networks;
- linkage of peripheral regions with central regions.
Of the 30 priority projects, 18 are railway projects, two are inland waterways and one is related to the motorways of the sea concept. High priority was therefore given to the most environmentally friendly transport modes.
Currently, five projects have been fully carried out and are already operational: the Cork-Dublin-Belfast-Larne-Stranraer conventional rail link, Malpensa Airport (Milan), the fixed rail/road link between Denmark and Sweden (Øresund fixed link), and since June 2007 the high-speed 'Railway east' axis (Paris-Baudrecourt, Metz-Luxembourg, Saarbrücken-Mannheim) and the Betuweroute, a dedicated freight railway connecting the Port of Rotterdam to Germany. Other TEN-T projects which are not completed yet already have sections which became operational during the MIP, e.g.
3 No 1692/96/EC

Ex-post / Final evaluation of the TEN-T MIP –Final Report – November 2007
18
improvements to the Brussels-Paris and Brussels-London high-speed rail links, the Kerava-Helsinki rail link, the M1 motorway scheme in Ireland, and the Rome-Naples high speed railway.
A number of EU funding sources are available to support TEN projects. Community financial support to the TENs is regulated through the TEN Financial Regulation4. According to the TEN Financial Regulation, the dedicated TEN-T budget can be used to finance preparatory studies (up to 50%) and to fund construction (up to 10% of the total cost, and since 2004 up to 20% for projects aiming at filling cross-border sections).
Before the establishment of the MIP (Multi-annual Indicative Programme), the projects supported were financed on an annual basis under the TEN-T budget line once the Financial Assistance Committee (FAC) composed of Member States representatives had given a positive opinion. The MIP proposed continuous project financing during the whole programming period for projects that complied with the MIP requirements. However, the annual financing remained for specific projects (i.e. the non-MIP projects) in parallel with the MIP but with a smaller budget than the MIP.
4 Regulation 2236/95 laying down general rules for the granting of Community financial aid in the field of trans-European networks as amended by Regulation 1655/99
Ex-post / Final evaluation of the TEN-T MIP –Final Report – November 2007
19

Ex-post / Final evaluation of the TEN-T MIP –Final Report – November 2007
20
3.2. The Multi-Annual Indicative Programme
Since 2001, a large part of the Community funding has been structured in a Multi-annual Indicative Programme (MIP) drawn up by the Commission. This programme covers the eleven on-going 'Essen' projects and the new priorities, namely the Galileo project, the removal of bottlenecks on the TEN-T rail network, cross-border projects and intelligent transport systems for road and air systems. The strong focus of the programme on sustainable mobility objectives is reflected in the fact that almost 64% of the total support goes to rail and that 95% of the funds involve rail, inland waterways and intelligent transport systems.
The MIP aimed to establish funding for the TEN-T network over the 2001-2006 period. The MIP was established to streamline and improve the management of the TEN-T network by:
- securing smooth and timely financing of priority projects (the MIP split projects into annual parts subject to individual Decisions granting aid);
- responding to the need of public and private investors for better foreseeability and for a legal certainty that support will be awarded over several years (insofar as the implementation proceeds as planned);
- encouraging public-private partnership solutions;
- providing more flexibility, taking into account unforeseen technical, financial, legal or environmental project developments (the MIP foresees the opportunity for increasing or decreasing the yearly financial aid compared to what is foreseen in the 2001 Framework Decision).
The major simplification of the management introduced by the MIP is the fact that the Community support is no longer awarded on an annual basis and that the opinion of the Financial Assistance Committee is no longer needed each year.
Concretely, the Framework Decision awarded the support to each project along six years and provided a breakdown of costs by project and by project part. This support was conditioned to the respect of the implementation plan. The first year, an application form identified activities that would be supported during the eligible implementation period by an Individual Financial Decision determining the corresponding awarded amount of the aid. The following years in order to award support to the project, the Commission evaluate the progress of the previous decision according the information received in a Project Status Report (PSR) submitted by the Member States.
As result of the Mid-Term Revision launched in 2003, an important revision of the three legal instruments of the MIP took place5 in 2004. In the guidelines major changes have been:
- Subsequent to the enlargement, introduction of 16 new Priority Projects;
- the possibility to designate European Coordinators to harmonize the achievement of EU corridors, including cross-border sections.
- a more focused definition of the cross-border sections;
5 Respectively, Decision 884/2004 amending Decision 1692/96, Regulation 807/2004 amending Regulation 2236/95 and Decision C(2004)3243 amending Decision C(2001)2654.

Ex-post / Final evaluation of the TEN-T MIP –Final Report – November 2007
21
- modification of the original priorities of the guidelines;
In the MIP revision major changes have been:
- Withdrawing of projects that encountered significant delay;
- the increase of the maximum support from 10% to 20% for the projects aiming at filling cross-border sections.
In 2005 and 2006 new revisions of the Commission Decision establishing the MIP allowed the Commission to reallocate the budget to the best running projects, and fixed some additional management rules.
3.3. The European Transport Policy for 2010: a Progress Status
The 2001 White Paper put special emphasis on the need to create a better balance between road and other means of transport so as to reduce pollution and congestion and increase safety.
Nevertheless, for the time being, the largest share of intra-EU transport is still carried by road, which accounts for 70% of freight and around 84% of passenger transport. The share carried by rail is 10% for freight transport and 6% for passenger transport. Among the main structural trends is the fact that rail freight transport has halted its relative decline since 2001 and is on a growth path in a number of Member States (e.g. Germany, Sweden and Italy). Another salient trend has been the strong and sustained dynamism of air transport. Whereas inland waterways account for only 3% of freight transport overall, on certain corridors their share exceeds 40%. Spare capacity on corridors such as the Danube can be exploited by modernising and integrating river transport into efficient multimodal logistics chains.
Transport is a major employer, with more than 8 million jobs, mostly in the road sector. Despite growing transport demands, employment in some parts of the sector has declined. Clearly, the railway industry has witnessed a significant reduction in employment, even though demand for the service has remained reasonably stable.
Safety has improved considerably. Road fatalities have declined by more than 18% since 2001, although not in all Member States. However, with around 41 200 deaths and more than 1.7 million injured in 2005, road remains the least safe mode of transport and stands in sharp contrast to the relatively low level of fatalities in rail, sea and air transport accidents.
In conclusion, significant progress in the European transport sector has been recorded since 2001 in relation to the objectives of the European transport policy, but there is still more to be done.
Ex-post / Final evaluation of the TEN-T MIP –Final Report – November 2007
22
4 . M E T H O D O L O G Y
The tender specifications provide a list of evaluation questions that took account of the three different levels of assessment: project level, programme management and programme results. These levels are identified as Themes A, B and C in this report. The questions have been further refined and translated into an analytical framework that allows us to further refine them into sub-questions, judgement criteria and indicators, and to identify properly the sources of such information.
In order to cover the evaluation themes, we designed our methodology in a way which took into account some key elements (scope, overall approach) and some particular issues that we had to face.
We describe below these issues, the methodological design and elements in relation to the limits of validity and hypotheses in terms of the evaluation methods.
4.1. Key elements relating to the evaluation process
4 .1 .1 . SCOPE OF OUR INTERVENTION
The evaluation covers the TEN-T MIP 2001-2006. The objectives and broad lines of measures and priorities of the TEN-T are defined by the Community guidelines (Decision No 1692/96/EC). The MIP aims at securing smooth and timely financing for projects of common interest on a multi-annual basis. It concerns eleven of the fourteen original Essen priority projects (PP), the Galileo programme, and four coherent Groups of Projects (GR). The principal funding options used by the Programme were the co-financing of studies and direct grants to investments.
Since the evaluation of Galileo (PP 15) and two of the GRs (GR 4 – Intelligent transport systems for road and GR 5 – Intelligent transport systems in the air sector) are carried out in separate projects, these activities are not included in this evaluation.
Hence, the scope of our evaluation directly covers:
• the Essen Priority Projects numbers 1 to 8, 12, 13 and 14;
• GR 1 – Removal of bottlenecks on the railway network to improve freight and passenger traffic; and
• GR 3 – Intra-Community cross-border projects and cross-border projects with third countries.
These projects accounted for 69% of the MIP financial support in the period 2001-2006.
Three Themes were covered by this evaluation:
• Theme A – Assessment at project level: the evaluation focused on effectiveness, as well as on the relevance of the Community intervention. The emphasis was upon distilling from the project level output an overall understanding of the programme implementation and results; the assessment at project level covered the 11 still on-going Essen projects and a sample of 12 projects under GR1 and GR3;
• Theme B – Assessment of the management of the TEN-T MIP: at the programme management level, the assessment focused on whether the systems, structure and procedures in place contributed to the effectiveness and to the efficient implementation of the Programme.

Ex-post / Final evaluation of the TEN-T MIP –Final Report – November 2007
23
Under this Theme, we also considered whether the various changes introduced during the period under review were beneficial to the programme;
• Theme C – Evaluation at programme level: finally, the relevance, utility, sustainability, effectiveness, efficiency and impact (contribution to the development of the TEN-T and to the objectives promoted by the Guidelines) of the programme were evaluated.
The overall scope of the evaluation relates to the MIP in the context of the TEN-T and not the TEN-T itself. Moreover, the analysed projects are the projects co-financed by the MIP, not the overall TEN-T projects that could have also been financed by other European financing sources as the EIB or the Structural Funds. This implies, for instance, that the effectiveness of the MIP has been evaluated by considering the achievement of the MIP objectives and that its impact has been assessed through its contribution to the objectives and priorities of the TEN-T as defined in the guidelines. The evaluation did not in any way evaluate the performance or impact of the whole TEN-T programme or the Common Transport Policy. The emphasis of the evaluation is on the effectiveness and appropriateness of the MIP as a tool in the context of the TEN-T.
4 .1 .2 . OVERALL EVALUATION APPROACH AND DATA SOURCES
Our evaluation study focused on both qualitative and quantitative aspects. Quantitative in this respect means that we looked for existing quantitative information to feed our analytical evaluation framework. The sources of the quantitative information were the European Commission itself, existing studies and databases at EU level, and studies available at Member State level. As agreed with the Commission, our evaluation team did not carry out any new quantitative measurement of any quantitative indicator, nor did it make use of or develop any quantitative econometric model.
Our approach was mainly based on:
• a large and well structured consultation of the main parties involved in the MIP, i.e. National Authorities, Project Managers (beneficiaries), national and EU stakeholders affected by transport issues, desk officers and officials responsible for the MIP. Terms of reference stated: “It is also intended to appeal to a broader stakeholders’ interest on the impact of TEN-T and implications for the future development of similar initiatives at Member States or EU levels.” Consequently, our approach has taken this important aspect of the evaluation into account, i.e. the involvement of the various stakeholders, collection of their opinions and views, and analysis of these in our analytical framework; in this context, the qualitative information collected through interviews has been crucial;
• existing data available at the European Commission: the evaluation team developed a database containing key information to support the evaluation process;
• existing data available at Member States level and/or at project level;
• key policy documents and studies available6 and analysed during the desk research process.
6 A bibliography is to be found in Annex 4.
Ex-post / Final evaluation of the TEN-T MIP –Final Report – November 2007
24
4.2. Key issues to be considered
4 .2 .1 . EVALUATION AT PROGRAMME LEVEL
To evaluate such a programme, it is a fact that the aggregation of project level results does not equal the overall output of the programme. The programme has its own dynamics and this has also been reflected in the analysis of the sample mentioned above.
Therefore during our evaluation project we not only paid attention to effects and results at project level (under Theme A) but also devoted attention to the effectiveness and impact at programme level (Theme C). This last element was analysed and evaluated using information collected at different levels: the database of projects, the quantitative indicators potentially available at EU level (contextual indicators), information stemming from the Theme A analysis, qualitative information relative to the programme from the fieldwork.
4 .2 .2 . AVAILABILITY AND COMPARABILITY OF QUANTITATIVE DATA
Regarding the availability and comparability of quantitative data, two important elements should be noted:
• From experience, we know that very often the lack of systematic quantitative data collection at project level severely hampers the aggregation or comparison between projects. It is a fact that cost-benefit analysis, environmental impact analysis or other studies that could have been done at project level have been conducted using different approaches and/or methodologies. Comparison of the results of the studies at this level has then to be conducted with caution. This applies equally to the contribution of the projects to the objectives and priorities of the TEN-T: even with adequate quantitative data collection, the relationship between the MIP interventions and the objectives and priorities of the TEN-T, such as socio-economic development for instance, might be difficult to identify and assess, given that there are many other factors having an influence7. The qualitative information that will be collected during the interviews will make it possible to build a broader understanding of the situation and to deliver interesting findings at programme level;
• During the evaluation process, our team remained open to and paid attention to any newly identified potential quantitative indicators that could enrich our evaluation framework, especially at the level of the contribution of the MIP to the objectives and priorities of TEN-T.
4 .2 .3 . DEFINITION OF OBJECTIVES AND ASSESSMENT OF EFFECTIVENESS AND IMPACT
In an ideal world, the evaluation of effectiveness and impact would be inter alia supported by the specification of the objectives in terms of targets or milestones. This would help the definition and
7 At TEN-T level, the EIB ex post evaluation on cross border projects has attempted a mapping approach to rate projects according to four dimensions: employment, accessibility, efficiency and output and social inclusion. Nevertheless, this methodology could not apply to assess the contribution of project supported by the MIP to the development of the overall TEN-T due to the restricted size of supported projects.

Ex-post / Final evaluation of the TEN-T MIP –Final Report – November 2007
25
selection of indicators8. In many cases, this does not happen. Objectives are very often stated in very broad terms and do not translate into quantitative results to be reached after a certain period of time.
Regarding the TEN-T MIP, apart from the budget use or the realisation indicators, there is no indication of quantitative milestones relative to the contribution to the TEN-T objectives to be reached at the end of the period 2001-2006. This does not per se create a problem when evaluating the effectiveness or the impact, but this increases the importance of collecting qualitative information on the expected results and the achieved results. Expert assessments given by the range of stakeholders that have been interviewed have been used to form a judgement and conclusions on the contribution of the MIP to the objectives and priorities of the TEN-T.
4.3. Evaluation design
We designed the evaluation process taking into consideration the elements and issues identified above. We therefore relied during the evaluation process on the following main sources of information:
• the database that has been built on the basis of the files handled by the European Commission;
• the more detailed file analysis of the files relative to the projects that have been selected in our sample;
• quantitative information available at European Commission level to feed contextual indicators;
• stakeholder-provided evidence and/or expert/intermediary opinion in order to establish or support the facts of what actually occurred. This approach has a proven track record. The collection of information happened via interviews (mainly face-to-face);
• complementary information (studies, quantitative and qualitative reporting etc.) made available to us by the project promoters during our fieldwork.
During our evaluation work we used on the one hand the quantitative data available from the file analysis and from any quantitative source identified during the interviews (but this information was not precise or comprehensive enough) and on the other hand all the qualitative information that we collected during our interviews with many stakeholders and key players.
4 .3 .1 . TOOLS AND TECHNIQUES USED DURING THE EVALUATION PROCESS
The main tools and techniques that we used are further detailed below. The combination of tools allowed us to draw conclusions based on facts and perceptions from the interviewees.
4.3.1.1. D E S K R E S E A R C H A N D F I L E A N A L Y S I S
We conducted desk research and consulted more than 80 documents and socio-economic analyses9 relating to the projects, TEN-T Handbook and all the relevant EU legal documents, including
8 See: The Evaluation of Socio-Economic Development - The Guide, December 2003, page 127: “The indicator definition is closely linked to a policy goal, objectives and/or target. (Indeed, indicators are most helpful when objectives have been specified in terms of targets or milestones that apply the definition of the indicator.)”
9 A bibliography is to be found in Annex 4

Ex-post / Final evaluation of the TEN-T MIP –Final Report – November 2007
26
Council Regulations, TEN-T Guidelines, MIP Annual Financial Decisions and Framework Decisions.
This desk research contributed to the contextual analysis of the evaluation, to the overall understanding of the MIP and the TEN-T, to the drawing up of our fieldwork interview guides, and to the analysis of the evaluation questions.
We also conducted file analysis at two levels:
• file analysis that helped us to design the structure of our database and to fill in the information that was not yet available in electronic format;
• file analysis devoted to the projects that were selected in our sample in order to allow the interviewers to have sufficient knowledge of the projects.
We also conducted an analysis of the documents that have been made available to us by the Project Promoters. This analysis was carried out by using a grid containing the following items: the indicators available, their evolution over time, the main findings, and their link with the evaluation questions. A full list of the documents consulted is available in Annex 4
4.3.1.2. I N T E R V I E W S
We met a large number of interviewees during our fieldwork. We conducted interviews at different stages during the evaluation process:
• Interviews with key Commission officials at an early stage in order to build a view on the overall context surrounding the MIP;
• More detailed interviews with Commission desk officers to collect views and facts about the projects in the different Member States, MIP management procedures and implementation processes;
• Interviews with project promoters in the 15 Member States, that took place between May and September 2007.
The breakdown below details the interviewees by category:
Table 1 : Interviews – distribution by category of interviewees
Category Number of interviewees Commission officials 17
Of which: desk officers 12National authorities 28Project promoters 77Total 122

Ex-post / Final evaluation of the TEN-T MIP –Final Report – November 2007
27
4.4. Elements in relation to the limits of validity and hypotheses in relation to the evaluation methods
We identified above important issues which need to be taken into account when evaluating programmes. We also identified some problems that we encountered during the evaluation process.
4 .4 .1 . LACK OF QUANTITATIVE INFORMATION
We attempted during our fieldwork to find relevant information relative to the effectiveness and impact issue. But as the information was not always available and/or comparable, it was impossible at this stage to obtain data of sufficient value to enable overall quantitative measurement relative to the contribution to the TEN-T objectives (at least from a quantitative point of view).
We intended to use the MIP project appraisals to define the expected contribution to the TEN-T objectives and priorities. However, this was not possible as it was not certain that the assessment grids had always been filled in the same way by the different Commission desk officers10. This was, in our opinion, mainly due to the fact that the objectives were very broadly defined and the definition was not clear and unequivocal (e.g. removing a bottleneck). Moreover, a project could contribute to more than one objective directly or indirectly. The assessment grids were not designed to provide comprehensive information and to reflect the potential cause/effect relationships between different objectives (e.g. creating a new infrastructure is only one of the possible solutions for removing a bottleneck). These assessment grids could not play the role of ex ante evaluations or substitute an effective monitoring system that could have been defined to collect information and indicators on the projects.
It should also be noted that a lot of projects supported under the MIP were either studies or investment works that were still on-going. The quantitative information relative to the contribution of such projects was then by definition unavailable at the moment of our study. Studies cannot themselves contribute to the TEN-T objectives (but they can support projects that, when realized, could contribute to them). Works not yet finished could hardly have measurable effects or contribute to the TEN-T objectives.
4 .4 .2 . INTERVIEWEES
Despite the Commission’s support for our efforts in seeking interviews, we encountered difficulties in some countries in persuading potential interviewees to meet us in the timeframe originally scheduled for the interviews. That caused some delays in our analysis process.
Moreover, the interviewees we were able to meet did not always have a good knowledge of the MIP procedures and its management. This was mainly because the management of the MIP is split between several levels within the different institutions and organisations at Member State level: Ministry of transport, infrastructure management, etc.
Nevertheless, the total of interviews with a very wide range of relevant parties, coupled with the file analysis we performed in Brussels, provided sufficient inputs to allow us to answer most of the evaluation questions with confidence.
10
Indeed, in 2004, the European Commission stopped using this kind of assessment grid.

Ex-post / Final evaluation of the TEN-T MIP –Final Report – November 2007
28
4 .4 .3 . EVALUATION OF THEME A – AT PROJECT LEVEL
Theme A is not about evaluating the projects selected in our sample. We were not entitled or requested to carry out any individual project evaluation. This is not a limitation as such, but we feel it is important to stress for the understanding of the non-specialist reader that the terms of reference, “the emphasis here is upon distilling, from the project level output, overall understandings of the programme implementation and results”. Hence most of the information collected and the analysis conducted under Theme A can be found back in Theme C in our report11. The individual characteristics of each project are presented for information purposes in the single-page description presented in Annex 5.
We also draw attention in this context to the fact that we did not analyse the projects at Annual Financial Decision level but at the project level involving several project parts.
11
Despite the fact that the evaluation did not cover all the projects, the sample did represent more than 50% of the financial support during the period under review, so that it can be considered that the information collected at this level, appropriately summarised, is a good proxy for use under Theme C.

Ex-post / Final evaluation of the TEN-T MIP –Final Report – November 2007
29
5 . A N S W E R S T O E V A L U A T I O N Q U E S T I O N S
5.1. Theme A: Assessment at project level
The aim of the analysis of Theme A was to gather sufficient information at this level to allow us to aggregate project level results in order to evaluate the overall output of the MIP based on a representative sample. We have therefore not performed specific in-depth evaluation of the projects, but have used in-depth interviews with national governments and project promoters to complement the understanding of the projects obtained from desk research. The main findings from the interviews are presented by project in the project sheets provided in Annex
12.
These sheets can be used as a source of information on the extent to which the projects achieved the objectives set for them, the current status of the project and the role the MIP funding played in the financing of the project. These give a top-level indication of the impact, effectiveness in terms of sustainability, relevance of the funding in terms of need of the individual projects, and actual as opposed to planned cost, and have fed into our judgement of the overall effectiveness and relevance of the MIP programme as described in this Theme and Theme C.
The project sheets provide information on:
• type (study or investments);
• the Member State/s responsible;
• the type of work (new infrastructure/upgrading of existing infrastructure);
• the total eligible cost;
• the maturity of the projects in 2000 and 2006;
• the national interest for the project (willingness of the public authorities to carry out the project).
Most of these characteristics are explicit (Member State/s responsible, distinction between study and investment). However, the maturity of the project and national interest were assessed by the evaluator on basis of the desk analysis, and the interviews with the project promoters and Member States.
The maturity of the projects was assessed based on a categorisation of 10 project phases described in the table below13:
12
These project sheets are included in the database.
13 These phases have been identified by our experts and a review of existing literature regarding the project
cycle of major infrastructure projects such as: Youker, R., Managing the project cycle for time, cost and quality: lessons from World Bank experience, Keynote paper, INTERNET 88, Glasgow, 1988, Vol 7 No 1 February 1989 p54; http://www.route.equipement.gouv.fr; http://www.construction-int.com.

Ex-post / Final evaluation of the TEN-T MIP –Final Report – November 2007
30
Table 2 : Project cycle Phases
Project cycle phases Description Main phase
1. Project identification Political negotiation, first socio-economic studies, first political decision
Project Preparation
2. Pre-feasibility study Exploration of several scenarios Project Preparation
3. Project preparation - feasibility study
More concrete studies realised on the selected scenarios
Project Preparation
4. Financing (including appraisal by financial institutions)
Exploration of the way of financing the infrastructure and decision
Detailed design of implementation
5. Detailed engineering studies
Technical studies on the way of implementing the infrastructure, planning and design
Detailed design of implementation
6. Permits Administrative procedures in order to get urbanism, environment… permits
Detailed design of implementation
7. Procurement procedures Call for proposals and selection of the suppliers / land acquisition
Detailed design of implementation
8. Project implementation Concrete realisation of the infrastructure Construction 9. Commissioning End of the work, conformity assessment Construction 10. Operation Exploitation, maintenance… Use
For convenience we have in some instances used the four main groupings in column three of Table 2, i.e. project preparation, detailed design of the implementation, construction and use on the basis of evaluator experience and different guidelines for assessment of major infrastructure projects or documents consulted during the desk research.
The project sheets also contain an assessment of how the different projects contributed to one of several objectives of the TEN-T. We assessed this ex novo rather than use the assessments made by the Commission in the MIP project appraisals of 200014 because:
• the guidelines for appraisal, used by Commission officials and mentioned in the MIP Projects Appraisal form were not available any more. Consequently, it was not possible to analyse whether this assessment were comparable from one desk officer to another;
• the appraisal of the contribution to TEN-T objectives was dropped in subsequent appraisals;
• the Commission itself did not rely on this appraisal.
The distribution of the projects supported and of the awarded amount by main objectives is presented at the consolidated level in the Theme C dealing, evaluation at programme level, of the present Report.
14
In the first template of the appraisal, Commission Officers were asked to assess on a scale from 0 to 2 the contribution of the project to the objectives as formulated in the Guidelines. As from 2004, new projects appraisal template did not evaluate this contribution anymore.

Ex-post / Final evaluation of the TEN-T MIP –Final Report – November 2007
31
5 .1 .1 . PROJECTS INCLUDED IN THE SAMPLE
As noted above, and as agreed with the European Commission on the basis of the inception report, we looked in detail at 48 projects of the 117 projects supported by the MIP during the period 2000-2006.
These projects are:
• all the decision related to the Priority Projects identified at Essen Council in 1994 (with the exception of PP-121215 at the Commission’s request, PP609 moved into PP608 – no decision has been analysed for the projects PP10, PP11 and PP15, which were already complete or were outside of the scope of this assignment);
• a sample of 13 projects and relative decisions selected at random from amongst coherent Groups of Projects (GR): 9 projects from GR1 (Removal of bottlenecks on the railway network to improve freight and passenger traffic) and 4 projects from GR3 (Intra-Community cross-border projects and cross-border projects with third countries).
For evaluation purposes, due to the fact that the project parts were too different, we split project GR3010 (Multimodal extension of the corridor Hamburg – Öresund region incl. Fehmarn Belt fixed link) into its two project parts; GR3010A (studies on railway part in Denmark) and GR3010B (upgrading of the railway access lines to future Fehmarn Belt Fixed Link) and Project PP1301 (Irish element of Ireland/United Kingdom/Benelux road corridor) into PP1301A (planning and design of the whole section) and PP1301 C (Section: N8 Cashel By-Pass) on the one hand and PP1301B (cross-border section) on the other hand. We therefore based our indicators on 50 projects.
Of these projects:
• 21 are investment projects, 17 are studies and 12 carried out both studies and investments;
• 4 are cross-border projects16.
The following table lists the projects:
Table 3 : List of projects included in the sample
Project ID
Member State Name of the project
PP101 DE Berlin Railway node: measures in Lehrter Bahnhof and Bahnhof Papestrasse stations; upgrading of Südkreuz-Ludwigsfelde and Sudkreuz-Blankenfelde sections
PP102 DE High-speed railway link Nuremberg-Munich: construction of new Nuremberg - Ingolstadt section: upgrading of Ingolstadt - Munich section
PP103 AT Construction of new double track high-speed railway line Kundl/Radfeld –
15
Finnish ice breaker project.
16 These four cross-border projects are PP104 (Brenner base tunnel), PP306 (section Figueras-Perpignan),
GR3009 (Fehmarn Belt Fixed Link) and PP1301B (cross-border section of the Ireland/United Kingdom/Benelux road corridor.

Ex-post / Final evaluation of the TEN-T MIP –Final Report – November 2007
32
Project ID
Member State Name of the project
Baumkirchen (including preparatory works)
PP104 AT/IT Brenner base tunnel: technical, legal, financial and economic studies
PP201 NL
PBKAL/Dutch part:
a) A4 motorway crossing; b) bored tunnel Leiderdorp - Westeinde; c) infrastructure works Heerjansdam - Lage Zwaluwe; d) Rotterdam Station.
PP202 UK PBKAL/UK part: construction of section 1, studies and construction of phase 2
PP203 DE PBKAL/German part: upgrading of Düren - Aachen - German - Belgian border section; infrastructure works for new Cologne - Frankfurt line
PP204 BE PBKAL/Belgian part: Franco-Belgian border - Liège - Brussels - Belgian-German border section; Brussels - Belgian-Dutch border section
PP301 ES Studies in relation to high-speed line between Madrid - Saragossa - Barcelona and the French border
PP302 ES Studies in relation to the Madrid - Valladolid/Medina del Campo high-speed line. Sections: Madrid - Segovia and Segovia - Valladolid/Medina del Campo
PP303 ES Studies in relation to the Spain-France link on the Atlantic coast: Valladolid-Vitoria sections and a new railway network in the Basque Country
PP304 FR Studies and construction of the Nîmes - Montpellier - Perpignan section of the high-speed line
PP306 ES/F
Studies and construction of the international section between Figueras and Perpignan of the Madrid - Barcelona - Perpignan - Montpellier high-speed link (joint request of the two governments concerned)
PP401 FR European TGV East (TGV Est Européen): Construction Phase I (Vaires - Baudrecourt)
PP402 DE Railway link Paris – Eastern France – South Western Germany: upgrading of section Ludwigshafen – Saarbrücken – German-French border for high-speed traffic
PP501 NL
Betuweline:
a) Botlek tunnel; b) Sophia tunnel; c) superstructure A 15 line; d) substructure A 15 line.
PP602 FR Upgrading of the Lyons - Modane line
PP603 FR New Lyons -Turin transalpine railway link – international section (F)

Ex-post / Final evaluation of the TEN-T MIP –Final Report – November 2007
33
Project ID
Member State Name of the project
PP604 IT New Lyons -Turin transalpine railway link – international section (I)
PP605 IT
Upgrading of railway junctions to connect with high-speed lines in order to increase the fluidity of East/West traffic (Turin: the Susa-Dora section, technological improvements to the junction)
PP606 IT Upgrading of the Turin - Modane line and the Turin freight belt
PP607 IT Enhancing the productivity of infrastructure and technologies in order to increase the fluidity of East/West traffic (the Pioltello - Treviglio and Rovato – Padova sections).
PP608 IT Reorganisation of the Venice/Mestre railway junction
PP701 EL Egnatia Motorway: technical Studies - final stage
PP801 PT New Lisbon Airport – Structuring of the Public-Private-Partnership
PP802 ES Studies for the Portugal-Spain/Europe multimodal link. Fuentes de Oñoro - Valladolid and Galician Atlantic axis sections (Tuy-Coruña-Ferrol)
PP901 IE Conventional rail line: Cork - Dublin - Belfast - Larne - Stranraer, Belfast – Dublin -Cork intercity rail corridor
PP1201 SE Nordic Triangle/Swedish part: Malmö Citytunnel (Rail) - studies, technical design and works
PP1202 SE South Main Line/West Main Railway Line – selected infrastructure improvement measures
PP1203 SE Nordic Triangle/Swedish part: studies for remaining parts of E6 motorway; upgrading of Torp - Håby and Rabbalshede - Swinesund sections of E6 motorway
PP1204 FI Nordic Triangle/Finnish part: E18 Motorway, construction of Paimio - Muurla and Helsinki Ring III sections
PP1205 FI
Nordic Trianlge/Finnish part: railway infrastructure upgrading on the following sections: Riihimaki - Luumaki, Helsinki - Riihimaki, Kouvala - Kotka and Leppavaara - Kirkkonummi
PP1301 IE Planning and design of Ireland element of the Ireland/United Kingdom/Benelux Road Link; Dundalk-Newry cross-border section; Cashel by-pass
PP1302 UK A120 Stansted to Braintree road upgrading
PP1401 UK West Coast Main Line Route modernisation
GR1001 AT Danube railway axis: construction of Enns bypass and Rohr freight bypass
GR1009 ES Studies relating to the Madrid-Castilla La Mancha - Valencia Community - Murcia region high-speed link

Ex-post / Final evaluation of the TEN-T MIP –Final Report – November 2007
34
Project ID
Member State Name of the project
GR1014 EL Attica Suburban rail: development studies
GR1019 IT Rome rail hub: construction of the high speed urban junction.
GR1020 LU Increase train circulation capacity and safety in the Northern sector of Luxembourg City station (Pulvermuehle Viaduct)
GR1021 NL High Speed rail link Dutch Randstad - Rhine/Ruhr, Amsterdam- Utrecht section; construction of the Utrechtboog
GR1023 PT High-speed Rail: studies of executive projects relating to the Lisbon - New Lisbon airport section
GR1025 FI Removal of bottlenecks on the railway network in Finland: Luumaki - Joensuu and Oulu - Iisalmi/Vartius sections
GR1110 FR New Project: TGV Rhine - Rhône (S)
GR3001 AT Study, prepatory measures and pilot test for the removal of bottlenecks on the Danube waterway in the section Vienna - Austrian-Slovak border
GR3004 DE Upgrading of the Berlin - Frankfurt/Oder railway line (part of pan-European transport corridor no. II): technical studies and project implementation
GR3009 D/DK Fehmarn Belt Fixed Link: technical studies, design studies and preparation of tendering documents
GR3010 DK Studies and works for the upgrading of railway access lines to the future Fehmarn Belt Fixed Link
5 .1 .2 . EVALUATION CRITERIA AND LIMITATIONS OF THE APPROACH
The indicators at the basis of our global judgment of the output of the MIP in relation to the performance of the projects are primarily:
• the absorption rates of the different projects, defined as the ratio of the total amount awarded as opposed to the foreseen amount in the 2001 or 2004 Framework Decision17, and
• the ratio of the support actually awarded to the total eligible cost.
We are conscious these indicators are only a proxy for the performance of the projects since they do not take into account the efficiency of the project, e.g. if a project cost less than was foreseen, thanks to an economy of scale or some other reasons. In this case, it has performed well, but has a low absorption rate. Nevertheless, since infrastructure projects usually cost more than forecast, money spent seems a reasonable proxy in the absence of quantified performance indicators,
17
Depending which applies.

Ex-post / Final evaluation of the TEN-T MIP –Final Report – November 2007
35
comparable from project to project in the PSRs provided each year, or in the technical reports provided by the project promoters at the closure of the AFD.
5 .1 .3 . FINDINGS FROM THE ANALYSIS BY PROJECT
5.1.3.1. P E R F O R M A N C E O F T H E P R O J E C T S S U P P O R T E D
In absolute and simplistic terms, it can be argued that the MIP was an effective programme because all the funding was awarded, and therefore its absorption rate was one. However, the process was not linear. In fact, two revisions of the framework decision made it possible for the European Commission to redistribute support from projects that were delayed to those which were performing well.
Of the 50 projects in the sample, only projects PP605 (Italy: upgrading of Susa-Dora rail section) and GR3010A (Denmark: Studies and works for the upgrading of railway access lines to the future Fehmarn Belt Fixed Link) were stopped in 2004 for reasons of non performance. In Denmark, the reason was technical and in Italy political (due to local opposition to the project).
If we consider the actual variability of the support through year, we can see that the variation around the mean (1) was considerable.
Figure 1 presents this variation: Y axis is the absorption rate (the ratio of support awarded to support foreseen) of a given project and the, X axis shows the year in which this project was supported by MIP. Each point is a project.
If all the projects had been supported as foreseen each year, then all the points would be at the value 1. Given the fact that all the budget of the MIP was absorbed, the average absorption rate of the MIP is also equal to 1 (line in bold in the figure).

Ex-post / Final evaluation of the TEN-T MIP –Final Report – November 2007
36
Figure 1 : Variation around the mean of annual funding
Source: Commission (data) and Deloitte (calculation and figure)
This Figure shows that with each passing year, more and more projects were above or below the average, but with a break in the series in 2004 because of the revision that year that introduced new projects and dropped those not going ahead.
We can therefore say that at a constant average absorption rate at MIP level, some projects performed better and others less well.
5.1.3.2. P E R F O R M A N C E B Y T Y P E O F P R O J E C T
The average absorption rate of the sample of projects analysed during the assignment is 1.19, i.e. higher than that of the MIP itself (1), in other words the support awarded exceeded the support foreseen in the framework decision of 2000 or 2004 by 19% (Table 4).
-
1.00
2.00
3.00
4.00
5.00
6.00
2000 2001 2002 2003 2004 2005 2006 2007
Year
Abs
orbt
ion
rate

Ex-post / Final evaluation of the TEN-T MIP –Final Report – November 2007
37
Table 4 : Absorption rate of projects
Type of project Cross border Absorption rate
Investment No 1.27 Yes 1.42 Investment Total 1.28 Study No 0.63 Yes 1.27 Study Total 0.86 Study and investment No 1.65 Yes 0.82 Study and Investment Total 1.51 Grand Total 1.19
The overall ratio of MIP support in relation to the eligible cost is some 23% (Table 5).
Table 5 : MIP support in relation to eligible costs.
Type of project Cross border Support
(%)Investment No 7.5 Yes 13.6Investment Total 8.1Study No 40.1 Yes 48.6Study Total 43.1Study and investment No 18.3 Yes 31.3Study and Investment Total 20.4Grand Total 22.9
The support awarded was, in general terms, in line with the maximum Community participation stated in Art. 4 and Art. 5 of the Council Regulation18 (7.5% for investment, 43% for studies and 13.6% for cross-border projects).
It is clear from the tables that investment projects performed better than studies. This seems to be due to the fact that during the construction phase, project promoters have clear deadlines and few difficulties in spending money and providing invoices in order to justify the eligible costs. Interviews with projects promoters indicate that the that project promoters tend to optimize the use of MIP support by submitting, as eligible costs only one part of the total cost of the project that they are confident will be completed on time. For studies on the other hand, eligible costs usually correspond to the overall total cost.
18 Council Regulation (EC) No 2236/95 laying down general rules for the granting of Community financial aid in the field of trans-European networks amended by Regulations (EC) No 1655/1999 (EC) 788/2004 and (EC) 807/2004

Ex-post / Final evaluation of the TEN-T MIP –Final Report – November 2007
38
This statement could be substantiated if there were data on the ratio of eligible costs to the overall total cost of the project, but this information was not clearly sought of Member States at the application phase.
5.1.3.3. P E R F O R M A N C E B Y M E M B E R S T A T E
Table 6 gives the average absorption rate by member state.
Table 6 : Absorption rate by member state
MS Absorption Rate AT 2.5 SE 2.2 FI 1.7 PT 1.3 IE 1.2 FR 1.1 IT 1.1 ES 1.1 LU 1.0 BE 1.0 DE 0.9 UK 0.9 NL 0.8 EL 0.8 DK 0.3
Austrian and Swedish projects had particularly high absorption rates. In the case of Sweden, the reason appears to be that the projects were of below average size, and in the case of Austria, that they were very mature.
Danish projects, on the other hand, suffered of a lack of maturity (i.e. political decisions changed in the course of the project), while the Greek projects encountered technical and administrative problems. In the Netherlands, the project changed in scope in the course of implementation and in the UK, the project promoter, Railtrack, went into liquidation in the course of the programme.
5.1.3.4. P E R F O R M A N C E B Y T Y P E O F W O R K
We also compared the performance of projects aiming at implementing new infrastructure with that of the projects involving upgrading or optimizing existing infrastructure (Table 7).
Table 7 : Absorption rate by type of project (new/upgrading)
Type of project Absorption rate Both 1.8 New infrastructure 1.1 Upgrading/optimization of existing infrastructure 0.7 Average 1.2

Ex-post / Final evaluation of the TEN-T MIP –Final Report – November 2007
39
It could be regarded as surprising that projects involving upgrading encountered more difficulty in absorbing MIP funding than others. However, these projects include the Danish projects in relation to upgrading of the link with Fehmarn Belt and the Susa-Dora section in Italy. This is also due to the fact that proportion of studies within these projects was higher than in new infrastructure or mixed projects.
5.1.3.5. P E R F O R M A N C E B Y S I Z E
Table 8 shows the absorption rate by overall budget (expressed in the amount of eligible costs).
Table 8 : Absorption rate in relation to eligible costs
Budget Absorption rate Between €100m and €200m 2.7 More than €500m 1.4 Between €50m and €100m 1.4 Between €200m and €500m 1.3 Less than €50m 0.7 Average 1.2
These figures show that the biggest projects performed relatively better than small ones. This seems to be attributable to the fact that, as in the case of the distinction between studies and investment, large projects are more able to consume money on a regular basis and consequently can absorb more funding than initially foreseen.
5.1.3.6. P E R F O R M A N C E B Y M A T U R I T Y
As stated above, we distinguished between four main phases in the project cycle: project preparation, detailed design of implementation, construction and, finally, operation of the project.
In order to assess the performance of the projects in function of their maturity, we considered the maturity of these projects in the first year they received support from the MIP. Table 9 shows the respective absorption rates.
Table 9 : Absorption rate by maturity rate at outset
Maturity phase Absorption rate
Construction 1.4 Detailed design of implementation 1.3 Project Preparation 0.9 Average 1.2
It is clear that the more mature the project, the more likely it is that it will be able to absorb more funding than foreseen. This finding clearly emerges from the fieldwork as well. Projects are less likely to absorb the funding in their early stages because the uncertainties are much greater at that point, both in terms of the specifics of the project and the strength of the political backing for the project.

Ex-post / Final evaluation of the TEN-T MIP –Final Report – November 2007
40
5.1.3.7. P E R F O R M A N C E A S A F U N C T I O N O F N A T I O N A L I N T E R E S T
The MIP is designed to leverage infrastructure works that would not be implemented as such by the Member States. The question of the national interest in the projects is therefore highly relevant.
As indicated above, the question of national interest was assessed by the evaluator on the basis of the interviews with the public authorities of the Member States and the project promoters.
Table 10 : Absorption rate as a function of national interest
National Interest Absorption rate
High 1.3 Medium 1.0 Low 0.6 Average 1.2
We can see from these figures that projects fully supported by the Member States tend to perform better than others in spite of the MIP support.
Nevertheless, we must nuance this finding at this stage: overall, most projects were supported by the Member States and the findings from the stakeholder interviews showed that MIP succeeded in some cases in creating a priority for projects with the most EU added-value. This issue will be dealt with in greater depth in Theme C.
5 .1 .4 . CONCLUSIONS OF THE ANALYSIS BY PROJECT
Overall, and broadly speaking the projects best able to absorb the MIP funding were large projects in new infrastructure which were already mature and in which the Member State had a high interest. This is intuitively logical since such projects are at a stage where they face less technical and political uncertainty. However, there are outliers which are the exception to the rule that large projects are best able to absorb the funding, such as smaller Swedish projects. Since it is an objective of the MIP to support the most sizable projects and, this objective appears to have been met. However, the issue of whether the MIP actually acted as a lever and the extent to which the European interest was served is dealt with under Theme C.

Ex-post / Final evaluation of the TEN-T MIP –Final Report – November 2007
41
5.2. Theme C: Evaluation at programme level
5 .2 .1 . EVALUATION SUB-QUESTIONS
The evaluation sub-questions examined in this section, as stated in the evaluation framework, are:
• effectiveness of the MIP, or the extent to which MIP succeeded in achieving its specific objectives;
• relevance, or the correspondence of these objectives with the needs of the beneficiaries;
• impact, or the contribution of the MIP to the TEN-T objectives and priorities;
• efficiency, or the cost/effectiveness relationship;
• sustainability, or the extent to which MIP effects are likely to persist in the future.
5 .2 .2 . LIMITATION OF THE APPROACH
The main limiting issue we encountered in evaluating the effects of the MIP was the lack of information regarding the impact of projects that are not or have recently been finished. This issue has already been described in the section on Methodology.
5 .2 .3 . EFFECTIVENESS
Answering the question on effectiveness requires assessing to what extent the TEN-T MIP achieved its specific objectives as stated in the MIP framework decision19 and displayed in the analytical framework of the inception report:
• to improve foreseeability and accountability for the investors, to provide legal certainty that Community aid will continue in several future years;
• to provide some flexibility in order to take account of unforeseen technical or financial developments in the projects;
• to mobilise public and private financial resources (PPP’s);
• to award smooth and timely financing for the most sizeable of the projects.
For evaluation purposes, we have added the specific concept of accountability of the beneficiaries.
19 Commission decision C(2001) 2654 establishing an Indicative Multiannual Programme for the granting of Community financial aid to projects of common interest in the area of the trans-European transport network for the period 2001 - 2006

Ex-post / Final evaluation of the TEN-T MIP –Final Report – November 2007
42
5.2.3.1. F O R E S E E A B I L I T Y / L E G A L C E R T A I N T Y
Foreseeability can be seen as meaning:
• ex-ante, the ability of the MIP to reassure beneficiaries regarding the financing of the project in the following years;
• ex-post, the ability of the MIP to provide what was actually planned.
When analysing the legal certainty, we describe the legal framework that ensures that Community aid will continue for several years.
Legal certainty
The figure below summarises the procedures of the MIP and the TEN-T annual calls.
Figure 2 : Procedures for MIP and Annual Calls20
The differences in procedure between MIP and Non-MIP were discussed and illustrated in Theme B, i.e. in the MIP procedure there is one selection process discussed and approved by Member States through the Financial Assistance Committee (FAC), with the right of review (droit de regard) of the European Parliament (EP) and Interservice consultation (ISC), to decide on the projects and the financing at the outset. The Framework Decision then covers a financing period of six years and is called the Framework Decision. In the following years, annual financial decisions (AFD) on selected projects can be adopted without being discussed at TEN-T-FAC meeting, on the basis of the project status report (PSR) provided by the project promoters. In the annual call procedure there is an annual selection process with the involvement of the Ten-T FAC to decide on the selection of the projects and to adopt the financial decisions.
20 For acronyms, see list on page 7
Foreseeability of the MIP procedure
• Project appraisal positive• Negotiation and approval
by FAC• Droit de regard of the
European Parliament
Selection Process Framework Decision
2001 - 2006
Pr Z
2001 - 2006
Pr Y
2001 - 2006
Pr X PSR AFD 2002
AFD 2001
• Project appraisal positive• Negotiation and approval
by FAC• Droit de regard of the
European Parliament
Selection Process 2001
Pr Z
Pr Y
Pr X
• Project appraisal positive• Negotiation and approval
by FAC• Droit de regard of the
European Parliament
Selection Process 2002
Pr Z
Pr Y
Pr W
…
vs. foreseeability annual calls
…Evaluation by delegation of the Commission

Ex-post / Final evaluation of the TEN-T MIP –Final Report – November 2007
43
The obvious difference between the two procedures is that the MIP Framework Decision of 2001 guarantees that Community aid will continue in the coming years provided that the project performs as expected21. One can therefore say that, for projects that performed in line with the forecast, legal certainty is guaranteed.
Foreseeability
Interviewees claimed that, compared to the annual call procedure, the MIP was effective in increasing foreseeability as perceived at the beginning of the MIP period (ex-ante). The Framework Decision plays a key role in this as it gives, at the beginning of the period, a six-year view on the planned annual budget allocation for a project.
However, when we look at the average implementation period of such infrastructure projects, we see that it often exceeds six years. Of the 50 projects from our sample that received MIP support in 2001, 12 are in use22 in 2007. Moreover, all the Priority projects were decided in 1994 at the Essen Council. The foreseeable period offered by the MIP (six years) is thus relatively limited in relation to the entire project timeframe. This decreases the foreseeability for project promoters and potential investors.
In terms of actual ex-post foreseeability of the planned amounts, we have compared the actual support awarded with the amounts foreseen at the beginning of the MIP period.
In Figure 3 we provide an overview of the absorption rate per project per year23. The planned costs are based on the amount agreed in the Framework Decision in either 2000 or 2004 (the latter for projects that only began in 2004).
21 Annex 1 of AFDs 2002 states that as a general rule, a subsequent decision may be adopted if, according to the reported data, more than 70 % of the cost of the study or project, as set out in Annex 1 of the Decision, has been reached. Subject to an assessment of the forecast development during the year ahead, the full amount of aid as set out in decision C (2001) 2654 for the year concerned may be granted. If between 50 % and 70 % of cost of the study or project, as set out in Annex I of the Decision, has been reached, subject to an assessment of the forecast development during the year ahead, a maximum of 50 % of the aid as set out in Decision C (2001) 2654 for the year concerned may be granted. No new decision shall be allowed if less than 50 % of the cost of the study or project, as set out in Annex I of the Decision, has been reached. In case a study or project has progressed considerably faster than originally foreseen, and the assessment of future progress also indicates accelerated development, the subsequent decision may cover the programmed activities of two years. In this case, the aid programmed in decision C (2001) 2654 for two subsequent years may be granted through one single decision. 22 In use does not mean fully completed, e.g. in some sections in use, the upgrade to maximum speed is not yet complete, and in others sections supported by MIP are ready while other sections are not
23 As stated in Theme A, the absorption rate is the ratio between the awarded and planned funds.

Ex-post / Final evaluation of the TEN-T MIP –Final Report – November 2007
44
Figure 3: Absorption Rate of Projects by Year
Source: Commission (data) and Deloitte (calculation and figure)
Each point in this Figure corresponds to one project. If a project actually received the planned support as stated in the Framework Decision, its absorption rate is equal to 1. A rate of 2 implies that a project absorbed twice the funding that was foreseen in that year; a rate of 0.5 implies that a project absorbed half the funding that was foreseen in that year, etc.
The main insight from this is that the absorption rate is very variable below and above 1 as from 2002. In other words, thanks to the rule linking support to the progress of the project (as assessed through the PSR), projects usually did not receive what was originally planned. There were projects that ran well (with a rate above 1) and projects that encountered problems absorbing the MIP budget attributed to them (with a rate below 1). By the end of the programming period, only 10% of the projects supported (12 projects out of 117) had actually received what was planned, while 32% received more, and 58% received less.
It is interesting to note that the 2004 Revision, by introducing new projects and by reallocating support for the following three years, focused the projects around the mean24. However, in 2005 and 2006, the actual figures scattered again from 0 to 3.
In Table 11, we have calculated the average absorption rate for the period 2000-2006 per project phase of the projects at the beginning of the MIP period25. We can see that, ex-post, the
24 At the beginning of 2004 there was a new Framework Decision introducing new projects. For these projects, support awarded in the Annual Decision for 2004 is equal to what was foreseen in the Framework Decision. Consequently the ratio awarded/foreseen in 2004 equals 1 for these new projects.
-
1.00
2.00
3.00
4.00
5.00
6.00
2000 2001 2002 2003 2004 2005 2006 2007
Year
Abs
orbt
ion
rate

Ex-post / Final evaluation of the TEN-T MIP –Final Report – November 2007
45
foreseeability is high for projects that were in the “construction” or “detailed design of implementation phase” at the beginning of the MIP period. Projects in the preparation phase were less likely to receive the planned funding due to the numerous elements of uncertainty for projects that are in their preparation phase at the moment of application.
Table 11: Absorption Rate by Phase and by Year
Main Project Phase 2000 Average absorption rate 2000 – 2006
Construction 1.37 Detailed design of implementation 1.31 Project Preparation 0.84
The same type of insight is provided if we look at the average number of AFDs by project phase that has not been triggered (this is detailed in the table below26) as compared to what could have been expected.
Table 12 Average number of AFD’s not adopted by project
Project phase at the beginning
Average Number of AFDs not triggered by project
Construction 1.14 Detailed design of implementation 0.95 Project Preparation 1.94 Grand Total 1.32
Projects under construction or in the "detailed design of implementation" phase received on average more decisions compared to what was planned, than did projects in the preparation phase.
We mentioned above that receiving the full allocation is linked to the performance of the project and that this performance is evaluated using the so-called "50-70 rule". This approach does not seem entirely clear to project promoters, thereby hampering the desired foreseeability. Some project promoters believed that even if their project ran well, the support would be less than the amount awarded in the Annual Financial Decision, which is, of course, baseless. Other project promoters did not know that, were their project to run better than expectations, they could receive in one year the amount awarded for the next two decisions.
25 Only for the sample of evaluated projects.
26 Only for the sample of evaluated projects.

Ex-post / Final evaluation of the TEN-T MIP –Final Report – November 2007
46
Nevertheless, Member States and project promoters generally acknowledge the added value of the MIP in terms of foreseeability "ex-ante", even if this foreseeability is limited as regards the overall project planning and cost.
5.2.3.2. A C C O U N T A B I L I T Y O F T H E B E N E F I C I A R I E S
In our understanding, the “accountability” principle could be defined as the beneficiary’s obligation to demonstrate that the studies and investments co-financed by the MIP were conducted in compliance with agreed rules and standards and to report fairly and accurately on performance results vis-à-vis mandated roles and/or planning.
We have evaluated whether the MIP increased or has had an effect on the accountability of the beneficiaries by taking the following aspects into account:
1. The long-term commitment of the beneficiaries to finance their share of the implementation process of the relevant infrastructure project;
2. Their compliance with project planning as defined in the Framework Decision and in the Annual Financial Decision;
3. Transparency, accuracy and sound governance in the project management.
Long-term commitment
On average, for investment projects, the MIP support was equal to 7.5% of the total project cost. For most projects, the other 92.5% is financed by the Member States. With this low MIP co-financing, the EU “additionality” and thus the accountability that it could create in the Member States, is naturally limited. The national political decision to support the project until completion is much more important than the fact that the project receives EU co-financing.
Nevertheless, the political context created around the TEN-T and its priority projects, as well as the peer pressure from other participants in European meetings, were important factors in influencing national level decisions. The Member States encouraged each other to implement their projects on the national territory. Generally, MIP/TEN-T projects are high on the political agenda compared to purely national transport infrastructure projects.
For projects that received significant MIP co-financing (studies and cross-border projects), there was a stronger accountability based on the financial assistance of the MIP. Considering the rate of 20% that cross-border projects could receive (since 2004) and the significant cost this could involve, the EU money was a decisive factor for launching and continuation of such projects.
Compliance with the project planning
As already stated, foreseeability increased under the MIP framework for projects that complied with the project planning. If projects performed worse, there was a risk that they would lose part of their MIP support. For studies, this could be problematic because of the higher financing rate (up to 50%). Therefore, we can argue that project promoters tried as much as possible to stick to the planning.
However, the planning of infrastructure projects throws up difficulties in respecting the yearly timetables. Technical problems often occur and budgets and timetables are often underestimated. Recent studies have analysed this phenomenon by explaining why the costs of large-scale projects, such as High Speed Rail projects, new motorways, and the Channel Tunnel, systematically turn out to be higher than what was forecast. Explanations for the systematic cost overruns include

Ex-post / Final evaluation of the TEN-T MIP –Final Report – November 2007
47
unfounded optimism and also deliberate tactics: the lower the costs presented, the higher the chances of securing support for the project. This is called 'inverted Darwinism' by Professor Flyvbjerg of Delft, or 'survival of the unfittest', because the projects that look best on paper often have the largest cost overruns and demand shortfalls27.
Sound project governance
In order to monitor the accountability among beneficiaries, the Commission imposes monitoring procedures. Some Member States also have stricter procedures than those imposed by the Commission. In all cases, Member States and promoters try to comply with the EU regulations in parallel with their national project management procedures. This sometimes creates two reporting procedures. However, as a general rule, the management procedures do not increase the Member States’ accountability to the Commission as the projects’ progress is not influenced by the existence of these procedures.
Regarding this last point, there is evidence that the impact of the Commission on the management of the projects within countries would be greater if the rules were communicated with more clarity to the Member States.
We can illustrate this statement with two concrete examples:
1. The rule on measuring the performance of the projects (50%-70%) was not fully understood by the Member States or project promoters. This may be due to the (lack of) prominence with which it was published. While in 2002 this rule was in the core text of the Annual Financial Decision, in the following years it only appeared in Annex 2 of the Decision, and only reappeared in the core text of the Framework Decision in 2005.
2. In the Annual Financial Decision for 2001 we find the following article: "cost may be measured in different ways in order to take account of the variety of relevant accounting systems established in Member States”. This article disappeared as from 2004 and the definition of acceptable cost measurements thereafter is implicitly that of the Commission. However, several Member States did not notice this change and did not adapt their accounting systems to this requirement.
5.2.3.3. P R O M O T I O N O F P P P ’ S
Before examining the extent to which MIP was able to promote PPP solutions, we present some elements in order to better define and understand the notion of PPP.
Definition and types of PPP
The Green Paper of the Commission on PPPs defines then as “forms of cooperation between public authorities and the world of business which aim to ensure the funding, construction, renovation, management or maintenance of an infrastructure or the provision of a service”.28
According to the EIB, “the key feature of a PPP is that it involves a risk sharing relationship between public and private promoters, based on a shared commitment to achieve a desired public
27 Flyvbjerg, B. Truth and lies about mega projects, 2007, Delft. http://www.tudelft.nl
28 Commission of the European Communities, 2004, Green Paper on Public-Private Partnerships and Community Law on Public Contracts and Concessions, COM(2004) 327 final, p.3.
Ex-post / Final evaluation of the TEN-T MIP –Final Report – November 2007
48
policy outcome” and “PPP is a generic term for the relationships formed between the private sector and public bodies often with the aim of introducing private sector resources and/or expertise in order to help provide and deliver public sector assets and services. The term PPP is, thus, used to describe a wide variety of working arrangements from loose, informal and strategic partnerships, to design, build, finance and operate (DBFO) type service contracts and formal joint venture companies.”29
PPP’s tend to share the following common characteristics:
- Relatively long relationships, involving cooperation between the public and private partners on different aspects of a planned project;
- Funding structures that combine private and public funds;
- The economic operator playing an important role at each stage in the project (design, completion, implementation, funding) with public partner concentrating on defining the objectives to be attained;
- The distribution of risks between the public and private partners according to the respective ability of the parties concerned to assess, control and cope with this risk.
A distinction is generally made between contractual and institutionalised PPPs. Contractual PPP models are multiple and they differ in the relative role taken by both partners. Differences are also visible between models applicable to new projects and those applicable to existing services and facilities. In the transport sector, the extent of transfer of the demand risk to the private partner is a key feature of the model. Availability-based payment by the public partner (Design Build Finance Operate/Maintain contracts) or toll payment by infrastructure users (concession model) are the two extreme models but a partial transfer of demand risk can also be implemented in models based on shadow-tolling30. Institutionalised PPP’s involve the establishment of undertakings held jointly by both a public and a private partner in order to perform public services. Hybrid forms of PPP exist that combine elements of both contractual and institutionalised PPP’s.
While there is a long tradition of involvement of the private sector in transport infrastructure under the form of concession models, especially for road infrastructure, the PPP approach in other transport modes and with other types of arrangements has developed slowly and in an erratic way over the last 15 years. This trend has accelerated in recent years, making transportation the largest area of PPP investment. Even though transport PPP projects have been developed in many European countries, the initiatives are sporadic and have mainly focused on toll-road programmes.
Findings on the effectiveness of the MIP in promotion of PPP’s
Within the sample of evaluated projects supported by the MIP, only PP306 (studies and construction of the international section between Figueras and Perpignan of the Madrid-Barcelona-Perpignan-Montpellier high-speed link) is co-financed via a PPP. During the period 2001 – 2006, also few other sections of the overall infrastructure projects that were not financed with MIP money, were
29 European Investment Bank, 2004, The EIB’s role in Public-Private Partnerships (PPPs), p2.
30 A Shadow Toll System consists of a concession awarded to a private contractor who has then the responsibility to Design, Build, Finance and Operate (DBFO) a road section for an agreed period of time. One of its special characteristics is that the Administration will pay the contractor on an annual basis depending upon the volume of traffic using the road. The term "shadow tolling" is used as there are no visible tollbooths and the users do not actually pay charges to the operators.

Ex-post / Final evaluation of the TEN-T MIP –Final Report – November 2007
49
financed via a PPP. Examples are the superstructure of the Dutch part of the PBKAL (PP201), sections of the Ireland element of the Ireland/United Kingdom/Benelux Road Link (PP1301) and sections of the Finnish part of the Nordic Triangle (PP1204).
Given that only one project in our sample was co-financed by MIP and PPP, and that there are several examples of Priority Project sections where PPPs were developed without co-financing of the MIP, it is clear that the MIP as such was not an effective tool to stimulate PPP’s.
There are several reasons for this finding:
1) Before a project is fit for PPP, it has to fulfil specific criteria described below.
a. Its subject has to be a distinct and clearly identified part of an infrastructure. The PPP contract should cover, in a comprehensive way, all works related to a part of the network in order to delineate clearly the responsibility of the private partner and be able to apply a payment system based on performance, and reduce the "interface risk” between this part of infrastructure and other parts.
b. A short term realisation of four to five years maximum because the payment of the unitary charge only starts when the infrastructure becomes available. This means that the private partner has to pre-finance the works.
c. Limited or at least controlled risk during infrastructure works. Specific clauses capping the transfer of construction risk can be introduced in the PPP contract to accommodate for specific construction risks. These risks can also be mitigated by commissioning studies (soil stability, pollution, etc.) to assess them properly;
d. The risk of latent deficiencies when the project includes the modernisation of existing assets. New infrastructure investment is much better suited for PPP than the refurbishment of existing assets.
e. The use of proven technology, as this lowers the risks to postponement of project steps during to construction phase.
When these criteria are compared with the MIP-supported projects, it is clear that only a few of them meet the criteria.
2) In addition, the large majority of MIP projects are railway infrastructure projects focused on new infrastructure or on the upgrading of main lines. The implementation of this particular type of project under PPP faces specific constraints:
a. Construction works on lines in operation are spread over a long period of time to minimise traffic disruptions. The PPP model foresees that payments to the private partner start only when the infrastructure become available for transport services, and the private partner may not be able to raise funds with such a long grace period.
b. The design and construction of most railway infrastructure components are subject to detailed standards. Standardisation over a network brings also economies of scale and increased efficiency in maintenance operations. In these circumstances, it is often difficult to specify the procured infrastructure in terms of objectives / performance and little room is left to the private partner for innovation. This removes an important potential benefit of the transfer of construction risk to the private partner.
c. In all cases that are not strictly limited to the building of completely new infrastructure, the risk related to latent deficiencies may either make the project non

Ex-post / Final evaluation of the TEN-T MIP –Final Report – November 2007
50
bankable or may cause the private partner to include a substantial risk premium in its bid.
3) To the extent that the financial viability of large infrastructure projects and in particular rail projects is limited, private investors are reluctant to invest money anyway. This is enhanced by the tendency for the demand risk to be too high to interest a private partner.
Very few Member States impose a formal procedure to decide on the choice of procurement options (conventional vs. PPP) on basis of qualitative or quantitative (Public-Private Comparator) criteria. Hence, in the majority of investments, the selection of the optimal procurement route is not formally considered and feasibility studies do not even consider the use of PPP.
The funding of feasibility studies through MIP is only beneficial to PPP when the outcome of these studies could potentially reduce the risks of the project (e.g. traffic studies when transfer of demand risk is envisaged, soil testing for the transfer of construction risk, etc.).
The MIP financing can have a positive impact on creating a PPP approach, as it signals a higher level of commitment of the public partner to the project and may therefore reduce the perceived political risk associated with the project. On the other hand, in some Member States, the availability of MIP financing has a “crowding out” effect on alternative sources of financing such as PPP as the MIP lowers the need from the public authorities to look for alternative funding.
5.2.3.4. F L E X I B I L I T Y / S M O O T H A N D T I M E L Y F I N A N C I N G
When evaluating the flexibility of the Multi Annual Indicative Programme (MIP) we analysed whether the MIP was able to take unforeseen technical or financial events into account.
Where the non-MIP Annual call procedures allowed project financing by project activity, the MIP procedures are based on the extent to which the activities have utilised the annual budget. This implies that non-MIP activities can be postponed from one year to another without having to consider the risk of losing budget granted, whereas MIP activities cannot be postponed without this risk. This difference is the main reason why the MIP is less relevant for bringing more flexibility to the financing of large infrastructure works.
The granting of the support for six years has to be evaluated at the beginning, in order to be formalised in a Framework Decision. However, even for large infrastructure projects, project promoters have difficulties to plan, in detail, project phases in a yearly framework and six years in advance. If, during project implementation, important changes are decided and planned activities change by more than 20%, promoters have to ask for an amended decision, which is a heavy administrative procedure. This lack of flexibility tends to negate the increased ex ante foreseeability.
Every year, even though the Framework Decision is in place, supported activities must be described in an annual financial decision. If a project is running slower for unforeseen technical or financial reasons and spent only, for instance, 60% of the foreseen eligible costs in year t, the project does not receive the total planned support in year t+1 according to the (50%-70%) rule described above. The same rule applies if the project is performing well: it can be awarded in one year the support foreseen in the two following decisions. Nevertheless, some Member States did not understand this rule and did not apply for two decisions in cases of good performance. This contributed to a perception that MIP does not stimulate high performance, but only “punishes” under-performance.

Ex-post / Final evaluation of the TEN-T MIP –Final Report – November 2007
51
Another element of non-flexibility was the fact that projects could not benefit of a new decision if two former decisions were still open. This rule was logical in case of successive project part but raised some issues for projects composed by several parallel parts31.
On the positive side, certain flexibility mechanisms were introduced in the course of the programme:
1. If a project runs well during year N, the project can receive in year N+1 the awarded support foreseen in N+1 and N+2.
2. As from 2004, the Commission could take the decision to let the project open more than two decisions at the same time for the same project part/stage.
3. Before this revision, some project promoters experienced informal flexibility as the Commission tried to be as flexible as possible. For example, projects were allowed to have more than two annual financial decisions open if they had already sent the request for final payment under at least one of the decisions.
4. Compared to annual calls, the annual financial decision adoption process does not require the submission of detailed applicant forms, the selection process and the discussion of the decisions at the TEN-T FAC. These steps were a heavy and therefore long administrative procedure for both Member States and Commission.
5. There have been two revisions that were not foreseen at the beginning, allowing for a redirecting of support to well-running projects.
6. There is the opportunity to amend Annual Financial Decisions if proposed activities for support change by more than 20%. Although this opportunity is merely considered as contributing to the inflexibility.
However, the above flexibility mechanisms did not reach the maximum of their potential. Neither the initial administrative rules nor subsequent changes were always well understood by the Member States (for example some Member States claimed not to know that as from 2004, they could open more than two decisions). The two revisions that redirected funds to well running projects were not foreseen at the beginning and their impact was thus reduced.
The procedural lack of flexibility, combined with the low awareness of the flexibility mechanisms, had a significant impact on the way that projects were planned and on the view that the Commission had on the projects as a whole:
1. postponement of project steps can have an impact on funding received. Therefore, beneficiaries propose conservative planning. They want to avoid bringing risks into the
31 From 2001 to 2004, only two decisions could remain open by projects. This means that for instance in 2003, even if they have well performed, projects that still have open decisions for 2001 and 2002 cannot get the decision 2003 except if they have already sent the request for final payment for one of the two previous decisions. If one project has 3 distinct projects parts that are organised in chronological order, this rule should not be a problem, activities supported under decision 2001 should be finished or at least, their payment should be requested in 2003. But if these project parts include activities that are supposed to be implemented in parallel, project could have two decision open at the same time in 2001 and at the end of the year, not to be in a position to get new AFD in 2002 given the fact that no claim for payment has been introduced yet for the AFDs 2001.

Ex-post / Final evaluation of the TEN-T MIP –Final Report – November 2007
52
projects (e.g.: use of new technology such as ERTMS) or are reluctant to propose a more ambitious project planning;
2. second the MIP support is calculated as a percentage of the proposed eligible costs and not as a percentage of the total project costs. Therefore, the beneficiaries tend to propose in the AFD only the minimum amount of eligible costs necessary to receive the approved funding. As a consequence, the Commission has no view on the overall total project cost;
3. third, the description of the cost-types in the application form does not follow a well-established nomenclature. Therefore, project promoters tend to describe the planned work (to- be-supported activities) as broadly as possible in order to create the necessary flexibility and avoid the risk to have to ask for an amended financial decision in case of changes. Consequently, the Commission has no detailed view of the supported activities. As an example, the following table is a sample of different cost types showing inappropriate formulation.
Table 13: Cost Types and Description of Activities
Problem in the formulation of cost types by Member States
Description of the activities
Too general activity • Other
• Activity 1
• Main works
• Horizontal issues
• Construction
Detailed by section • Travaux de Seine – Oise
• Stockholm Södra
• Helsinki-Riihimäki
• Wigan to Spring Branch
• Section Nîmes-Montpellier-Perpignan
Unclear formulation • NBS W-U IV 5001 01
• DB S & S
• Use of FS materials
• Travaux FIAT 197
• LOT 3 OO.CC. EX IRTI

Ex-post / Final evaluation of the TEN-T MIP –Final Report – November 2007
53
We can see in the above table that it is not easy to clearly understand the purpose and progress of the project at Commission level on the basis of this type of information.
When evaluating the smooth and timely financing provided by the MIP, we considered whether the MIP was able to guarantee a stable financing flow.
On average it took 15 months (469 days) between the end-date of the eligible period and the date of the final payment. For example, one final payment was executed on 24/10/2003, for a project whose eligible period closed on 30/06/2002.
The main reason for this is the weighty control process that requires the beneficiaries to submit a detailed list of all the corresponding invoices and, for the Commission, to check a sample of invoices in detail. The control of the Commission also includes the time-consuming difficulty of linking an invoice to the cost-type in the application form. Having both the Member State and the Commission dealing with an arduous administrative procedure naturally creates a long payment period.
In the Figure below we give a view on the time expressed in number of days (y axis) between the end-date of the eligible period (x axis) and the date of the final payment.
Figure 4: Smooth and Timely Financing
There were four main end-dates of eligible periods: June 2002, December 2003, December 2004 and December 200532. The position of the points in the Figure indicates the number of days it took between the end-date of the eligible period and the final payment. There is a large variance in the
32 During the evaluation project, the projects with an end-date of the eligible period in 2006 were not yet paid in 2007. Therefore, the payment date is not known.
0 100 200 300 400 500 600 700 800 900
1000
11/2001 05/2002 12/2002 06/2003 01/2004 08/2004 02/2005 09/2005 03/2006
# Days
End Date Eligible Period

Ex-post / Final evaluation of the TEN-T MIP –Final Report – November 2007
54
number of days between these two milestones, due both to the Member States and to the Commission. Because it is never certain when the Commission will give the order for the final payment, the working capital requirement of the project becomes more uncertain. This has an impact on the Member State's accounting and can delay or affect the planning cycle of other projects.
5 .2 .4 . RELEVANCE
Assessing relevance addresses the question: “were the objectives of the MIP in line with the needs of the beneficiaries. These objectives are:
• to improve foreseeability
• to improve accountability;
• to mobilise public and private financial resources (PPP’s);
• to provide some flexibility and to award smooth and timely financing for the most sizeable of the projects.
We conclude this section by examining whether or not there was a clear need for EU financing.
5.2.4.1. F O R E S E E A B I L I T Y
Based on the fieldwork, we can say there is a real need for more foreseeability and certainty in the financial support received from the Commission for the priority projects under the TEN-T. Compared to the non-MIP financing procedure, the creation of the six-year budget view offered to beneficiaries is a step forward in terms of ex-ante foreseeability.
A recent study showed that large infrastructure works have an average cost overrun of 30%33 that can reach 40% in railways projects34. This risk-level makes all financing that can bring more foreseeability welcome particularly for studies, which are financed at 50%, and cross-border projects, which have been financed since 2004 at 20%.
For investment projects where MIP funding rates are lower, the main other source of financing of these projects is national funding which is also a foreseeable financing source, since the political decision has been taken and implementation work has begun. Nevertheless it comes from the interviews that the existence of MIP funding protected the projects from political decisions to stretch projects in periods of budgetary austerity.
We can therefore say that the increase of foreseeability generated by the MIP is mainly relevant for studies and, to a lesser extent, cross-border projects.
33 FLYVBJERG, B., "Truth and lies about megaprojects”, 2007, Delft.
34 Procedures for Dealing with Optimism Bias in Transport Planning, British Department of Transport, 2004

Ex-post / Final evaluation of the TEN-T MIP –Final Report – November 2007
55
5.2.4.2. A C C O U N T A B I L I T Y O F T H E B E N E F I C I A R I E S
The question of the relevance of the accountability should be understood as the need for beneficiaries to be accountable for the EU money that they receive. Indeed, beneficiaries usually recognise that good governance requires beneficiaries to be accountable for EU money.
As a consequence, the Commission for its own reporting (and vis-à-vis the European Parliament and the Court of Auditors) needs reliable data and information to show that the EU money was spent supporting the European economy and social cohesion.
The MIP set up several monitoring and reporting tools in order to collect information on the evolution of the projects, the absorption of the budget and to justify expenditures35. Nevertheless, these tools allow the Commission to have only a limited view of the projects cofinanced by the MIP. In fact, there were several constraints which prevented the Commission from an accurate view on the projects as a whole, thus hampering complete and detailed reporting on the real situation. These constraints included:
1. The MIP co-financed some activities each year in the context of an Annual Financial Decision (AFD). These activities corresponded to eligible costs and not to the total cost of the project. Depending on the project, the eligible costs can be close to or far from the total cost. The Commission did not generally know the latter; nor did it have information on the overall progress of the overarching project.
2. The MIP management relies on the AFD monitoring within a Programme Management System (PMS). During the programming period 453 AFD’s were produced. The PMS allows the monitoring of each AFD individually but is a complex tool for consolidating all the AFD’s relating to a single project, even though the budget as defined in the Framework Decision is defined at project level (and not at AFD level). Moreover, the project is itself a part of a more general project on which European Commission has no clear information.
3. Staff turnover at the Commission makes it difficult for officials to have a clear view of the project history, the obstacles that it met, and its political milestones.
As a consequence, the data at the Commission’s disposal via the management tools are not sufficient to have a clear view of the projects and to allow complete reporting from the Commission side. Regular visits to the field by desk officers and auditors are necessary to supplement the information and to improve the Commission’s view of the project.
5.2.4.3. P R O M O T I O N O F P P P S
Many Member States consider they do not need to finance infrastructure projects using PPP for the following reasons:
• they consider the construction or maintenance of the priority projects to be their core business and are reluctant to outsource it to a private partner;
• PPP would require complex coordination, monitoring and regulation to ensure conformity with safety standards;
35 These tools and their effectiveness are described and analysed under Theme B.

Ex-post / Final evaluation of the TEN-T MIP –Final Report – November 2007
56
• the culture of using PPP’s for public investments is more embedded in certain Member States than in others.
As noted, the level of knowledge, awareness and understanding of PPP in the Member States is highly variable. It should also be noted that project promoters may see PPP as an attack on their vested interest. The European Commission does have a role to play, and could play this through the MIP, in raising awareness and the level of knowledge and disseminating best practice in a structured fashion.
5.2.4.4. F L E X I B I L I T Y / S M O O T H A N D T I M E L Y F I N A N C I N G
When we look to the characteristics of the projects co-financed via the MIP, we see there are in most cases long term, complex and large infrastructure works. These infrastructure works have a high risk of postponement of activities (as stated in the chapter on effectiveness). Per definition and as confirmed in our fieldwork, we can say this type of projects have a profound need for flexibility.
5.2.4.5. N E E D F O R E U F I N A N C I N G
The principle of “relevance of need for EU financing” in the context of the MIP financing means that:
1. The Member States and project promoters express a need for EU financing as a necessary complement to their national financing;
2. The MIP financing is additional to the national financing in order to reach the TEN-T objectives and to go beyond pure national interest as part of a wider EU policy agenda.
In order to evaluate the extent to which these criteria were met, we have used the information coming from the application forms and our interviews with project promoters. Very few project promoters accept, when completing the application, that their project could go ahead without MIP support. However, we obtained strikingly different results during the interviews, as shown in the Figure below.
Figure 5 : Existence of the project without the MIP
Existence of the project without the MIP
Yes; 26Yes but with restriction; 19
No; 5

Ex-post / Final evaluation of the TEN-T MIP –Final Report – November 2007
57
Further explanations are needed in order to qualify the statements in the Figure:
1. More than half the projects we looked at would have gone ahead without the financial support of the MIP. That means that the national authorities would have carried out these projects in any case. Nevertheless, the MIP was useful, not really for the amount that it provided to the project (an average 7.5% of the investment), but for the pressure that it put on the political decision makers. In practice, the MIP rules force strict planning timetables on project promoters; and political and peer pressure from the EU and the other Member States means that TEN-T projects progress more rapidly than they might otherwise have done.
2. Many project promoters considered that their project would have existed without the MIP but that they would have suffered from certain restrictions. As stated above, timeframe issues would have arisen or the financial risk would have been greater. The size of their project would sometimes have been different. For example, they would not have implemented the new traffic management systems (ERTMS).
3. For some projects, the MIP financing provided a real impetus to get the project going. That means that without EU sponsorship and the European dimension that it gives, national authorities might not have carried out the project because the national interest and the economic viability were not decisive.
Even if the MIP did not support infrastructure projects in their implementation phase with large amounts of money, the promoters are generally interested in continuing to apply for MIP financing as it gives them the opportunity to be part of the general framework of the TEN-T. In practice, therefore, the EU political dimension of the TEN-T and the signalling function of the MIP were more valued than the MIP financial assistance
As a conclusion, we can state that for many projects (mainly investments) there is no real financial need for the Community funding through the MIP, which at the same time gives a significant impetus to the decision making and place the project higher on the political agenda. In that context, the MIP is valuable in order to reach European objectives which go beyond the national interest.
This being said, for investment projects of high national interest that would be implemented without support, the relative support of the MIP could probably be smaller and nevertheless play its role of impetus with better efficiency, while focusing most of the support on cross-border projects that would not happen otherwise.
5 .2 .5 . IMPACTS
5.2.5.1. G E N E R A L O V E R V I E W
We understand the concept of the impact as the contribution of the MIP and, as a consequence, the contribution of the co-financed projects to the objectives and priorities of the TEN-T.
In order to define causality effect between different levels of objectives, we have distinguished “Strategic objectives” from “Operational objectives”. By “TEN-T strategic objectives” we mean the objectives and priorities that respond to transport infrastructural needs expressed at EU level. The

Ex-post / Final evaluation of the TEN-T MIP –Final Report – November 2007
58
“TEN-T operational objectives” are the objectives and priorities that have to be fulfilled in order to reach these strategic objectives in a logical way 36 (see Figure 6).
Figure 6: Logic Tree: Strategic/Operational Objectives
We differentiate each objective and some into several sub-objectives. Some objectives in the TEN-T guidelines are very broad (objectives taken directly from the Treaty for instance) and cover different aspects that have to be examined individually. For instance the objective “to stimulate socio-economic development” includes several socio-economic dimensions such as employment, free movement of persons and goods, EU competitiveness and social cohesion. For the sake of our analysis, we decided thus to consider the different dimensions separately and merge our main findings in the conclusions in order to give a general overview of interlinked objectives.
Two types of indicators and several information sources were used for analysing the impacts of the MIP projects on the TEN-T objectives:
• Qualitative indicators from interviews and desk research: the information we have collected concerns evidence on the specific contributions of each project to the TEN-T objectives;
• Quantitative indicators from our database: the information we have used concerns mainly data describing the financial investment of the MIP in the TEN-T strategic objectives and the number of projects that used these funds in order to specifically contribute to these objectives.
36 Reviewing and establishing the full intervention logic of the TEN-T was not included in the scope of our study; nevertheless for the sake of our approach, we have tried to re-organize the objectives and priorities in order to ease the reading and the comprehension of our impact analysis.
Strategic objective
Operational objective Operational objective
Operational objective
Operational objectiveOperational objective
e.g. • Filling missing links
• Resolving bottlenecks
• Optimization of the use of infrastructure
• e.g. Free movement of persons and goods
Strategic objective Operational objective

Ex-post / Final evaluation of the TEN-T MIP –Final Report – November 2007
59
Some preliminary remarks are needed here:
• For some of the projects (namely all the PPs), the contribution to the objectives and priorities of the TEN-T should be relatively clear, as all the PPs have been identified by the Commission and the Member States as projects contributing in priority to the establishment of the Trans European Network for Transport;
• A number of the projects that we have examined in our sample were related to studies (38% of the AFD’s); by themselves, studies only contribute indirectly to the achievement of the objectives and priorities of the TEN-T. But the investment projects (even if not yet started), that the studies aim to prepare and analyse, should contribute to these objectives and in that context their expected contribution can also be assumed. This approach relative to the “expected” contribution has been based on the analysis of our interviewees’ perceptions37.
5.2.5.2. L I M I T A T I O N O F T H E A P P R O A C H
We only evaluate in this chapter trends in the contribution of the projects to the TEN-T objectives. Indeed several limitations hamper our ability to identify properly (and in a fact-based way) the contribution to the TEN-T objectives:
1. As already stated, taking into account the fact that projects are not yet started, not yet finished or have only recently been completed, there is no quantitative indicator revealing impact of the projects on the objectives and priorities of the TEN-T. Of 50 projects included in our sample, only 12 are actually in operation (see table below).
Table 14: Projects in operation
Ref MS Title Starting date/comments
PP101 DE
Berlin Railway node: measures in Lehrter Bahnhof and Bahnhof Papestrasse stations (now the Hauptbahnhof and the Suedkreuzbahnhof); upgrading of Südkreuz-Ludwigsfelde and Sudkreuz - Blankenfelde sections
May 2006, but it should be noted that this is only the very northern segment of the line running south from Berlin.
PP102 DE
High-speed railway link Nuremberg-Munich: construction of new Nuremberg - Ingolstadt section: upgrading of Ingolstadt - Munich section
May 2006 (Nuremberg-Ingolstadt); December 2006 (Ingolstadt-Munich). It should be noted that this will ultimately be part of the Berlin-Italy link.
PP401 FR European TGV East (TGV Est Européen): Construction Phase I (Vaires - Baudrecourt)
June 2007
37 As explained in chapter 4.Methodology, we were unable to use the Project appraisals for this.

Ex-post / Final evaluation of the TEN-T MIP –Final Report – November 2007
60
Ref MS Title Starting date/comments
PP402 DE
Railway link Paris – Eastern France – South Western Germany: upgrading of section Ludwigshafen – Saarbrücken – German-French border for high-speed traffic
Major milestone was launch of high-speed connection between Paris and Frankfurt on 10 June 2007. However, the upgrade to speeds of 200 km along all stretches will not be complete until 2013.
PP607 IT
Enhancing the productivity of infrastructure and technologies in order to increase the fluidity of East/West traffic (the Pioltello-Treviglio and Rovato-Padua sections).
2006, but it should be noted that these are only two segments of the line from Milan to Venice-Mestre.
PP608 IT Reorganisation of the Venice/Mestre railway junction
2006, but this is only one part of the Milan to Venice-Mestre link.
PP1204 FI Nordic Triangle/Finnish part: E18 Motorway, construction of Paimio-Muurla and Helsinki Ring III sections
Sections co-financed by the MIP are finished but the whole motorway will not be finished until 2015.
PP1301 (A-C) IE
Planning and design of Ireland element of the Ireland/United Kingdom/Benelux Road Link
Some motorway sections are in operation; the whole motorway should be completed in 2010.
PP1302 UK A120 Stansted to Braintree road upgrading
Motorway (24 km) has been in operation since in 2004. The ex post evaluation will be finished in October 2007. The whole road axis will be finished in 2013.
GR1001 AT Danube railway axis: construction of Enns bypass and Rohr freight bypass April 2007
GR1019 IT Node of Rome: construction of the high speed urban junction.
Work was finished in 2005 but the full impact will not be felt until the whole high speed line has been completed and the appropriate rolling stock is available.
GR1025 FI Removal of bottlenecks on the railway network in Finland: Luumaki - Joensuu and Oulu - Iisalmi/Vartius sections
Completed in 2006 but the complete renewal will not be finished until 2009.
2. As some projects were exclusively composed by studies or focused on a small part of a bigger coherent project, they did not have per se an impact on the TEN-T objectives and priorities.
3. Objectives and priorities of TEN-T are defined in broad terms summing up various EU strategies and legislation such as the Lisbon Strategy or the Goteborg Strategy or the European

Ex-post / Final evaluation of the TEN-T MIP –Final Report – November 2007
61
directives relating to the environment protection38. This tends to lead interviewees to declare that their project was contributing to at least one of these objectives.
4. There is no shared and common understanding of certain concepts such as “bottlenecks” or “sustainable mobility”, leading to a lack of comparability in the discussions.
5. “Competition” between the objectives exists, as projects have to comply with objectives in matters of environment, social cohesion, development of the internal market, economic development including employment and so on.
6. We have not been in a position to use eventual studies done by the project promoters with regard to the potential contribution to the TEN-T objectives and priorities as these were either non-existing (at least the quantitative approach) or organised in such different ways that an overall comparison would have deemed to be useless.
5.2.5.3. O P E R A T I O N A L O B J E C T I V E S
In order to contribute to the strategic objectives of the TEN-T, the MIP projects must aim at several operational objectives listed in the TEN-T guidelines. These objectives should be reached quickly after the project completion:
Table 15: TEN-T operational objectives
TEN-T Operational objectives
Interoperability Filling missing links
Intermodality Optimisation of the use of infrastructure
Improvement of the quality of infrastructure Resolving bottlenecks
As a first qualitative indicator, we conducted an analysis of the extent to which the project aimed at contributing to the TEN-T operational objectives. The Figure below gives the distribution of the main operational objective to which the projects intended to contribute (based on responses during interviews). If the projects were studies, we inquired about the long term objective of the overall underlying project. We obtained the information for 49 projects out of our sample of 50.
38 Council Directive 85/337/EEC of 27 June 1985 on the assessment of the effects of certain public and private projects on the environment and , Council Directive 92/43/EEC of 21 May 1992 on the conservation of natural habitats and of wild fauna and flora

Ex-post / Final evaluation of the TEN-T MIP –Final Report – November 2007
62
Figure 7: Main Operational Objectives of the Projects (one per project)
We can see that many projects aimed at fulfilling ‘several objectives’ at the same time. Indeed, many projects could logically contribute to several objectives, for example:
• Upgrade of the existing infrastructure because of bottlenecks due to speed limitation (e.g. railways infrastructures in Finland – GR1025);
• Fill a missing link with intermodal shift. (e.g. construction of the international section between Figueras and Perpignan of the Madrid-Barcelona-Perpignan-Montpellier high-speed link which includes a project of rolling motorway – PP306;
• Mix new links with upgrading of existing infrastructure in order to speed up passenger and freight traffic (e.g. High-speed railway link Nuremberg – Munich – PP102).
Also, many projects are regarded as having the resolution of bottlenecks as a main objective. However, as stated above, we noticed during our interviews that a bottleneck could be understood as a section in the transport network where the journey time is too long and not specifically as a zone where there is too much traffic.
Nevertheless, we can assume that projects will have an impact on local bottlenecks that will improve the circulation on the network as a whole. This is the case, for instance, when considering projects such as the Brenner base tunnel (PP104) on the axis from the Nordic Triangle to the south of Europe, or the tunnel below the city of Malmö in Sweden (PP1201) that will improve access to the Øresund Bridge and increase its use.
Eight projects out of our sample are considered to have as main objective the network completion by filling missing links. These links have indeed a singular impact on the TEN-T, particularly when they are cross border or improve the access to cross border infrastructures. This is the case for instance for the completion of the PBKAL in the United Kingdom (PP202) that should improve the use of the Channel Tunnel, or the Eastern High Speed Line from Paris to Germany (PP401).
Four projects have as main objective the improvement of the quality of the existing infrastructure. Although these projects consist sometimes of works in existing railways that could be defined as technical maintenance, they should improve the use of railways instead of road thanks
Operational objetives of the projects
Several objectives; 16
Intermodality; 1
Improvement of the quality of
infrastructure; 4
Other; 1
Interoperability; 2
Optimization of the use of infrastructure; 1Resolving bottlenecks;
16
Filling missing links; 8

Ex-post / Final evaluation of the TEN-T MIP –Final Report – November 2007
63
to the journey time decrease and capacity increase. In Ireland, the state of the railways network was in a very bad condition at the beginning of the 90’s and thanks to the MIP and the Cohesion funds, commuters can now use renewed line and modern multimodal shift stations. The whole PP9 deals with the elimination of a number of key permanent speed restrictions along the Belfast – Dublin – Cork Intercity Rail Corridor.
Very few projects consider the interoperability and intermodality issues as well the optimisation of the use of the infrastructure as a primary operational objective. This could be understood by the fact that these objectives are not considered as objectives per se but as part of a larger objective or as a means to rely on in order to reach the operational objectives.
Only the international section Lyons – Turin (PP603) has intermodality as main operational objective, as road congestion and dramatic accidents such as the accident in the Mont Blanc Tunnel in 1999 are obliging the public sector to find structural and environmentally friendly solutions. In this context, rolling motorways are a possible solution. The Perpignan Figueras Tunnel (PP306) also aims at developing a rolling motorway but interoperability issues were a real challenge and are thus considered as the main operational objective.
In the Figure below, we give an overview of the amount awarded for each operational objective during the period of the MIP 2001-200639. We can see that most of the MIP money was awarded to projects dealing with missing links and bottlenecks. This is to some extent normal as the previous Figure showed that 24 out of 49 projects of our sample had the creation of missing links and the resolution of bottlenecks as first objective.
We can also see that the objective “Filling missing links” was more budget-consuming than the objective to resolve bottlenecks. For our sample, about one third of the awarded amount was awarded to these projects during the programming period. This is because the projects to resolve bottlenecks are very large scale. If we consider the cross-border projects across natural barriers and new high speed lines crossing sizeable countries, the MIP can be seen to have pushed forward these types of project in order to produce impacts on the TEN-T as soon as possible.
39 The source for the amounts is the Annual Financial Decisions of the projects in our sample.

Ex-post / Final evaluation of the TEN-T MIP –Final Report – November 2007
64
Figure 8: Amount invested in each operational objective
5.2.5.4. S T R A T E G I C O B J E C T I V E S
In this section we look at the two main strategic objectives of each project in our sample. Considering the fact that the projects are not finished (or finished, but without producing tangible indicators due to their recent completion), we analysed their expected impacts (as for studies). As we collected the information through the interviews, the projects’ objectives are updated compared to what was said in the project appraisals.
We have distinguished eight strategic objectives in the TEN-T guidelines.
Table 16: TEN-T Strategic Objectives
TEN-T strategic objectives Comments
Regional development The TEN-T aims at opening up regions that are not or under-equipped with high quality transport infrastructures. This is key for the development of enterprises in less developed regions through the increase in workers’ mobility, freight transport and regional dynamic image.
Employment In the context of the Lisbon Strategy that aims at raising the overall employment rate in the European Union to 70% and the female employment rate to more than 60% by 2010, the TEN-T could significantly contribute to these objectives. TEN-T can impact direct and indirect job creation both during the project implementation and when the transport infrastructure is in operation.
Environment The EU environment policy aims to preserve, protect and improve the quality of the environment. Transport activities are particularly pointed out and, for several years, the EU pushed
Awarded amount by operational objective (Mio€)
Filling missing links; 401,97
Resolving bottlenecks; 272,603
Several objectives; 581,26
Interoperability; 97,4
Intermodality; 133,779
Optimization of the use of infrastructure;
30,5Other; 88,8
Improvement of the quality of
infrastructure; 48,335

Ex-post / Final evaluation of the TEN-T MIP –Final Report – November 2007
65
TEN-T strategic objectives Comments
further the application of the mainstreaming of environmental protection in this policy. The TEN-T has a significant role to play by urging Member States to apply EU environmental principles such as the “polluter-payer” one.
Sustainable development The EU Sustainable Development Strategy (SDS) implies that in the long run, economic growth, social cohesion and environmental protection must go hand in hand. The singular aim of this strategy is to consider the links between the three dimensions and to correct imbalances. The revised TEN-T guidelines (2004) particularly underlined the sustainable development as a key principle for a modern transport system.
Traffic Chronic congestion issues at local level such as bottlenecks are factors that significantly hamper development of a European network of transport. The White Paper on sustainable mobility for the EU40 emphasizes the responsibility of the EU to find solutions to traffic issues that have an impact at local level and slow the European traffic down.
Competition High quality transport infrastructures in all Member States are key elements for fair competition between the Member States but also with the rest of the world.
Free movement of persons and goods
Mobility of goods and persons is an essential component of the competitiveness of the European industry and services. Railway transport can contribute to both passenger and goods transport and the EU has a significant role to play.
Cross-border / trans-national cooperation
The TEN-T guidelines underline the necessity of completing missing links between Member States. These links do not have a major impact for countries from both border sides but they are part of EU priority axis. Considering costs of such missing links, natural barriers are mainly concerned.
We interviewed Member States and project promoters on the basis of the above list and identified the two main strategic objectives of each project. We show this qualitative result in the Figure below.
40 Communication from the Commission to the Council and the European Parliament - Keep Europe moving - Sustainable mobility for our continent - Mid-term review of the European Commission’s 2001 Transport White Paper COM/2006/0314 final

Ex-post / Final evaluation of the TEN-T MIP –Final Report – November 2007
66
Figure 9: First and second expected project impacts on the TEN-T strategic objectives
The following objectives are most frequently targeted by the various projects co-financed by the MIP:
• Free movement of persons and goods;
• Traffic;
• Cross-border/transnational cooperation;
• Regional development;
• Sustainable development.
Of course, these objectives do not stand by themselves but are part of a national socio-economic strategy.
We have also calculated the amount invested by the MIP in each strategic (sub)objective (see Figure 10). It gives us the opportunity of balancing the previous Figure based on the number of projects aiming at contributing to a specific strategic objective.
Number of projects by strategic objective
Competition; 1
Free movement of persons and goods; 26
Others; 6Regional development; 13
Sustainable development; 10
Traffic; 22
Cross-border / trans-national cooperation; 12
Employment; 3
Environment; 5

Ex-post / Final evaluation of the TEN-T MIP –Final Report – November 2007
67
Figure 10: Total amount invested by strategic objective
As a quantitative indicator, we have used the total awarded amount to each project. We can see that the objectives regarding: traffic, free movement of goods and persons, cross border / transnational cooperation and regional development have received most of the funds.
The potential impacts that the projects (could) have on the objectives of the TEN-T are as follows:
1) Free movement of goods and persons
Railway solutions for freight transport are increasingly investigated in many Member States in order to improve the quality of road traffic and to stretch the delivery distance out in due time. New links and upgrading of existing railway infrastructure to high speed circulation are realised throughout the EU with the aim of improving the passenger traffic. High speed lines are not per se designed for freight transport, but relieve the secondary or classical network that can than be used for freight transport.
Traditionally mainly goods with low added value have been transported by rail. As a consequence, freight transport by rail corresponds to 10% of total freight transport and 22% of international freight transport in 200541. We can assume that rolling motorway solution and high speed train for passengers (the major part of the MIP projects) will have a significant impact on the goods transport in EU.
Moreover, if we consider the current debates on the opening of the market for international rail traffic as of 2010 (and maybe earlier), the pressure is on the Member States to offer quality infrastructure and collaborate with other countries in order to significantly develop the TEN-T in the coming years. Journey times have to be guaranteed both for passenger and freight transport for fear of having to pay compensation in case of delays.
2) Traffic
Solutions for traffic congestion at national or local level are well supported by Member States. Both road and railway infrastructures are concerned by these projects. The impacts of such projects are
41 Eurostat data
Amount invested by the MIP by stratgic objective (sample) (Mio€)
Competition; 17,5Cross-border / trans-national
cooperation; 268,0245
Employment; 101,9
Environment; 78,825
Free movement of persons and goods; 292,8865Others; 157,55
Regional development; 231,3985
Sustainable development; 171,402
Traffic; 335,1605

Ex-post / Final evaluation of the TEN-T MIP –Final Report – November 2007
68
first of all on the national network where we consider the quality of life of the users and environmental issues for people living around the transport infrastructures. Projects such as the construction of a new A120 highway from Stansted to Braintree (United Kingdom – PP1302) have a significant impact on the traffic alleviation on the secondary road network. This is also the case for the upgrading of the road axis between Cork-Dublin-Belfast (Ireland - PP1301) that previously ran through villages and generated accidents. On a higher level, both projects will create significant capacity increases and allow much faster journey times on the United Kingdom/Ireland/ Benelux road axis for passengers and freight (TEN-T priority axis 13).
As a consequence many projects targeting traffic congestion will improve local and national traffic firstly. The improvement of the circulation on the European axis of which they are a part should be considered as an indirect effect.
3) Cross border / transnational cooperation
We can make a distinction between two types of projects that have an impact on transnational cooperation:
1. Cross border sections that, as missing links, will have a direct impact on the cross border exchanges and on the opening of the EU corridors;
2. Projects that will allow for access to these cross border (international) sections.
Both of them are of course complementary and should be conducted at the same time in order to produce as much impact as possible. Nevertheless, we have noticed that in the most cases cross-border sections are well supported by the Member States and the EU – through higher focus from all parties and higher MIP financing (up to 20% with the 2004 revision and up to 30% as from 2007) –but the projects involving access to the cross border sections (mainly tunnels) face delays for political or technical reasons. It is complex to synchronise both construction phases, even more so because each Member State is individually responsible for its own access to the cross border" section.
Nevertheless cross border projects are not always located in mountains or on (or under) the sea. In this case connection between national networks is easier but interoperability issues (e.g. compatibility issues between two traffic management systems) could occur. In order to solve these obstacles, clear political decisions and substantial investments are needed.
Considering the current obstacles to the cross border project completion, we can assume that they will not have significant effects in the medium term.
4) Sustainable development / environment
Environmental concerns are increasingly addressed in infrastructure projects. Our interviews and document analysis showed that sustainable development is becoming an objective per se. Under the EU impulse but also because of Member States’ political decisions, significant investments have been made in high speed railway.
The MIP mainly finances rail transport. Only in regions with no motorways or with major safety problems did MIP money finance the construction of motorways (e.g. in United Kingdom, Ireland, Greece, and Finland). No upgrading of existing motorway was co-financed by the MIP. The Figure below presents the transport modality sharing among the MIP projects.

Ex-post / Final evaluation of the TEN-T MIP –Final Report – November 2007
69
Figure 11: Transport modality sharing among the projects
Given air transport's sensitivity in terms of being a sustainable mode of transport, very few air projects received MIP financing.
5) Regional development
MIP projects have an impact on regional development in some Member States. This is for instance the case with Castilla La Mancha-Valencia Community-Murcia regions that will be integrated into a fully operable trans-European high speed rail network (GR1009). The export (mainly vegetables and fruit) from these regions would be more efficient as a result.
Another type of regional impact that could be noticed among the projects is the settling of inhabitants in low populated areas thanks to new railway lines and stations. “TGV Est” (PP401) in France should allow for regional development between Paris and the German border thanks to two stations on the high speed railway axis East. This is also the case for projects aiming at easing the access to the economic centres, with high workforce demand around capitals and big cities (e.g. motorway to Dublin - PP1301 – and railway to Helsinki - PP1205).
6) Employment
Few projects aim at creating jobs as an objective but we can assume that the projects cofinanced by the MIP will create thousands of jobs. These jobs will be created at different levels:
1. During the implementation phase: billion euros projects produce significant number of jobs. There is no complete data on this number because project promoters use subcontractors for the construction work and do not have a clear view on the exact number of people involved in this work;
Transport modality sharing (# projects from our sample)
Rail; 41
Road; 7
Air; 1Water; 1
Ex-post / Final evaluation of the TEN-T MIP –Final Report – November 2007
70
2. In the operational phase: considering that in 2004 the transport services sector employed about 8.2 million people in the EU-2542, new transport infrastructures in all the Member States will create many direct jobs in maintenance, exploitation, traffic management, train driving…
3. Around the transport infrastructures: many indirect jobs will be created for services to travellers for purposes such as taxis, shops and catering.
4. By the use of the transport infrastructures: fast interregional and international transport connections will advance the right to free movement of workers.
7) Competition
To our knowledge, no project has been analysed in terms of its quantifiable impact on the competitiveness of Member States (intra-EU or vis à vis the rest of the world). Nevertheless, it is self-evident that improving European transport infrastructure and performance is a key element to contribute to these objectives. In addition, there is the important dimension of the transport networks connecting EU-12 and the neighbouring states - and onward to Asia.
In order to develop the European Union's external trade and to improve the transit conditions, Member States located at the EU borders such as Finland express the need for developing transport connections with third countries, Russia in this case. Political and EU financial support could be improved, as recommended by the High Level Group on TEN-T led by ex-Commissioner Karel Van Miert in 2003.
5.2.5.5. C O N C L U S I O N S
When looking at the current framework of TEN-T development, MIP projects with strong impacts at national level are not surprisingly those which will be completed in the short term. The main aims of these projects are:
1. To fill missing links between big cities and isolated regions;
2. To solve bottleneck issues constituted by nodes around and in large cities;
3. To upgrade existing infrastructure where circulation is particularly slow.
Generally speaking, these projects will mainly have an impact on the traffic at national level. This is not, in our sense, a limitation to the TEN-T objectives of optimising the exchanges between national networks, but rather a first and necessary step towards this objective.
Nevertheless, the improving of the national transport network should be realised in parallel with links between national networks in order to produce significant impacts on the TEN-T objectives. During the MIP programming period 2001-2006, political agreements were reached between several countries: Belgium, the Netherlands, France, Spain, Italy, Germany, Denmark, Ireland, the United Kingdom… Many cross-border links are now in the project phase or even in the implementation phase. We envisage that major cross border links will produce major impacts on the European network in the horizon of 2010-2015.
42 Eurostat data.

Ex-post / Final evaluation of the TEN-T MIP –Final Report – November 2007
71
Based on our project analysis, the impacts that the projects will have are mainly on:
• Free movement of persons and goods;
• Traffic;
• Cross-border/transnational cooperation;
• Regional development;
• Sustainable development.
We can thus argue that the socio-economic objectives (including employment, regional development, social cohesion…) of the TEN-T should be significantly impacted by 2015. No strong evidence based studies exist and compilation of partial project data is the basis for this but after the programming period we can say that many projects that are running well have socio-economic concerns.
During the programming period (and increasingly towards the end), the MIP also put a sharp focus on development of the internal market by supporting projects that support cooperation between the Member States in a global sense. In that context, the increase in the cross border co-financing (up to 30% for the next programming period) and the appointment of European coordinators for some priority projects are perceived as important factors for the TEN-T development. Nevertheless, when considering the cost of such cross border projects and the TEN-T available budget, many Member States involved in these projects are worried about the fact that the EU will not support their project as much as they would need. As a consequence, precautions are taken by the Member States in project planning and implementation to avoid rushing into large scale infrastructure projects with reduced EU financial support.
Last but not least, sustainable development objectives are being more and more integrated by Member States in developing their transport network infrastructures. The MIP with its selection criteria and environmental obligations on projects (such as the obligation to perform an environmental impact study 5 years after the project completion) played a major role in this. In general, the Member States give preference to the railway development instead of road both for TEN-T projects and their own national transport projects. Even though, in parallel with railway development, air traffic continues to be increasingly developed with the creation of new airports and the extension of small regional airports, few of them are cofinanced by TEN-T money.
5 .2 .6 . EFFICIENCY
When assessing the efficiency of the MIP, we looked at the following questions:
• to what extent the financed projects (studies and works) were economically or financially viable;
• to what extent objectives have been achieved at a reasonable cost. Regarding this question, the projects co-financed by the MIP are not generally far enough advanced or were completed43 too recently for updated impact indicators in relation to the TEN-T objectives to be available. Most projects that were nominally completed during the programming
43 Within our sample, 12 projects out of 50 are already in operation.

Ex-post / Final evaluation of the TEN-T MIP –Final Report – November 2007
72
period did not produce indicators because they are part of a broader project that is not yet completed;
• to what extent MIP procedures have been efficient. This assessment is presented under Evaluation Theme B: Management.
5.2.6.1. F I N D I N G S
All infrastructure works that are financed by the MIP are the result of a political decision to undertake the project. As all infrastructures are owned by the Member States or a state company, the prolongation of the lifecycle of the infrastructure is or will be a political decision.
The government can take different parameters into account when deciding on the prolongation of an infrastructure. The most important are economic viability, financial viability and public interest. Whereas the first two parameters are measurable, the later is more difficult to define.
However, in the quantitative data collected on the evaluated projects, there was usually no profitability indicator44. The main reasons for this were either that:
- the nature or size of projects did not justify studies to define the profitability indicators; or
- the culture of defining clear profitability indicators is not yet well established.
In the table below we provide an overview of all the profitability indicators we identified.
Table 17: Overview of the profitability indicators received per project (amounts in million €)
We can see that the cost-benefit ratios are overall significantly higher (always above 30%) than the internal rate of return (IRR) (always below 10.2%). This conclusion is an indication of the important difference between economic viability (assessed by cost-benefit ratio) and financial viability (assessed by IRR) of large infrastructure projects. The c/b ratio also takes into account the external economic effects, such as the creation of indirect employment, decrease in traffic accidents and traffic jams, etc. The IRR only measures the financial benefits the project will be able to generate and does not take external economic effects into account. If financial viability is used as the main input for decisions on the project, only a few projects will be prolonged after the intervention of the
44 Of the 36 financial tables we received, 11 of them contained one or more profitability indicators.
ProjectsNet Present Value
(Mio €)Benefit/Cost ratio Internal Rate of Return
(%)Pay back period
(in # years)
Actual or Foreseen Number
AT GR3001 990,80 NA 10,20 ForeseenAT PP103 5957,00 NA 5,00 50 ForeseenDK GR3009 2000,00 NA 7,00 25 ForeseenIT PP 608 65,00 NA 9,00 ActualIT GR1019 -24,80 NA 0,95 ForeseenIT PP604 1050,00 NA 7,00 ActualIT PP104 -1623,00 1,30 2,33 ActualBE PP204 NA NA 6,00 ForeseenFI PP1204B NA 2,70 NA ForeseenFI PP1204A NA 1,50 NA ForeseenFI PP1025B NA 2,00 NA Foreseen

Ex-post / Final evaluation of the TEN-T MIP –Final Report – November 2007
73
MIP. In fact, governments tend only to take economic viability into account. Moreover, if the economic viability is not positive, government may decide to continue a project because of the public interest.
For studies, efficiency is more difficult to define as there is no data assessing the financial or economic viability of the studies that were undertaken. Also, the public interest of studies can be very high (e.g. environmental impact assessments) but very complex to measure. The subject of a study is often to investigate whether or not to continue with a project or to change the scope of a project. To the extent that the result of the study is taken into consideration, the study obviously has its effect on a longer term.
5.2.6.2. C O N C L U S I O N S
As illustrated by the low number of profitability indicators we received from the Member States, there is a need to stimulate a culture in Europe to calculate these indicators for every large infrastructure project - and for a consistent approach to their calculation45. Creating a culture and having a consistent calculation of the parameters, however, does not imply that only projects with positive profitability indicators should be executed. Clear public interest criteria will usually play the strongest role in such decisions.
Initiatives and methodologies already exist in order to harmonise cost-benefits analysis: • HEATCO, DG TREN initiatives in order to develop Harmonised European Approaches for
Transport Costing and Project Assessment; • Railpag,, a joint EC-EIB initiative in order to harmonised procedures for rail project appraisal
and suggests best practices for applying cost-benefit analysis to rail projects; • The Guidance on the methodology for carrying out cost-benefit analysis of DG REGIO for
programming period 2007-2013.
One of these methodologies should be chosen and its use should be generalised for future cost-benefit analysis of transport projects.
5 .2 .7 . SUSTAINABILITY
Sustainability is the interaction between environment, economy and society. As for the efficiency, the fact that projects co-financed by the MIP are not or too recently completed limits the findings regarding this question.
At TEN-T level the following objectives and priorities are directly related to sustainable concerns:
- to ensure the sustainable mobility of persons and goods within an area without internal frontiers under the best possible social and safety conditions, while helping to achieve the Community's objectives, particularly in regard to the environment and competition, and contribute to strengthening economic and social cohesion;
45 Initiatives and methodologies already exist in order to harmonise cost-benefits analysis. We can mention:
• HEATCO, DG TREN initiatives in order to develop Harmonised European Approaches for Transport Costing and Project Assessment;
• Railpag,, a joint EC-EIB initiative in order to harmonised procedures for rail project appraisal and suggests best practices for applying cost-benefit analysis to rail projects;
• The Guidance on the methodology for carrying out cost-benefit analysis of DG REGIO for programming period 2007-2013.

Ex-post / Final evaluation of the TEN-T MIP –Final Report – November 2007
74
- to offer users high-quality infrastructure on acceptable economic terms;
- to be, insofar as possible, economically viable;
- the optimum combination and integration of the various modes of transport;
- integration of environmental concerns into the design and development of the network.
One can suppose at this stage that MIP projects are in line with these objectives, specifically in terms of environment, if one considers the part of railway projects that have been supported.

Ex-post / Final evaluation of the TEN-T MIP –Final Report – November 2007
75
5.3. Theme B: Assessment of the management of the TEN-T MIP
5 .3 .1 . EVALUATION JUDGEMENT CRITERIA AND LIMITATIONS OF THE APPROACH
In order to assess the management of the TEN-T MIP, we have analysed:
1. the effectiveness and efficiency of the MIP procedures including the programme planning, the selection procedures, the follow-up procedures and the financial management;
2. the influence of the 2004 changes in the guidelines and the procedures on overall MIP management;
3. the influence of the MIP procedures on the performance of the projects in comparison with the performance of the projects supported under the TEN-T annual calls.
The data that we have used for evaluating MIP management come mainly from the analysis of the interviews that we conducted with, on the one hand, those in the Member States responsible for MIP management and project promoters (the beneficiaries) and, on the other hand, Commission officials dealing with the management of the MIP. In terms of the financial data at our disposal which are used as quantitative indicators, comprehensive data was made available to us on the MIP projects. However, no structured data was made available on the non-MIP projects, so that we did not have the same comprehensive picture.
As our information source is mainly stakeholder opinion, we have overlaid the various statements in making a judgement in order to highlight common viewpoints and to avoid biased assertions.
We conclude the evaluation of the management of the MIP with considerations on the added value of the MIP procedures for the beneficiaries in terms of transfer of good practice.
5 .3 .2 . EFFECTIVENESS AND EFFICIENCY OF THE MIP PROCEDURES
The evaluation of the effectiveness and efficiency of the MIP means that we have to analyse the following questions:
1. How far have the MIP procedures contributed to achieving the objectives of the MIP in terms of support to achievement of the objectives of the TEN-T?
2. Are the MIP mechanisms for implementation both optimal and cost-efficient?
In this section we will have a more detailed look at whether each procedure met its objectives and was thus individually effective. The question in terms of efficiency is: would it have been possible to reach the same results at less cost, i.e. with different procedures? In this section, we approach MIP procedures in this way.
We have gathered the various MIP management tools and procedures into four sections:
• Planning;
• Selection procedures, application forms, and project appraisal;
• Follow-up procedures including the PSR;

Ex-post / Final evaluation of the TEN-T MIP –Final Report – November 2007
76
• The financial regulations, including payment request and technical reports.
We will analyse each procedure46 by considering the beneficiaries’ view and the Commission view.
By way of introduction, the overall MIP process is presented in the following Figure.
Figure 12: Overall MIP process
5.3.2.1. P R O G R A M M E P L A N N I N G
One of the objectives of the MIP in comparison with the previous financing support was foreseeability. Each project supported may receive a predefined amount each year providing they stick to the planning timetable as stipulated in the 2001 Framework Decision47 and detailed annually in the financial decision (AFD). They receive the amount awarded in the financial decision, and may start the process for the next AFD if the activities envisaged have been realised and progress has been reported.
The MIP follows a six-year planning cycle. Consequently, the beneficiaries had to plan their project activities from 2001 till 2006.
According to our interviews, a multi-year planning cycle creates advantages in terms of effectiveness and efficiency:
1. Beneficiaries know that their projects will be supported each year if their project activities are carried out as foreseen. They do not have to spend time each year in making new applications without knowing if their project will be cofinanced again by the MIP. Moreover, if the project
46 In order to be as possible in line with the Commission explanations, we used for the procedure descriptions the TEN-T handbook – A practical guide for users.
47 The 2001 Framework Decision establishes the Indicative Multiannual Programme for the granting of Community financial aid to projects of common interest in the area of the trans-European transport network for the period 2001 - 2006 (C(2001)2654/final of 19 September 2001). This Decision allocates the total MIP amount to the twelve individual projects of common interest and four coherent groups of projects of common interest.
Planning follow-up…Planning
follow-up…Selection Process
Selection Process
New AFD draw-up
New AFD draw-up
Paymentprocess
Paymentprocess
Planningfollow-up Planning
follow-up
FrameworkdecisionFirst AFD
FrameworkdecisionFirst AFD
PSRPSRPayment request
Payment request
NegotiationApplication
forms
NegotiationApplication
forms
20002000
Project appraisalProject
appraisal
Overall MIP processOverall MIP process
20062006
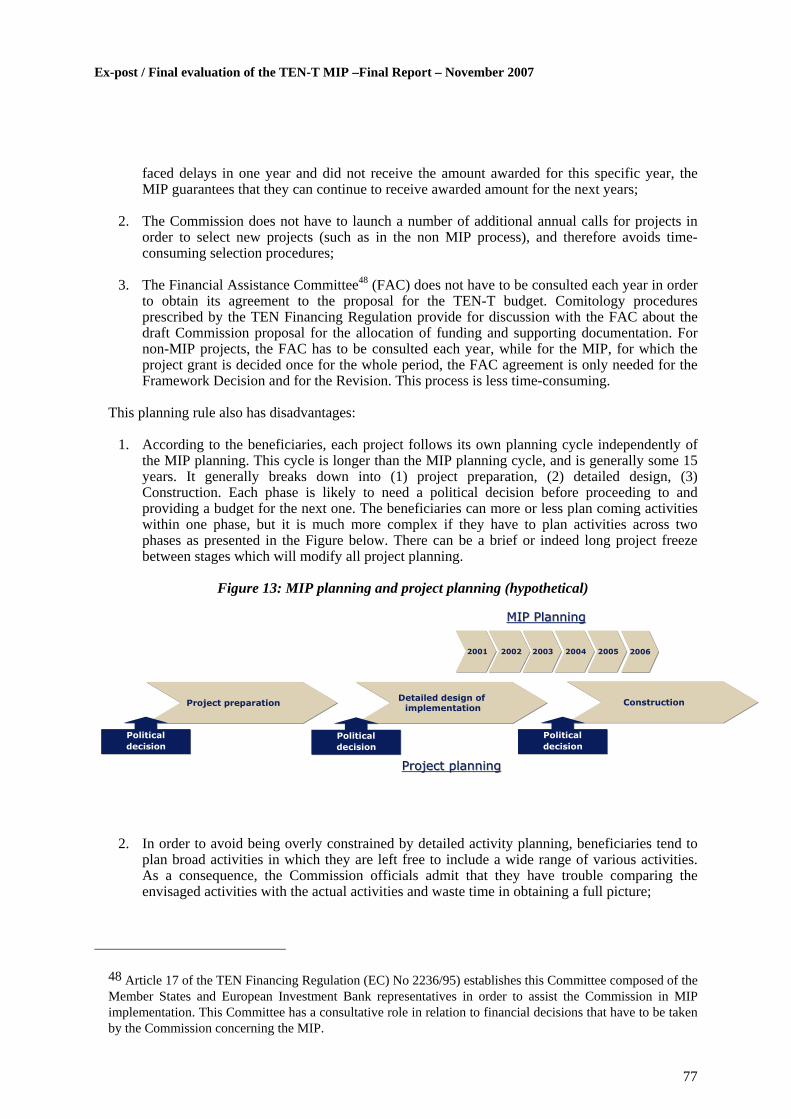
Ex-post / Final evaluation of the TEN-T MIP –Final Report – November 2007
77
faced delays in one year and did not receive the amount awarded for this specific year, the MIP guarantees that they can continue to receive awarded amount for the next years;
2. The Commission does not have to launch a number of additional annual calls for projects in order to select new projects (such as in the non MIP process), and therefore avoids time-consuming selection procedures;
3. The Financial Assistance Committee48 (FAC) does not have to be consulted each year in order to obtain its agreement to the proposal for the TEN-T budget. Comitology procedures prescribed by the TEN Financing Regulation provide for discussion with the FAC about the draft Commission proposal for the allocation of funding and supporting documentation. For non-MIP projects, the FAC has to be consulted each year, while for the MIP, for which the project grant is decided once for the whole period, the FAC agreement is only needed for the Framework Decision and for the Revision. This process is less time-consuming.
This planning rule also has disadvantages:
1. According to the beneficiaries, each project follows its own planning cycle independently of the MIP planning. This cycle is longer than the MIP planning cycle, and is generally some 15 years. It generally breaks down into (1) project preparation, (2) detailed design, (3) Construction. Each phase is likely to need a political decision before proceeding to and providing a budget for the next one. The beneficiaries can more or less plan coming activities within one phase, but it is much more complex if they have to plan activities across two phases as presented in the Figure below. There can be a brief or indeed long project freeze between stages which will modify all project planning.
Figure 13: MIP planning and project planning (hypothetical)
2. In order to avoid being overly constrained by detailed activity planning, beneficiaries tend to plan broad activities in which they are left free to include a wide range of various activities. As a consequence, the Commission officials admit that they have trouble comparing the envisaged activities with the actual activities and waste time in obtaining a full picture;
48 Article 17 of the TEN Financing Regulation (EC) No 2236/95) establishes this Committee composed of the Member States and European Investment Bank representatives in order to assist the Commission in MIP implementation. This Committee has a consultative role in relation to financial decisions that have to be taken by the Commission concerning the MIP.
20012001 20022002 20032003 20042004 20052005
ConstructionConstructionDetailed design of implementation
Detailed design of implementationProject preparationProject preparation
20062006
Political decisionPolitical decision
Political decisionPolitical decision
Political decisionPolitical decision
MIP PlanningMIP Planning
Project planningProject planning

Ex-post / Final evaluation of the TEN-T MIP –Final Report – November 2007
78
3. National planning systems vary. Some of them coincide closely with the annual MIP planning, while others do not run on a calendar basis but on the basis of tranches. Beneficiaries from these countries artificially have to cut their project tranches into short parts in order to stick with the MIP annual planning framework.
It is possible to conclude, as a result – and as our interviews have shown – that the MIP planning cycle is well suited to projects that can absorb funding and easily achieve the annual expenditures envisaged. Considering that large scale infrastructure projects regularly face delays for technical or political reasons, the project planning is often modified. This has negative repercussions in the MIP context because beneficiaries have to obtain an amendment to the Financial Decision or the amount they were awarded is lost. This is paradoxical because the intention of establishing the MIP was to support effectively projects of common interest that faced implementation obstacles. An “indicative annual guarantee” such as the MIP provides could be an incentive for implementation of the projects, but would not prevent all delays for technical or political reasons.
5.3.2.2. S E L E C T I O N P R O C E D U R E S
As noted above, the MIP selection procedures differ from the previous systems by selecting all projects of common interest from the beginning of the programming period (2001). With such a system, no further project applications are needed for the projects during the programming period. The exception was the MIP revision (2004), when new projects were incorporated in the MIP list and when some projects were withdrawn from the list due to the fact that they did not start Twenty-two new projects were selected during this phase.
According to the Council Regulation laying down general rules for the granting of Community financial aid in the field of trans-European networks49, projects should have been selected on the basis of eligible criteria:
1. Selection criteria used to assess the applicant’s ability to complete the proposed action in accordance with the work programme:
a. Stable and sufficient sources of funding;
b. Professional competence and qualifications required to complete the action.
2. Award criteria used to assess the quality of the proposals submitted. Various criteria are appraised by the Commission:
a. Relevance to the common transport policy;
b. Contribution to sustainable development;
c. Added value of Community funding;
d. Maturity of the projects:
e. Stimulative effects of Community intervention on public and private finance;
f. Soundness of the financial package of the project;
49 Council Regulation laying down general rules for the granting of Community financial aid in the field of trans-European networks (EC) No 2236/95

Ex-post / Final evaluation of the TEN-T MIP –Final Report – November 2007
79
g. Socio-economic effects;
h. Environmental impact.
These criteria had to be detailed by the applicants in application forms. After a first “informal” and bilateral negotiation between each applicant and the Commission, a first agreement was reached on a group of national projects. These projects were then individually and formally detailed in a preliminary application form. The project was then appraised by the Commission, which then forwarded a selected project list and the budget allocated to the TEN-T FAC for approval. Then, detailed application forms had to be drawn up for the selected projects. These forms were used as a basis for the Framework decision and the first AFD. During the rest of the period, beneficiaries did not have to produce a detailed application form to open a new AFD. Only the project status report (PSR) was needed.
Figure 14: MIP selection process
This procedure applied only at the beginning of MIP. With the 2004 revision and for the new programming period (2007-2013), the project appraisal is only based on the detailed application form.
In the following sections, we analyse each stage in the selection process with the aim of assessing whether they are effective and efficient.
Stage 1: Negotiation
Informal negotiations were held before the formal project applications were lodged which were aimed at pre-identifying the project before completing time-consuming application forms. In that sense, the negotiation stage was effective because it refined the project list and emphasised projects of a high European interest. The negotiation stage was also a good mean for discussing budget sharing between Member States and stimulated the use of new technologies such as the ETCS (European Train Control System) according to several beneficiaries.
From the point of view of the beneficiaries and the Commission view-points, the negotiation stage was also important because it avoided a loss of time for applicants in filling out applications and for the Commission in weighing their respective merits. The negotiation was also an opportunity to discuss projects with the Commission in order to adapt them to the EU requirements. As the project list was shorter and better fitted European requirements, the Commission gained time during the project appraisal process.
All beneficiaries appreciated this stage and particularly the fact that they had the opportunity to explain their projects and the specificities that determined the project budget. For instance, during the negotiation stage, they were able to explain concretely how project costs were affected by
ProjectappraisalProjectappraisal
Detailedapplication
form
Detailedapplication
form
Preliminaryapplication
form
Preliminaryapplication
formNegotiationNegotiation
Selection processSelection process
Project selectionProject
selection

Ex-post / Final evaluation of the TEN-T MIP –Final Report – November 2007
80
geographical peculiarities (cost/km). We understand that applicants appreciate these informal negotiations but it has shortcomings in terms of procedural transparency, as it could have created openings for special pleading.
Stage 2: Preliminary application form
The preliminary application form was used as basis for the first MIP project appraisal in 2000. It contained the main information about the project such as
• technical description;
• key indicators that will be used;
• estimated eligible cost;
• timetable;
• support requested;
• general status;
• indicative financial plan.
In terms of effectiveness, we can argue that the preliminary application form actually allowed the Commission to select projects on the basis of this form. Nevertheless, the information contained in these forms was in our view not detailed enough to evaluate concretely the projects and decide whether they met the selection and award criteria. Information included in these forms was generally synthetic and general. It did not, for instance, make it possible to obtain a clear view on the maturity of projects and therefore of their ability to use the annual MIP budget annually, the scope of intervention of the project or the type of activities that were going to be conducted.
As a consequence, detailed application forms were needed to supplement the information from the preliminary application form and make it possible to draw up the MIP Framework Decision as the first AFD. Several documents, such as environmental impact or socio-economic studies, were annexed to the preliminary application forms or later requested by the Commission, but it was in our view very difficult to evaluate applications against the award criteria on the basis of these documents.
In terms of efficiency, it could be argued that the preliminary application was easy to fill in for the applicants, but for the Commission it generated the need to make added requests to the applicants in order to complete the information at their disposal (see appraisal section below). In the Figure below, we present a quantitative analysis of how beneficiaries who know its features viewed the preliminary application form. We gather the interviewees’ opinions by project.

Ex-post / Final evaluation of the TEN-T MIP –Final Report – November 2007
81
Figure 15: Interest of the MIP preliminary application form
As we can see from the Figure, a majority of beneficiaries valued the preliminary application form because it avoided loss of time when combined with the negotiation stage. A significant minority, however, felt it created a duplication of work. It should be noted that the preliminary application form was only used at the beginning of the process, not in the 2004 selection process. It should also be noted that some felt that the preliminary application form could have been used when applying for amendments to AFD's rather than having to fill in a full application form again.
3) Project appraisal
On the basis of the negotiations with the applicants and the preliminary application forms, the Commission selected projects of common interest in order to grant funding from the MIP using a project appraisal form and applying the award and selection criteria listed above. In practice, the emphasis was placed on a certain number of these criteria:
1. Degree of contribution to the TEN-T objectives and European policies;
2. Economic viability;
3. Timing and maturity;
4. Impact on environment and socio-economic development;
5. Financial need.
In order to assess the project appraisal process, we analyse here the extent to which projects that are selected generally meet these main criteria.
1. Degree of contribution to the TEN-T objectives and European policy objectives:
The Commission faced issues when evaluating the specific projects’ contributions to the TEN-T objectives because, on the one hand, TEN-T objectives are defined in broad terms and it was complex to specifically attribute projects to one objective (see section 5.2.5 on the
Interest of the preliminary application form
Accurate/easy/necessary; 25
Could be better; 11
Useless; 7

Ex-post / Final evaluation of the TEN-T MIP –Final Report – November 2007
82
Impact at programme level), and on the other hand, project descriptions in the preliminary application form were sometimes laconic and did not make the link with TEN-T objectives. That does not mean that the projects did not contribute to European policy objectives, but the evaluation of these contributions for each project on the basis of the preliminary application form was difficult and the process can then be considered as having a low effectiveness from this perspective.
2. Economic viability:
In order to evaluate whether projects were economically viable, the applicants had to produce socio-economic indicators such as cost-benefit ratio, internal rate of return and net present value. We note that the projects in our sample have good economic viability ratios (see section 5.2.7 on Sustainability at the programme level). We can thus ex post state that the selection process resulted in the selection of projects that are economically viable. Our interviews indicate that Member States also generally proposed projects that they regarded as economically viable. However, the preliminary application forms and the studies appended to them were not a satisfactory means for the Commission objectively to assess the economic viability upfront. Indeed, some projects were not able to provide this type of indicator because the projects were still in the preparation phase and had still to analyse these aspects in future studies (sometimes financed by the MIP). Moreover, as the socio-economic indicators are not calculated in the same way in all Member States and between different transport modes, these were no basis for arbitration between competing applications, and such comparison could only be indicative. Consequently, the selection procedures were not adequate for ensuring effective selection of economically viable projects ex ante.
3. Timing and maturity:
Projects that are proposed for MIP grants have to be mature as they have to produce proposals for expenditures each year in the framework of a predefined planning schedule. During the project appraisal phase, the Commission had thus to selects project that were ready to consume budget in the short term. Given the fact that 15% of the projects selected in 2001 did not start or progressed more slowly than foreseen during the programming period (43% of the MIP projects absorbed in average 53% of the their awarded amount) and that the MIP had to be revised in 2004 in order to redistribute50 unspent funds from these projects, it appears that, in fact, a significant number of projects selected were not financially or politically mature, or did not succeed in complying with planning schedules. The project appraisal stage dealt only with those projects which emerged from prior negotiations between the Member States and the Commission as being good candidates for MIP funding. As with many EU discussions, those negotiations had an element of political arbitrage. This limited the Commission’s options at the project appraisal stage, with the result that there were problems with the maturity of some of the projects it selected. It should be borne in mind, however, that a ‘drop-out’ rate of some kind is likely to be inevitable with this type of large infrastructure, and as discussed in the introduction of this section the 2004 revision was one means of dealing with this.
4. Impact on environment and socio-economic development:
Impacts on environment were specifically mentioned in the preliminary application form. The applicants had then to produce status of implementation of relevant environmental
50 A consequence of this redistribution is that 32% of the MIP projects reached an average absorption rate of 170%.
Ex-post / Final evaluation of the TEN-T MIP –Final Report – November 2007
83
legislation51. The preliminary application forms did not cover socio-economic impacts such as employment, so the Commission was not able to evaluate this as such. The evaluation of the project's socio-economic impact was thus mainly evaluated via the economic viability ratio. The shortcomings of this as an indicator and the implications of that are discussed in 2. above.
5. Financial needs:
Community aid had to be assigned to projects that were potentially economically viable and for which the financial profitability at the time of application was deemed insufficient as stipulated in article 6 of TEN Council Regulation52. The financial contributions of the MIP aimed at complementing insufficient state financing and pushing forward projects of common interest. Given that, in our sample, 26 projects of 50 would have been realised without the MIP (see section 5.2.4.5 on the Relevance of the need of EU financing), we can state that the financial needs of the beneficiaries were not so self-evident.
4) Detailed application form
The detailed application forms were used in order to complete the information collected by the Commission during the selection process (negotiation and preliminary application forms) and to enable the 2001 Framework Decision to be drawn up as the first AFD. After that, it was used for the selection process during the 2004 revision when preliminary applications forms were not used. As such it contains further information on the potential effects of the projects on issues such as traffic flows, multimodal plans, and employment, and requires much more detail on the financial dimensions of projects and monitoring tools. These forms evolved over time so that more and more detailed information was sought in order for the Commission to have solid base for the project appraisals.
Our review of the way in which these forms were filled out indicates that this was not homogenous, thus making it complex to analyse them and draw up the AFD. For instance, the activities listed and the cost breakdowns are sometimes mentioned as physical construction from point A to point B, or are sometimes more detailed by defining within the overall project what the MIP will actually support. Applicants did not use a shared activity nomenclature. As a consequence, the Commission faced problems in project follow-up. According to Commission officials’, this also created problems for them in dealing with payment requests because they were required to link specific expenditure to specific activity as defined in the AFD. Beneficiaries also complained about difficulty with this, as it did not take into account the complexity of this for them, which sometimes required time-consuming manual intervention or establishing special management systems in order to comply.
On the other hand, the detailed application form did not, in our view, give enough detail on the maturity of the projects. This criterion is crucial when selecting projects within a multi-year programme, but in practice 15% of the projects did not get off the ground and many projects ran more solely than foreseen (43% of the MIP projects absorbed in average 53% of the their awarded amount). The only undertaking sought in the detailed application form was the existence of formal political agreement to the project if the project was not yet under way.
51 Environmental impact according to Directive 85/337/EEC as amended by Directive 97/11; effects on “Natura 2000” sites according to Directives 79/409/EEC (“Birds Directive) and 92/43/EEC (“Habitats Directive”)
52 Council Regulation laying down general rules for the granting of Community financial aid in the field of trans-European networks (EC) No 2236/95

Ex-post / Final evaluation of the TEN-T MIP –Final Report – November 2007
84
In order to clarify the whole MIP process, the Commission published a TEN-T Handbook -A practical Guide for Users but only in 2004 in the context of the MIP revision.
As a general conclusion on selection procedures, we can state that the MIP selection process succeeded in selecting projects of common interest and was instrumental in advancing these projects. Of the projects in our sample, 20 are now in the construction phase or even (partly) in use (1253). This was helped by the fact that the Commission decide to optimise the MIP budget utilisation by withdrawing several projects during the 2004 revision and redistributing the available amount to projects with good performance and by selecting new projects.
Table 18: Project distribution by project phase (sample)
Project phase Number
Project Preparation 7
Detailed design of implementation 11
Construction 20
Use 12
Total 50
Moreover, it could be argued that the process lacked transparency in clearly demonstrating that the projects met the award and selection criteria, including the criterion on maturity. The failure to identify projects which were fully mature in all cases meant payment recovery procedures, AFD amendments and a MIP revision were needed, and this detracted from the efficiency of the selection process.
5.3.2.3. F O L L O W - U P P R O C E D U R E S
The Council Regulation54 requires that the Member States should verify that the projects and studies financed by the MIP are properly carried out and subject to effective monitoring in co-ordination with the Commission. The Project Status Report (PSR) is used as the main tool to monitor the progress of on-going projects55. The PSRs include data on the technical and financial progress of the implementation of the Annual Financial Decision (AFD) and must be submitted annually.
The Figure below presents the overall project follow-up process.
53 These projects are in use but the global projects of which they are part have yet to be completed. As a consequence, the full effects are not yet being felt.
54 Council Regulation laying down general rules for the granting of Community financial aid in the field of Trans-European networks. EC No 2236/95
55 If the activities that are foreseen in the AFD are completed during the year of reference, no PSRs are needed because they are used for on-going projects. In that case only a technical report is needed to accompany the payment request and serve as application for the subsequent year.

Ex-post / Final evaluation of the TEN-T MIP –Final Report – November 2007
85
Figure 16: Overall follow-up process
Monitoring tools such as the PSR are necessary to enforce transparency in European investment. In this section, we assess whether the PSR was effective and efficient in reporting project data to the Commission in order to have a clear view of the project reality.
The PSR does not match all these objectives: the system indeed allows reporting from the Member States to the European Commission, but we have noted several limitations that mean that the Commission does not have complete information for its own reporting and that slow the overall monitoring process down.
On the beneficiaries’ side:
1. The beneficiaries faced problems with the PSR because it changed several times (and requirements increased) during the programming period. These changes had an impact on the information systems set up by the beneficiaries. As a consequence beneficiaries usually waited to receive the PSR template before gathering the information;
2. As beneficiaries often receive the PSR late in the process (they should normally receive the PSR in March and send it back in June), the time they have to complete the PSR is shorter than foreseen and PSRs are sometimes sent in late;
3. The information cycle is different between the various information sources. Beneficiaries that, for instance, are dealing with Structural Funds, State funds and MIP funds have to gather different data and complete different monitoring templates;
4. Some Member States faced language issues and do not understand all PSR items. As a rule, translated documents (application forms, AFD's; etc.) reach beneficiaries late. As the MIP cofinances projects that are financially and technically very complex, the wording used is very specific to each Member State and each item in the Commission documents needs to be clearly explained;
5. As explained in the MIP planning section, projects had to comply as far as possible with the Annual Financial Decision (AFD) mechanism and thus to expend each year the money that was available. Only projects that can prove that they have spent 50% or more of the eligible costs may (partly) access funds under the next AFD. Projects that had not reached this minimum absorption rate when submitting the PSR had thus to wait for the next PSR. This could slow the overall project because activities that were due to be financed with the following AFD could not be carried out when needed.
On the Commission’s side:
1. The PSR does not give the Commission a clear overall view of the projects because it is mainly oriented towards compliance with the budget (e.g. invoices issued, payments made, cost breakdown review) and with EU legislation (e.g. on the environment and public
New annual financial decision
New annual financial decision
Annual FinancialDecision (AFD)
Annual FinancialDecision (AFD)
Payment request incl.
technical report
Payment request incl.
technical report
Project Status Report
Project Status Report
Studies or works
realisation
Studies or works
realisation
Overall follow-up processOverall follow-up process

Ex-post / Final evaluation of the TEN-T MIP –Final Report – November 2007
86
procurement). Moreover, the PSR only covers information on the MIP project and not the progress of the overall project of which the MIP project is generally only one section.
2. The current MIP template does not allow the Commission to consolidate the PSR data into the Commission Project Management System (PMS). Commission desk officers have thus to copy/paste data from the PSR into the PMS. This process is time-consuming and creates the potential for mistakes. Moreover, the PMS does not allow the Commission to have a clear view on overall project progress given the fact that it is organised by AFD and that there is no structural relationship between several AFD’s linked to the same project. In other words, the PMS does not allow the Commission to aggregate information from AFD’s at project level.
Consequently, the PSR does not satisfactorily allow effective and efficient project follow-up both for the Commission and for the beneficiaries.
As a remark on the overall Commission TEN-T monitoring process, we also underline the fact that the beneficiaries have to comply with several other project monitoring tools in addition to the PSR, such as for instance:
• Technical reports for the payment request;
• Regular financial compliance audits, including visits from the European Court of Auditors in some cases;
• Ex-ante and ex-post evaluations;
• TEN-T implementation reports from the Priority axis coordinators appointment in 2004;
• Field visits from the Commission.
These take much time for the beneficiaries and do not allow unique data collection, structured and established on a solid base of clear guidelines.
5.3.2.4. P A Y M E N T R E Q U E S T S
The closing of an annual decision should ideally be undertaken annually for MIP Annual Financial Decisions (AFD). In fact, several projects have two or even three open AFDs. Indeed, two (or potentially three) AFDs can be open for a project if a continuation of MIP aid for the next year is sought. Final reports and costs claims must be submitted within 6 months after expiry of the eligible period at the latest.
The documentation that the beneficiaries must send to the Commission includes:
• For studies: a technical executive summary;
• For works: a technical report on the activities carried out;
• An appraisal of the study, and
• A certified statement of expenditure by the government concerned.
The Commission verifies that all conditions have been fulfilled before finally closing the AFD and authorising the final payment. The Figure below presents this presents this process schematically.

Ex-post / Final evaluation of the TEN-T MIP –Final Report – November 2007
87
Figure 17: Annual Financial Decision closing
Generally, the payment procedure is not perceived as effective by the beneficiaries because they have to wait one year to receive the money and the level of detail of the expenditure is not adapted to the reality of huge projects.
Moreover, some beneficiaries deem that Commission requirements on linking invoice to completion of the job rather than payment is incompatible with domestic requirements and requirements of other EU programmes (Regional Fund), and this can pose major problems. This is also linked to the problem that the some beneficiaries have with linking payments to when the work was performed, not the invoice. As the Commission asks for samples of expenditures based on the statement of expenditure, it requires manual investigation to find the information on invoices on closed accounting years. National accounting systems are not always adapted for such a request. The Commission's approach is also incompatible with the common practice in the case of infrastructure projects of delaying invoicing until there is an overall picture of the project, including claims on the contractor.
On the Commission side, the process for closing a financial decision is complex and time-consuming because the list expenditure received has to be matched to the activities that are included in the AFD. As these activities do not follow a common nomenclature and are sometimes described in broad terms, the exercise is complex and leads to request for added information from the beneficiaries.
5.3.2.5. C O N C L U S I O N S
Several MIP management procedures are time consuming for both the Commission and the beneficiaries without clearly adding equivalent value. One of the main reasons is that the application forms and the AFD do not provide for a clear description of activities. This has consequences for project follow-up. Desk officers spend much more time in checking that invoices correspond to activities (i.e. they are obliged to be control-oriented) than to operational support for and gaining an understanding of the project (i.e. content-oriented).
Another important reason is changes (e.g. to templates, rules and timings) that constantly occurred during the programming period in the rules and the MIP tools (e.g. application forms, PSR, technical report accompanying the payment request). MIP Guidelines for users were available, but this was not updated to reflect these changes. This lack of coherent information increased the need for additional requests, resulted in ad hoc approach and decreased the possibility of getting an overall reporting document that would easily flow from the control and monitoring system. As a consequence, the transparency and the understanding of the system were not shared among the beneficiaries56.
56 The difficulties we faced in finding aggregated information and reporting quantitative information are more evidence of this.
AFD closingAFD closing
Check by the Commission
Check by the Commission PaymentPaymentEnd of the AFDEnd of the AFD Payment request incl.
technical reportPayment request incl.
technical report

Ex-post / Final evaluation of the TEN-T MIP –Final Report – November 2007
88
5 .3 .3 . INFLUENCE OF THE RECENT CHANGES ON THE OVERALL MIP MANAGEMENT
In 2004, the Commission decided to amend57 the MIP Framework Decision58 in the light of overall MIP progress and changes to the TEN-T Guidelines59 mainly due to the enlargement. The changes involved:
• New TEN-T guidelines;
• Specific environmental assessment of projects having significant effects on the environment;
• Withdrawing projects not started or delayed from the list of common interest projects;
• A requirement to perform a socio-economic and environment assessment five years after the project completion;
• Management requirements for cross border projects (joint venture with Member States from both side of the border);
• Rise in subsidies to 20% for cross border projects;
• More flexibility in the rule of a maximum of two AFDs per project.
In order to get information on the influence of these changes, we asked beneficiaries60 what the tangible results of the MIP revision were. The Figure below shows that the most important by far was the withdrawal of projects which had not started (because that enabled them to draw down more funds).
57 Decisions C(2004)3242 amending the Framework Decision establishing the Indicative Multiannual Programme for the granting of Community financial aid to projects of common interest in the area of the trans-European transport network for the period 2001 – 2006 C(2001) 2654/ final.
58 Framework Decision establishing the Indicative Multiannual Programme for the granting of Community financial aid to projects of common interest in the area of the trans-European transport network for the period 2001 – 2006 C(2001) 2654/ final.
59 Decision No 884/2004/EC of the European Parliament and the Council of 29 April 2004 amending Decision No 1692/96/EC on Community guidelines for the development of the trans-European transport network.
60 The Figure presents the opinion of the beneficiaries by project.

Ex-post / Final evaluation of the TEN-T MIP –Final Report – November 2007
89
Figure 18: Tangible results of the 2004 MIP revision
It should be noted that that many interviewees were not aware of a number of the other changes. The revision of the list of projects was very important to many because they received more money as a result. From the point of view of the Commission, this also allowed it to focus its attention on fewer projects. This appears to have increased effectiveness and efficiency.
Few beneficiaries deemed that the rise in subsidies up to 20% had had a significant impact on their project. There is one clear reason for this: many of the cross-border projects are still at the study stage (and are therefore eligible for 50% funding). One project which hoped to benefit could not because of what could be regarded as an anomaly in the rules: the PBKAL project is based on a political agreement by the relevant governments nearly two decades ago and is not underpinned by an international agreement or management company, but has proceeded on the basis of political will. This makes PBKAL projects, even those in border areas, ineligible for this higher level of funding.
It should be noted that very few realised that they have to realise a socio-economic and environmental assessment five years after project completion. They also raised questions about this, since the greatest impact is likely to come from the complete TEN-T project rather than individual MIP projects.
In addition, some respondents admitted that had they known that a revision was imminent in 2004, they would have managed their project differently. They could, for instance, have increased their absorption rate in the early years of the MIP, since the redistribution at the time of the revision was performance-related.
Overall, we can state that the changes in the MIP management decided by the Commission were not effectively communicated to the various beneficiaries. They often had to work out for themselves where there were changes and what the implications were in the AFD or in the various monitoring tools and deemed that the support from the EC was not enough. However, not all the responsibility for this can be laid at the EC’s door as we encountered instances during the interview process where there had been breakdowns in communication between the government and the project promoters.
Tangible results of the 2004 MIP revision
No opinion; 8
Specific environmental assessment of projects having significant effects
on the environment; 1
New TEN-T guidelines; 1
Withdrawing of not started projects from the list of
common interest projects; 22
No impact on the project; 10
More flexibility in the rule of maximum 2 AFDs per
project; 4
Rise in subsidies of 20% for cross border projects;
3
Management requirements for cross border projects;
0
Need to perform a socio-economic and environment assessment 5 years after the project completion; 0

Ex-post / Final evaluation of the TEN-T MIP –Final Report – November 2007
90
5 .3 .4 . PERFORMANCE COMPARISON BETWEEN MIP AND TEN-T ANNUAL CALLS
As the financial information relative to the TEN-T annual calls procedure was not available to us in a comprehensive way, we faced some difficulties in the analysis of the performance comparison between the MIP and annual calls. We did, however, have a look at both instruments from a process perspective, trying to identify specifically the advantage and disadvantages of each.
The main differences between MIP and non-MIP projects are:
• non MIP-projects are generally more closely defined and delimited in terms of time and cost than MIP projects61;
• the timeframe of the non-MIP decision is more flexible. There is no fixed eligible period for non-MIP decisions. In the MIP, activities are covered by an annual decision (AFD) and have to be realised according to the rule year + 1 or year + 2 if justified by the beneficiaries.
In terms of selection of the projects, the main benefit of the MIP process is that it makes it possible to avoid the annual submission of a detailed application form and the discussion on project selection at the meeting of the TEN-T FAC.
With the MIP, one applicant form has to be submitted when support is sought for the first time. On this basis, projects are selected and approved by the TEN-T FAC. In the following years, only PSRs are used to assess the progress of the projects and serve as a proxy for an application for the continuation of the Community aid. Nevertheless, new Annual Financial Decisions have to be adopted following the usual process (ISC)62 and the right of review of the European Parliament.
Under non-MIP, project promoters have to submit an application form each year they apply for Community aid and the selected projects have to be approved by the TEN-T FAC.
The MIP therefore has a faster and simpler procedure for both the Commission and Member States overall. Nevertheless, it also generates an indirect administrative burden:
• given the fact that the activities supported are identified and planned six years in advance, the risk of change is high. As a consequence, the Commission needed to amend some AFD's in the light of changes to the project over the period;
• for the same reason, the description of the activities is overall less clear and focused than in the annual-calls process. This generates extra work during the follow-up and verification of the payment requests. It difficult to clearly make the link between invoices and receipts, and a list of activities described in general terms;
• the fact that under the MIP, activities are divided into different years and that invoices must be submitted for activities on the basis of the year in which the activity has been carried out, when in practice contractors often do not submit invoices until completion of the project in a subsequent accounting year, and given than MIP projects are specifically described than non-MIP projects, can creates a major workload in the Member States when making the
61 The project can be supported over several years, but new applications are needed each time.
62 Interservice Consultation.

Ex-post / Final evaluation of the TEN-T MIP –Final Report – November 2007
91
payment request (sometimes two years after the activities were carried out) in order to identify items in closed accounting years. In many cases, this requires manual intervention which is time-consuming and increases the risk of error.
• given the fact that MIP AFD's are open for two years on average and that two AFD’s (more than two as from 2004) can be open simultaneously, the number of open decisions to be handled at the Commission increased steadily during the MIP programming period.
In conclusion, the MIP process generates time savings but also an indirect administrative burden for the Commission and Member States which to some extent cancels this out. It was clear from our interviews that the MIP process was seen as more burdensome than the non-MIP process.
The most recognised advantage of the MIP is the legal certainty of receiving Community aid on an annual basis during six years. Beneficiaries admit that this certainty effectively increases the foreseeability of the projects even if the foreseeability is not total, since, among other things, 63 the full amount is not guaranteed if a project performs below expectations. This foreseeability is consequently particularly welcome for large projects that are likely to generate regular costs over the six-year period.
Nevertheless, this foreseeability has an impact on the flexibility of the MIP compared to the TEN-T annual calls as a result of the fixed eligibility period, and the difficulty of changing the activities to be supported if the scope of the project changes.
In conclusion, we can say that MIP and TEN-T annual calls are complementary instruments and are suited to different types of project:
• projects that better fit the MIP are mature projects with a timeframe of several years;
• TEN-T annual calls are more adapted to short-term exploratory projects.
5 .3 .5 . OVERALL CONCLUSIONS
In the light of this detailed assessment, it is possible to draw conclusions on a number of issues relating to MIP management.
First of all, we can state that MIP management proved to be much more complex than initially foreseen. The purpose of a multi-year programme was to simplify a selection process which had previously been conducted annually, and to provide the same projects of common interest stability in their funding framework for the whole MIP period. In practice, this did not prevent the selection of projects which did not go ahead (43% of the MIP projects absorbed in average 53% of the their awarded amount and 15% of the selected projects did not start) and the number of AFDs open at any one time increased over the period, and the sheer number made management difficult.
In our opinion, projects of common interest that were likely to face delays for technical or political reasons did not fit well with the MIP process, while the MIP was created in order to accelerate realisation of the TEN-T projects. What did fit the MIP process were mature projects of high national interest as they were able to provide expenditures for payment on a regular basis without gaps in their planning processes.
63 We analyse the effectiveness of the MIP in terms of foreseeability within Theme C of the present report.

Ex-post / Final evaluation of the TEN-T MIP –Final Report – November 2007
92
In 2000, during the selection process, the Commission negotiated with the Member States in order to select the projects that would receive MIP grants over the six-year period. This preselection was then enshrined via the preliminary application process, on the basis of a form that summed up the main features and indicators of projects. On this basis the Commission officially made the final selection
We conclude that this process lacked transparency because the selection criteria and the indicators that would be used were not clearly illustrated in the application form. This led to problems for the Commission in providing effective follow up of the projects and in identifying whether they achieved their objectives. The budget absorption rate was the main criterion used in the Project Status Report in order to evaluate the progress of the project and not its actual progress.
As the MIP was a new tool, there were many changes in the rules and procedures of the MIP during the programming period, as the Commission sought to adapt the system to match on the one hand the Commission’s needs in terms of reporting and overall efficiency and effectiveness of the MIP as the main financial TEN-T tool, and on the other hand, the beneficiaries’ needs in terms of flexibility and foreseeability of MIP financing. As a consequence, the overall management lacked stability, and the way in which the process of change was managed, resulted in wasted time for both the Commission and the beneficiaries. A key problem was the fact that beneficiaries were not always provided with clear information about these changes. The communication from the Commission to the project managers via national governments could have been more effective.
As a European tool, the MIP could have had an added value in terms of transfer of management good practice to the beneficiaries. During our interviews within the Member States, some beneficiaries from small countries admitted that the MIP procedures were useful in improving their national management procedures. On the other hand, beneficiaries from large countries deemed that their national rules were the best and that the MIP did not positively impact them at all. Moreover, the fact that changes in the procedures that were not adequately communicated impacted negatively on the beneficiaries’ perception of the MIP management mechanisms. Nevertheless, on the whole, they felt positive about their relationship with the Commission and its staff.

Ex-post / Final evaluation of the TEN-T MIP –Final Report – November 2007
93
6 . C O N C L U S I O N S
This evaluation was designed to evaluate the Multiannual Indicative Programme (MIP) set up in the overall policy framework of the TEN-T, not the individual projects co-financed under the TEN-T framework. However, an understanding of the individual projects was vital to be able to form a view at aggregate level. Consequently, we devoted considerable time to interviewing stakeholders in the Member States, both government officials and project promoters, as well as stakeholders at EU level, notably European Commission officials, to understanding the projects and the context in which the MIP operated.
One of the key issues was to understand how the MIP was perceived relative to non-MIP funding. It was quite clear from our interview process that the foreseeability of the MIP was valued by the beneficiaries in the absolute. There were some aspects of the process which detracted from this foreseeability, but the principles of legal certainty and foreseeability were regarded overall as beneficial and contributing to the effectiveness of their investments. The fact that the FAC was involved only once, i.e. in relation to the initial Framework Decision, but not at the time of each subsequent Annual Financial Decision, was also positive.
A downside relating to foreseeability was the tendency only to put up mature projects for funding in order to be sure not to lose the MIP funding as a result of delays. While maturity was one of the selection criteria, this raises the issue of whether these projects would not have gone ahead anyway. It is clearly not possible to establish this definitively and not in the beneficiaries' interest to admit that this would have happened. However, many did go as far as to concede that the projects would have gone ahead, albeit rather more slowly and possibly without the latest technology in terms of traffic management and signalling, for example. The selection procedure also failed to some extent in picking the truly mature projects, as 15% dropped out at the 2004 revision and 43% did not absorbed the support foreseen in the framework decision.
Since the sums of money required for the TEN-T projects in their entirety are very large, the mature projects tended (albeit called projects in this context) to be segments of the overall Priority Projects, and to be those where there was a high national commitment, or where the national commitment and EU interest coincided - at the expense of those where the EU interest was paramount. This was particularly true of investment projects. The MIP did clearly play a significant role in funding studies, particularly for cross-border studies and risk mitigation.
The MIP was also an important catalyst in releasing national public funds. It is likely, though difficult to substantiate, that annual funding would not have achieved the same result. The MIP funding was also felt by a number of beneficiaries to have heightened the visibility of the EU vis-à-vis public opinion, and the fact of EU support was felt to have had a positive influence on local authorities in obtaining permits because they perceived it as prestigious to have a project receiving EU funding. Beneficiaries in a number of countries said that the fact that they were eligible for MIP funding meant that they had escaped budget cuts when other infrastructure projects were hit, either because of the risk of losing the MIP funding and/or because it was felt to be important for the country's image within the EU not to delay a MIP-funded (and by association a TEN-T) project.
It tends to be a characteristic of large infrastructure projects that they are susceptible to technical, environmental and political delays, and that planning over a six-year horizon cannot hold good for the whole period without revision. The projects funded by the MIP were no exception, and in that respect the 2004 revision proved a good opportunity to redistribute funds to take delays in deployment or project changes into account. On the other hand, the procedures for obtaining an amendment to an Annual Financial Decision in the course of the year if there were unforeseen problems (or unexpected progress was made) were felt to be overly complex.

Ex-post / Final evaluation of the TEN-T MIP –Final Report – November 2007
94
The possibility of having more than two annual financial decisions open at one time was also felt to be positive as a result of the 2004 Guideline revisions. However, it was clear in a number of countries that beneficiaries (and their governments) had not realised the existence of or the implications of some of the new rules. There appears in some instances to have been a breakdown in communication between the Commission and Member States in raising awareness of these changes.
The benefits of foreseeability were to some extent undermined by the fact that there was never 100% certainty that the full amount sought would be awarded in the annual financial decision, or about the time that would be taken to approve the annual financial decision and the timing of payments. This did not lead beneficiaries to hold up MIP projects, but meant that they had to provide working capital in the interim, creating uncertainty for other projects in their investment pipeline.
While no beneficiaries would have wanted to be without the MIP funding, many felt that the 'cost' in terms of procedure - and despite the benefits of foreseeability - was excessively high relative to the amounts of money involved. There are examples of beneficiaries who had aligned their own management systems on the Commission's, or who felt that their own monitoring procedures or evaluation culture had benefited from the example set by the MIP and Commission processes, but on the whole the amount of red tape involved was felt to be excessive and, in some ways, counter-productive, as it meant European Commission staff were too busy with checks and controls “to see the wood for the trees”, i.e. to have a broad understanding of the projects and the specific problems of infrastructure projects, and to develop specialist expertise, or collate and disseminate information on best practice, e.g. on public-private partnerships.
It was not only the amount of form-filling which irked beneficiaries, but the number of changes and the increase in the amount of documentation required over the life of the MIP. To beneficiaries, some of the changes appeared to be of form rather than substance to no good purpose. It was often felt that changes were inadequately communicated, that there was a lack of clarity in definitions and terminology, that there were no standardised indicators for measuring results, and that there was too widespread an assumption that English is an acceptable lingua franca. (Documents such as the vademecum were also published in French and German, but very late in relation to the time at which they were needed.)
The preliminary application form as it existed for the 2001-2006 MIP does not appear to have been optimally fit for purpose, in terms of enabling Commission officials to make a sound appraisal of a project in a pre-selection phase, but we accept the view of those who felt that the concept of an initial stage requiring less-than-full documentation was sound if the form had been properly designed. This same form could also then be used if an amending decision to the annual financing decision were needed in the course of the year because of significant changes to the project scope or cost. During the 2001-2006 MIP a full application form had to be filled out for this.
The increasing amount of information required in the PSR was also felt to be unnecessary, while we at the same time formed the view that the PSR as currently structured was not suited to providing an overview of the project that would allow desk officers adequately to make the necessary compliance checks. So less volume and a more adapted form would be welcome.
The fact that the Structural Funds and the MIP have different financial regulations, and different rules, in particular, on the link between commitments, invoices and payments by the Commission was deplored in a number of instances.
Evaluating the impact of the programme as a whole even over a period of six years, has considerable limitations. Of the 50 projects we studied, only 12 are operational, and in many cases, the 'project' as funded by the MIP is only a segment of a TEN-T project, i.e. a stretch of railway line or road, and/or full operation at maximum speed for a high-speed train is dependent on upgrades

Ex-post / Final evaluation of the TEN-T MIP –Final Report – November 2007
95
still to come of signalling, or the availability of the rolling stock. Large infrastructure projects generally take fifteen years to come to fruition.
During the MIP programming period 2000-2006, political agreements were reached between several countries. Many cross-border links are now in the project phase or even in the implementation phase. We envisage that major cross border links will produce major impacts on the European network in the horizon of 2010-2015
However, we have every reason to suppose on the basis of our analysis that the impact of the MIP was commensurate with what could reasonably have been expected over the period, particularly as the 2004 Guideline revision provided flexibility to deal with the unavoidable unforeseen events for this type of project.
The MIP also supported the objectives of the TEN-T guidelines, particularly close of removing bottlenecks and filling missing links. The MIP served only, in very isolated instances, on the other hand, as a stimulus to consideration of PPP financing.
On the one hand, rail projects tend to be inherently less attractive for PPP projects because of the long time frames and the frequency with which such projects overrun their timetables and costs. On the other hand, the availability of the MIP had a crowding-out effect; as it reduced the incentive to look for alternative means of financing. It should also be noted that many national governments do not yet believe in the benefits of PPP financing, so that it would be difficult for the MIP as such to change this in the context of a limited number of projects since an overarching political decision of principle (followed by adoption of a suitable overall regulatory framework) is generally a prerequisite.
The fact that the MIP supported TEN-T rail projects in broadly the same proportion as their importance to the TEN-T reinforced the importance attached within TEN-T to environmentally friendly transport modes.
The existence of the MIP also gave the Commission leverage to ensure that the most advanced systems of traffic management were used and that interoperability was promoted. The MIP also fulfilled its objectives of supporting projects characterised by their particularly high cost, large scale and - to a lesser extent - their cross-border nature. Cross-border projects often involve more complex geography and geology, as well as the need for intergovernmental agreements, so that the fact that several of these are taking longer to get off the ground cannot be explained by the availability or otherwise of MIP funding. At the same, our financial analysis showed that the large-scale projects tended to have a higher propensity to absorb MIP money, suggesting that the MIP was particularly suited for this purpose.

Ex-post / Final evaluation of the TEN-T MIP –Final Report – November 2007
96
7 . R E C O M M E N D A T I O N S
This evaluation work was focused on the programming period 2001-2006. The recommendations are therefore formulated regarding former MIP procedures. Consequently, new Multiannual Programme (MAP) for 2007-2013 already takes into account some of the following recommendations.
1. We recommend that the selection of projects for MIP funding be based on a clear hierarchy of selection criteria64 rather than a range of criteria which are implicitly considered to be of equal merit.
3. In order to reduce the extent to which the MIP funds mature projects with which Member State governments would have proceeded irrespective of the availability of MIP funding, and
in order to encourage the funding of cross-border projects,
we recommend that:
• the primary objective be to fund projects of high European interest which will fill missing links or eliminate bottlenecks;
• in the light of the above, the TEN-T coordinators be asked to define which are the projects of high European interest and low national commitment65;
• the rate at which studies for projects of high European interest and low national commitment is funded be increased66;
• the rates at which investment projects are funded be modified, with projects of high European interest and low national commitment being eligible for grants of 30%67 and other projects be restricted to grants of 5% of total eligible cost. We believe that the lower rate will still be enough to give the Commission leverage in encouraging projects which are both of high national commitment and high European interest, and encouraging investment in modern traffic management systems.
5. We recommend that TEN-T coordinators be required in their analysis of the progress of projects to report on the extent to which progress will in part or totally be negated by the absence of or delays in crucial flanking activity, such as interoperable signalling or the necessary rolling stock in order to facilitate the task for the European Commission when arbitrating between project applications which otherwise have equal merit.
64 We refer here to the selection criteria listed in Article 5 of the Regulation of the European Parliament and of the Council laying down general rules for the granting of Community financial aid in the field of the trans-European transport and energy networks.
65 Strategic Evaluation on Transport Investment Priorities under Structural and Cohesion Funds for the programming - Period 2007-2013, DG REGIO provides a number of guiding principles that could also be used to identify these projects.
66 Presently 50% according to Art. 6 2. of the Regulation
67 According to Art. 6 2. of the Regulation

Ex-post / Final evaluation of the TEN-T MIP –Final Report – November 2007
97
6. We recommend that:
• projects at the EU's external borders be eligible for MIP funding on the EU side of the border, where a cross-border agreement is in place on proceeding in tandem with studies and investment on both sides of the border.
• studies be eligible for funding only from the detailed design of the implementation stage onwards since studies for early-stage projects are not suitable for inclusion in a multi-annual programme.
7. We recommend that encouragement of public-private partnerships (PPP) continue to be an objective, and that:
• the European Commission collect and disseminate in a structured manner information on best practice in transport PPP68 but also information on other tools and products in order to facilitate access to private financing sources such as the EIB loan guarantee and risk capital facility
• the financing rate be increased for any project financed by a PPP.
8. We recommend that a revision of the MAP framework Decision in order to redistribute funds likely to be under-utilised should be automatic after four years, and that any subsequent revision towards the end of the funding period be announced six months in advance69.
9. We recommend that the Commission further refine its work on the definition of concepts, both generic, (such as 'project' and 'project part') and technical, drawing up a glossary of terminology in all EU languages, which should be used at all times for all documents, including those core documents produced only in English, French and German.
10. We recommend that activities be described in all documents, including applications from the Member States, on the basis of a standard nomenclature, such as the International Standard Industrial Classification (ISIC) codes, developed further as required (e.g. for studies).
11. We recommend that the Commission consider and discuss with Member States whether a system whereby Member States could choose between annual and biannual instalments would be desirable and feasible in order to provide greater flexibility and be better adapted to the range of planning processes which exists across the EU.
12. We recommend that the initial Framework Decision be flanked by an individual Financial Decision in order to make a clear distinction between documents containing a general description of activities and those containing specific descriptions which are used to trigger payments. We believe that the extra work involved initially will be more than outweighed by the benefits of greater clarity.
13. We recommend that the application form be redesigned in order to require the inclusion from the outset of information, based where possible on indicators, on the need for the project and for the project finance, the objectives and the anticipated impact in socio-economic terms, in order to form the basis of ex post evaluation of the outcomes. This redesign should be based
68 In this dissemination work, Commission could take advantage of the know-how of the European PPP Centre.
69 New Regulation already foresees a revision at mid-term in its Article 8.
Ex-post / Final evaluation of the TEN-T MIP –Final Report – November 2007
98
on existing initiatives such as the HEATCO report70 and/or the indicative guideline on evaluation methods published by DG REGIO for programming period 2007-201371. This redesign should be carried out in such a way that the time taken to fill it out is no greater than in the past.
14. We recommend that the same principles as we recommend for the application form also be applied to the project appraisal form.
15. We recommend that the European Commission work with Member States on a core set of standardised definitions for indicators, including net present value, cost-benefit analysis and internal rate of return. We suggest to apply the methodologies presented in the HEATCO report or other initiatives such as Railpag72 and the Guidance on the methodology for carrying out cost-benefit analysis of DG REGIO for programming period 2007-2013. We recognise the difficulty of such an exercise and recommend, therefore, than in the meantime, Member States be required as a minimum to provide information about the basis of any figures they provide on which expectations of financial or economic viability are based, and to provide a detailed justification if they are not able to provide at least one of these figures.
16. We recommend that the Project Status Report be redesigned to include information on other sources of funding at project level (and not only at project part level) in order to enable the Commission to have a better overview of the project context.
17. We recommend that the European Commission develop web-based forms for use by the Member States, notably in relation to the Project Status Report, and for use by its own staff, e.g. for mission reports, which can then be uploaded automatically into the Commission's Project Management System (PMS).
18. We recommend that the PMS be upgraded to make it possible to upload web-based forms and other documents without manual intervention and so that information from the financial decisions can be aggregated by project.
19. We recommend that all changes in forms and procedures, and changes in Guidelines, be clearly communicated to Member States and project promoters, i.e. there should be separate communications spelling out the changes individually.
20. In the belief that the changes recommended above will save time for desk officers, who are obliged to be control-oriented under the current system, we recommend that the Commission not reallocate that time to other areas, but consider it a priority that desk officers from the TEN-T Agency devote that time (via desk research and site visits), to deepening their understanding of individual projects and the broader picture into which those projects fit, in the interests of improving project selection and dialogue with Member States and project promoters.
70 HEATCO, DG TREN Initiatives in order to develop Harmonised European Approaches for Transport Costing and Project Assessment. 71 We refer here more particularly to Working Document No. 2 Monitoring and Evaluation indicators
72 Joint EC-EIB initiative in order to harmonised procedures for rail project appraisal and suggests best practices for applying cost-benefit analysis to rail projects

Ex-post / Final evaluation of the TEN-T MIP –Final Report – November 2007
99
21. We recommend that, whatever system is put in place for the funding period beginning in 2014, the definition of strategic orientation and planning be launched in 2012 in order to avoid the one-year funding gap that occurred in 2000 and 2007.

Ex-post / Final evaluation of the TEN-T MIP –Final Report – November 2007
100
8 . A N N E X E S
8.1. Annex 1 – List of interviewees
8.2. Annex 2 – Interview guides
8.3. Annex 3 – Structure of the database developed during the evaluation study
8.4. Annex 4 – Bibliography
8.5. Annex 5 – Individual project results (projects database)
8.6. Annex 6 – Background information on European transport