ewa balcerowicz, leszek balcerowicz, iraj hashi (eds.) balcerowicz, leszek balcerowicz, iraj hashi...
TRANSCRIPT
E w a B a l c e r o w i c z , L e s z e k B a l c e r o w i c z ,I r a j H a s h i ( e d s . )
WW aa rr ss aa ww ,, 11 99 99 88 NNoo 1144
Barriers to Entry and Growth of Private
Companies in Poland, the Czech Republic,
Hungary, Albania and Lithuania
The views and opinions expressed in this publication reflectAuthors’ point of view and not necessarily those of CASE.
This report was prepared within the research projecttitled: 'The Impact of Barriers to Entry on the Speed ofTransition: A Comparative Study of Countries in DifferentStages of Transition', co-ordinated by Professor Leszek Bal-cerowicz. The research was undertaken with support fromthe European Commission's Phare ACE Programme 1995.
Editors would like to thank Maciej Sobolewski for hisinvaluable assistance with a preparation of this report.
Proof reading – Katarzyna Trzaska
DTP: CeDeWu – Centrum Doradztwa i Wydawnictw”Multi-Press” Sp. z o.o.
Graphic Design – Agnieszka Natalia Bury
© CASE – Center for Social and Economic Research, Warsaw 1998
All rights reserved. No part of this publication may bereproduced, stored in a retrieval system, or transmitted in anyform or by any means, without prior permission in writingfrom the author and the CASE Foundation.
ISSN 1506-1647 ISBN 83-7178-089-3
Publisher:CASE – Center for Social and Economic Research 00-585 Warsawul. Bagatela 14
e-mail: [email protected]://www.case.com.pl
3
Barriers to Entry ...
CASE Reports No. 14
Contents
Introduction . . . . . . . . . . . . . . . . . . . . . . . . . . . . . . . . . . . . . . . . . . . . . . . . . . . . . . . . . . . . . . . . . . . . .7
Part I. Constraints to Entry and Development of New Firms in Transition Economies and the Role ofGovernment - Ewa Balcerowicz, Leszek Balcerowicz and Iraj Hashi . . . . . . . . . . . . . . . . . . . . . . . . . . . .8
1. Introduction . . . . . . . . . . . . . . . . . . . . . . . . . . . . . . . . . . . . . . . . . . . . . . . . . . . . . . . . . . . . . . . . . . . . . . . . .8
2. Government and Transition . . . . . . . . . . . . . . . . . . . . . . . . . . . . . . . . . . . . . . . . . . . . . . . . . . . . . . . . . . . . .10
3. A Framework for the Analysis of Barriers to Entry . . . . . . . . . . . . . . . . . . . . . . . . . . . . . . . . . . . . . . . . . . . .13
4. New Firm Entries . . . . . . . . . . . . . . . . . . . . . . . . . . . . . . . . . . . . . . . . . . . . . . . . . . . . . . . . . . . . . . . . . . . .13
Part II. Barriers to Entry and Growth of New Firms: Results of the Enterprise Survey . . . . . . . . . . .16
5. The Survey Sample - Iraj Hashi and Jan Mladek . . . . . . . . . . . . . . . . . . . . . . . . . . . . . . . . . . . . . . . . . . . . . .16
6. Barriers to Entry and Growth of New Firms in Poland - Ewa Balcerowicz . . . . . . . . . . . . . . . . . . . . . . . . . .196.1. Introduction . . . . . . . . . . . . . . . . . . . . . . . . . . . . . . . . . . . . . . . . . . . . . . . . . . . . . . . . . . . . . . . . . .196.2. Regulatory Constraints . . . . . . . . . . . . . . . . . . . . . . . . . . . . . . . . . . . . . . . . . . . . . . . . . . . . . . . . . .20
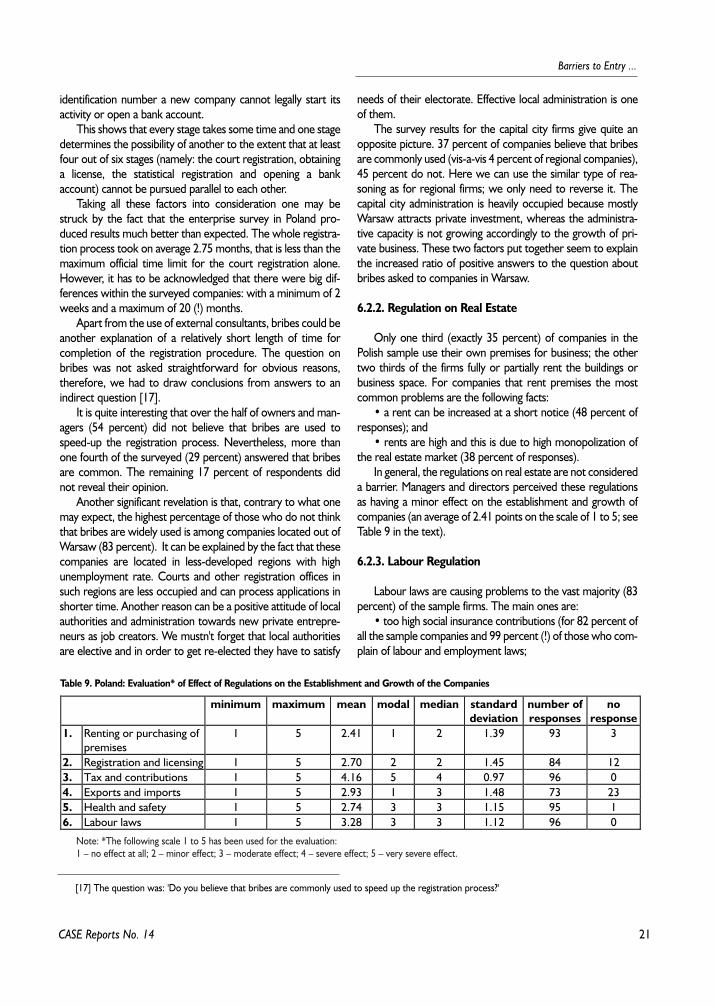
6.2.1. Registration and Licensing . . . . . . . . . . . . . . . . . . . . . . . . . . . . . . . . . . . . . . . . . . . . . . . . .206.2.2. Regulation on Real Estate . . . . . . . . . . . . . . . . . . . . . . . . . . . . . . . . . . . . . . . . . . . . . . . . . .216.2.3. Labour Regulations . . . . . . . . . . . . . . . . . . . . . . . . . . . . . . . . . . . . . . . . . . . . . . . . . . . . . .216.2.4. Regulation on Taxes and other Contributions . . . . . . . . . . . . . . . . . . . . . . . . . . . . . . . . . . .22
6.3. Support for the SME Sector . . . . . . . . . . . . . . . . . . . . . . . . . . . . . . . . . . . . . . . . . . . . . . . . . . . . . . .226.4. Financial Constraints . . . . . . . . . . . . . . . . . . . . . . . . . . . . . . . . . . . . . . . . . . . . . . . . . . . . . . . . . . . .226.5. What Hinders the Growth of a Company? . . . . . . . . . . . . . . . . . . . . . . . . . . . . . . . . . . . . . . . . . . . .246.6. Environment and Competitive Conditions . . . . . . . . . . . . . . . . . . . . . . . . . . . . . . . . . . . . . . . . . . . .246.7. Foreign Companies . . . . . . . . . . . . . . . . . . . . . . . . . . . . . . . . . . . . . . . . . . . . . . . . . . . . . . . . . . . . .256.8. Conclusions . . . . . . . . . . . . . . . . . . . . . . . . . . . . . . . . . . . . . . . . . . . . . . . . . . . . . . . . . . . . . . . . . . .27
7. Barriers to Entry and Growth of New Firms in Hungary - Miklos Szanyi . . . . . . . . . . . . . . . . . . . . . . . . . . . .277.1. Introduction . . . . . . . . . . . . . . . . . . . . . . . . . . . . . . . . . . . . . . . . . . . . . . . . . . . . . . . . . . . . . . . . . .277.2. Regulatory Barriers to Entry . . . . . . . . . . . . . . . . . . . . . . . . . . . . . . . . . . . . . . . . . . . . . . . . . . . . . .287.3. Support for Small Business . . . . . . . . . . . . . . . . . . . . . . . . . . . . . . . . . . . . . . . . . . . . . . . . . . . . . . .307.4. Financial Constraints . . . . . . . . . . . . . . . . . . . . . . . . . . . . . . . . . . . . . . . . . . . . . . . . . . . . . . . . . . . .307.5. Company Growth . . . . . . . . . . . . . . . . . . . . . . . . . . . . . . . . . . . . . . . . . . . . . . . . . . . . . . . . . . . . . .327.6. Environment and Competitive Conditions . . . . . . . . . . . . . . . . . . . . . . . . . . . . . . . . . . . . . . . . . . . .347.7. Foreign Companies . . . . . . . . . . . . . . . . . . . . . . . . . . . . . . . . . . . . . . . . . . . . . . . . . . . . . . . . . . . . .357.8. Conclusions . . . . . . . . . . . . . . . . . . . . . . . . . . . . . . . . . . . . . . . . . . . . . . . . . . . . . . . . . . . . . . . . . . .36
4
Ewa Balcerowicz, Leszek Balcerowicz and Iraj Hashi
8. Barriers to Entry and Development of Czech New Private Firms - Jan Mladek . . . . . . . . . . . . . . . . . . . . . .368.1. Introduction . . . . . . . . . . . . . . . . . . . . . . . . . . . . . . . . . . . . . . . . . . . . . . . . . . . . . . . . . . . . . . . . . .368.2. Impediments to Creation of Firms . . . . . . . . . . . . . . . . . . . . . . . . . . . . . . . . . . . . . . . . . . . . . . . . . .378.3. Assistance to the SME Sector . . . . . . . . . . . . . . . . . . . . . . . . . . . . . . . . . . . . . . . . . . . . . . . . . . . . .398.4. Finance . . . . . . . . . . . . . . . . . . . . . . . . . . . . . . . . . . . . . . . . . . . . . . . . . . . . . . . . . . . . . . . . . . . . . .398.5. Company Growth . . . . . . . . . . . . . . . . . . . . . . . . . . . . . . . . . . . . . . . . . . . . . . . . . . . . . . . . . . . . . .408.6. Environment and Competitive Conditions . . . . . . . . . . . . . . . . . . . . . . . . . . . . . . . . . . . . . . . . . . . .418.7. Conclusions . . . . . . . . . . . . . . . . . . . . . . . . . . . . . . . . . . . . . . . . . . . . . . . . . . . . . . . . . . . . . . . . . . .42
9. Barriers to Entry and Growth of New Firms in Albania - Lindita Xhillari . . . . . . . . . . . . . . . . . . . . . . . . . . .429.1. Introduction . . . . . . . . . . . . . . . . . . . . . . . . . . . . . . . . . . . . . . . . . . . . . . . . . . . . . . . . . . . . . . . . . .429.2. Regulatory Constraints . . . . . . . . . . . . . . . . . . . . . . . . . . . . . . . . . . . . . . . . . . . . . . . . . . . . . . . . . .439.3. Support for the SME Sector . . . . . . . . . . . . . . . . . . . . . . . . . . . . . . . . . . . . . . . . . . . . . . . . . . . . . . .459.4. Financial Constraints . . . . . . . . . . . . . . . . . . . . . . . . . . . . . . . . . . . . . . . . . . . . . . . . . . . . . . . . . . . .459.5. Growth of a Private Firm . . . . . . . . . . . . . . . . . . . . . . . . . . . . . . . . . . . . . . . . . . . . . . . . . . . . . . . .489.6. Environment and Competitive Conditions . . . . . . . . . . . . . . . . . . . . . . . . . . . . . . . . . . . . . . . . . . . .499.7. Foreign Companies . . . . . . . . . . . . . . . . . . . . . . . . . . . . . . . . . . . . . . . . . . . . . . . . . . . . . . . . . . . . .509.8. Conclusions . . . . . . . . . . . . . . . . . . . . . . . . . . . . . . . . . . . . . . . . . . . . . . . . . . . . . . . . . . . . . . . . . . .50
10. Barriers to Entry and Growth of Private Companies in Lithuania - Giedyminas Rainys . . . . . . . . . . . . . . . .5210.1. Regulatory Constraints . . . . . . . . . . . . . . . . . . . . . . . . . . . . . . . . . . . . . . . . . . . . . . . . . . . . . . . . .5210.2. Assistance for New Business . . . . . . . . . . . . . . . . . . . . . . . . . . . . . . . . . . . . . . . . . . . . . . . . . . . . .5310.3. Financial Constraints . . . . . . . . . . . . . . . . . . . . . . . . . . . . . . . . . . . . . . . . . . . . . . . . . . . . . . . . . . .5310.4. What Hinders the Growth of a Company? . . . . . . . . . . . . . . . . . . . . . . . . . . . . . . . . . . . . . . . . . . .5510.5. Environment and Competitive Conditions . . . . . . . . . . . . . . . . . . . . . . . . . . . . . . . . . . . . . . . . . . .5710.6. Foreign Companies . . . . . . . . . . . . . . . . . . . . . . . . . . . . . . . . . . . . . . . . . . . . . . . . . . . . . . . . . . . .5810.7. Conclusions . . . . . . . . . . . . . . . . . . . . . . . . . . . . . . . . . . . . . . . . . . . . . . . . . . . . . . . . . . . . . . . . . .59
11. Conclusions and Policy Recommendation - Leszek Balcerowicz and Iraj Hashi . . . . . . . . . . . . . . . . . . . . . .59
References . . . . . . . . . . . . . . . . . . . . . . . . . . . . . . . . . . . . . . . . . . . . . . . . . . . . . . . . . . . . . . . . . . . . . . . . . .61
List of Tables . . . . . . . . . . . . . . . . . . . . . . . . . . . . . . . . . . . . . . . . . . . . . . . . . . . . . . . . . . . . . . . . . . . . . . . . . .62List of Figures . . . . . . . . . . . . . . . . . . . . . . . . . . . . . . . . . . . . . . . . . . . . . . . . . . . . . . . . . . . . . . . . . . . . . . . . .63
CASE Reports No. 14
5
Barriers to Entry ...
CASE Reports No. 14
Ewa Balcerowicz
The author is a Ph.D. in economics. She is a co-founder and the Vice-President of CASE – the Center for Social andEconomic Research in Warsaw, Poland. She has been involved in research on Poland, other transition economies and Indus-trial Organization. She is a co-author of Enterprise Exit Processes in Transition Economies (L.Balcerowicz, Ch.Gray andI.Hoshi eds.).
Leszek Balcerowicz
The author is a Professor of economics at the Warsaw School of Economics and the Chairman of the Council of CASE– the Center for Social and Economic Research. He has written a number of books and numerous articles on comparativeeconomic systems, innovation and transition.
He held the post of the Poland's Deputy Prime Minister and the Minister of Finance in the first non-communist gov-ernment (1989–1991) and has been back in the Polish government at the same positions since November 1997. Since 1995he has been the leader of a Polish political party – the Union of Freedom
Iraj Hashi
The author is a Reader in economics at the Staffordhire University, Stoke-on-Trent (UK). He has been involved inresearch projects on privatization, corporate governance, enterprise restructuring and bankruptcies in Central and EastEuropean countries. Results of the projects were published in journals in the UK, the USA, the Czech Republic and Slova-kia. He is also a co-author and co-editor of Enterprise Exit Processes in Transition Economies (with Leszek Balcerowicz andCheryl Gray).
Jan MladekThe author held the position of the Deputy Minister of Economy in the Czechoslovak government in 1991–1992 and
was an advisor to the Minister of Industry and to the Minister of Industry and Trade of the Czech Republic in 1992–1995.He has been responsible for economic policy and EU accession since August 1998 and is a member of the Czech teamnegotiating with EU Commission.
Since 1992 he has been active in research on systemic issues of economic transition in Central and Eastern Europe. Hehas carried out an extensive research on issues of privatization, corporate governance and bankruptcy in the Czech Repub-lic and other Central European economies. His contributions were published in Czech leading economic journals as well asin Great Britain, Germany, USA. He was the founder and director of the Czech Institute of Applied Economics in Prague(NGO).
6
Ewa Balcerowicz, Leszek Balcerowicz and Iraj Hashi
Gediminas Rainys
The author was a co-founder of the Lithuanian NGO: the Economic Research Centre in Vilnus, Lithuania. He has beeninvolved both in economic research on transition economies and consultancy to the Lithuanian government.
Miklos Szanyi
The author is a senior research fellow at the Institute of Economics of the Hungarian Academy of Sciences and an asso-ciate professor of economics at the Budapest University of Economics. He has been active in the research of microeco-nomic issues of transition in Central and Eastern Europe since 1989. He has carried out an extensive, partly empiricalresearch, on the issues of privatization, foreign direct investment, corporate adjustment and bankruptcy in Hungary andother Central European economies. His contributions have been published in leading Hungarian economic journals. He hasalso published in English. He is a co-author of several books.
Lindita Xhillari
The author is a Ph.D. in economics and a Professor of international finance at the Economic Faculty of the Tirana Uni-versity. In the years 1993–1998 she worked at the National Agency for Privatization as the Head of the Large-scale Priva-tization and as the General Director. She has been active in economic research and has written and co-written numerousarticles on transition problems of the Albanian economy.
CASE Reports No. 14
7
Barriers to Entry ...
CASE Reports No. 14
Free 'Entry' and free 'Exit' are fundamental mechanismsof the competitive market economy operation. Free entryensures that potential entrepreneurs will take advantage ofprofitable opportunities and enter profitable segments ofthe market, increasing competitive pressure on the incum-bent firms, lowering output prices and improving the over-all allocation of resources. Both free entry and free exitguarantee that more efficient firms and those producing inaccordance with the market demand, survive and prosperwhile inefficient units and those whose production is notgeared to the market will contract and eventually embarkon exit. Barriers to entry and exit influence the develop-ment of competitive conditions in established marketeconomies, however, for economies in transition the free-dom of entry and exit has an even more significant dimen-sion. The reason for that are particular 'initial conditions'which the economies inherited from their communist past:massive distortions of the economic structure, highlymonopolistic and oligopolistic markets, and a large averagefirm size. With a collapse of the old regime, transformationof the old economic structure had to take place through theentry of new, market-oriented firms particularly in theundeveloped sectors of the economy and the exit of ineffi-cient and uncompetitive enterprises especially from theover-grown industrial sector.
This report presents some outputs of the research pro-ject 'The Impact of Barriers to Entry on the Speed of Tran-sition: A Comparative Study of Countries in Different Stagesof Transition' (PHARE ACE project No. P95-2047-R), co-ordinated by Leszek Balcerowicz and done by an interna-tional team which included: Ewa Balcerowicz (Poland),Andrzej Bratkowski, (Poland); Irena Grosfeld (France); IrajHashi (U.K); Jan Mladek (the Czech Republic); GediminasRainys (Lithuania); Jacek Rostowski (Hungary); Miklos Szanyi(Hungary); and Lindita Xhillari (Albania). The main aim ofthe project was to investigate nature and impact of barriersto entry in five countries at different stages of transitionwith various development backgrounds and traditions. Thestudy has been based on the experience of new firms inPoland, Hungary, the Czech Republic, Lithuania and Albania
– the first three having reached an advanced stage of transi-tion and the latter two having embarked on the transitionprocess later, thus lagging behind the front-runners. Thestudy has focussed on the legal, fiscal and institutional fac-tors which impede new entries and slow down the expan-sion of new firms in each country.
The report consists of two parts. In Part I, Chapter 2 wediscuss the interaction between the government's regulato-ry activity and the entry of new firms into the formal orinformal sectors of the economy. Here we highlight thenecessity of this important function of the government aswell as its undesirable implications such as rent seeking andcorruption. In Chapter 3 we consider a framework for theanalysis of barriers to entry and growth of new firms, high-lighting the main constraints to entry and growth consid-ered by this report. Chapter 4 is devoted to the review ofan actual pattern of new firms' entry in the early transitionperiod in the five countries under consideration. Part IIreports on the results of our enterprise survey; it is adetailed study of 400 firms in five transition economies.Here we first discuss (Chapter 5) the composition of thesample on which the study is based and then (Chapters6,7,8,9 and 10) summarize main findings of the study interms of the relative importance of different barriers facingnew firms in each country. Chapter 11 discusses the mainpolicy recommendations of this study.
Abstract
8
Ewa Balcerowicz, Leszek Balcerowicz and Iraj Hashi
CASE Reports No. 14
1. Introduction
The main aim of the present study is to investigate thenature and impact of barriers to entry in five countries at dif-ferent stages of transition with differing development back-grounds and traditions. The study is based on the experienceof new firms in Poland, Hungary, the Czech Republic, Lithuaniaand Albania – the first three having reached an advanced stageof transition and the latter two having embarked on the transi-tion process later thus lagging behind the front-runners. Thestudy focuses on the legal, fiscal and institutional factors, whichimpede new entries and slow down the expansion of newfirms in each country. This report presents some outputs of theresearch project 'The Impact of Barriers to Entry on the Speedof Transition: A Comparative Study of Countries in DifferentStages of Transition' (PHARE ACE project No. P95-2047-R).The research was co-ordinated by Leszek Balcerowicz anddone by the international team, which included the followingpartners and associates: Ewa Balcerowicz, Center for Socialand Economic Research – CASE Foundation, Poland; AndrzejBratkowski, Center for Social and Economic Research – CASEFoundation and Bank Handlowy, Poland; Irena Grosfeld,DELTA, France; Iraj Hashi, Staffordshire University, U.K.; JanMladek, The Czech Institute of Applied Economics, The CzechRepublic; Gediminas Rainys, Economic Research Centre,Lithuania; Jacek Rostowski, Central European University, Hun-gary; Miklos Szanyi, Institute of World Economy of the Hun-garian Academy of Sciences, Hungary; Lindita Xhillari, Nation-al Agency for privatization, Albania.
Free 'Entry' and free 'Exit' are the fundamental mechanismsof the operation of a competitive market economy. They willguarantee that the more efficient firms and those producing inaccordance with the market demand, survive and prosper
while the inefficient units and those whose production is notgeared to the market will contract and eventually embark onexit. Free entry will ensure that potential entrepreneurs willtake advantage of profitable opportunities and enter the prof-itable segments of the market, increasing the competitive pres-sure on the incumbent firms, lowering output prices andimproving the overall allocation of resources. In the absence offree entry, imperfect market structures will survive, inefficientfirms will be able to maintain their prices and profit margins,and there will be no incentive to reduce costs.
Recent developments in the 'industrial organization' theo-ry, particularly the work on the 'contestable market' theory byBaumol and his associates, have clearly established that theexistence of free entry and exit conditions, which will make amarket 'contestable', ensures an improvement in the allocationof resources and the overall welfare. These authors haveshown that the presence of potential entry, in contestable mar-kets, will impose a discipline on incumbent firms and forcethem to behave 'as if' these rivals have already entered the mar-ket. The focal point of this literature is that conditions of entryare the main determinants of the performance and structure ofan industry.
Of course, it is not only the contestable market theoristswho have highlighted the importance of entry conditions forindustrial structure and performance. Years earlier, Bain(1968), Stigler (1968), Von Weizsacker (1980), Demsetz(1982), and many others had elaborated on the impact of bar-riers to entry on technical and allocative efficiency and con-sumer welfare.
Barriers to entry and exit influence the development ofcompetitive conditions in established market economies aswell as in transition economies [1]. The literature on barriersto entry is almost completely based on the experience ofdeveloped market economies. However, for economies in
Ewa Balcerowicz, Leszek Balcerowicz and Iraj Hashi
Part 1Constraints to Entry and Development of New Firmsin Transition Economies and the Role of Government
[1] Although the present study will focus on barriers to 'entry', the conditions of 'exit' are equally important for the development of a competitiveeconomy. The nature and intensity of the exit processes during the transition to a market economy was the subject of another research project financedby the ACE programme. See Balcerowicz, et.al. (1998) for a detail investigation of types of exit, the legal and institutional framework for different exitprocesses, and government policies influencing the pace of exit in each country.
9
Barriers to Entry ...
CASE Reports No. 14
transition the freedom of entry and exit condition assumes aneven more significant dimension than in the already-establishedmarket economies. This is because of the particular 'initial con-ditions', which they inherited from their communist past: mas-sive distortions of the economic structure, highly monopolisticand oligopolistic markets, and a large average firm size. Withthe collapse of the old regime, the transformation of the oldeconomic structure had to take place through the entry ofnew, market-oriented firms particularly in the undevelopedsectors of the economy and the exit of inefficient and uncom-petitive enterprises especially from the over-grown industrialsector [2]. These initial conditions meant that, in the earlystages of transition, the volume of entries and exits will be, bynecessity, very high - reflecting the large scale changes that hadto take place before these economies attain a macroeconomicstructure consistent with their level of development and withthe needs of a market-based economy open to internationalcompetition.
One of the main elements of the reform programme in alleconomies in transition was the liberalization of entry condi-tions. Along with the liberalization of prices and foreign trade,appropriate measures facilitating the establishment of newenterprises were approved in the very early phase of reformsin all of these countries. The effectiveness of liberalized entryconditions, of course, depends on the presence of appropriatelegal and institutional framework in which new firms will oper-ate. The establishment of a conducive, legal and institutionalenvironment, however, takes much longer. In practice, newfirms come into existence before the rules of the game areproperly established. These rules develop gradually and are notalways, and everywhere, consistent with the aim of liberalizingthe entry conditions. The conditions facing new firms, there-fore, have fluctuated in some countries in accordance withchanges in the political environment and in line with thestrength of different lobbies and interest groups [3]. Further-more, given that the composition of the bureaucracy haschanged slowly, and to varying degrees in different countries,the old prejudices against private entrepreneurship has notalways disappeared quickly in all transition economies [4]. Con-sequently, in some countries, although the measures aiming atthe liberalization of entry conditions have been on the statutebooks for some time, the actual conditions regulating the entryof new firms are still far from 'accommodating' and 'facilitating'.
As a result of the liberalization of entry conditions, therewas an explosion of new firm entry in every transition econo-my across Central and Eastern Europe. Even so, entry has notbeen uniform across sectors and size groups [5]. The greatmajority of the new entries have been very small firms con-
centrated in sectors such as trade and services. Some of theseactivities, such as banking and financial services, were highlyundeveloped while others, such as marketing and advertisingwere almost non-existent in the former economic system.Here, new entries filled a gap in the market. In other areas,such as distribution, the former networks were both insuffi-cient in meeting the market demand and inefficient in theiroperations, offering profitable opportunities to new entries.Entry to other sectors of the economy, however, has not beenas numerous as that in trade and service activities.
Despite the large scale liberalization of entry conditions,the number and size distribution of firms in many branches ofeconomic activity remains skewed. Many activities, especially inthe industries, are still dominated by a small number of largefirms. Medium and large size new firms in industrial and com-mercial activities are rather rare. The underlying reason forthese features is the fact that barriers to entry have not beencompletely eradicated and conditions facing new enterprises,when they do enter a market, are not always conducive to sta-bility and expansion.
The improvement of conditions of entry and the conse-quent development of new private firms also has another, andmore crucial, dimension in the course of transition. New firmsconstitute the most dynamic part, or the engine of growth, intransition economies (see Blanchard 1997). They are not con-strained by traditional ownership relations or the incentive sys-tem, which dominate the state-owned or privatized sector ofthe economy. They recognize the promising segment of themarket to enter and respond quickly to changes in demand andcost conditions. Evidence is gradually emerging (see for exam-ple Belka, et.al. 1995) that although 'privatized' firms performbetter than firms which are still state-owned, there is a signifi-cant difference the performance of newly set-up private firmsand 'privatized' firms. The removal of entry barriers, therefore,is important for transition economies as it can have a majorinfluence on their growth performance.
With the exception of the very early stages of transition,when small entrepreneurs took over pavements and emptyspaces in city centres all across Eastern Europe and embarkedon business activities without any rules or restrictions, the lib-eralization of entry conditions did not, of course, mean a com-plete abolition of all regulations affecting the establishment ofnew businesses. New laws were quickly promulgated to over-see and regulate the entry of new firms – specifically requiringthem to register with municipal or higher authorities, taxoffices, social insurance offices, and in some or all cases obtaina license or permit from the competent state authorities. Whilethere is no doubt that new firms have to be subject to certain
[2] For a detailed analysis of the nature and magnitude of exit process in the Czech Republic, Hungary and Poland, see Balcerowicz, Gray and Hoshi(1998), Chapter 4.
[3] For a discussion of the views of leading reformers in early transition, see Balcerowicz (1995) and Blejer and Coricelli (1995).[4] See Shleifer (1997) for an interesting discussion of the speed of changes in bureaucracy in Poland and Russia and its implication for small busi-
nesses.[5] For a detailed data for Poland, see Chmiel (1998).
10
Ewa Balcerowicz, Leszek Balcerowicz and Iraj Hashi
CASE Reports No. 14
laws and be governed by regulations designed to protect thecitizens, these laws and regulations provide the arena for thestate (and state officials) to exercise an effective influence overprivate sector development. They fall in the category of 'gov-ernment erected barriers' with two important implications.Firstly, state-sponsored rules and regulations create the oppor-tunity for rent seeking activities by government officials andbureaucrats, i.e., bribery and corruption. During the transitionperiod, governments often comply with the demands of vari-ous interest groups and may even turn a blind eye to rent seek-ing activities.
Secondly, these rules and regulations may push the entre-preneurs to the informal sector of the economy. With undevel-oped rules of the game and under non-conducive environment,all economic agents, new firms in particular have to decidewhether – and to what extent – they wish to operate in the for-mal economy. This decision is based on the incentive systemgenerated by the legal and institutional mechanisms operatingin different countries. New entrepreneurs have to assess andweigh the opportunity costs of entering a new business. Theywill have to compare the gains from entering the official econ-omy with, firstly, the gains from operating in the unofficial orshadow economy and, secondly, with what they can earn inemployment or even unemployment. In many cases, the legaland institutional structures and a wide variety of rules and reg-ulations provide sufficient incentive for new firms (or existingfirms) to operate outside the formal economy. It is thereforenot accidental that a significant shadow economy has emergedin all transition economies – with a severe impact on statefinances, resource allocation and the establishment of a com-petitive market economy.
Finally, in addition to the regulatory and fiscal barriers, pri-vate sector development may be further constrained by thecontinued dominance of some economic activities by largestate-owned or privatized enterprises and their entry deterringbehaviour. Some of these enterprises are, to varying degrees,still subject to semi-soft budget constraints and have close con-tact and relationship with banks (which are also still to a largeextent state-owned). Some authors have expressed a concernthat these firms, at least in some countries, may exercise astrong influence on prices and output levels in their product andinput markets. The dominant firms also enjoy lower cost ofcredit compared to new entrants and can potentially 'crowdout' new entrants in the credit and raw material markets (Hus-sain 1994 and OECD 1996).
This study aims at investigating the impact of above factorsin five countries at different stages of transformation with aview to identifying those barriers that still impede the estab-
lishment of new firms and their early growth. It is divided intotwo parts. In Part I, Chapter 2 we discuss the interactionbetween the government's regulatory activity and the entry ofnew firms into the formal or informal sectors of the economy.Here we shall highlight the necessity of this important functionof the government as well as its undesirable implications suchas rent seeking and corruption. In Chapter 3 we consider aframework for the analysis of barriers to entry and growth ofnew firms, highlighting the main constraints to entry andgrowth considered by this report. Chapter 4 is devoted to thereview of the actual pattern of new firm entry in the early tran-sition period in the five countries under consideration. Part IIreports on the results of our enterprise survey, a detailed studyof 400 firms in five transition economies. Here we shall first dis-cuss (Chapter 5) the composition of the sample on which thestudy is based and then (Chapters 6,7,8,9 and 10) summarizethe main findings of the study in terms of the relative impor-tance of different barriers facing new firms in each country.Chapter 11 discusses the main policy recommendations of thisstudy.
2. Government and Transition
The massive deregulation of economic activities was a fun-damental feature of transformation in all Central and East Euro-pean countries. The all-pervasive system of state control estab-lished under socialism was inappropriate for these transformingeconomies and had to be replaced by a completely different setof rules and regulations designed to facilitate the establishmentof a market economy. While the vast machinery of the formersystem was being dismantled, the state had to assume newfunctions and formulate the 'rules of the game' appropriate forthe operation of the new system. Given the legacy of the oldsystem and the manner of its disintegration, new rules had tobe devised at the same time as the new system was takingshape. It was therefore inevitable that the new regulatoryframework would develop unevenly in different countries andthat some countries would suffer from a 'regulatory vacuum', anear-total-absence of an appropriate regulatory framework forthe protection of citizens' economic interests [6]. In othercountries, many of the old rules and regulations were retaineduntil new ones could be promulgated – a policy broadly aimedat preventing opportunism.
The newly elected governments had to design new rulesand regulations for various aspects of economic activity, includ-ing the conditions of entry and operation of new firms. The
[6] The attitude of the ruling parties in some countries (Albania and the Czech Republic, e.g.) was that all economic activities were legal as long asthey were not explicitly forbidden by law - an attitude which resulted, for example, in financial scandals such as the formation of pyramid schemes inthe former and the 'tunnelling' of privatization investment funds by their main shareholders and managers in the latter. Similarly, almost all transitioneconomies suffered from environmental damage caused by the massive, uncontrolled and wholesale import of second hand cars from Western Europe,many of which were not road-worthy.
11
Barriers to Entry ...
CASE Reports No. 14
process was by definition time consuming since changes in reg-ulations also required various legal changes which could not bebrought in immediately. New regulations ranged from thosedealing with the registration and licensing of new firms; to fiscalregulations governing taxes, social and health insurance andother contributions, accounting and financial rules coveringbook keeping, expenses, depreciation, and banking, labourcode governing conditions of work, minimum wage, dismissals,etc.; real estate regulations dealing with conditions of lease orsale of commercial property; and many others.
The aims of government regulations in transition countriesare not always explicit. Sometimes they are expressed in termsof correcting market failures arising from externalities or asym-metric information (establishing minimum standards in theinterest of consumers, and licensing of certain activities andprofessions); at other times in terms of promoting public wel-fare and protecting citizens against scrupulous businessmen(employment laws, tenancy laws, etc.). Mostly, however, theyare designed to facilitate the identification of economic units fortax purposes (tax base) and to ensure that the state treasuryreceives its dues [7].
But these rules and regulations, useful as they may be, playan additional, rather negative, role too. Regulations affectingentry and survival of firms put politicians and bureaucrats at dif-ferent levels of government in a strong position to exerciseinfluence over new firms. They provide the politicians withlegitimate means to pursue their own objectives – which mayrange from extracting a rent, to using subsidies to createemployment in friendly companies and areas, favouring theirpolitical allies and penalizing their opponents. Taxes, subsidiesand various contributions may also be used to achieve the sameobjectives. The success of transition policies is closely boundwith the way governments and politicians use their newlyacquired (or retained) powers to control the entry and opera-tion of new private firms (see Frydman and Rapaczynski 1991,Boycko, Shleifer and Vishny 1996, Shleifer and Vishny 1993 and1994 for a discussion of the role of government and the rele-vant empirical evidence).
The establishment of new firms and the growth of this sec-tor are closely influenced by the type of regulatory policyreferred to above and the consequent exercise of discretion bypoliticians. The politicians' attitudes have a crucial impact on theentrepreneurs' decision on whether or not to enter a market.In some transition economies, such as Russia, many old stylepoliticians hostile to the market system retained power and
have engaged in 'predatory' actions against new firms. In othercountries such as Poland, on the other hand, politicians respon-sive to the needs of the newly emerging market economy havefacilitated the growth of registered new businesses. For exam-ple during 1995, the number of businesses slightly surpassed 2million in Poland and reached only one million in Russia (with apopulation four times larger) (see Chmiel 1998 and Shleifer1997). In effect, politicians exercise control rights over firmsthrough a variety of regulations including the registration andlicensing requirements, sale or lease of real estate, the level andtype of taxes and contributions, and rules governing exportsand imports. Furthermore, in addition to central authorities,regional, municipal and local governments too devise their ownrules and regulations – to pursue their own objectives – whicherect further obstacles for the newly established firms.
There is no hard and fast rule about the optimum level ofregulation – a level that has to be worked out for each countryor industry separately. On the one hand, of course, the estab-lishment of a market economy requires the abolition of the sys-tem of rules and regulations, which was in force under social-ism. On the other hand, the new system requires its own new'rules of the game' aimed at creating a level playing field for allparticipants. While governments should provide sufficient'space' for entrepreneurs to engage in lawful economic activi-ties, it should also ensure that no one's rights (including the cit-izens' and the state's) are violated by the emerging entrepre-neurs. In some areas such as environmental protection or thefinancial system, many countries still do not have sufficient rulesto protect their natural environment or their citizens' financialinterests against new firms and their self-seeking managers [8].
In areas such as taxation, on the other hand, the legacy ofthe socialist system (with its massive state sector and high lev-els of expenditure) led to the imposition of very high levels oftaxes and contributions and to too many complicated and con-stantly changing rules. Expenditure on the 'safety net' (e.g.unemployment and other social benefits) was often misusedbecause of the absence of an appropriate monitoring systemand suitable rules. It is clear that if the government does nottake a conscious and clear view of the appropriate level of reg-ulation, it will either not be able to resist the pressures for'excessive' regulation from different levels of bureaucracy or itwill not bring in the basic regulations which are necessary forthe development of a market economy.
The impediments to private sector development also playan important role in pushing certain entrepreneurial activities
[7] As Friedman has pointed out the licensing of professionals (doctors and nurses for example) is a mechanism by which the state provides rela-tively low cost information about the qualification of these professionals for consumers. At the same time, as a barrier to entry of new economic units,this is not an excessively costly barrier. See Friedman's discussion of occupational licensing in Friedman (1962), pp.137-160.
[8] On the question of environmental protection, the Hungarian law was passed only in 1996 while in Albania there is still no law regulating theimpact of economic units on the natural environment. On financial issues, it is interesting to note that when some of the culprits of the disastrous pyra-mid schemes in Albania were tried and convicted, it was realised that the existing rules could only impose a maximum of 3 years imprisonment on them,i.e., the country lacked proper rules of the game to hand them punishments in proportion to their crimes. Similarly, in the Czech Republic, the culpritsof the tunnelling of investment funds and many other financial irregularities have gone unpunished because of the lack of appropriate rules.
12
Ewa Balcerowicz, Leszek Balcerowicz and Iraj Hashi
CASE Reports No. 14
into the shadow economy. Naturally, many new businesseswish to evade what they consider 'excessive' levels of taxes and'troublesome' rules and regulations if at all possible. To this endthey may try to conduct some or all of their business outsidethe formal sector. This will have a distorting effect on the devel-opment of the private sector as well as major implications forgovernment finances. A shortfall in government revenue willreduce its ability to provide the normal services expected of agovernment in a market economy – including policing of theinformal sector. This will create incentive for more entrepre-neurs to try to shift some of their activities into the shadoweconomy, reducing government's revenues and its normalexpenditure programme further. The available evidence fromtransition economies shows that the size of the shadow econ-omy is related to the level of 'legal protection' and 'legal effec-tiveness' provided by the government. These services, in turn,are dependent on government's revenues and its taxation poli-cies (see Johnson, et.al. 1997, Kaufmann and Kaliberda 1995).
Irrespective of the height of entry barriers and the role offiscal, regulatory and institutional constraints, some firms willalways carry out a part or all of their activities in the informalsector. Most of these, by nature, are small owner-managedunits. What is more significant (and serious) is the fact thatmany formally established firms, even some large ones, do notreport a proportion of their sales and expenditure and pay
some of their employees in cash (over and above their declaredwages) and suppliers in cash or kind. In this way, they reducetheir own (and their employees' or suppliers') tax and contri-bution obligations. For many years now, economists haveargued that high rates of taxation is a major factor in pushingemployers and employees into tax evasion and undergroundactivity. In their study of the impact of government taxationpolicies in 15 transition economies, Johnson, et. al (1997, p.20)show that the size of unofficial economy in transitioneconomies is significantly correlated with the effective tax rate(or tax burden) [9].
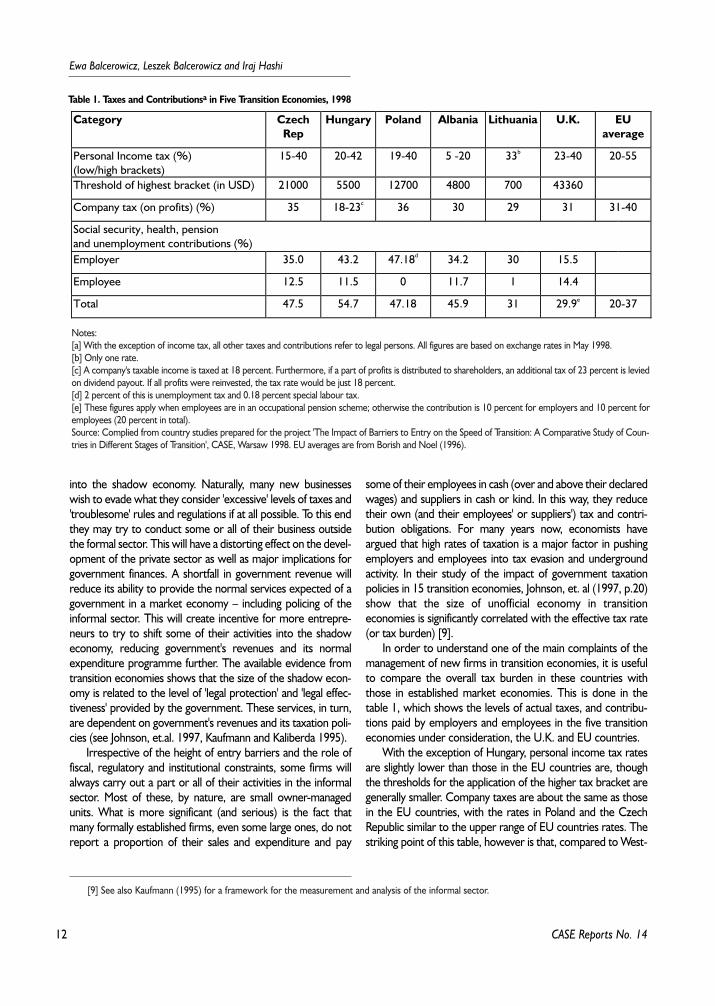
In order to understand one of the main complaints of themanagement of new firms in transition economies, it is usefulto compare the overall tax burden in these countries withthose in established market economies. This is done in thetable 1, which shows the levels of actual taxes, and contribu-tions paid by employers and employees in the five transitioneconomies under consideration, the U.K. and EU countries.
With the exception of Hungary, personal income tax ratesare slightly lower than those in the EU countries are, thoughthe thresholds for the application of the higher tax bracket aregenerally smaller. Company taxes are about the same as thosein the EU countries, with the rates in Poland and the CzechRepublic similar to the upper range of EU countries rates. Thestriking point of this table, however is that, compared to West-
Table 1. Taxes and Contributionsa in Five Transition Economies, 1998
Category CzechRep
Hungary Poland Albania Lithuania U.K. EUaverage
Personal Income tax (%)(low/high brackets)
15-40 20-42 19-40 5 -20 33b 23-40 20-55
Threshold of highest bracket (in USD) 21000 5500 12700 4800 700 43360
Company tax (on profits) (%) 35 18-23c 36 30 29 31 31-40
Social security, health, pensionand unemployment contributions (%)Employer 35.0 43.2 47.18d 34.2 30 15.5
Employee 12.5 11.5 0 11.7 1 14.4
Total 47.5 54.7 47.18 45.9 31 29.9e 20-37
Notes:[a] With the exception of income tax, all other taxes and contributions refer to legal persons. All figures are based on exchange rates in May 1998.[b] Only one rate.[c] A company's taxable income is taxed at 18 percent. Furthermore, if a part of profits is distributed to shareholders, an additional tax of 23 percent is leviedon dividend payout. If all profits were reinvested, the tax rate would be just 18 percent.[d] 2 percent of this is unemployment tax and 0.18 percent special labour tax.[e] These figures apply when employees are in an occupational pension scheme; otherwise the contribution is 10 percent for employers and 10 percent foremployees (20 percent in total).Source: Complied from country studies prepared for the project 'The Impact of Barriers to Entry on the Speed of Transition: A Comparative Study of Coun-tries in Different Stages of Transition', CASE, Warsaw 1998. EU averages are from Borish and Noel (1996).
[9] See also Kaufmann (1995) for a framework for the measurement and analysis of the informal sector.
13
Barriers to Entry ...
CASE Reports No. 14
ern market economies, the level of social security, health andunemployment contributions in four of our five countries (par-ticularly in Hungary), is much higher. This observation clearlysupports the claim that high levels of contributions forces manyentrepreneurs (and employees) to operate outside the formaleconomy.
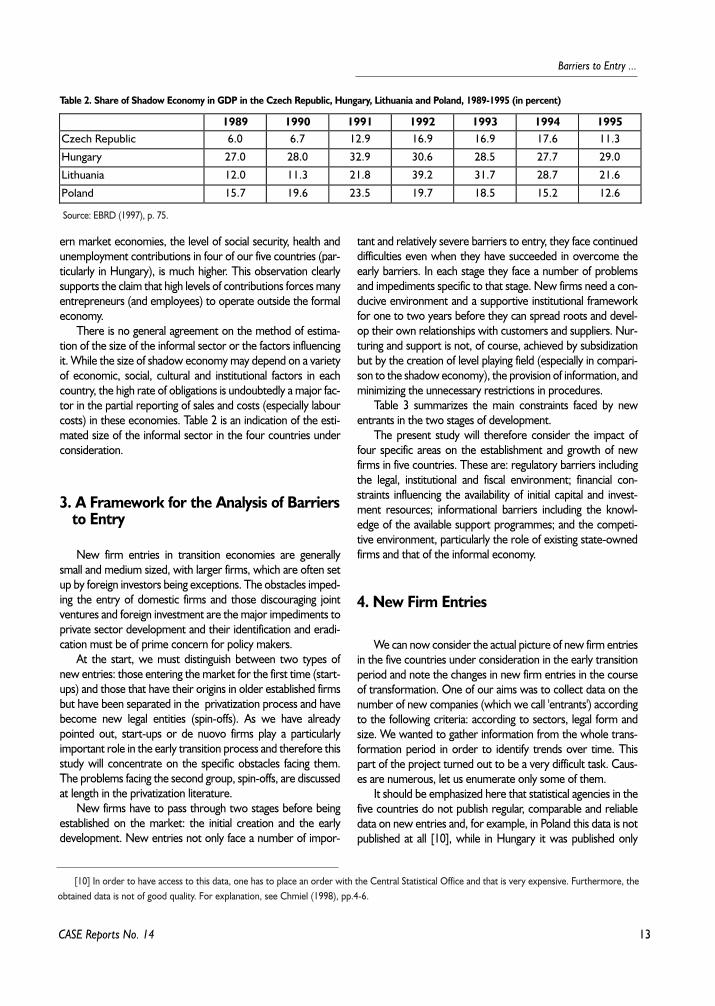
There is no general agreement on the method of estima-tion of the size of the informal sector or the factors influencingit. While the size of shadow economy may depend on a varietyof economic, social, cultural and institutional factors in eachcountry, the high rate of obligations is undoubtedly a major fac-tor in the partial reporting of sales and costs (especially labourcosts) in these economies. Table 2 is an indication of the esti-mated size of the informal sector in the four countries underconsideration.
3. A Framework for the Analysis of Barriers to Entry
New firm entries in transition economies are generallysmall and medium sized, with larger firms, which are often setup by foreign investors being exceptions. The obstacles imped-ing the entry of domestic firms and those discouraging jointventures and foreign investment are the major impediments toprivate sector development and their identification and eradi-cation must be of prime concern for policy makers.
At the start, we must distinguish between two types ofnew entries: those entering the market for the first time (start-ups) and those that have their origins in older established firmsbut have been separated in the privatization process and havebecome new legal entities (spin-offs). As we have alreadypointed out, start-ups or de nuovo firms play a particularlyimportant role in the early transition process and therefore thisstudy will concentrate on the specific obstacles facing them.The problems facing the second group, spin-offs, are discussedat length in the privatization literature.
New firms have to pass through two stages before beingestablished on the market: the initial creation and the earlydevelopment. New entries not only face a number of impor-
tant and relatively severe barriers to entry, they face continueddifficulties even when they have succeeded in overcome theearly barriers. In each stage they face a number of problemsand impediments specific to that stage. New firms need a con-ducive environment and a supportive institutional frameworkfor one to two years before they can spread roots and devel-op their own relationships with customers and suppliers. Nur-turing and support is not, of course, achieved by subsidizationbut by the creation of level playing field (especially in compari-son to the shadow economy), the provision of information, andminimizing the unnecessary restrictions in procedures.
Table 3 summarizes the main constraints faced by newentrants in the two stages of development.
The present study will therefore consider the impact offour specific areas on the establishment and growth of newfirms in five countries. These are: regulatory barriers includingthe legal, institutional and fiscal environment; financial con-straints influencing the availability of initial capital and invest-ment resources; informational barriers including the knowl-edge of the available support programmes; and the competi-tive environment, particularly the role of existing state-ownedfirms and that of the informal economy.
4. New Firm Entries
We can now consider the actual picture of new firm entriesin the five countries under consideration in the early transitionperiod and note the changes in new firm entries in the courseof transformation. One of our aims was to collect data on thenumber of new companies (which we call 'entrants') accordingto the following criteria: according to sectors, legal form andsize. We wanted to gather information from the whole trans-formation period in order to identify trends over time. Thispart of the project turned out to be a very difficult task. Caus-es are numerous, let us enumerate only some of them.
It should be emphasized here that statistical agencies in thefive countries do not publish regular, comparable and reliabledata on new entries and, for example, in Poland this data is notpublished at all [10], while in Hungary it was published only
Table 2. Share of Shadow Economy in GDP in the Czech Republic, Hungary, Lithuania and Poland, 1989-1995 (in percent)
1989 1990 1991 1992 1993 1994 1995Czech Republic 6.0 6.7 12.9 16.9 16.9 17.6 11.3
Hungary 27.0 28.0 32.9 30.6 28.5 27.7 29.0
Lithuania 12.0 11.3 21.8 39.2 31.7 28.7 21.6
Poland 15.7 19.6 23.5 19.7 18.5 15.2 12.6
Source: EBRD (1997), p. 75.
[10] In order to have access to this data, one has to place an order with the Central Statistical Office and that is very expensive. Furthermore, theobtained data is not of good quality. For explanation, see Chmiel (1998), pp.4-6.
14
Ewa Balcerowicz, Leszek Balcerowicz and Iraj Hashi
CASE Reports No. 14
until 1994. The information on new firms is not kept centrallyin any of the five countries. The data is kept separately in dif-ferent regions and in different institutions depending on a vari-ety of factors. Moreover, the quality of what is published variesconsiderably across different countries. For example in mostcountries the data does not identify the number of active firms,as opposed to the dormant ones or those that have ceasedoperation altogether. In theory it is of course possible to iden-tify active firms if tax returns are used as the basis for the iden-tification of economic units. This, however, is not the practicein most countries. Therefore, the number of entries in mostcases overstates the effective entry. Another problem is thechange of the statistical classification from the one typical of
communist economies to NACE. In Poland this resulted inincomparability of sectoral data classified until 1992 with thosecollected since 1994. For the Czech Republic data for 1990 and1991 are not available, because in that period the data coveredthe whole of former Czechoslovakia.
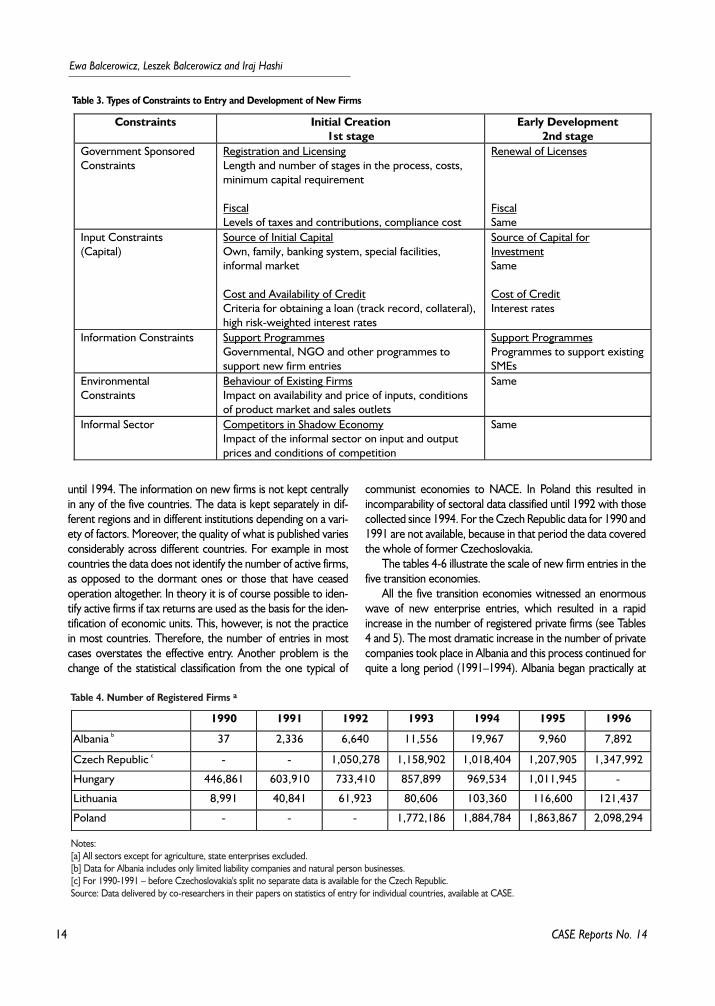
The tables 4-6 illustrate the scale of new firm entries in thefive transition economies.
All the five transition economies witnessed an enormouswave of new enterprise entries, which resulted in a rapidincrease in the number of registered private firms (see Tables4 and 5). The most dramatic increase in the number of privatecompanies took place in Albania and this process continued forquite a long period (1991–1994). Albania began practically at
Table 3. Types of Constraints to Entry and Development of New Firms
Constraints Initial Creation1st stage
Early Development2nd stage
Government SponsoredConstraints
Registration and LicensingLength and number of stages in the process, costs,minimum capital requirement
FiscalLevels of taxes and contributions, compliance cost
Renewal of Licenses
FiscalSame
Input Constraints(Capital)
Source of Initial CapitalOwn, family, banking system, special facilities,informal market
Cost and Availability of CreditCriteria for obtaining a loan (track record, collateral),high risk-weighted interest rates
Source of Capital forInvestmentSame
Cost of CreditInterest rates
Information Constraints Support ProgrammesGovernmental, NGO and other programmes tosupport new firm entries
Support ProgrammesProgrammes to support existingSMEs
EnvironmentalConstraints
Behaviour of Existing FirmsImpact on availability and price of inputs, conditionsof product market and sales outlets
Same
Informal Sector Competitors in Shadow EconomyImpact of the informal sector on input and outputprices and conditions of competition
Same
Table 4. Number of Registered Firms a
1990 1991 1992 1993 1994 1995 1996
Albania b 37 2,336 6,640 11,556 19,967 9,960 7,892
Czech Republic c - - 1,050,278 1,158,902 1,018,404 1,207,905 1,347,992
Hungary 446,861 603,910 733,410 857,899 969,534 1,011,945 -
Lithuania 8,991 40,841 61,923 80,606 103,360 116,600 121,437
Poland - - - 1,772,186 1,884,784 1,863,867 2,098,294
Notes:[a] All sectors except for agriculture, state enterprises excluded.[b] Data for Albania includes only limited liability companies and natural person businesses.[c] For 1990-1991 – before Czechoslovakia's split no separate data is available for the Czech Republic.Source: Data delivered by co-researchers in their papers on statistics of entry for individual countries, available at CASE.
15
Barriers to Entry ...
CASE Reports No. 14
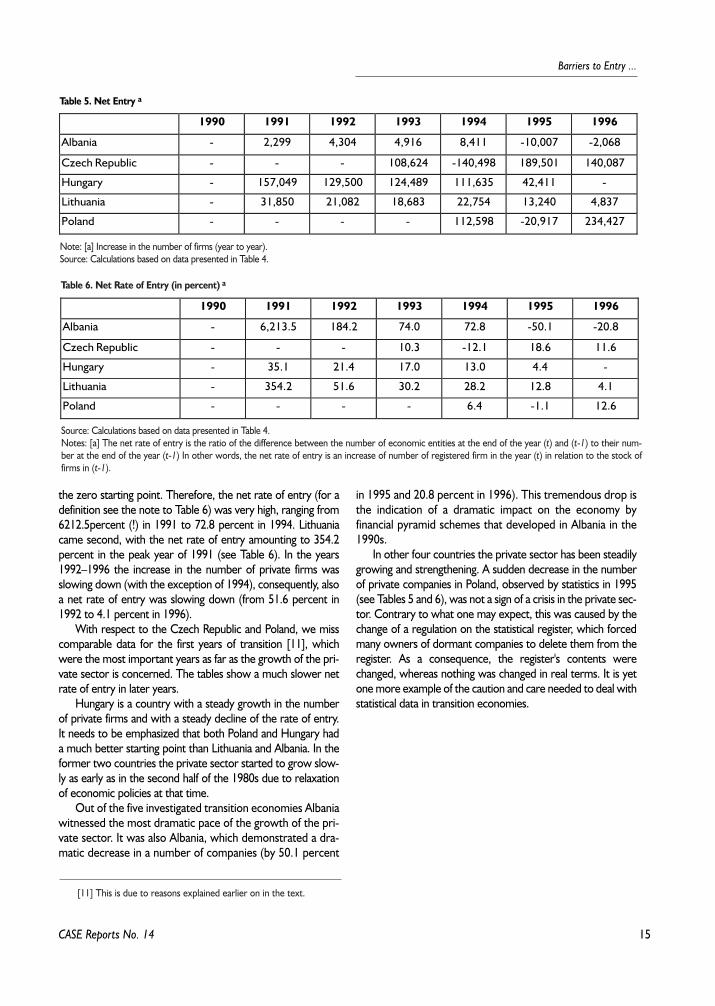
the zero starting point. Therefore, the net rate of entry (for adefinition see the note to Table 6) was very high, ranging from6212.5percent (!) in 1991 to 72.8 percent in 1994. Lithuaniacame second, with the net rate of entry amounting to 354.2percent in the peak year of 1991 (see Table 6). In the years1992–1996 the increase in the number of private firms wasslowing down (with the exception of 1994), consequently, alsoa net rate of entry was slowing down (from 51.6 percent in1992 to 4.1 percent in 1996).
With respect to the Czech Republic and Poland, we misscomparable data for the first years of transition [11], whichwere the most important years as far as the growth of the pri-vate sector is concerned. The tables show a much slower netrate of entry in later years.
Hungary is a country with a steady growth in the numberof private firms and with a steady decline of the rate of entry.It needs to be emphasized that both Poland and Hungary hada much better starting point than Lithuania and Albania. In theformer two countries the private sector started to grow slow-ly as early as in the second half of the 1980s due to relaxationof economic policies at that time.
Out of the five investigated transition economies Albaniawitnessed the most dramatic pace of the growth of the pri-vate sector. It was also Albania, which demonstrated a dra-matic decrease in a number of companies (by 50.1 percent
in 1995 and 20.8 percent in 1996). This tremendous drop isthe indication of a dramatic impact on the economy byfinancial pyramid schemes that developed in Albania in the1990s.
In other four countries the private sector has been steadilygrowing and strengthening. A sudden decrease in the numberof private companies in Poland, observed by statistics in 1995(see Tables 5 and 6), was not a sign of a crisis in the private sec-tor. Contrary to what one may expect, this was caused by thechange of a regulation on the statistical register, which forcedmany owners of dormant companies to delete them from theregister. As a consequence, the register's contents werechanged, whereas nothing was changed in real terms. It is yetone more example of the caution and care needed to deal withstatistical data in transition economies.
Table 5. Net Entry a
1990 1991 1992 1993 1994 1995 1996
Albania - 2,299 4,304 4,916 8,411 -10,007 -2,068
Czech Republic - - - 108,624 -140,498 189,501 140,087
Hungary - 157,049 129,500 124,489 111,635 42,411 -
Lithuania - 31,850 21,082 18,683 22,754 13,240 4,837
Poland - - - - 112,598 -20,917 234,427
Note: [a] Increase in the number of firms (year to year). Source: Calculations based on data presented in Table 4.
Table 6. Net Rate of Entry (in percent) a
1990 1991 1992 1993 1994 1995 1996
Albania - 6,213.5 184.2 74.0 72.8 -50.1 -20.8
Czech Republic - - - 10.3 -12.1 18.6 11.6
Hungary - 35.1 21.4 17.0 13.0 4.4 -
Lithuania - 354.2 51.6 30.2 28.2 12.8 4.1
Poland - - - - 6.4 -1.1 12.6
Source: Calculations based on data presented in Table 4.Notes: [a] The net rate of entry is the ratio of the difference between the number of economic entities at the end of the year (t) and (t-1) to their num-ber at the end of the year (t-1) In other words, the net rate of entry is an increase of number of registered firm in the year (t) in relation to the stock offirms in (t-1).
[11] This is due to reasons explained earlier on in the text.
16
Ewa Balcerowicz, Leszek Balcerowicz, Iraj Hashi
CASE Reports No. 14
To study the constraints to entry and growth of new firmsa special questionnaire has been prepared in order to make adetailed study of a group of firms in five transition economies.The questionnaire was addressed to owners of the samplefirms or general directors employed in a company long enoughto know its whole history.
5. The Survey SampleIraj Hashi and Jan Mladek
The sample consists of 396 newly established enterprises,one hundred each in the Czech Republic and Hungary, ninetysix in Poland, and fifty each in Albania and Lithuania. Individualproprietorships and businesses run by physical persons wereexcluded. The reasoning behind this was that these economicentities are not obliged to do the accounts, contrary to com-panies (limited liability companies, joint stock companies, part-nerships and co-operatives), thus the available data have to belimited. Similarly, other regulatory and fiscal constraints are
smaller than for co-operatives and commercial code compa-nies. Moreover, a legal form of a natural person business has itsshortcomings in a sense that it is suitable for small firms ownedby one person only and once they grow they usually changetheir legal status [12]. All these characteristics were not withline of the research aim that is to study barriers to entry andgrowth of companies in mature legal forms enabling fast deve-lopment.
Enterprises were selected from the Company Registerskept at courts, statistical agencies or other state institutions,associations of entrepreneurs and employers' organizations indifferent countries. The sample in each country, however, hadto conform to certain rules regarding the firms' activity, size andlocation.
Activity
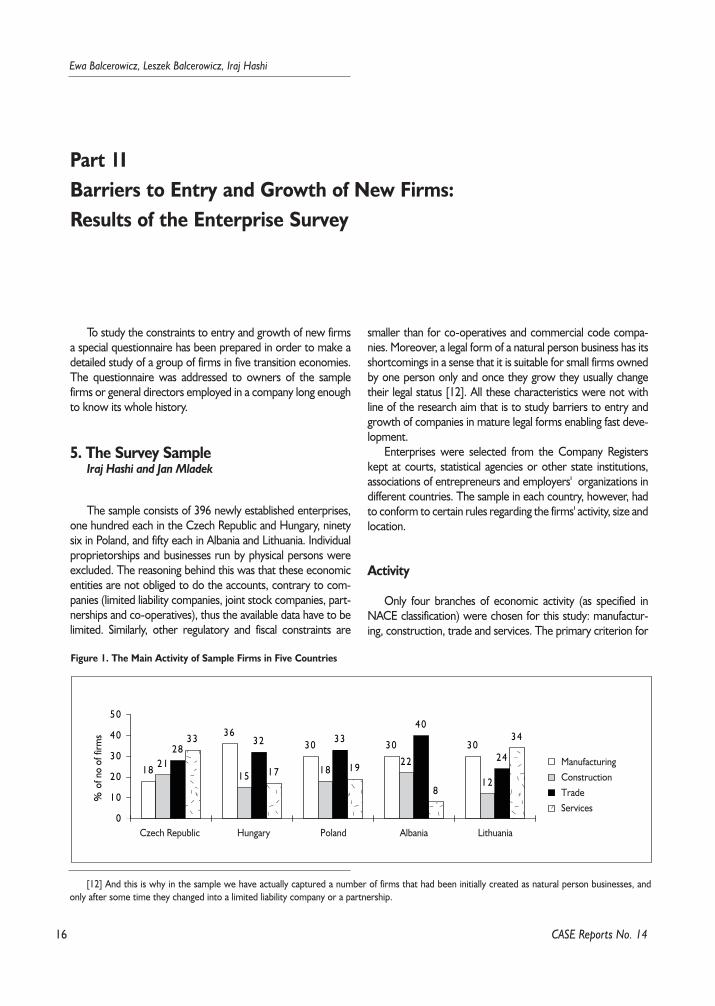
Only four branches of economic activity (as specified inNACE classification) were chosen for this study: manufactur-ing, construction, trade and services. The primary criterion for
Part 1IBarriers to Entry and Growth of New Firms: Results of the Enterprise Survey
[12] And this is why in the sample we have actually captured a number of firms that had been initially created as natural person businesses, andonly after some time they changed into a limited liability company or a partnership.
��yy��yy��yy�y��yy18
3630 30 30
2115 18
22
12
2832 33
40
24
33
17 19
8
34
0
10
20
30
40
50
% o
f no
of fi
rms
�yCzech Republic Hungary Poland Albania Lithuania
ManufacturingConstructionTradeServices
Figure 1. The Main Activity of Sample Firms in Five Countries
17
Barriers to Entry ...
CASE Reports No. 14
the selection of the sample was that it should reflect the shareof these four sectors in the national economy (by employ-ment). Of course other criteria such as size, regional locationand the legal form were also applied in sample selection.Therefore, in the end, the sample did not precisely reflect thesectoral composition of national economies. Figure 1 representthe sectoral make up of the sample in five countries.
Date of Establishment
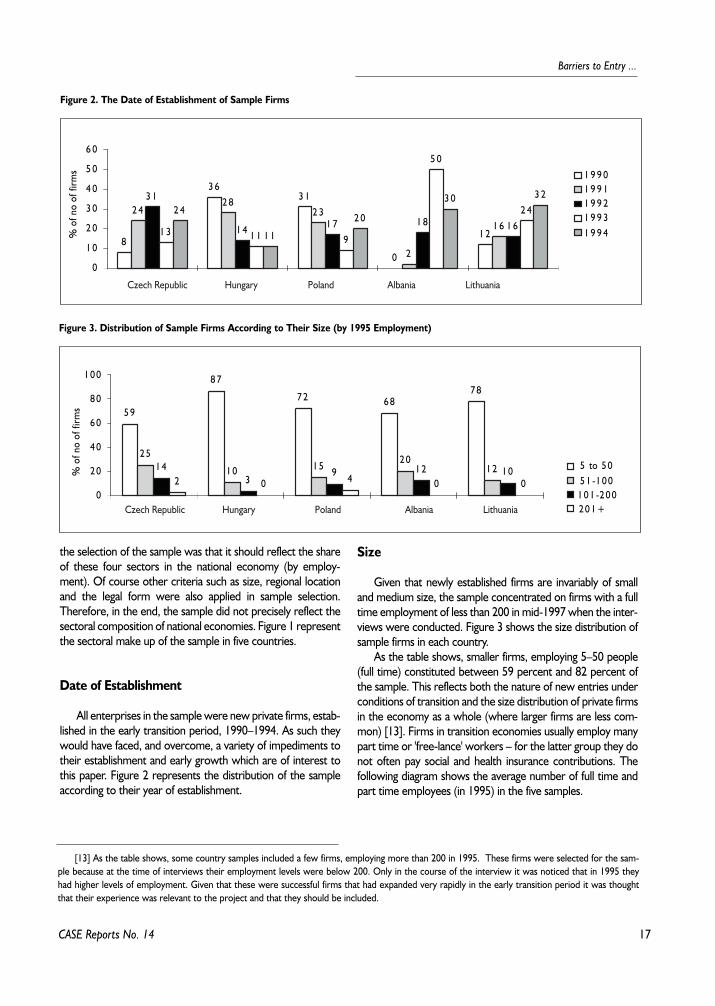
All enterprises in the sample were new private firms, estab-lished in the early transition period, 1990–1994. As such theywould have faced, and overcome, a variety of impediments totheir establishment and early growth which are of interest tothis paper. Figure 2 represents the distribution of the sampleaccording to their year of establishment.
Size
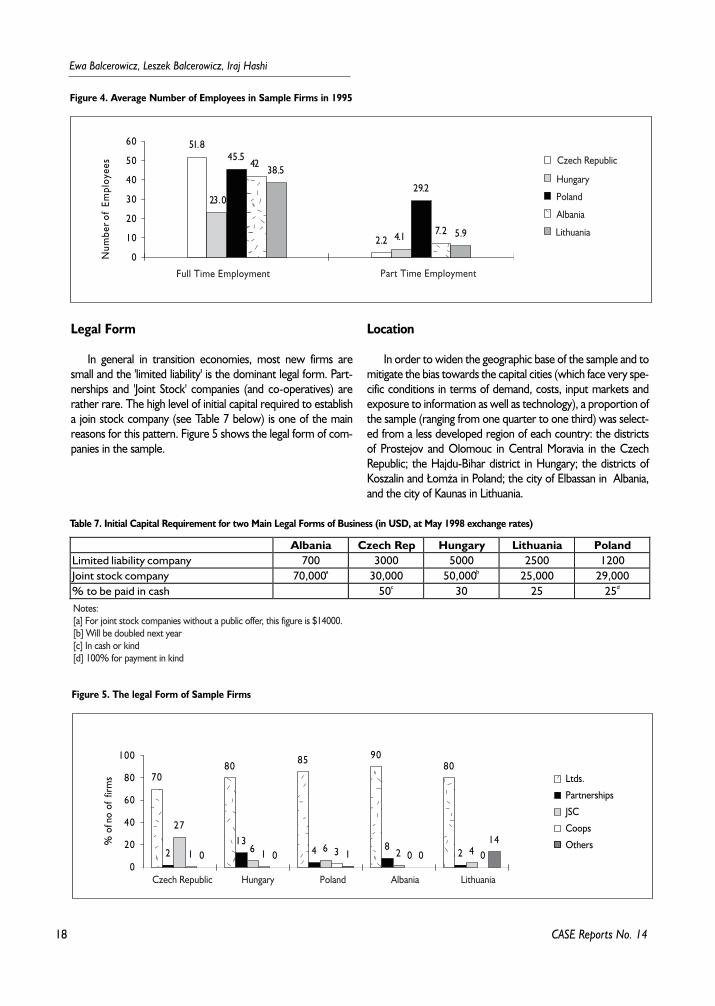
Given that newly established firms are invariably of smalland medium size, the sample concentrated on firms with a fulltime employment of less than 200 in mid-1997 when the inter-views were conducted. Figure 3 shows the size distribution ofsample firms in each country.
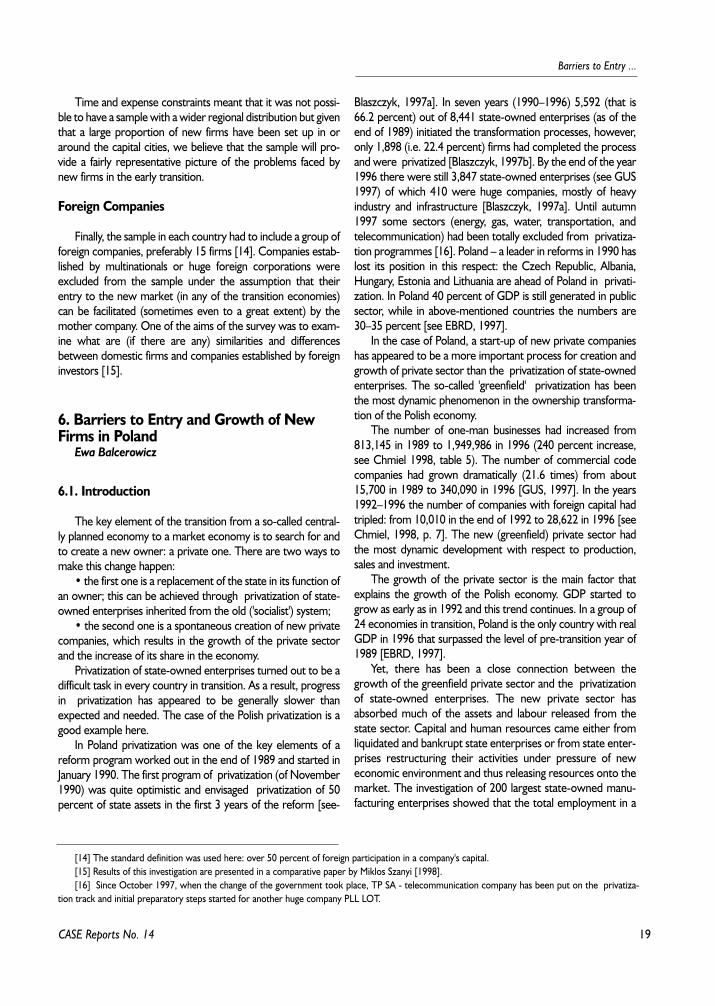
As the table shows, smaller firms, employing 5–50 people(full time) constituted between 59 percent and 82 percent ofthe sample. This reflects both the nature of new entries underconditions of transition and the size distribution of private firmsin the economy as a whole (where larger firms are less com-mon) [13]. Firms in transition economies usually employ manypart time or 'free-lance' workers – for the latter group they donot often pay social and health insurance contributions. Thefollowing diagram shows the average number of full time andpart time employees (in 1995) in the five samples.
8
3 63 1
0
1 2
2 42 8
2 3
2
1 6
3 1
1 4 1 7 1 8 1 61 3 1 1 9
5 0
2 42 4
1 1
2 0
3 0 3 2
0
1 0
2 0
3 0
4 0
5 0
6 0
1 9 9 01 9 9 11 9 9 21 9 9 31 9 9 4%
of n
o of
firm
s
Czech Republic Hungary Poland Albania Lithuania
Figure 2. The Date of Establishment of Sample Firms
5 9
8 7
7 2 6 87 8
2 5
1 0 1 52 0
1 21 43
9 1 2 1 02 0 4 0 0
0
2 0
4 0
6 0
8 0
1 0 0
% o
f no
of fi
rms
5 to 5 05 1 -1 0 01 0 1 -2 0 02 0 1 +Czech Republic Hungary Poland Albania Lithuania
Figure 3. Distribution of Sample Firms According to Their Size (by 1995 Employment)
[13] As the table shows, some country samples included a few firms, employing more than 200 in 1995. These firms were selected for the sam-ple because at the time of interviews their employment levels were below 200. Only in the course of the interview it was noticed that in 1995 theyhad higher levels of employment. Given that these were successful firms that had expanded very rapidly in the early transition period it was thoughtthat their experience was relevant to the project and that they should be included.
18
Ewa Balcerowicz, Leszek Balcerowicz, Iraj Hashi
CASE Reports No. 14
Legal Form
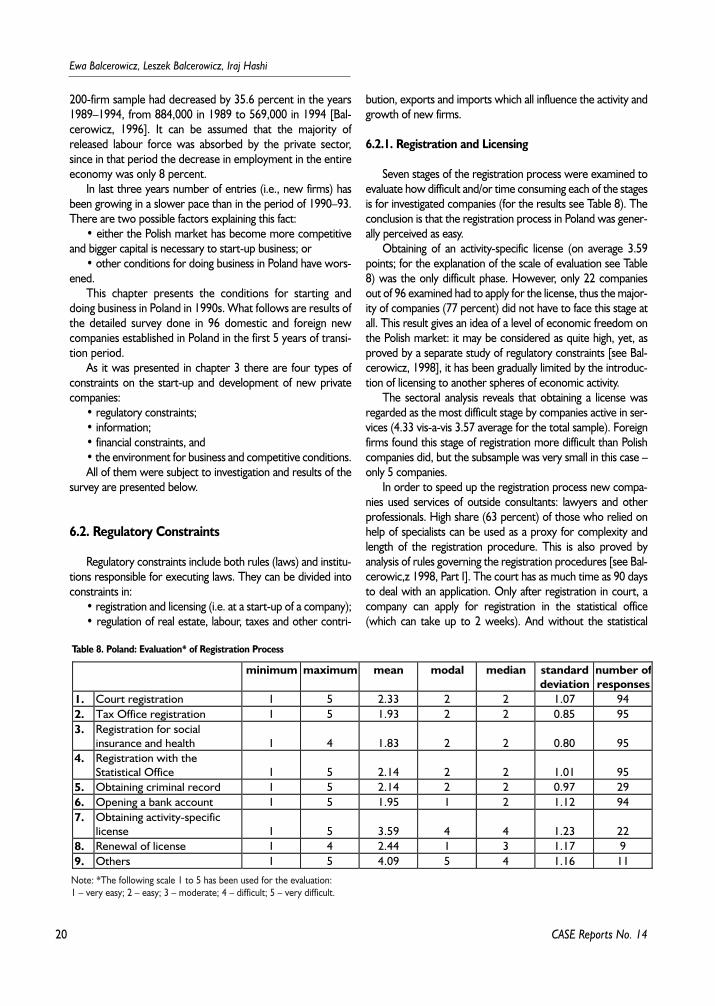
In general in transition economies, most new firms aresmall and the 'limited liability' is the dominant legal form. Part-nerships and 'Joint Stock' companies (and co-operatives) arerather rare. The high level of initial capital required to establisha join stock company (see Table 7 below) is one of the mainreasons for this pattern. Figure 5 shows the legal form of com-panies in the sample.
Location
In order to widen the geographic base of the sample and tomitigate the bias towards the capital cities (which face very spe-cific conditions in terms of demand, costs, input markets andexposure to information as well as technology), a proportion ofthe sample (ranging from one quarter to one third) was select-ed from a less developed region of each country: the districtsof Prostejov and Olomouc in Central Moravia in the CzechRepublic; the Hajdu-Bihar district in Hungary; the districts ofKoszalin and £om¿a in Poland; the city of Elbassan in Albania,and the city of Kaunas in Lithuania.
����yyyy
�y
51.8
2.2
23.0
4.1
45.5
29.2
42
7.2
38.5
5.9
0
10
20
30
40
50
60
Num
ber o
f Em
ploy
ees
�yPoland
Czech Republic
Hungary
Albania
Lithuania
Full Time Employment Part Time Employment
Figure 4. Average Number of Employees in Sample Firms in 1995
��yy��yy���
yyy
���
yyy
��yy
7080 85 90
80
213
4 82
27
6 6 2 41 1 3 0 00 0 1 014
0
20
40
60
80
100
% o
f no
of f
irms
�yLtds.
Partnerships
JSC
Coops
Others
Czech Republic Hungary Albania LithuaniaPoland
Figure 5. The legal Form of Sample Firms
Table 7. Initial Capital Requirement for two Main Legal Forms of Business (in USD, at May 1998 exchange rates)
Albania Czech Rep Hungary Lithuania PolandLimited liability company 700 3000 5000 2500 1200Joint stock company 70,000a 30,000 50,000b 25,000 29,000% to be paid in cash 50c 30 25 25d
Notes:[a] For joint stock companies without a public offer, this figure is $14000.[b] Will be doubled next year[c] In cash or kind[d] 100% for payment in kind
19
Barriers to Entry ...
CASE Reports No. 14
Time and expense constraints meant that it was not possi-ble to have a sample with a wider regional distribution but giventhat a large proportion of new firms have been set up in oraround the capital cities, we believe that the sample will pro-vide a fairly representative picture of the problems faced bynew firms in the early transition.
Foreign Companies
Finally, the sample in each country had to include a group offoreign companies, preferably 15 firms [14]. Companies estab-lished by multinationals or huge foreign corporations wereexcluded from the sample under the assumption that theirentry to the new market (in any of the transition economies)can be facilitated (sometimes even to a great extent) by themother company. One of the aims of the survey was to exam-ine what are (if there are any) similarities and differencesbetween domestic firms and companies established by foreigninvestors [15].
6. Barriers to Entry and Growth of NewFirms in Poland
Ewa Balcerowicz
6.1. Introduction
The key element of the transition from a so-called central-ly planned economy to a market economy is to search for andto create a new owner: a private one. There are two ways tomake this change happen:
• the first one is a replacement of the state in its function ofan owner; this can be achieved through privatization of state-owned enterprises inherited from the old ('socialist') system;
• the second one is a spontaneous creation of new privatecompanies, which results in the growth of the private sectorand the increase of its share in the economy.
Privatization of state-owned enterprises turned out to be adifficult task in every country in transition. As a result, progressin privatization has appeared to be generally slower thanexpected and needed. The case of the Polish privatization is agood example here.
In Poland privatization was one of the key elements of areform program worked out in the end of 1989 and started inJanuary 1990. The first program of privatization (of November1990) was quite optimistic and envisaged privatization of 50percent of state assets in the first 3 years of the reform [see-
Blaszczyk, 1997a]. In seven years (1990–1996) 5,592 (that is66.2 percent) out of 8,441 state-owned enterprises (as of theend of 1989) initiated the transformation processes, however,only 1,898 (i.e. 22.4 percent) firms had completed the processand were privatized [Blaszczyk, 1997b]. By the end of the year1996 there were still 3,847 state-owned enterprises (see GUS1997) of which 410 were huge companies, mostly of heavyindustry and infrastructure [Blaszczyk, 1997a]. Until autumn1997 some sectors (energy, gas, water, transportation, andtelecommunication) had been totally excluded from privatiza-tion programmes [16]. Poland – a leader in reforms in 1990 haslost its position in this respect: the Czech Republic, Albania,Hungary, Estonia and Lithuania are ahead of Poland in privati-zation. In Poland 40 percent of GDP is still generated in publicsector, while in above-mentioned countries the numbers are30–35 percent [see EBRD, 1997].
In the case of Poland, a start-up of new private companieshas appeared to be a more important process for creation andgrowth of private sector than the privatization of state-ownedenterprises. The so-called 'greenfield' privatization has beenthe most dynamic phenomenon in the ownership transforma-tion of the Polish economy.
The number of one-man businesses had increased from813,145 in 1989 to 1,949,986 in 1996 (240 percent increase,see Chmiel 1998, table 5). The number of commercial codecompanies had grown dramatically (21.6 times) from about15,700 in 1989 to 340,090 in 1996 [GUS, 1997]. In the years1992–1996 the number of companies with foreign capital hadtripled: from 10,010 in the end of 1992 to 28,622 in 1996 [seeChmiel, 1998, p. 7]. The new (greenfield) private sector hadthe most dynamic development with respect to production,sales and investment.
The growth of the private sector is the main factor thatexplains the growth of the Polish economy. GDP started togrow as early as in 1992 and this trend continues. In a group of24 economies in transition, Poland is the only country with realGDP in 1996 that surpassed the level of pre-transition year of1989 [EBRD, 1997].
Yet, there has been a close connection between thegrowth of the greenfield private sector and the privatizationof state-owned enterprises. The new private sector hasabsorbed much of the assets and labour released from thestate sector. Capital and human resources came either fromliquidated and bankrupt state enterprises or from state enter-prises restructuring their activities under pressure of neweconomic environment and thus releasing resources onto themarket. The investigation of 200 largest state-owned manu-facturing enterprises showed that the total employment in a
[14] The standard definition was used here: over 50 percent of foreign participation in a company's capital.[15] Results of this investigation are presented in a comparative paper by Miklos Szanyi [1998].[16] Since October 1997, when the change of the government took place, TP SA - telecommunication company has been put on the privatiza-
tion track and initial preparatory steps started for another huge company PLL LOT.
20
Ewa Balcerowicz, Leszek Balcerowicz, Iraj Hashi
CASE Reports No. 14
200-firm sample had decreased by 35.6 percent in the years1989–1994, from 884,000 in 1989 to 569,000 in 1994 [Bal-cerowicz, 1996]. It can be assumed that the majority ofreleased labour force was absorbed by the private sector,since in that period the decrease in employment in the entireeconomy was only 8 percent.
In last three years number of entries (i.e., new firms) hasbeen growing in a slower pace than in the period of 1990–93.There are two possible factors explaining this fact:
• either the Polish market has become more competitiveand bigger capital is necessary to start-up business; or
• other conditions for doing business in Poland have wors-ened.
This chapter presents the conditions for starting anddoing business in Poland in 1990s. What follows are results ofthe detailed survey done in 96 domestic and foreign newcompanies established in Poland in the first 5 years of transi-tion period.
As it was presented in chapter 3 there are four types ofconstraints on the start-up and development of new privatecompanies:
• regulatory constraints;• information;• financial constraints, and• the environment for business and competitive conditions.All of them were subject to investigation and results of the
survey are presented below.
6.2. Regulatory Constraints
Regulatory constraints include both rules (laws) and institu-tions responsible for executing laws. They can be divided intoconstraints in:
• registration and licensing (i.e. at a start-up of a company);• regulation of real estate, labour, taxes and other contri-
bution, exports and imports which all influence the activity andgrowth of new firms.
6.2.1. Registration and Licensing
Seven stages of the registration process were examined toevaluate how difficult and/or time consuming each of the stagesis for investigated companies (for the results see Table 8). Theconclusion is that the registration process in Poland was gener-ally perceived as easy.
Obtaining of an activity-specific license (on average 3.59points; for the explanation of the scale of evaluation see Table8) was the only difficult phase. However, only 22 companiesout of 96 examined had to apply for the license, thus the major-ity of companies (77 percent) did not have to face this stage atall. This result gives an idea of a level of economic freedom onthe Polish market: it may be considered as quite high, yet, asproved by a separate study of regulatory constraints [see Bal-cerowicz, 1998], it has been gradually limited by the introduc-tion of licensing to another spheres of economic activity.
The sectoral analysis reveals that obtaining a license wasregarded as the most difficult stage by companies active in ser-vices (4.33 vis-a-vis 3.57 average for the total sample). Foreignfirms found this stage of registration more difficult than Polishcompanies did, but the subsample was very small in this case –only 5 companies.
In order to speed up the registration process new compa-nies used services of outside consultants: lawyers and otherprofessionals. High share (63 percent) of those who relied onhelp of specialists can be used as a proxy for complexity andlength of the registration procedure. This is also proved byanalysis of rules governing the registration procedures [see Bal-cerowic,z 1998, Part I]. The court has as much time as 90 daysto deal with an application. Only after registration in court, acompany can apply for registration in the statistical office(which can take up to 2 weeks). And without the statistical
Table 8. Poland: Evaluation* of Registration Process
minimum maximum mean modal median standarddeviation
number ofresponses
1. Court registration 1 5 2.33 2 2 1.07 942. Tax Office registration 1 5 1.93 2 2 0.85 953. Registration for social
insurance and health 1 4 1.83 2 2 0.80 954. Registration with the
Statistical Office 1 5 2.14 2 2 1.01 955. Obtaining criminal record 1 5 2.14 2 2 0.97 296. Opening a bank account 1 5 1.95 1 2 1.12 947. Obtaining activity-specific
license 1 5 3.59 4 4 1.23 228. Renewal of license 1 4 2.44 1 3 1.17 99. Others 1 5 4.09 5 4 1.16 11
Note: *The following scale 1 to 5 has been used for the evaluation: 1 – very easy; 2 – easy; 3 – moderate; 4 – difficult; 5 – very difficult.
21
Barriers to Entry ...
CASE Reports No. 14
identification number a new company cannot legally start itsactivity or open a bank account.
This shows that every stage takes some time and one stagedetermines the possibility of another to the extent that at leastfour out of six stages (namely: the court registration, obtaininga license, the statistical registration and opening a bankaccount) cannot be pursued parallel to each other.
Taking all these factors into consideration one may bestruck by the fact that the enterprise survey in Poland pro-duced results much better than expected. The whole registra-tion process took on average 2.75 months, that is less than themaximum official time limit for the court registration alone.However, it has to be acknowledged that there were big dif-ferences within the surveyed companies: with a minimum of 2weeks and a maximum of 20 (!) months.
Apart from the use of external consultants, bribes could beanother explanation of a relatively short length of time forcompletion of the registration procedure. The question onbribes was not asked straightforward for obvious reasons,therefore, we had to draw conclusions from answers to anindirect question [17].
It is quite interesting that over the half of owners and man-agers (54 percent) did not believe that bribes are used tospeed-up the registration process. Nevertheless, more thanone fourth of the surveyed (29 percent) answered that bribesare common. The remaining 17 percent of respondents didnot reveal their opinion.
Another significant revelation is that, contrary to what onemay expect, the highest percentage of those who do not thinkthat bribes are widely used is among companies located out ofWarsaw (83 percent). It can be explained by the fact that thesecompanies are located in less-developed regions with highunemployment rate. Courts and other registration offices insuch regions are less occupied and can process applications inshorter time. Another reason can be a positive attitude of localauthorities and administration towards new private entrepre-neurs as job creators. We mustn't forget that local authoritiesare elective and in order to get re-elected they have to satisfy
needs of their electorate. Effective local administration is oneof them.
The survey results for the capital city firms give quite anopposite picture. 37 percent of companies believe that bribesare commonly used (vis-a-vis 4 percent of regional companies),45 percent do not. Here we can use the similar type of rea-soning as for regional firms; we only need to reverse it. Thecapital city administration is heavily occupied because mostlyWarsaw attracts private investment, whereas the administra-tive capacity is not growing accordingly to the growth of pri-vate business. These two factors put together seem to explainthe increased ratio of positive answers to the question aboutbribes asked to companies in Warsaw.
6.2.2. Regulation on Real Estate
Only one third (exactly 35 percent) of companies in thePolish sample use their own premises for business; the othertwo thirds of the firms fully or partially rent the buildings orbusiness space. For companies that rent premises the mostcommon problems are the following facts:
• a rent can be increased at a short notice (48 percent ofresponses); and
• rents are high and this is due to high monopolization ofthe real estate market (38 percent of responses).
In general, the regulations on real estate are not considereda barrier. Managers and directors perceived these regulationsas having a minor effect on the establishment and growth ofcompanies (an average of 2.41 points on the scale of 1 to 5; seeTable 9 in the text).
6.2.3. Labour Regulation
Labour laws are causing problems to the vast majority (83percent) of the sample firms. The main ones are:
• too high social insurance contributions (for 82 percent ofall the sample companies and 99 percent (!) of those who com-plain of labour and employment laws;
[17] The question was: 'Do you believe that bribes are commonly used to speed up the registration process?'
Table 9. Poland: Evaluation* of Effect of Regulations on the Establishment and Growth of the Companies
minimum maximum mean modal median standarddeviation
number ofresponses
noresponse
1. Renting or purchasing ofpremises
1 5 2.41 1 2 1.39 93 3
2. Registration and licensing 1 5 2.70 2 2 1.45 84 123. Tax and contributions 1 5 4.16 5 4 0.97 96 04. Exports and imports 1 5 2.93 1 3 1.48 73 235. Health and safety 1 5 2.74 3 3 1.15 95 16. Labour laws 1 5 3.28 3 3 1.12 96 0
Note: *The following scale 1 to 5 has been used for the evaluation: 1 – no effect at all; 2 – minor effect; 3 – moderate effect; 4 – severe effect; 5 – very severe effect.
22
Ewa Balcerowicz, Leszek Balcerowicz, Iraj Hashi
CASE Reports No. 14
• the law on dismissal being too protective of employees(43 percent of the sample enterprises).
It is interesting to observe that only four Polish companiesmentioned activity of a trade union in a firm as an unfavourablefactor for the business development. An evident explanation isa non-existence of trade unions in new private enterprises.
Another observation is that private entrepreneurs did notraise an issue of the minimum wage. It seems that a fixed (inthe course of three-party one-year negotiations) level of theminimum wage is not yet a problem for private companies inPoland.
Labour laws are ranked second out of six types of regula-tions, as far as their negative effects on the establishment andgrowth of the companies are concerned (see Table 9).
6.2.4. Regulation on Taxes and other Contributions
Laws on taxes and other contributions have the strongesteffect on the establishment and growth of new private compa-nies in Poland. Managers and owners described their effect asa 'severe one' (on average 4.16 points with the modal of 5, seeTable 9).
One of the tasks of the project team was to find trends inthe period of 1990–1997. As far as regulations on tax and othercontributions in Poland are concerned, the results are as fol-lows:
• the majority of companies (73 percent) stated that theirtax and social insurance contributions as a percentage of theirrevenues had increased since their establishment; the conclu-sion is that the increasing burden put on the private companiesin Poland has resulted in an increase of costs and a decrease ofprofits and consequently – in a decrease of investment;
• according to owners and managers of private firms, theregulations on taxes and other contributions had been changedmany times (67 percent of responses);
• furthermore, these regulations had become more com-plicated in time (80 percent of responses);
The last two unfavourable changes made the majority offirms (75 percent) spend more time on dealing with taxes ascompared to the first year of the establishment. They alsomade companies use services of persons from outside of afirm, namely tax advisors. 40 percent of surveyed companiesused the services sometimes, the other 19 percent often.
6.3. Support for the SME Sector
There is a common belief shared by many economists andpolicy makers that small and medium-size companies shouldbe supported by special governmental policies. This approachis advocated also in transition economies where, on the onehand, there is much room for the growth of the private sector,but on the other hand, there is a common need to learn howto establish and run business and to have access to capital.
In the survey questionnaire there was a separate sectiondevoted to problems of an access to programmes or agenciesestablished to provide assistance for new businesses or smalland medium-size companies and about the nature of thesesupport schemes. The results of the investigation have showedthat the information about the existing programmes is verypoor: only seven firms received a support from specialschemes or agencies. Not a single company had obtained aspecial loan (a guaranteed one or one at low interest.
6.4. Financial Constraints
All domestic entrepreneurs surveyed in Poland, except forone, had used their own savings to start-up a business. Thisimportant finding has to be supplemented with the informationthat in the majority of cases, own savings were the only sourceof initial capital of the company. They constituted on average74.24 percent of initial capital in the subsample of domesticcompanies. Other sources (like loans from friends, loans frominformal capital market, restitution) were of minor importance.The bank loan had been used only in eight cases and its sharein financing of initial capital (average of the total domestic sub-sample) was 3.75 percent.
Obviously, for a small group of domestic companies thatobtained a bank loan at the start-up its share in initial capitalwas much higher. Those eight cases of bank loans seem tocontradict a widely held view that new domestic companiesdo not have any chance to obtain a bank credit at a start-up,as they do not have a track record, therefore are not trust-worthy.
As compared with domestic companies, foreign firmsrelied at a start-up mostly on foreign partner's contribution,leasing arrangements and prepayments for the contracts.These three sources accounted for as much as 51 percent ofinitial capital. Nevertheless, their own savings also played animportant role (on average 46 percent of initial capital).
The important issue to examine was the access to and useof bank loans by new small and medium-size private compa-nies in Poland. The common opinion is that in transitioneconomies small and medium-size companies have a verypoor access to bank loans. The conclusion drawn from thebelief is that the lack of external sources of finance hindersthe development of new private firms and apparently, haltsthe growth of private sector. Findings of the survey jeopar-dize these common opinions.
First of all, an important fact is that only 62 percent of thesample firms had ever received a bank loan. The other 34 per-cent of companies had not ever tried to get a bank loan. Weneed to remember that the sample consists of private compa-nies established after 1989 and before 1995, that is businesseswith a history record of at least 3 up to 7 years. Therefore, wemay assume that the percentage of those who had ever got acredit should be bigger than 62 percent.
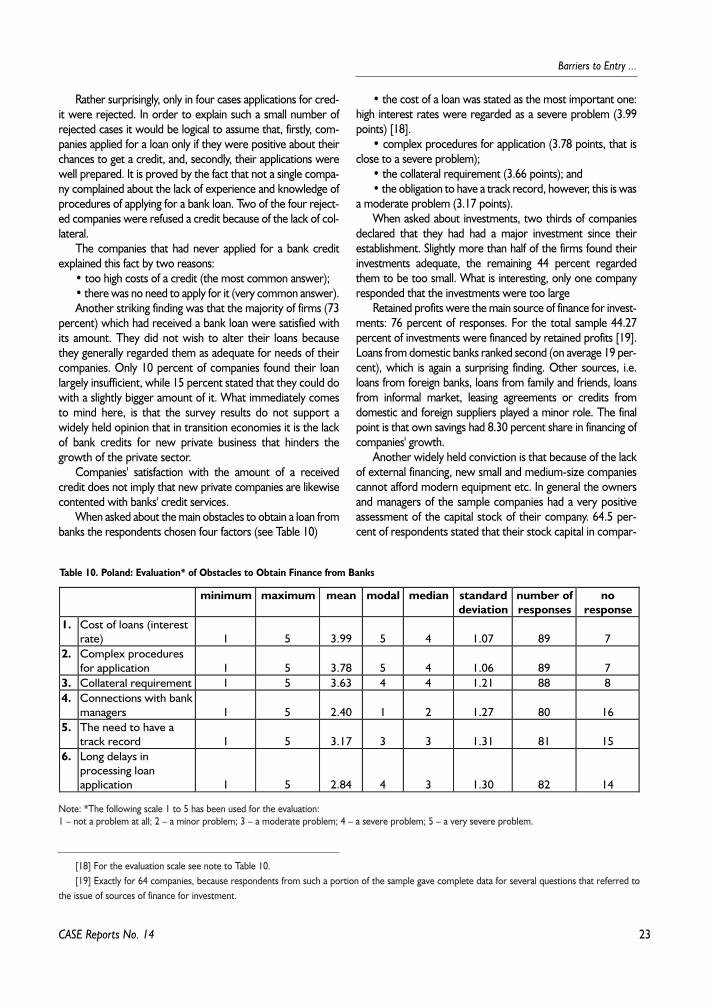
23
Barriers to Entry ...
CASE Reports No. 14
Rather surprisingly, only in four cases applications for cred-it were rejected. In order to explain such a small number ofrejected cases it would be logical to assume that, firstly, com-panies applied for a loan only if they were positive about theirchances to get a credit, and, secondly, their applications werewell prepared. It is proved by the fact that not a single compa-ny complained about the lack of experience and knowledge ofprocedures of applying for a bank loan. Two of the four reject-ed companies were refused a credit because of the lack of col-lateral.
The companies that had never applied for a bank creditexplained this fact by two reasons:
• too high costs of a credit (the most common answer);• there was no need to apply for it (very common answer).Another striking finding was that the majority of firms (73
percent) which had received a bank loan were satisfied withits amount. They did not wish to alter their loans becausethey generally regarded them as adequate for needs of theircompanies. Only 10 percent of companies found their loanlargely insufficient, while 15 percent stated that they could dowith a slightly bigger amount of it. What immediately comesto mind here, is that the survey results do not support awidely held opinion that in transition economies it is the lackof bank credits for new private business that hinders thegrowth of the private sector.
Companies' satisfaction with the amount of a receivedcredit does not imply that new private companies are likewisecontented with banks' credit services.
When asked about the main obstacles to obtain a loan frombanks the respondents chosen four factors (see Table 10)
• the cost of a loan was stated as the most important one:high interest rates were regarded as a severe problem (3.99points) [18].
• complex procedures for application (3.78 points, that isclose to a severe problem);
• the collateral requirement (3.66 points); and• the obligation to have a track record, however, this is was
a moderate problem (3.17 points).When asked about investments, two thirds of companies
declared that they had had a major investment since theirestablishment. Slightly more than half of the firms found theirinvestments adequate, the remaining 44 percent regardedthem to be too small. What is interesting, only one companyresponded that the investments were too large
Retained profits were the main source of finance for invest-ments: 76 percent of responses. For the total sample 44.27percent of investments were financed by retained profits [19].Loans from domestic banks ranked second (on average 19 per-cent), which is again a surprising finding. Other sources, i.e.loans from foreign banks, loans from family and friends, loansfrom informal market, leasing agreements or credits fromdomestic and foreign suppliers played a minor role. The finalpoint is that own savings had 8.30 percent share in financing ofcompanies' growth.
Another widely held conviction is that because of the lackof external financing, new small and medium-size companiescannot afford modern equipment etc. In general the ownersand managers of the sample companies had a very positiveassessment of the capital stock of their company. 64.5 per-cent of respondents stated that their stock capital in compar-
Table 10. Poland: Evaluation* of Obstacles to Obtain Finance from Banks
minimum maximum mean modal median standarddeviation
number ofresponses
noresponse
1. Cost of loans (interestrate) 1 5 3.99 5 4 1.07 89 7
2. Complex proceduresfor application 1 5 3.78 5 4 1.06 89 7
3. Collateral requirement 1 5 3.63 4 4 1.21 88 84. Connections with bank
managers 1 5 2.40 1 2 1.27 80 165. The need to have a
track record 1 5 3.17 3 3 1.31 81 156. Long delays in
processing loanapplication 1 5 2.84 4 3 1.30 82 14
Note: *The following scale 1 to 5 has been used for the evaluation:1 – not a problem at all; 2 – a minor problem; 3 – a moderate problem; 4 – a severe problem; 5 – a very severe problem.
[18] For the evaluation scale see note to Table 10.[19] Exactly for 64 companies, because respondents from such a portion of the sample gave complete data for several questions that referred to
the issue of sources of finance for investment.
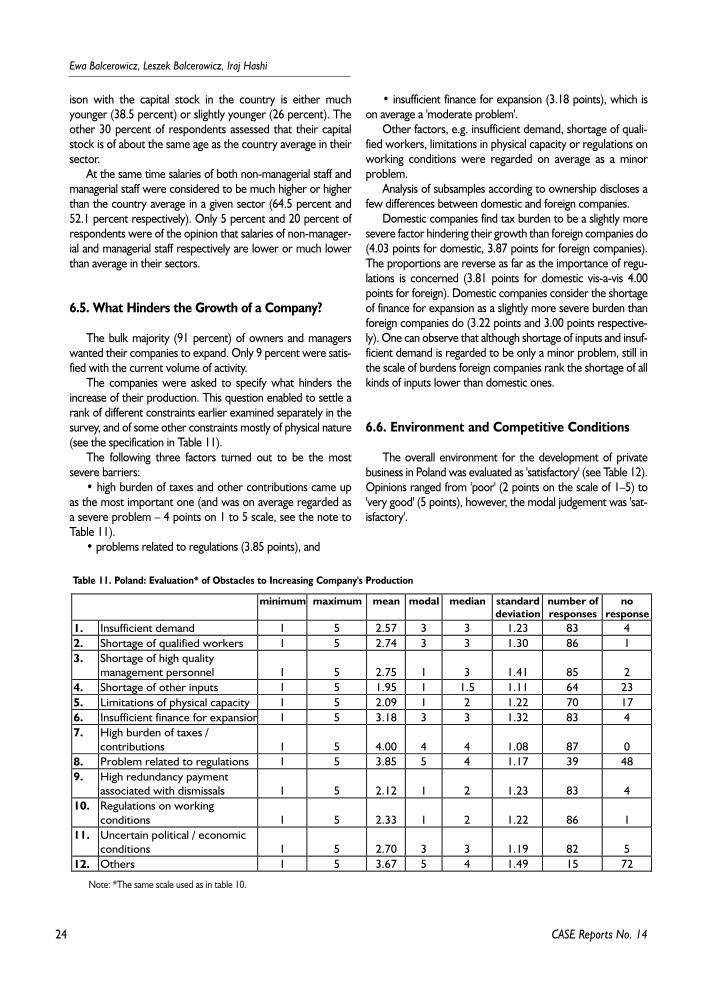
24
Ewa Balcerowicz, Leszek Balcerowicz, Iraj Hashi
ison with the capital stock in the country is either muchyounger (38.5 percent) or slightly younger (26 percent). Theother 30 percent of respondents assessed that their capitalstock is of about the same age as the country average in theirsector.
At the same time salaries of both non-managerial staff andmanagerial staff were considered to be much higher or higherthan the country average in a given sector (64.5 percent and52.1 percent respectively). Only 5 percent and 20 percent ofrespondents were of the opinion that salaries of non-manager-ial and managerial staff respectively are lower or much lowerthan average in their sectors.
6.5. What Hinders the Growth of a Company?
The bulk majority (91 percent) of owners and managerswanted their companies to expand. Only 9 percent were satis-fied with the current volume of activity.
The companies were asked to specify what hinders theincrease of their production. This question enabled to settle arank of different constraints earlier examined separately in thesurvey, and of some other constraints mostly of physical nature(see the specification in Table 11).
The following three factors turned out to be the mostsevere barriers:
• high burden of taxes and other contributions came upas the most important one (and was on average regarded asa severe problem – 4 points on 1 to 5 scale, see the note toTable 11).
• problems related to regulations (3.85 points), and
• insufficient finance for expansion (3.18 points), which ison average a 'moderate problem'.
Other factors, e.g. insufficient demand, shortage of quali-fied workers, limitations in physical capacity or regulations onworking conditions were regarded on average as a minorproblem.
Analysis of subsamples according to ownership discloses afew differences between domestic and foreign companies.
Domestic companies find tax burden to be a slightly moresevere factor hindering their growth than foreign companies do(4.03 points for domestic, 3.87 points for foreign companies).The proportions are reverse as far as the importance of regu-lations is concerned (3.81 points for domestic vis-a-vis 4.00points for foreign). Domestic companies consider the shortageof finance for expansion as a slightly more severe burden thanforeign companies do (3.22 points and 3.00 points respective-ly). One can observe that although shortage of inputs and insuf-ficient demand is regarded to be only a minor problem, still inthe scale of burdens foreign companies rank the shortage of allkinds of inputs lower than domestic ones.
6.6. Environment and Competitive Conditions
The overall environment for the development of privatebusiness in Poland was evaluated as 'satisfactory' (see Table 12).Opinions ranged from 'poor' (2 points on the scale of 1–5) to'very good' (5 points), however, the modal judgement was 'sat-isfactory'.
CASE Reports No. 14
Table 11. Poland: Evaluation* of Obstacles to Increasing Company's Production
minimum maximum mean modal median standarddeviation
number ofresponses
noresponse
1. Insufficient demand 1 5 2.57 3 3 1.23 83 42. Shortage of qualified workers 1 5 2.74 3 3 1.30 86 13. Shortage of high quality
management personnel 1 5 2.75 1 3 1.41 85 24. Shortage of other inputs 1 5 1.95 1 1.5 1.11 64 235. Limitations of physical capacity 1 5 2.09 1 2 1.22 70 176. Insufficient finance for expansion 1 5 3.18 3 3 1.32 83 47. High burden of taxes /
contributions 1 5 4.00 4 4 1.08 87 08. Problem related to regulations 1 5 3.85 5 4 1.17 39 489. High redundancy payment
associated with dismissals 1 5 2.12 1 2 1.23 83 410. Regulations on working
conditions 1 5 2.33 1 2 1.22 86 111. Uncertain political / economic
conditions 1 5 2.70 3 3 1.19 82 512. Others 1 5 3.67 5 4 1.49 15 72
Note: *The same scale used as in table 10.
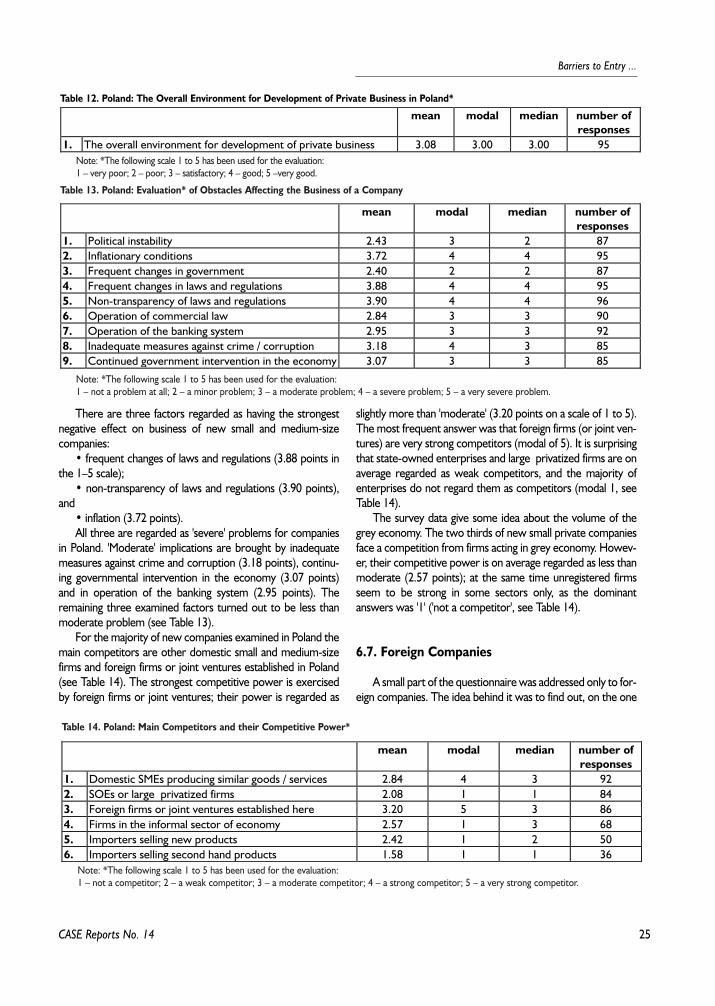
25
Barriers to Entry ...
CASE Reports No. 14
There are three factors regarded as having the strongestnegative effect on business of new small and medium-sizecompanies:
• frequent changes of laws and regulations (3.88 points inthe 1–5 scale);
• non-transparency of laws and regulations (3.90 points),and
• inflation (3.72 points).All three are regarded as 'severe' problems for companies
in Poland. 'Moderate' implications are brought by inadequatemeasures against crime and corruption (3.18 points), continu-ing governmental intervention in the economy (3.07 points)and in operation of the banking system (2.95 points). Theremaining three examined factors turned out to be less thanmoderate problem (see Table 13).
For the majority of new companies examined in Poland themain competitors are other domestic small and medium-sizefirms and foreign firms or joint ventures established in Poland(see Table 14). The strongest competitive power is exercisedby foreign firms or joint ventures; their power is regarded as
slightly more than 'moderate' (3.20 points on a scale of 1 to 5).The most frequent answer was that foreign firms (or joint ven-tures) are very strong competitors (modal of 5). It is surprisingthat state-owned enterprises and large privatized firms are onaverage regarded as weak competitors, and the majority ofenterprises do not regard them as competitors (modal 1, seeTable 14).
The survey data give some idea about the volume of thegrey economy. The two thirds of new small private companiesface a competition from firms acting in grey economy. Howev-er, their competitive power is on average regarded as less thanmoderate (2.57 points); at the same time unregistered firmsseem to be strong in some sectors only, as the dominantanswers was '1' ('not a competitor', see Table 14).
6.7. Foreign Companies
A small part of the questionnaire was addressed only to for-eign companies. The idea behind it was to find out, on the one
Table 12. Poland: The Overall Environment for Development of Private Business in Poland*
mean modal median number ofresponses
1. The overall environment for development of private business 3.08 3.00 3.00 95Note: *The following scale 1 to 5 has been used for the evaluation:1 – very poor; 2 – poor; 3 – satisfactory; 4 – good; 5 –very good.
Table 13. Poland: Evaluation* of Obstacles Affecting the Business of a Company
mean modal median number ofresponses
1. Political instability 2.43 3 2 872. Inflationary conditions 3.72 4 4 953. Frequent changes in government 2.40 2 2 874. Frequent changes in laws and regulations 3.88 4 4 955. Non-transparency of laws and regulations 3.90 4 4 966. Operation of commercial law 2.84 3 3 907. Operation of the banking system 2.95 3 3 928. Inadequate measures against crime / corruption 3.18 4 3 859. Continued government intervention in the economy 3.07 3 3 85
Note: *The following scale 1 to 5 has been used for the evaluation:1 – not a problem at all; 2 – a minor problem; 3 – a moderate problem; 4 – a severe problem; 5 – a very severe problem.
Table 14. Poland: Main Competitors and their Competitive Power*
mean modal median number ofresponses
1. Domestic SMEs producing similar goods / services 2.84 4 3 922. SOEs or large privatized firms 2.08 1 1 843. Foreign firms or joint ventures established here 3.20 5 3 864. Firms in the informal sector of economy 2.57 1 3 685. Importers selling new products 2.42 1 2 506. Importers selling second hand products 1.58 1 1 36
Note: *The following scale 1 to 5 has been used for the evaluation:1 – not a competitor; 2 – a weak competitor; 3 – a moderate competitor; 4 – a strong competitor; 5 – a very strong competitor.
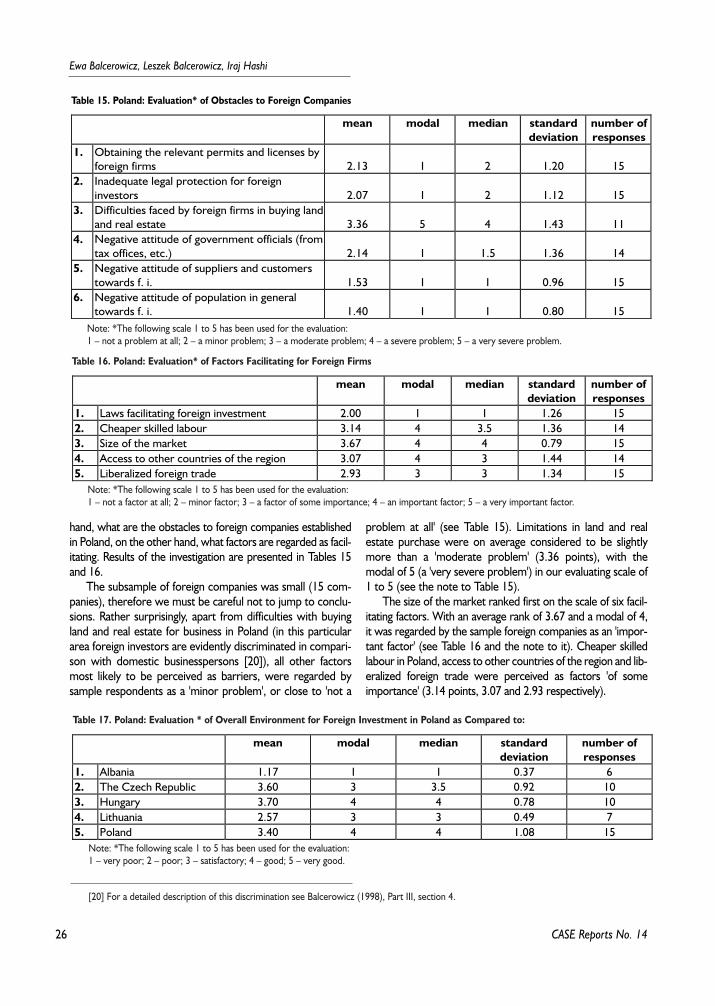
26
Ewa Balcerowicz, Leszek Balcerowicz, Iraj Hashi
CASE Reports No. 14
hand, what are the obstacles to foreign companies establishedin Poland, on the other hand, what factors are regarded as facil-itating. Results of the investigation are presented in Tables 15and 16.
The subsample of foreign companies was small (15 com-panies), therefore we must be careful not to jump to conclu-sions. Rather surprisingly, apart from difficulties with buyingland and real estate for business in Poland (in this particulararea foreign investors are evidently discriminated in compari-son with domestic businesspersons [20]), all other factorsmost likely to be perceived as barriers, were regarded bysample respondents as a 'minor problem', or close to 'not a
problem at all' (see Table 15). Limitations in land and realestate purchase were on average considered to be slightlymore than a 'moderate problem' (3.36 points), with themodal of 5 (a 'very severe problem') in our evaluating scale of1 to 5 (see the note to Table 15).
The size of the market ranked first on the scale of six facil-itating factors. With an average rank of 3.67 and a modal of 4,it was regarded by the sample foreign companies as an 'impor-tant factor' (see Table 16 and the note to it). Cheaper skilledlabour in Poland, access to other countries of the region and lib-eralized foreign trade were perceived as factors 'of someimportance' (3.14 points, 3.07 and 2.93 respectively).
Table 15. Poland: Evaluation* of Obstacles to Foreign Companies
mean modal median standarddeviation
number ofresponses
1. Obtaining the relevant permits and licenses byforeign firms 2.13 1 2 1.20 15
2. Inadequate legal protection for foreigninvestors 2.07 1 2 1.12 15
3. Difficulties faced by foreign firms in buying landand real estate 3.36 5 4 1.43 11
4. Negative attitude of government officials (fromtax offices, etc.) 2.14 1 1.5 1.36 14
5. Negative attitude of suppliers and customerstowards f. i. 1.53 1 1 0.96 15
6. Negative attitude of population in generaltowards f. i. 1.40 1 1 0.80 15
Note: *The following scale 1 to 5 has been used for the evaluation:1 – not a problem at all; 2 – a minor problem; 3 – a moderate problem; 4 – a severe problem; 5 – a very severe problem.
Table 16. Poland: Evaluation* of Factors Facilitating for Foreign Firms
mean modal median standarddeviation
number ofresponses
1. Laws facilitating foreign investment 2.00 1 1 1.26 152. Cheaper skilled labour 3.14 4 3.5 1.36 143. Size of the market 3.67 4 4 0.79 154. Access to other countries of the region 3.07 4 3 1.44 145. Liberalized foreign trade 2.93 3 3 1.34 15
Note: *The following scale 1 to 5 has been used for the evaluation:1 – not a factor at all; 2 – minor factor; 3 – a factor of some importance; 4 – an important factor; 5 – a very important factor.
[20] For a detailed description of this discrimination see Balcerowicz (1998), Part III, section 4.
Table 17. Poland: Evaluation * of Overall Environment for Foreign Investment in Poland as Compared to:
mean modal median standarddeviation
number ofresponses
1. Albania 1.17 1 1 0.37 62. The Czech Republic 3.60 3 3.5 0.92 103. Hungary 3.70 4 4 0.78 104. Lithuania 2.57 3 3 0.49 75. Poland 3.40 4 4 1.08 15
Note: *The following scale 1 to 5 has been used for the evaluation:1 – very poor; 2 – poor; 3 – satisfactory; 4 – good; 5 – very good.
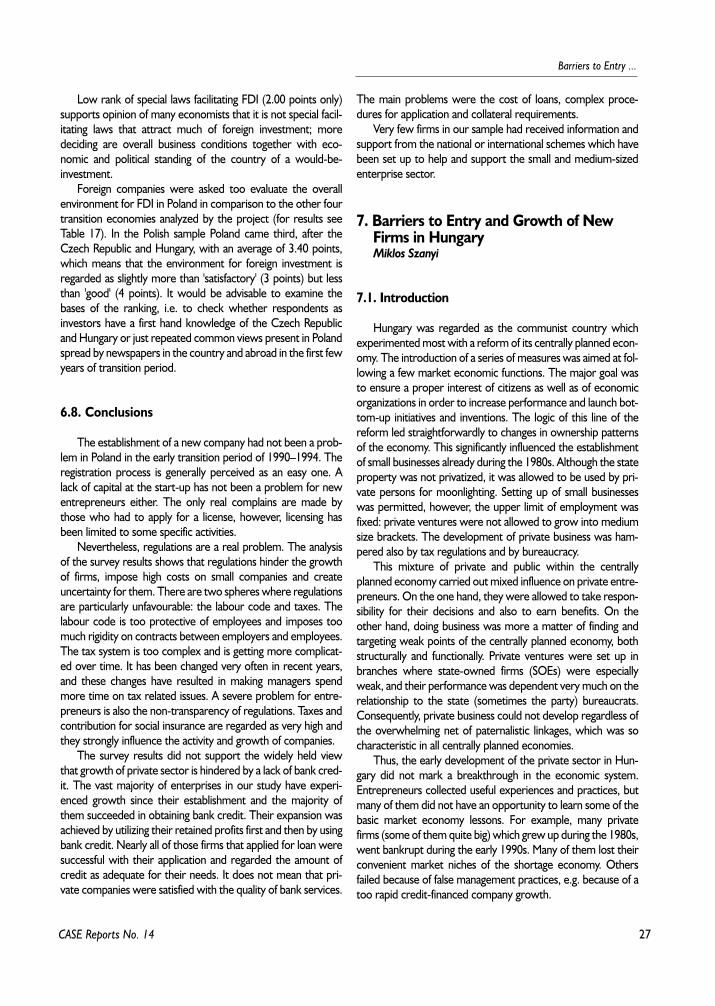
27
Barriers to Entry ...
CASE Reports No. 14
Low rank of special laws facilitating FDI (2.00 points only)supports opinion of many economists that it is not special facil-itating laws that attract much of foreign investment; moredeciding are overall business conditions together with eco-nomic and political standing of the country of a would-be-investment.
Foreign companies were asked too evaluate the overallenvironment for FDI in Poland in comparison to the other fourtransition economies analyzed by the project (for results seeTable 17). In the Polish sample Poland came third, after theCzech Republic and Hungary, with an average of 3.40 points,which means that the environment for foreign investment isregarded as slightly more than 'satisfactory' (3 points) but lessthan 'good' (4 points). It would be advisable to examine thebases of the ranking, i.e. to check whether respondents asinvestors have a first hand knowledge of the Czech Republicand Hungary or just repeated common views present in Polandspread by newspapers in the country and abroad in the first fewyears of transition period.
6.8. Conclusions
The establishment of a new company had not been a prob-lem in Poland in the early transition period of 1990–1994. Theregistration process is generally perceived as an easy one. Alack of capital at the start-up has not been a problem for newentrepreneurs either. The only real complains are made bythose who had to apply for a license, however, licensing hasbeen limited to some specific activities.
Nevertheless, regulations are a real problem. The analysisof the survey results shows that regulations hinder the growthof firms, impose high costs on small companies and createuncertainty for them. There are two spheres where regulationsare particularly unfavourable: the labour code and taxes. Thelabour code is too protective of employees and imposes toomuch rigidity on contracts between employers and employees.The tax system is too complex and is getting more complicat-ed over time. It has been changed very often in recent years,and these changes have resulted in making managers spendmore time on tax related issues. A severe problem for entre-preneurs is also the non-transparency of regulations. Taxes andcontribution for social insurance are regarded as very high andthey strongly influence the activity and growth of companies.
The survey results did not support the widely held viewthat growth of private sector is hindered by a lack of bank cred-it. The vast majority of enterprises in our study have experi-enced growth since their establishment and the majority ofthem succeeded in obtaining bank credit. Their expansion wasachieved by utilizing their retained profits first and then by usingbank credit. Nearly all of those firms that applied for loan weresuccessful with their application and regarded the amount ofcredit as adequate for their needs. It does not mean that pri-vate companies were satisfied with the quality of bank services.
The main problems were the cost of loans, complex proce-dures for application and collateral requirements.
Very few firms in our sample had received information andsupport from the national or international schemes which havebeen set up to help and support the small and medium-sizedenterprise sector.
7. Barriers to Entry and Growth of New Firms in HungaryMiklos Szanyi
7.1. Introduction
Hungary was regarded as the communist country whichexperimented most with a reform of its centrally planned econ-omy. The introduction of a series of measures was aimed at fol-lowing a few market economic functions. The major goal wasto ensure a proper interest of citizens as well as of economicorganizations in order to increase performance and launch bot-tom-up initiatives and inventions. The logic of this line of thereform led straightforwardly to changes in ownership patternsof the economy. This significantly influenced the establishmentof small businesses already during the 1980s. Although the stateproperty was not privatized, it was allowed to be used by pri-vate persons for moonlighting. Setting up of small businesseswas permitted, however, the upper limit of employment wasfixed: private ventures were not allowed to grow into mediumsize brackets. The development of private business was ham-pered also by tax regulations and by bureaucracy.
This mixture of private and public within the centrallyplanned economy carried out mixed influence on private entre-preneurs. On the one hand, they were allowed to take respon-sibility for their decisions and also to earn benefits. On theother hand, doing business was more a matter of finding andtargeting weak points of the centrally planned economy, bothstructurally and functionally. Private ventures were set up inbranches where state-owned firms (SOEs) were especiallyweak, and their performance was dependent very much on therelationship to the state (sometimes the party) bureaucrats.Consequently, private business could not develop regardless ofthe overwhelming net of paternalistic linkages, which was socharacteristic in all centrally planned economies.
Thus, the early development of the private sector in Hun-gary did not mark a breakthrough in the economic system.Entrepreneurs collected useful experiences and practices, butmany of them did not have an opportunity to learn some of thebasic market economy lessons. For example, many privatefirms (some of them quite big) which grew up during the 1980s,went bankrupt during the early 1990s. Many of them lost theirconvenient market niches of the shortage economy. Othersfailed because of false management practices, e.g. because of atoo rapid credit-financed company growth.
28
Ewa Balcerowicz, Leszek Balcerowicz, Iraj Hashi
By the end of the 1990s entrepreneurs learned theirlessons. Bankruptcies and liquidations are still quite frequent,but now different reasons stand behind them. Many failuresare deliberate and are in fact close to a fraud. In other cases,small ventures exit from the official economy only to reappearin the unregistered or grey economy. The estimated share ofthe grey-black economy in Hungary is some one third of totalGDP. The share is also pushed up by relatively high tax ratesand social security contributions. This is especially true for thesmall business, since tax evasion is the easiest and most fre-quent in this segment of the economy. It seems that negativeeffects of the government's income centralization can not becompensated by the currently carried out small business pro-motion system.
The establishment of small businesses is enhanced by a vari-ety of means.
Perhaps the most important ones were:• the tax holiday for companies which were established and
registered by the end of 1992• different preferential credit lines (among them the ones
which were provided for privatization purchases) • some sort of assistance and consulting services. Still, behind the massive increase in the number of private
entrepreneurs and new business ventures at least two moreimportant factors can be identified. The first one relates to theorganizational break-up of once big SOEs. During the period1988–92 a large number of SOEs established new ventures bythe dozens partly in order to siphon state property out ofSOEs, partly because the formerly integrate network of indus-trial companies needed reorganization and the establishment ofindependently functioning units.
The other important process, which increased a number ofsmall businesses, was the forced entrepreneurship. Private per-sons who actually took up a job as employees had to establish anew business entity in order to get the job. Hiring another busi-ness entity is significantly cheaper for companies than to employ
private persons on regular bases. Moreover, employees aremore flexible this way. In other cases employees themselvesdecided to be contracted as a business entity rather than as aregular employee in order to spare on taxes. The large numberof forced entrepreneurs would skip back to regular employ-ment as soon as financial conditions allowed them to do so.
Because of a rather complicated structure of the group ofsmall businesses and difficulties in interpreting the statistical fig-ures it is crucial to obtain more information from empirical sur-veys. This paper contains the main results of such a survey,which was carried out in Hungary in the years 1996–1997.
7.2. Regulatory Barriers to Entry
Similarly to Poland, the registration in Hungary did not pre-sent serious problems for entrants. The registration was usual-ly facilitated by outside experts such as e.g. lawyers. Ownersand managers did not bother much about it (85 cases out of100). Only 14 companies reported that their registrationprocess took over 12 months, with the longest period of 36months. In the case of the remaining 86 companies, however,we should not consider the registration process to be com-pletely finished, rather, we should think that necessary permitsfor starting operation were obtained.
A court decree about registration is not necessary in Hun-gary to start up the economic activity, yet, there are a fewmaneuvers which require court registration. Banks, for exam-ple, do not usually extend loans to firms which have no validcourt registration.
Owners and managers perceived the registration processas an act of preparation of necessary supplements, registeringat the tax, health and statistical offices and opening a bankaccount. Accordingly, the highest rank as 'barrier' was only 2.7on the 5-degree scale for the court registration and for theobtaining of activity-specific certificates and licenses (see Table
CASE Reports No. 14
Table 18. Hungary: Evaluation* of Registration Process
minimum maximum mean modal median standarddeviation
number ofresponses
1. Court registration 1 5 2.7 3 3 1.3 982. Tax Office registration 1 5 2.0 1 2 1.0 983. Registration for social
insurance and health 1 4 2.0 2 2 0.9 984. Registration with the
Statistical Office 1 5 1.9 1 2 0.9 965. Obtaining criminal record 1 4 1.6 1 1 0.7 756. Opening a bank account 1 4 1.8 1 2 0.9 997. Obtaining activity-specific
license 1 5 2.7 3 3 1.4 678. Renewal of license 1 4 2.4 1 2.5 1.2 269. Others 1 5 4.7 5 5 0.6 3Note: *The following scale 1 to 5 has been used for the evaluation: 1 – very easy; 2 – easy; 3 – moderate; 4 – difficult; 5 – very difficult.
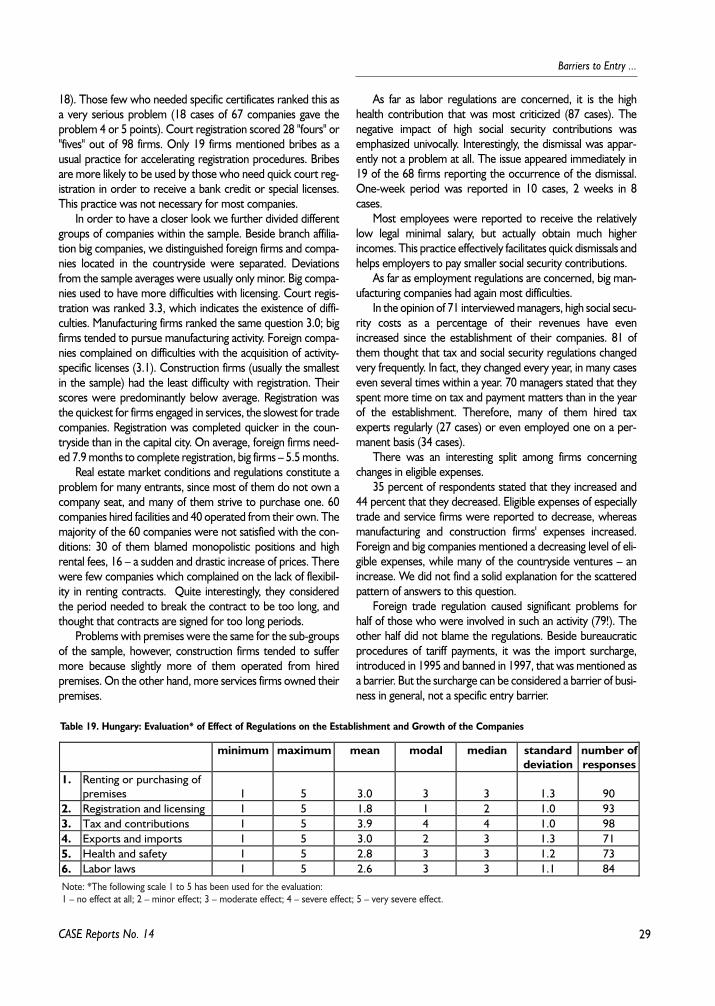
29
Barriers to Entry ...
18). Those few who needed specific certificates ranked this asa very serious problem (18 cases of 67 companies gave theproblem 4 or 5 points). Court registration scored 28 "fours" or"fives" out of 98 firms. Only 19 firms mentioned bribes as ausual practice for accelerating registration procedures. Bribesare more likely to be used by those who need quick court reg-istration in order to receive a bank credit or special licenses.This practice was not necessary for most companies.
In order to have a closer look we further divided differentgroups of companies within the sample. Beside branch affilia-tion big companies, we distinguished foreign firms and compa-nies located in the countryside were separated. Deviationsfrom the sample averages were usually only minor. Big compa-nies used to have more difficulties with licensing. Court regis-tration was ranked 3.3, which indicates the existence of diffi-culties. Manufacturing firms ranked the same question 3.0; bigfirms tended to pursue manufacturing activity. Foreign compa-nies complained on difficulties with the acquisition of activity-specific licenses (3.1). Construction firms (usually the smallestin the sample) had the least difficulty with registration. Theirscores were predominantly below average. Registration wasthe quickest for firms engaged in services, the slowest for tradecompanies. Registration was completed quicker in the coun-tryside than in the capital city. On average, foreign firms need-ed 7.9 months to complete registration, big firms – 5.5 months.
Real estate market conditions and regulations constitute aproblem for many entrants, since most of them do not own acompany seat, and many of them strive to purchase one. 60companies hired facilities and 40 operated from their own. Themajority of the 60 companies were not satisfied with the con-ditions: 30 of them blamed monopolistic positions and highrental fees, 16 – a sudden and drastic increase of prices. Therewere few companies which complained on the lack of flexibil-ity in renting contracts. Quite interestingly, they consideredthe period needed to break the contract to be too long, andthought that contracts are signed for too long periods.
Problems with premises were the same for the sub-groupsof the sample, however, construction firms tended to suffermore because slightly more of them operated from hiredpremises. On the other hand, more services firms owned theirpremises.
As far as labor regulations are concerned, it is the highhealth contribution that was most criticized (87 cases). Thenegative impact of high social security contributions wasemphasized univocally. Interestingly, the dismissal was appar-ently not a problem at all. The issue appeared immediately in19 of the 68 firms reporting the occurrence of the dismissal.One-week period was reported in 10 cases, 2 weeks in 8cases.
Most employees were reported to receive the relativelylow legal minimal salary, but actually obtain much higherincomes. This practice effectively facilitates quick dismissals andhelps employers to pay smaller social security contributions.
As far as employment regulations are concerned, big man-ufacturing companies had again most difficulties.
In the opinion of 71 interviewed managers, high social secu-rity costs as a percentage of their revenues have evenincreased since the establishment of their companies. 81 ofthem thought that tax and social security regulations changedvery frequently. In fact, they changed every year, in many caseseven several times within a year. 70 managers stated that theyspent more time on tax and payment matters than in the yearof the establishment. Therefore, many of them hired taxexperts regularly (27 cases) or even employed one on a per-manent basis (34 cases).
There was an interesting split among firms concerningchanges in eligible expenses.
35 percent of respondents stated that they increased and44 percent that they decreased. Eligible expenses of especiallytrade and service firms were reported to decrease, whereasmanufacturing and construction firms' expenses increased.Foreign and big companies mentioned a decreasing level of eli-gible expenses, while many of the countryside ventures – anincrease. We did not find a solid explanation for the scatteredpattern of answers to this question.
Foreign trade regulation caused significant problems forhalf of those who were involved in such an activity (79!). Theother half did not blame the regulations. Beside bureaucraticprocedures of tariff payments, it was the import surcharge,introduced in 1995 and banned in 1997, that was mentioned asa barrier. But the surcharge can be considered a barrier of busi-ness in general, not a specific entry barrier.
CASE Reports No. 14
Table 19. Hungary: Evaluation* of Effect of Regulations on the Establishment and Growth of the Companies
minimum maximum mean modal median standarddeviation
number ofresponses
1. Renting or purchasing ofpremises 1 5 3.0 3 3 1.3 90
2. Registration and licensing 1 5 1.8 1 2 1.0 933. Tax and contributions 1 5 3.9 4 4 1.0 984. Exports and imports 1 5 3.0 2 3 1.3 715. Health and safety 1 5 2.8 3 3 1.2 736. Labor laws 1 5 2.6 3 3 1.1 84Note: *The following scale 1 to 5 has been used for the evaluation: 1 – no effect at all; 2 – minor effect; 3 – moderate effect; 4 – severe effect; 5 – very severe effect.
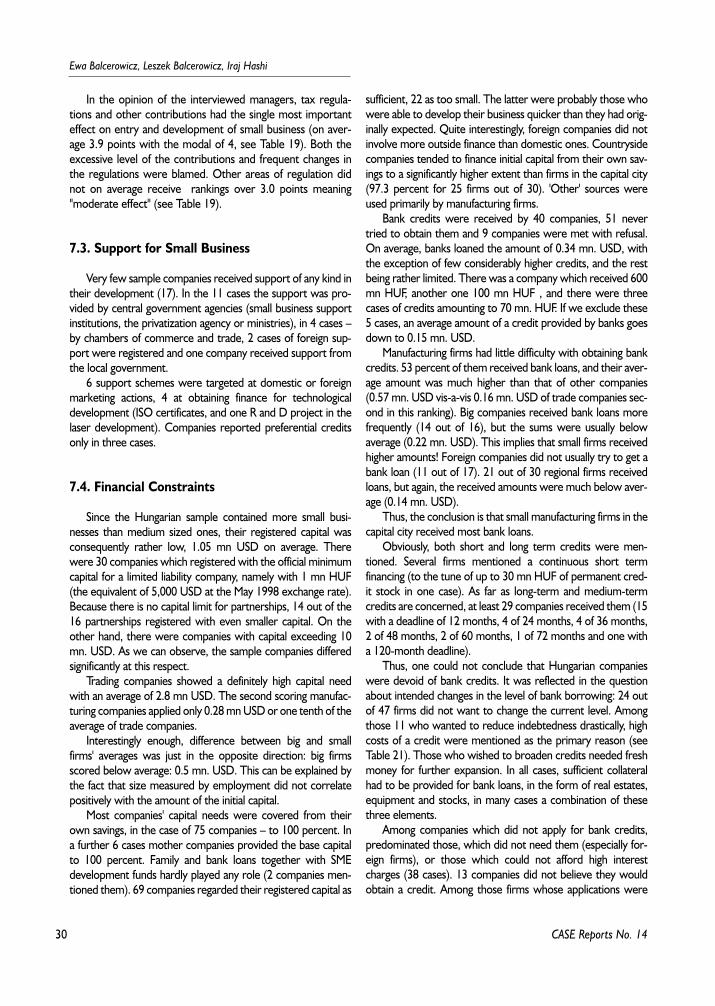
30
Ewa Balcerowicz, Leszek Balcerowicz, Iraj Hashi
CASE Reports No. 14
In the opinion of the interviewed managers, tax regula-tions and other contributions had the single most importanteffect on entry and development of small business (on aver-age 3.9 points with the modal of 4, see Table 19). Both theexcessive level of the contributions and frequent changes inthe regulations were blamed. Other areas of regulation didnot on average receive rankings over 3.0 points meaning"moderate effect" (see Table 19).
7.3. Support for Small Business
Very few sample companies received support of any kind intheir development (17). In the 11 cases the support was pro-vided by central government agencies (small business supportinstitutions, the privatization agency or ministries), in 4 cases –by chambers of commerce and trade, 2 cases of foreign sup-port were registered and one company received support fromthe local government.
6 support schemes were targeted at domestic or foreignmarketing actions, 4 at obtaining finance for technologicaldevelopment (ISO certificates, and one R and D project in thelaser development). Companies reported preferential creditsonly in three cases.
7.4. Financial Constraints
Since the Hungarian sample contained more small busi-nesses than medium sized ones, their registered capital wasconsequently rather low, 1.05 mn USD on average. Therewere 30 companies which registered with the official minimumcapital for a limited liability company, namely with 1 mn HUF(the equivalent of 5,000 USD at the May 1998 exchange rate).Because there is no capital limit for partnerships, 14 out of the16 partnerships registered with even smaller capital. On theother hand, there were companies with capital exceeding 10mn. USD. As we can observe, the sample companies differedsignificantly at this respect.
Trading companies showed a definitely high capital needwith an average of 2.8 mn USD. The second scoring manufac-turing companies applied only 0.28 mn USD or one tenth of theaverage of trade companies.
Interestingly enough, difference between big and smallfirms' averages was just in the opposite direction: big firmsscored below average: 0.5 mn. USD. This can be explained bythe fact that size measured by employment did not correlatepositively with the amount of the initial capital.
Most companies' capital needs were covered from theirown savings, in the case of 75 companies – to 100 percent. Ina further 6 cases mother companies provided the base capitalto 100 percent. Family and bank loans together with SMEdevelopment funds hardly played any role (2 companies men-tioned them). 69 companies regarded their registered capital as
sufficient, 22 as too small. The latter were probably those whowere able to develop their business quicker than they had orig-inally expected. Quite interestingly, foreign companies did notinvolve more outside finance than domestic ones. Countrysidecompanies tended to finance initial capital from their own sav-ings to a significantly higher extent than firms in the capital city(97.3 percent for 25 firms out of 30). 'Other' sources wereused primarily by manufacturing firms.
Bank credits were received by 40 companies, 51 nevertried to obtain them and 9 companies were met with refusal.On average, banks loaned the amount of 0.34 mn. USD, withthe exception of few considerably higher credits, and the restbeing rather limited. There was a company which received 600mn HUF, another one 100 mn HUF , and there were threecases of credits amounting to 70 mn. HUF. If we exclude these5 cases, an average amount of a credit provided by banks goesdown to 0.15 mn. USD.
Manufacturing firms had little difficulty with obtaining bankcredits. 53 percent of them received bank loans, and their aver-age amount was much higher than that of other companies(0.57 mn. USD vis-a-vis 0.16 mn. USD of trade companies sec-ond in this ranking). Big companies received bank loans morefrequently (14 out of 16), but the sums were usually belowaverage (0.22 mn. USD). This implies that small firms receivedhigher amounts! Foreign companies did not usually try to get abank loan (11 out of 17). 21 out of 30 regional firms receivedloans, but again, the received amounts were much below aver-age (0.14 mn. USD).
Thus, the conclusion is that small manufacturing firms in thecapital city received most bank loans.
Obviously, both short and long term credits were men-tioned. Several firms mentioned a continuous short termfinancing (to the tune of up to 30 mn HUF of permanent cred-it stock in one case). As far as long-term and medium-termcredits are concerned, at least 29 companies received them (15with a deadline of 12 months, 4 of 24 months, 4 of 36 months,2 of 48 months, 2 of 60 months, 1 of 72 months and one witha 120-month deadline).
Thus, one could not conclude that Hungarian companieswere devoid of bank credits. It was reflected in the questionabout intended changes in the level of bank borrowing: 24 outof 47 firms did not want to change the current level. Amongthose 11 who wanted to reduce indebtedness drastically, highcosts of a credit were mentioned as the primary reason (seeTable 21). Those who wished to broaden credits needed freshmoney for further expansion. In all cases, sufficient collateralhad to be provided for bank loans, in the form of real estates,equipment and stocks, in many cases a combination of thesethree elements.
Among companies which did not apply for bank credits,predominated those, which did not need them (especially for-eign firms), or those which could not afford high interestcharges (38 cases). 13 companies did not believe they wouldobtain a credit. Among those firms whose applications were
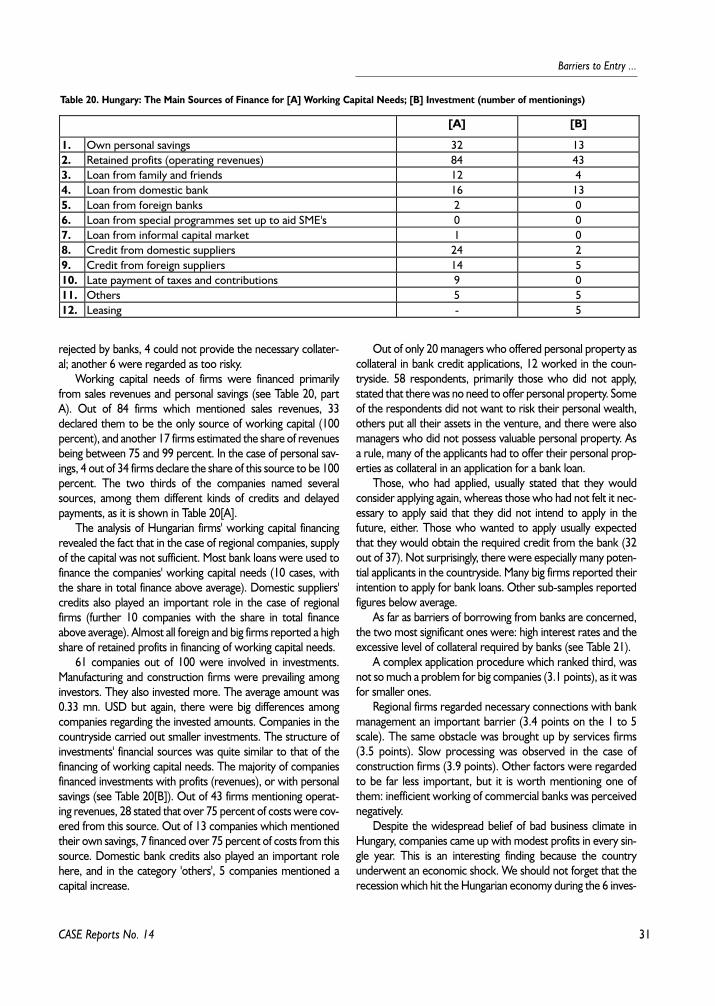
31
Barriers to Entry ...
CASE Reports No. 14
rejected by banks, 4 could not provide the necessary collater-al; another 6 were regarded as too risky.
Working capital needs of firms were financed primarilyfrom sales revenues and personal savings (see Table 20, partA). Out of 84 firms which mentioned sales revenues, 33declared them to be the only source of working capital (100percent), and another 17 firms estimated the share of revenuesbeing between 75 and 99 percent. In the case of personal sav-ings, 4 out of 34 firms declare the share of this source to be 100percent. The two thirds of the companies named severalsources, among them different kinds of credits and delayedpayments, as it is shown in Table 20[A].
The analysis of Hungarian firms' working capital financingrevealed the fact that in the case of regional companies, supplyof the capital was not sufficient. Most bank loans were used tofinance the companies' working capital needs (10 cases, withthe share in total finance above average). Domestic suppliers'credits also played an important role in the case of regionalfirms (further 10 companies with the share in total financeabove average). Almost all foreign and big firms reported a highshare of retained profits in financing of working capital needs.
61 companies out of 100 were involved in investments.Manufacturing and construction firms were prevailing amonginvestors. They also invested more. The average amount was0.33 mn. USD but again, there were big differences amongcompanies regarding the invested amounts. Companies in thecountryside carried out smaller investments. The structure ofinvestments' financial sources was quite similar to that of thefinancing of working capital needs. The majority of companiesfinanced investments with profits (revenues), or with personalsavings (see Table 20[B]). Out of 43 firms mentioning operat-ing revenues, 28 stated that over 75 percent of costs were cov-ered from this source. Out of 13 companies which mentionedtheir own savings, 7 financed over 75 percent of costs from thissource. Domestic bank credits also played an important rolehere, and in the category 'others', 5 companies mentioned acapital increase.
Out of only 20 managers who offered personal property ascollateral in bank credit applications, 12 worked in the coun-tryside. 58 respondents, primarily those who did not apply,stated that there was no need to offer personal property. Someof the respondents did not want to risk their personal wealth,others put all their assets in the venture, and there were alsomanagers who did not possess valuable personal property. Asa rule, many of the applicants had to offer their personal prop-erties as collateral in an application for a bank loan.
Those, who had applied, usually stated that they wouldconsider applying again, whereas those who had not felt it nec-essary to apply said that they did not intend to apply in thefuture, either. Those who wanted to apply usually expectedthat they would obtain the required credit from the bank (32out of 37). Not surprisingly, there were especially many poten-tial applicants in the countryside. Many big firms reported theirintention to apply for bank loans. Other sub-samples reportedfigures below average.
As far as barriers of borrowing from banks are concerned,the two most significant ones were: high interest rates and theexcessive level of collateral required by banks (see Table 21).
A complex application procedure which ranked third, wasnot so much a problem for big companies (3.1 points), as it wasfor smaller ones.
Regional firms regarded necessary connections with bankmanagement an important barrier (3.4 points on the 1 to 5scale). The same obstacle was brought up by services firms(3.5 points). Slow processing was observed in the case ofconstruction firms (3.9 points). Other factors were regardedto be far less important, but it is worth mentioning one ofthem: inefficient working of commercial banks was perceivednegatively.
Despite the widespread belief of bad business climate inHungary, companies came up with modest profits in every sin-gle year. This is an interesting finding because the countryunderwent an economic shock. We should not forget that therecession which hit the Hungarian economy during the 6 inves-
Table 20. Hungary: The Main Sources of Finance for [A] Working Capital Needs; [B] Investment (number of mentionings)
[A] [B]
1. Own personal savings 32 132. Retained profits (operating revenues) 84 433. Loan from family and friends 12 44. Loan from domestic bank 16 135. Loan from foreign banks 2 06. Loan from special programmes set up to aid SME's 0 07. Loan from informal capital market 1 08. Credit from domestic suppliers 24 29. Credit from foreign suppliers 14 510. Late payment of taxes and contributions 9 011. Others 5 512. Leasing - 5
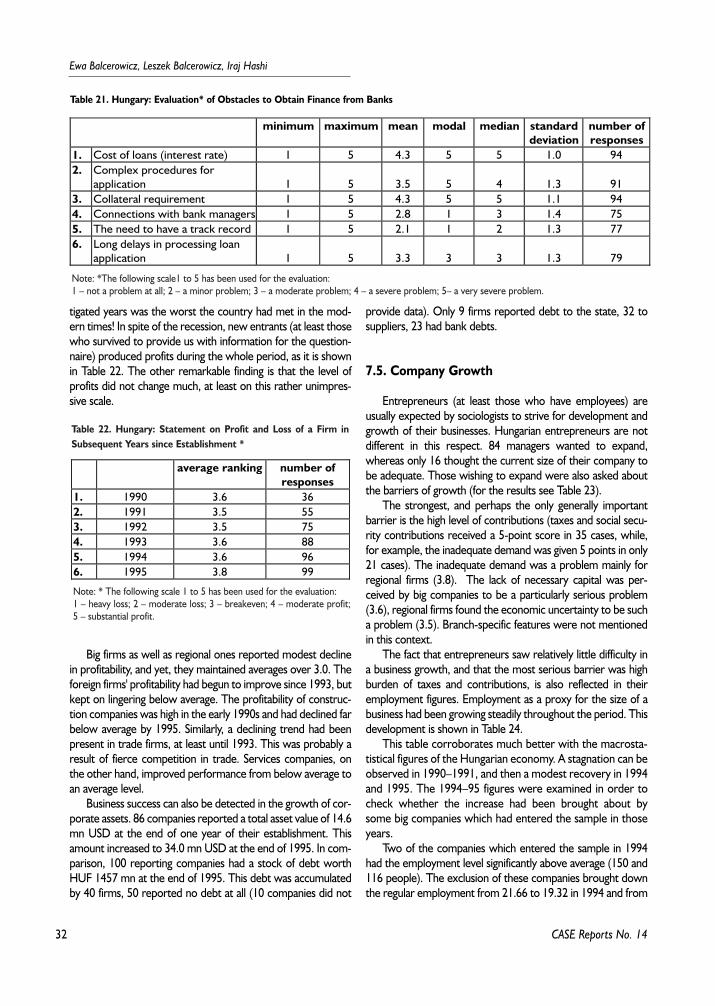
32
Ewa Balcerowicz, Leszek Balcerowicz, Iraj Hashi
CASE Reports No. 14
tigated years was the worst the country had met in the mod-ern times! In spite of the recession, new entrants (at least thosewho survived to provide us with information for the question-naire) produced profits during the whole period, as it is shownin Table 22. The other remarkable finding is that the level ofprofits did not change much, at least on this rather unimpres-sive scale.
Big firms as well as regional ones reported modest declinein profitability, and yet, they maintained averages over 3.0. Theforeign firms' profitability had begun to improve since 1993, butkept on lingering below average. The profitability of construc-tion companies was high in the early 1990s and had declined farbelow average by 1995. Similarly, a declining trend had beenpresent in trade firms, at least until 1993. This was probably aresult of fierce competition in trade. Services companies, onthe other hand, improved performance from below average toan average level.
Business success can also be detected in the growth of cor-porate assets. 86 companies reported a total asset value of 14.6mn USD at the end of one year of their establishment. Thisamount increased to 34.0 mn USD at the end of 1995. In com-parison, 100 reporting companies had a stock of debt worthHUF 1457 mn at the end of 1995. This debt was accumulatedby 40 firms, 50 reported no debt at all (10 companies did not
provide data). Only 9 firms reported debt to the state, 32 tosuppliers, 23 had bank debts.
7.5. Company Growth
Entrepreneurs (at least those who have employees) areusually expected by sociologists to strive for development andgrowth of their businesses. Hungarian entrepreneurs are notdifferent in this respect. 84 managers wanted to expand,whereas only 16 thought the current size of their company tobe adequate. Those wishing to expand were also asked aboutthe barriers of growth (for the results see Table 23).
The strongest, and perhaps the only generally importantbarrier is the high level of contributions (taxes and social secu-rity contributions received a 5-point score in 35 cases, while,for example, the inadequate demand was given 5 points in only21 cases). The inadequate demand was a problem mainly forregional firms (3.8). The lack of necessary capital was per-ceived by big companies to be a particularly serious problem(3.6), regional firms found the economic uncertainty to be sucha problem (3.5). Branch-specific features were not mentionedin this context.
The fact that entrepreneurs saw relatively little difficulty ina business growth, and that the most serious barrier was highburden of taxes and contributions, is also reflected in theiremployment figures. Employment as a proxy for the size of abusiness had been growing steadily throughout the period. Thisdevelopment is shown in Table 24.
This table corroborates much better with the macrosta-tistical figures of the Hungarian economy. A stagnation can beobserved in 1990–1991, and then a modest recovery in 1994and 1995. The 1994–95 figures were examined in order tocheck whether the increase had been brought about bysome big companies which had entered the sample in thoseyears.
Two of the companies which entered the sample in 1994had the employment level significantly above average (150 and116 people). The exclusion of these companies brought downthe regular employment from 21.66 to 19.32 in 1994 and from
Table 21. Hungary: Evaluation* of Obstacles to Obtain Finance from Banks
minimum maximum mean modal median standarddeviation
number ofresponses
1. Cost of loans (interest rate) 1 5 4.3 5 5 1.0 942. Complex procedures for
application 1 5 3.5 5 4 1.3 913. Collateral requirement 1 5 4.3 5 5 1.1 944. Connections with bank managers 1 5 2.8 1 3 1.4 755. The need to have a track record 1 5 2.1 1 2 1.3 776. Long delays in processing loan
application 1 5 3.3 3 3 1.3 79
Note: *The following scale1 to 5 has been used for the evaluation:1 – not a problem at all; 2 – a minor problem; 3 – a moderate problem; 4 – a severe problem; 5– a very severe problem.
Table 22. Hungary: Statement on Profit and Loss of a Firm inSubsequent Years since Establishment *
average ranking number ofresponses
1. 1990 3.6 362. 1991 3.5 553. 1992 3.5 754. 1993 3.6 885. 1994 3.6 966. 1995 3.8 99
Note: * The following scale 1 to 5 has been used for the evaluation:1 – heavy loss; 2 – moderate loss; 3 – breakeven; 4 – moderate profit;5 – substantial profit.
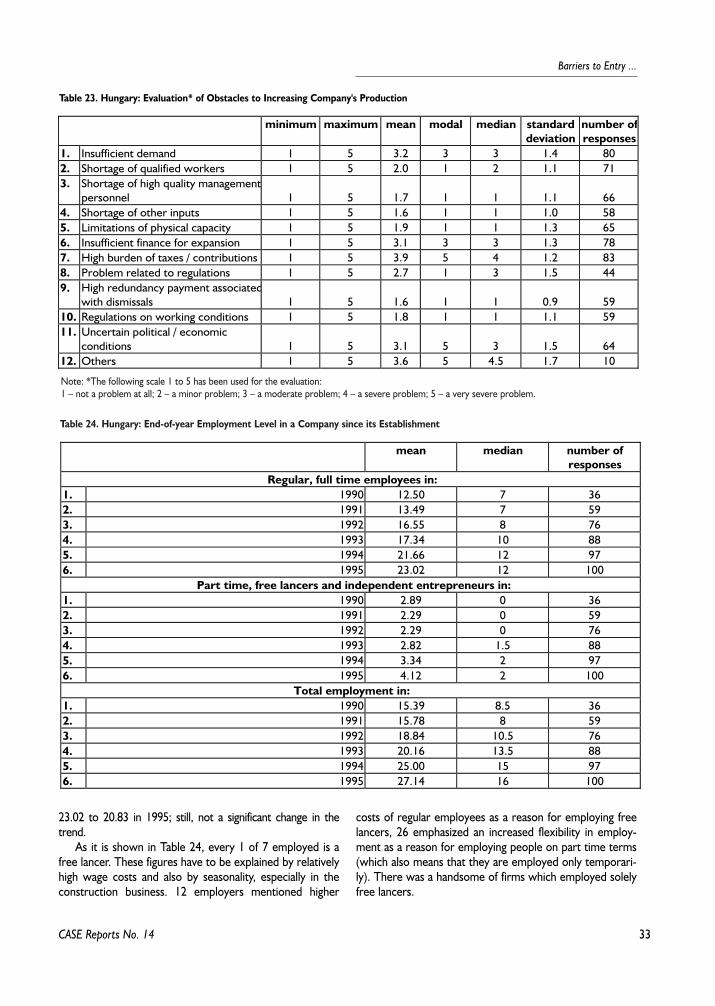
33
Barriers to Entry ...
CASE Reports No. 14
23.02 to 20.83 in 1995; still, not a significant change in thetrend.
As it is shown in Table 24, every 1 of 7 employed is afree lancer. These figures have to be explained by relativelyhigh wage costs and also by seasonality, especially in theconstruction business. 12 employers mentioned higher
costs of regular employees as a reason for employing freelancers, 26 emphasized an increased flexibility in employ-ment as a reason for employing people on part time terms(which also means that they are employed only temporari-ly). There was a handsome of firms which employed solelyfree lancers.
Table 23. Hungary: Evaluation* of Obstacles to Increasing Company's Production
minimum maximum mean modal median standarddeviation
number ofresponses
1. Insufficient demand 1 5 3.2 3 3 1.4 802. Shortage of qualified workers 1 5 2.0 1 2 1.1 713. Shortage of high quality management
personnel 1 5 1.7 1 1 1.1 664. Shortage of other inputs 1 5 1.6 1 1 1.0 585. Limitations of physical capacity 1 5 1.9 1 1 1.3 656. Insufficient finance for expansion 1 5 3.1 3 3 1.3 787. High burden of taxes / contributions 1 5 3.9 5 4 1.2 838. Problem related to regulations 1 5 2.7 1 3 1.5 449. High redundancy payment associated
with dismissals 1 5 1.6 1 1 0.9 5910. Regulations on working conditions 1 5 1.8 1 1 1.1 5911. Uncertain political / economic
conditions 1 5 3.1 5 3 1.5 6412. Others 1 5 3.6 5 4.5 1.7 10
Note: *The following scale 1 to 5 has been used for the evaluation:1 – not a problem at all; 2 – a minor problem; 3 – a moderate problem; 4 – a severe problem; 5 – a very severe problem.
Table 24. Hungary: End-of-year Employment Level in a Company since its Establishment
mean median number ofresponses
Regular, full time employees in:1. 1990 12.50 7 362. 1991 13.49 7 593. 1992 16.55 8 764. 1993 17.34 10 885. 1994 21.66 12 976. 1995 23.02 12 100
Part time, free lancers and independent entrepreneurs in:1. 1990 2.89 0 362. 1991 2.29 0 593. 1992 2.29 0 764. 1993 2.82 1.5 885. 1994 3.34 2 976. 1995 4.12 2 100
Total employment in:1. 1990 15.39 8.5 362. 1991 15.78 8 593. 1992 18.84 10.5 764. 1993 20.16 13.5 885. 1994 25.00 15 976. 1995 27.14 16 100
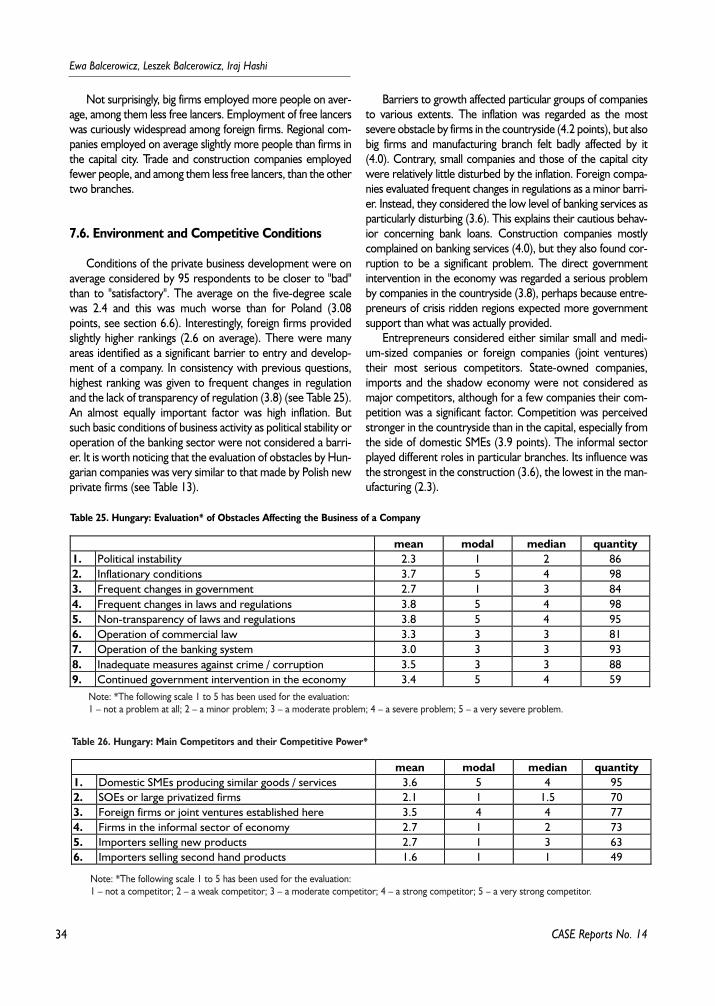
34
Ewa Balcerowicz, Leszek Balcerowicz, Iraj Hashi
Not surprisingly, big firms employed more people on aver-age, among them less free lancers. Employment of free lancerswas curiously widespread among foreign firms. Regional com-panies employed on average slightly more people than firms inthe capital city. Trade and construction companies employedfewer people, and among them less free lancers, than the othertwo branches.
7.6. Environment and Competitive Conditions
Conditions of the private business development were onaverage considered by 95 respondents to be closer to "bad"than to "satisfactory". The average on the five-degree scalewas 2.4 and this was much worse than for Poland (3.08points, see section 6.6). Interestingly, foreign firms providedslightly higher rankings (2.6 on average). There were manyareas identified as a significant barrier to entry and develop-ment of a company. In consistency with previous questions,highest ranking was given to frequent changes in regulationand the lack of transparency of regulation (3.8) (see Table 25).An almost equally important factor was high inflation. Butsuch basic conditions of business activity as political stability oroperation of the banking sector were not considered a barri-er. It is worth noticing that the evaluation of obstacles by Hun-garian companies was very similar to that made by Polish newprivate firms (see Table 13).
Barriers to growth affected particular groups of companiesto various extents. The inflation was regarded as the mostsevere obstacle by firms in the countryside (4.2 points), but alsobig firms and manufacturing branch felt badly affected by it(4.0). Contrary, small companies and those of the capital citywere relatively little disturbed by the inflation. Foreign compa-nies evaluated frequent changes in regulations as a minor barri-er. Instead, they considered the low level of banking services asparticularly disturbing (3.6). This explains their cautious behav-ior concerning bank loans. Construction companies mostlycomplained on banking services (4.0), but they also found cor-ruption to be a significant problem. The direct governmentintervention in the economy was regarded a serious problemby companies in the countryside (3.8), perhaps because entre-preneurs of crisis ridden regions expected more governmentsupport than what was actually provided.
Entrepreneurs considered either similar small and medi-um-sized companies or foreign companies (joint ventures)their most serious competitors. State-owned companies,imports and the shadow economy were not considered asmajor competitors, although for a few companies their com-petition was a significant factor. Competition was perceivedstronger in the countryside than in the capital, especially fromthe side of domestic SMEs (3.9 points). The informal sectorplayed different roles in particular branches. Its influence wasthe strongest in the construction (3.6), the lowest in the man-ufacturing (2.3).
CASE Reports No. 14
Table 25. Hungary: Evaluation* of Obstacles Affecting the Business of a Company
mean modal median quantity1. Political instability 2.3 1 2 862. Inflationary conditions 3.7 5 4 983. Frequent changes in government 2.7 1 3 844. Frequent changes in laws and regulations 3.8 5 4 985. Non-transparency of laws and regulations 3.8 5 4 956. Operation of commercial law 3.3 3 3 817. Operation of the banking system 3.0 3 3 938. Inadequate measures against crime / corruption 3.5 3 3 889. Continued government intervention in the economy 3.4 5 4 59
Note: *The following scale 1 to 5 has been used for the evaluation:1 – not a problem at all; 2 – a minor problem; 3 – a moderate problem; 4 – a severe problem; 5 – a very severe problem.
Table 26. Hungary: Main Competitors and their Competitive Power*
mean modal median quantity1. Domestic SMEs producing similar goods / services 3.6 5 4 952. SOEs or large privatized firms 2.1 1 1.5 703. Foreign firms or joint ventures established here 3.5 4 4 774. Firms in the informal sector of economy 2.7 1 2 735. Importers selling new products 2.7 1 3 636. Importers selling second hand products 1.6 1 1 49
Note: *The following scale 1 to 5 has been used for the evaluation:1 – not a competitor; 2 – a weak competitor; 3 – a moderate competitor; 4 – a strong competitor; 5 – a very strong competitor.
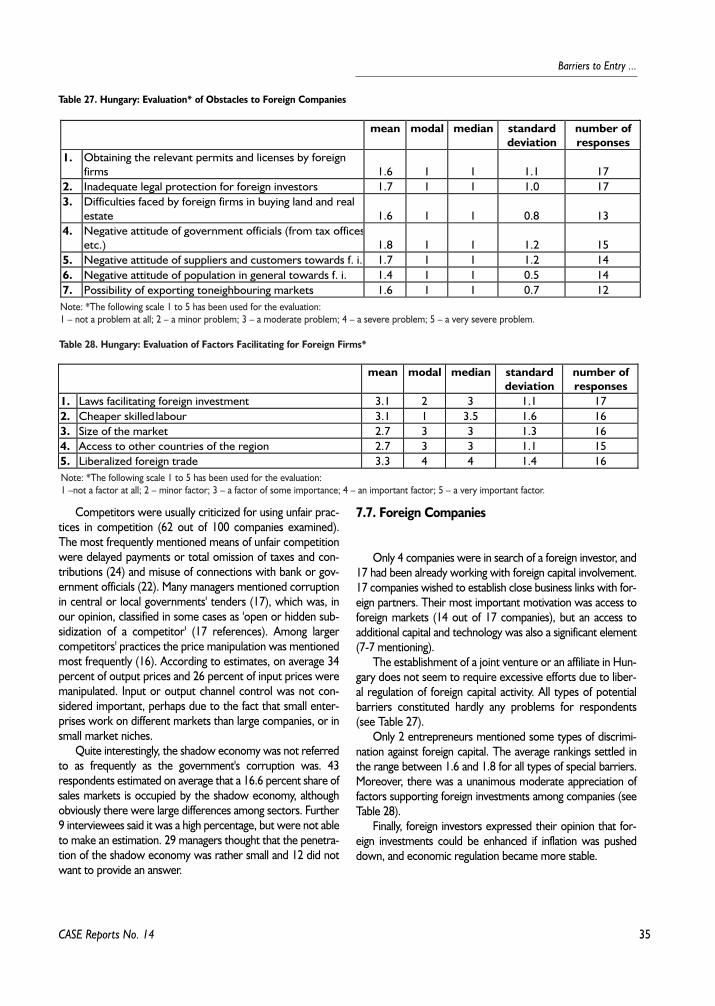
35
Barriers to Entry ...
CASE Reports No. 14
Competitors were usually criticized for using unfair prac-tices in competition (62 out of 100 companies examined).The most frequently mentioned means of unfair competitionwere delayed payments or total omission of taxes and con-tributions (24) and misuse of connections with bank or gov-ernment officials (22). Many managers mentioned corruptionin central or local governments' tenders (17), which was, inour opinion, classified in some cases as 'open or hidden sub-sidization of a competitor' (17 references). Among largercompetitors' practices the price manipulation was mentionedmost frequently (16). According to estimates, on average 34percent of output prices and 26 percent of input prices weremanipulated. Input or output channel control was not con-sidered important, perhaps due to the fact that small enter-prises work on different markets than large companies, or insmall market niches.
Quite interestingly, the shadow economy was not referredto as frequently as the government's corruption was. 43respondents estimated on average that a 16.6 percent share ofsales markets is occupied by the shadow economy, althoughobviously there were large differences among sectors. Further9 interviewees said it was a high percentage, but were not ableto make an estimation. 29 managers thought that the penetra-tion of the shadow economy was rather small and 12 did notwant to provide an answer.
7.7. Foreign Companies
Only 4 companies were in search of a foreign investor, and17 had been already working with foreign capital involvement.17 companies wished to establish close business links with for-eign partners. Their most important motivation was access toforeign markets (14 out of 17 companies), but an access toadditional capital and technology was also a significant element(7-7 mentioning).
The establishment of a joint venture or an affiliate in Hun-gary does not seem to require excessive efforts due to liber-al regulation of foreign capital activity. All types of potentialbarriers constituted hardly any problems for respondents(see Table 27).
Only 2 entrepreneurs mentioned some types of discrimi-nation against foreign capital. The average rankings settled inthe range between 1.6 and 1.8 for all types of special barriers.Moreover, there was a unanimous moderate appreciation offactors supporting foreign investments among companies (seeTable 28).
Finally, foreign investors expressed their opinion that for-eign investments could be enhanced if inflation was pusheddown, and economic regulation became more stable.
Table 27. Hungary: Evaluation* of Obstacles to Foreign Companies
mean modal median standarddeviation
number ofresponses
1. Obtaining the relevant permits and licenses by foreignfirms 1.6 1 1 1.1 17
2. Inadequate legal protection for foreign investors 1.7 1 1 1.0 173. Difficulties faced by foreign firms in buying land and real
estate 1.6 1 1 0.8 134. Negative attitude of government officials (from tax offices
etc.) 1.8 1 1 1.2 155. Negative attitude of suppliers and customers towards f. i. 1.7 1 1 1.2 146. Negative attitude of population in general towards f. i. 1.4 1 1 0.5 147. Possibility of exporting to neighbouring markets 1.6 1 1 0.7 12
Note: *The following scale 1 to 5 has been used for the evaluation:1 – not a problem at all; 2 – a minor problem; 3 – a moderate problem; 4 – a severe problem; 5 – a very severe problem.
Table 28. Hungary: Evaluation of Factors Facilitating for Foreign Firms*
mean modal median standarddeviation
number ofresponses
1. Laws facilitating foreign investment 3.1 2 3 1.1 172. Cheaper skilled labour 3.1 1 3.5 1.6 163. Size of the market 2.7 3 3 1.3 164. Access to other countries of the region 2.7 3 3 1.1 155. Liberalized foreign trade 3.3 4 4 1.4 16Note: *The following scale 1 to 5 has been used for the evaluation:1 –not a factor at all; 2 – minor factor; 3 – a factor of some importance; 4 – an important factor; 5 – a very important factor.
36
Ewa Balcerowicz, Leszek Balcerowicz, Iraj Hashi
7.8. Conclusions
Registration and licensing does not create an importantbarrier to entry. Court registration is typically slow, but firmscan start operation prior to a valid court decree. Registrationis a condition of obtaining a bank credit, yet, application forbank loans is not very frequent, except for longer establishedand bigger firms. Some ventures reported difficulties inobtaining special licenses; a problem which seriously limitedtheir activity.
Almost all entrepreneurs considered social security contri-butions very high. They did not had a paralyzing effect though,since many managers hired free-lancers and for regularemployees they provided unregistered payments whichescaped taxation and other contributions.
Tax and social security regulations change very frequentlyand their rules are not transparent to an average entrepreneur.Managers spend an increasing amount of time on the men-tioned regulations, and have to use services of outside experts,or hire one continuously.
Small business support schemes played a very limited rolein the establishment of new ventures. Due to high interest ratesand a conservative banking behaviour, an outside financing doesnot play an important role in small companies. It is usually themore established and bigger companies that get access to abank credit. They can afford high interest rates if necessary.Most successful and fastest growing companies needed 4–6years until they could meet bank requirements. Banks werealso criticized for a conservative lending policy and slowness.Firms with a foreign ownership were usually financed by theirowner.
The greater number of the sample companies were grow-ing. Interviewed companies had been profitable throughout theperiod, invested, and increased employment and value of theirassets. This seems to be in contraction to their overall negativeperception of a business climate in the country. The growth ofcompanies seems to follow basic macroeconomic trends: therewas a sluggish movement in 1990–1991 and a slow growth in1994 and 1995. Growth seemed to accelerate in 1995 despitea restrictive monetary and fiscal policy of the government inthat year (the so-called Bokros-package). Austerity measuresseemed to improve a business climate and expectations. Theyalso counterweighted restrictions in the domestic demand.
The single most important barrier to company growth washigh taxes and social security contributions. The problem waseven aggravated by continuous changes in regulations, whichrequired from entrepreneurs a serious amount of time andmoney to cope with. Competition was not consideredextremely strong. Nevertheless, unfair practices annoyed man-agers, especially in the case of corruption in the governments'procurement tenders. The corruption was perceived morenegatively than the existence of the shadow economy. Foreigncompanies did not see any special difficulty in the establishmentand growth in Hungary.
8. Barriers to Entry and Development of Czech New Private Firms
Jan Mladek
8.1. Introduction
After the 'Velvet Revolution' in 1989, economic reformersin Czechoslovakia faced a market dominated by large statemonopolies (which were created and maintained by adminis-trative action rather than by economic determination), andalmost completely lacking the private sector, even when com-pared to Hungary or Poland. Small craftsmen who remained inthe private sector, were tightly regulated, highly taxed, andalways subject to capricious local officials.
In the framework of the economic reform implementedin Czechoslovakia since 1990, the re-establishment of theprivate sector had been understood as a key element. Therole of small and medium-sized enterprises is crucial due totheir ability to increase competitiveness of production and,consequently, the export performance, to adopt new tech-nologies, to modernize economic structure and to createnew employment opportunities. At the same time, it is obvi-ous that the role of SMEs in solving huge economic prob-lems of the country cannot be overvalued.
The Entrepreneurial Law of April 1990 legalized the estab-lishment of private companies and permitted them to employunlimited numbers of workers and produce a full range ofgoods. Step by step, a number of new laws and regulations con-cerning private enterprise took effect.
The general policy towards SMEs was to remove all obsta-cles to creation and growth of enterprises assuming that onceentering business is possible, private initiative will appear auto-matically. The state was supposed to guarantee only theremoval of barriers to entry and growth and to create a stablemacroeconomic environment, that is, to keep inflation low andto maintain an exchange rate to hard currencies at a fixed level.This was supplemented by privatization, which was supposedto speed up the growth of already existing companies com-pared to pure start-ups. Restitution and the so-called "small pri-vatization" were the most important privatization methods forthe SME sector.
Under the restitution program, the property nationalizedafter February 1948 (the date of the communist coup), wasreturned to original owners or their heirs. The former CzechMinister of Privatization, Mr. Tomas Jezek, estimated theamount of restitution at 100 000 ? , 80 000 of which being realestates.
The so-called small privatization program was developed inthe first half of 1990 and put into action in 1990–93. Altogeth-er, 22 345 units were sold in public auctions (Earle, et. al. 1995).
Restitution and the small privatization significantly con-tributed to the creation of the private sector in the retail
CASE Reports No. 14
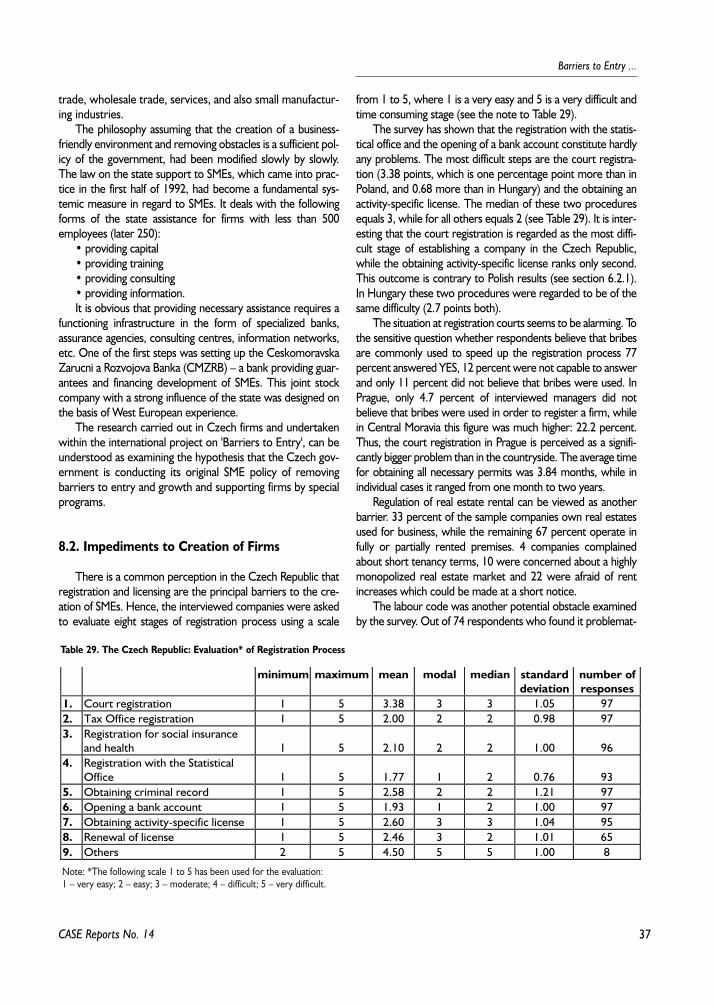
37
Barriers to Entry ...
trade, wholesale trade, services, and also small manufactur-ing industries.
The philosophy assuming that the creation of a business-friendly environment and removing obstacles is a sufficient pol-icy of the government, had been modified slowly by slowly.The law on the state support to SMEs, which came into prac-tice in the first half of 1992, had become a fundamental sys-temic measure in regard to SMEs. It deals with the followingforms of the state assistance for firms with less than 500employees (later 250):
• providing capital• providing training• providing consulting• providing information.It is obvious that providing necessary assistance requires a
functioning infrastructure in the form of specialized banks,assurance agencies, consulting centres, information networks,etc. One of the first steps was setting up the CeskomoravskaZarucni a Rozvojova Banka (CMZRB) – a bank providing guar-antees and financing development of SMEs. This joint stockcompany with a strong influence of the state was designed onthe basis of West European experience.
The research carried out in Czech firms and undertakenwithin the international project on 'Barriers to Entry', can beunderstood as examining the hypothesis that the Czech gov-ernment is conducting its original SME policy of removingbarriers to entry and growth and supporting firms by specialprograms.
8.2. Impediments to Creation of Firms
There is a common perception in the Czech Republic thatregistration and licensing are the principal barriers to the cre-ation of SMEs. Hence, the interviewed companies were askedto evaluate eight stages of registration process using a scale
from 1 to 5, where 1 is a very easy and 5 is a very difficult andtime consuming stage (see the note to Table 29).
The survey has shown that the registration with the statis-tical office and the opening of a bank account constitute hardlyany problems. The most difficult steps are the court registra-tion (3.38 points, which is one percentage point more than inPoland, and 0.68 more than in Hungary) and the obtaining anactivity-specific license. The median of these two proceduresequals 3, while for all others equals 2 (see Table 29). It is inter-esting that the court registration is regarded as the most diffi-cult stage of establishing a company in the Czech Republic,while the obtaining activity-specific license ranks only second.This outcome is contrary to Polish results (see section 6.2.1).In Hungary these two procedures were regarded to be of thesame difficulty (2.7 points both).
The situation at registration courts seems to be alarming. Tothe sensitive question whether respondents believe that bribesare commonly used to speed up the registration process 77percent answered YES, 12 percent were not capable to answerand only 11 percent did not believe that bribes were used. InPrague, only 4.7 percent of interviewed managers did notbelieve that bribes were used in order to register a firm, whilein Central Moravia this figure was much higher: 22.2 percent.Thus, the court registration in Prague is perceived as a signifi-cantly bigger problem than in the countryside. The average timefor obtaining all necessary permits was 3.84 months, while inindividual cases it ranged from one month to two years.
Regulation of real estate rental can be viewed as anotherbarrier. 33 percent of the sample companies own real estatesused for business, while the remaining 67 percent operate infully or partially rented premises. 4 companies complainedabout short tenancy terms, 10 were concerned about a highlymonopolized real estate market and 22 were afraid of rentincreases which could be made at a short notice.
The labour code was another potential obstacle examinedby the survey. Out of 74 respondents who found it problemat-
CASE Reports No. 14
Table 29. The Czech Republic: Evaluation* of Registration Process
minimum maximum mean modal median standarddeviation
number ofresponses
1. Court registration 1 5 3.38 3 3 1.05 972. Tax Office registration 1 5 2.00 2 2 0.98 973. Registration for social insurance
and health 1 5 2.10 2 2 1.00 964. Registration with the Statistical
Office 1 5 1.77 1 2 0.76 935. Obtaining criminal record 1 5 2.58 2 2 1.21 976. Opening a bank account 1 5 1.93 1 2 1.00 977. Obtaining activity-specific license 1 5 2.60 3 3 1.04 958. Renewal of license 1 5 2.46 3 2 1.01 659. Others 2 5 4.50 5 5 1.00 8
Note: *The following scale 1 to 5 has been used for the evaluation: 1 – very easy; 2 – easy; 3 – moderate; 4 – difficult; 5 – very difficult.
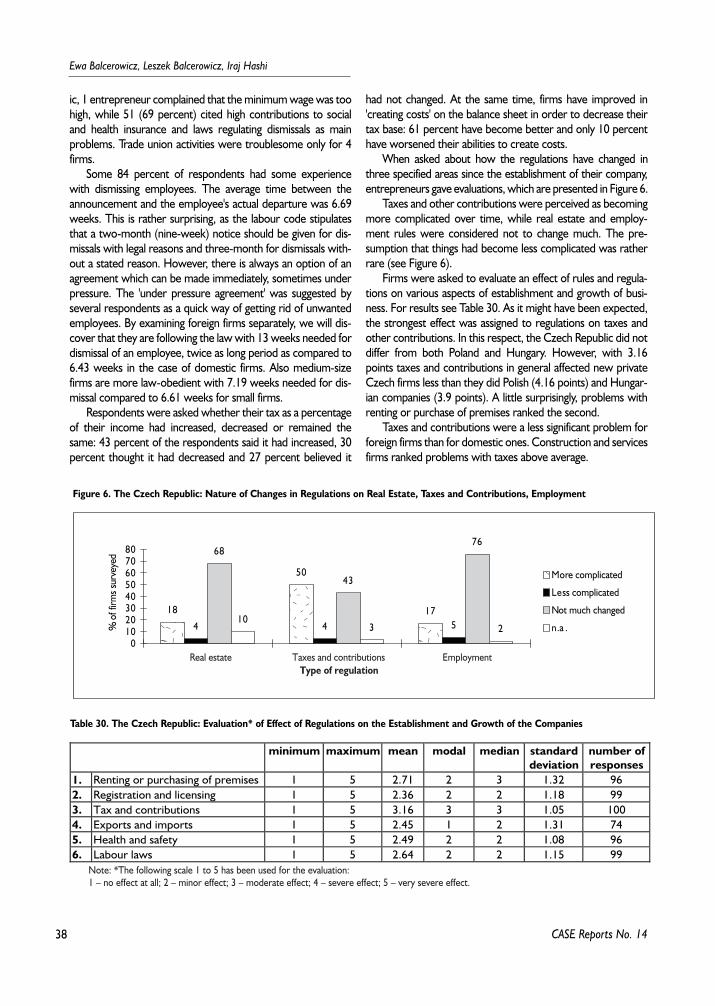
38
Ewa Balcerowicz, Leszek Balcerowicz, Iraj Hashi
ic, 1 entrepreneur complained that the minimum wage was toohigh, while 51 (69 percent) cited high contributions to socialand health insurance and laws regulating dismissals as mainproblems. Trade union activities were troublesome only for 4firms.
Some 84 percent of respondents had some experiencewith dismissing employees. The average time between theannouncement and the employee's actual departure was 6.69weeks. This is rather surprising, as the labour code stipulatesthat a two-month (nine-week) notice should be given for dis-missals with legal reasons and three-month for dismissals with-out a stated reason. However, there is always an option of anagreement which can be made immediately, sometimes underpressure. The 'under pressure agreement' was suggested byseveral respondents as a quick way of getting rid of unwantedemployees. By examining foreign firms separately, we will dis-cover that they are following the law with 13 weeks needed fordismissal of an employee, twice as long period as compared to6.43 weeks in the case of domestic firms. Also medium-sizefirms are more law-obedient with 7.19 weeks needed for dis-missal compared to 6.61 weeks for small firms.
Respondents were asked whether their tax as a percentageof their income had increased, decreased or remained thesame: 43 percent of the respondents said it had increased, 30percent thought it had decreased and 27 percent believed it
had not changed. At the same time, firms have improved in'creating costs' on the balance sheet in order to decrease theirtax base: 61 percent have become better and only 10 percenthave worsened their abilities to create costs.
When asked about how the regulations have changed inthree specified areas since the establishment of their company,entrepreneurs gave evaluations, which are presented in Figure 6.
Taxes and other contributions were perceived as becomingmore complicated over time, while real estate and employ-ment rules were considered not to change much. The pre-sumption that things had become less complicated was ratherrare (see Figure 6).
Firms were asked to evaluate an effect of rules and regula-tions on various aspects of establishment and growth of busi-ness. For results see Table 30. As it might have been expected,the strongest effect was assigned to regulations on taxes andother contributions. In this respect, the Czech Republic did notdiffer from both Poland and Hungary. However, with 3.16points taxes and contributions in general affected new privateCzech firms less than they did Polish (4.16 points) and Hungar-ian companies (3.9 points). A little surprisingly, problems withrenting or purchase of premises ranked the second.
Taxes and contributions were a less significant problem forforeign firms than for domestic ones. Construction and servicesfirms ranked problems with taxes above average.
CASE Reports No. 14
��yy�y��yy18
50
174 4 5
68
43
76
103 2
01020304050607080
�yMore complicated
Less complicated
Not much changed
n.a .% o
f firm
s sur
veye
d
Real estate Taxes and contributions EmploymentType of regulation
Figure 6. The Czech Republic: Nature of Changes in Regulations on Real Estate, Taxes and Contributions, Employment
Table 30. The Czech Republic: Evaluation* of Effect of Regulations on the Establishment and Growth of the Companies
minimum maximum mean modal median standarddeviation
number ofresponses
1. Renting or purchasing of premises 1 5 2.71 2 3 1.32 962. Registration and licensing 1 5 2.36 2 2 1.18 993. Tax and contributions 1 5 3.16 3 3 1.05 1004. Exports and imports 1 5 2.45 1 2 1.31 745. Health and safety 1 5 2.49 2 2 1.08 966. Labour laws 1 5 2.64 2 2 1.15 99
Note: *The following scale 1 to 5 has been used for the evaluation: 1 – no effect at all; 2 – minor effect; 3 – moderate effect; 4 – severe effect; 5 – very severe effect.
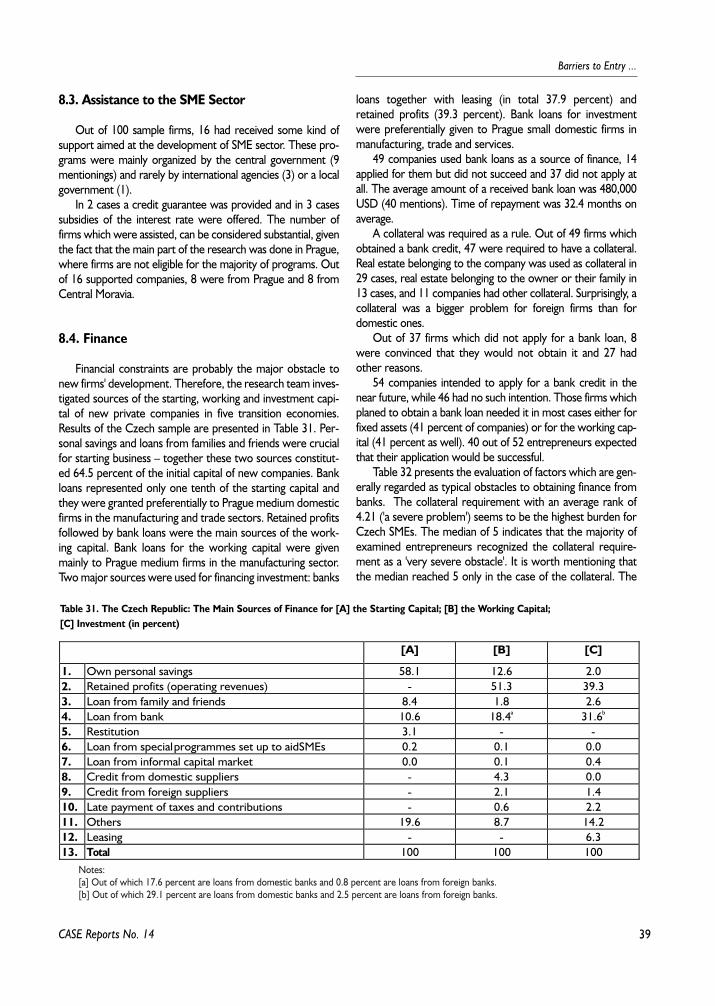
39
Barriers to Entry ...
8.3. Assistance to the SME Sector
Out of 100 sample firms, 16 had received some kind ofsupport aimed at the development of SME sector. These pro-grams were mainly organized by the central government (9mentionings) and rarely by international agencies (3) or a localgovernment (1).
In 2 cases a credit guarantee was provided and in 3 casessubsidies of the interest rate were offered. The number offirms which were assisted, can be considered substantial, giventhe fact that the main part of the research was done in Prague,where firms are not eligible for the majority of programs. Outof 16 supported companies, 8 were from Prague and 8 fromCentral Moravia.
8.4. Finance
Financial constraints are probably the major obstacle tonew firms' development. Therefore, the research team inves-tigated sources of the starting, working and investment capi-tal of new private companies in five transition economies.Results of the Czech sample are presented in Table 31. Per-sonal savings and loans from families and friends were crucialfor starting business – together these two sources constitut-ed 64.5 percent of the initial capital of new companies. Bankloans represented only one tenth of the starting capital andthey were granted preferentially to Prague medium domesticfirms in the manufacturing and trade sectors. Retained profitsfollowed by bank loans were the main sources of the work-ing capital. Bank loans for the working capital were givenmainly to Prague medium firms in the manufacturing sector.Two major sources were used for financing investment: banks
loans together with leasing (in total 37.9 percent) andretained profits (39.3 percent). Bank loans for investmentwere preferentially given to Prague small domestic firms inmanufacturing, trade and services.
49 companies used bank loans as a source of finance, 14applied for them but did not succeed and 37 did not apply atall. The average amount of a received bank loan was 480,000USD (40 mentions). Time of repayment was 32.4 months onaverage.
A collateral was required as a rule. Out of 49 firms whichobtained a bank credit, 47 were required to have a collateral.Real estate belonging to the company was used as collateral in29 cases, real estate belonging to the owner or their family in13 cases, and 11 companies had other collateral. Surprisingly, acollateral was a bigger problem for foreign firms than fordomestic ones.
Out of 37 firms which did not apply for a bank loan, 8were convinced that they would not obtain it and 27 hadother reasons.
54 companies intended to apply for a bank credit in thenear future, while 46 had no such intention. Those firms whichplaned to obtain a bank loan needed it in most cases either forfixed assets (41 percent of companies) or for the working cap-ital (41 percent as well). 40 out of 52 entrepreneurs expectedthat their application would be successful.
Table 32 presents the evaluation of factors which are gen-erally regarded as typical obstacles to obtaining finance frombanks. The collateral requirement with an average rank of4.21 ('a severe problem') seems to be the highest burden forCzech SMEs. The median of 5 indicates that the majority ofexamined entrepreneurs recognized the collateral require-ment as a 'very severe obstacle'. It is worth mentioning thatthe median reached 5 only in the case of the collateral. The
CASE Reports No. 14
Table 31. The Czech Republic: The Main Sources of Finance for [A] the Starting Capital; [B] the Working Capital; [C] Investment (in percent)
[A] [B] [C]
1. Own personal savings 58.1 12.6 2.02. Retained profits (operating revenues) - 51.3 39.33. Loan from family and friends 8.4 1.8 2.64. Loan from bank 10.6 18.4a 31.6b
5. Restitution 3.1 - -6. Loan from special programmes set up to aid SMEs 0.2 0.1 0.07. Loan from informal capital market 0.0 0.1 0.48. Credit from domestic suppliers - 4.3 0.09. Credit from foreign suppliers - 2.1 1.410. Late payment of taxes and contributions - 0.6 2.211. Others 19.6 8.7 14.212. Leasing - - 6.313. Total 100 100 100
Notes:[a] Out of which 17.6 percent are loans from domestic banks and 0.8 percent are loans from foreign banks.[b] Out of which 29.1 percent are loans from domestic banks and 2.5 percent are loans from foreign banks.
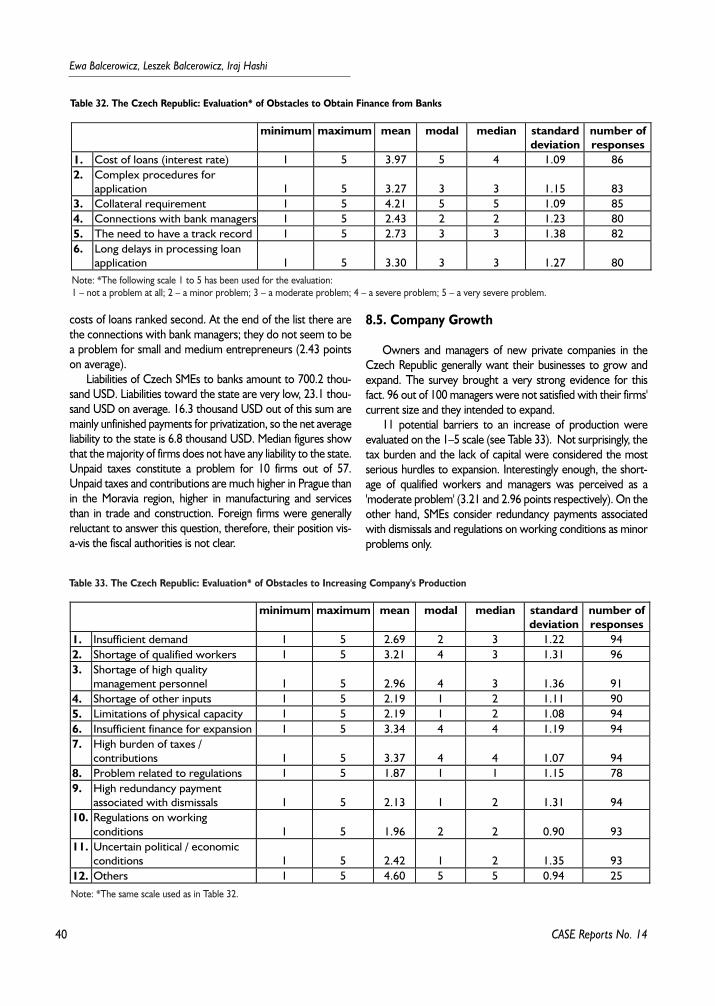
40
Ewa Balcerowicz, Leszek Balcerowicz, Iraj Hashi
costs of loans ranked second. At the end of the list there arethe connections with bank managers; they do not seem to bea problem for small and medium entrepreneurs (2.43 pointson average).
Liabilities of Czech SMEs to banks amount to 700.2 thou-sand USD. Liabilities toward the state are very low, 23.1 thou-sand USD on average. 16.3 thousand USD out of this sum aremainly unfinished payments for privatization, so the net averageliability to the state is 6.8 thousand USD. Median figures showthat the majority of firms does not have any liability to the state.Unpaid taxes constitute a problem for 10 firms out of 57.Unpaid taxes and contributions are much higher in Prague thanin the Moravia region, higher in manufacturing and servicesthan in trade and construction. Foreign firms were generallyreluctant to answer this question, therefore, their position vis-a-vis the fiscal authorities is not clear.
8.5. Company Growth
Owners and managers of new private companies in theCzech Republic generally want their businesses to grow andexpand. The survey brought a very strong evidence for thisfact. 96 out of 100 managers were not satisfied with their firms'current size and they intended to expand.
11 potential barriers to an increase of production wereevaluated on the 1–5 scale (see Table 33). Not surprisingly, thetax burden and the lack of capital were considered the mostserious hurdles to expansion. Interestingly enough, the short-age of qualified workers and managers was perceived as a'moderate problem' (3.21 and 2.96 points respectively). On theother hand, SMEs consider redundancy payments associatedwith dismissals and regulations on working conditions as minorproblems only.
CASE Reports No. 14
Table 32. The Czech Republic: Evaluation* of Obstacles to Obtain Finance from Banks
minimum maximum mean modal median standarddeviation
number ofresponses
1. Cost of loans (interest rate) 1 5 3.97 5 4 1.09 862. Complex procedures for
application 1 5 3.27 3 3 1.15 833. Collateral requirement 1 5 4.21 5 5 1.09 854. Connections with bank managers 1 5 2.43 2 2 1.23 805. The need to have a track record 1 5 2.73 3 3 1.38 826. Long delays in processing loan
application 1 5 3.30 3 3 1.27 80Note: *The following scale 1 to 5 has been used for the evaluation:1 – not a problem at all; 2 – a minor problem; 3 – a moderate problem; 4 – a severe problem; 5 – a very severe problem.
Table 33. The Czech Republic: Evaluation* of Obstacles to Increasing Company's Production
minimum maximum mean modal median standarddeviation
number ofresponses
1. Insufficient demand 1 5 2.69 2 3 1.22 942. Shortage of qualified workers 1 5 3.21 4 3 1.31 963. Shortage of high quality
management personnel 1 5 2.96 4 3 1.36 914. Shortage of other inputs 1 5 2.19 1 2 1.11 905. Limitations of physical capacity 1 5 2.19 1 2 1.08 946. Insufficient finance for expansion 1 5 3.34 4 4 1.19 947. High burden of taxes /
contributions 1 5 3.37 4 4 1.07 948. Problem related to regulations 1 5 1.87 1 1 1.15 789. High redundancy payment
associated with dismissals 1 5 2.13 1 2 1.31 9410. Regulations on working
conditions 1 5 1.96 2 2 0.90 9311. Uncertain political / economic
conditions 1 5 2.42 1 2 1.35 9312. Others 1 5 4.60 5 5 0.94 25
Note: *The same scale used as in Table 32.

41
Barriers to Entry ...
8.6. Environment and Competitive Conditions
The overall environment for development of private busi-ness in the Czech Republic was evaluated as closer to poorthan satisfactory. The average (on the 1–5 scale) was 2.31only, and that is much lower than in the case of the Polish sam-ple (an average of 3.0 points) and a little less than in Hungary(2.4) (see Sections 6.5 and 7.5). Opinions of Czech respon-dents ranged from 'very poor' (1 point) to 'very good' (5points), however, the modal judgement was that the overallenvironment for business is poor (2 points).
When asked about obstacles hampering the functioningand growth of their companies, entrepreneurs expressed theirstrong dissatisfaction with a non-transparency of laws and reg-ulations and with inadequate measures against corruption andcrime. Both of the barriers reached the median of 4 (on 1–5scale) which stands for a 'severe problem' (see data in Table 34and the note about the scale).
Frequent changes in the government, political instabili-ty and the continued government intervention in the econ-omy were considered to be the least important problemsout of the 9 examined obstacles. However, it should bestressed that the research had been done before the end of1997 when open political crises started. Surprisingly
enough, foreign firms were generally optimistic about allnine factors affecting the business of a company in theCzech economy with the exception of banking systemoperation and frequent changes in the government. Con-struction firms were particularly concerned with inade-quate measures against corruption. This is not surprising,since public tenders common in this sector are generallyperceived as unfair.
For the majority of new companies surveyed in the CzechRepublic main competitors are: (1) foreign firms and jointventures established in the Czech Republic and (2) domesticSMEs producing similar goods and services (see Table 35).These two groups of competitors exercise slightly more than'moderate' power (3.11 and 3.10 points respectively on ascale of 1–5).
The comparison of the current situation with the early1990s shows growing competition within the SME sector anddecreasing competition from state enterprises exploitingadvantages of economies of scale. In the survey SOEs and largeprivatized firms came fifth, with an average of 2.41 points only.A sectoral analysis revealed that manufacturers had to copewith the highest competition from imports (both new and sec-ond-hand products) and from firms operating in the shadoweconomy.
CASE Reports No. 14
Table 34. The Czech Republic: Evaluation* of Obstacles Affecting the Business of a Company
mean modal median quantity1. Political instability 2.26 1 2 982. Inflationary conditions 3.14 3 3 1003. Frequent changes in government 1.83 1 1.5 964. Frequent changes in laws and regulations 3.05 4 3 995. Non-transparency of laws and regulations 3.64 4 4 1006. Operation of commercial law 3.5 2 3 1007. Operation of the banking system 3.03 3 3 1008. Inadequate measures against crime / corruption 3.49 5 4 999. Continued government intervention in the economy 2.70 2 2.5 96Note: *The following scale 1 to 5 has been used for the evaluation:1 – not a problem at all; 2 – a minor problem; 3 – a moderate problem; 4 – a severe problem; 5 – a very severe problem.
Table 35. The Czech Republic: Main Competitors and their Competitive Power*
mean modal median quantity1. Political instability 2.26 1 2 982. Inflationary conditions 3.14 3 3 1003. Frequent changes in government 1.83 1 1.5 964. Frequent changes in laws and regulations 3.05 4 3 995. Non-transparency of laws and regulations 3.64 4 4 1006. Operation of commercial law 3.5 2 3 1007. Operation of the banking system 3.03 3 3 1008. Inadequate measures against crime / corruption 3.49 5 4 999. Continued government intervention in the economy 2.70 2 2.5 96
Note: *The following scale 1 to 5 has been used for the evaluation:1 – not a competitor; 2 – a weak competitor; 3 – a moderate competitor; 4 – a strong competitor; 5 – a very strong competitor.
42
Ewa Balcerowicz, Leszek Balcerowicz, Iraj Hashi
8.7. Conclusions
Surveys and interviews conducted among SMEs at earlystages of the Czech economic transformation and before theintroduction of the state support program in 1992 (see Bohata1993) had identified the following problems as major barriers inthis sector:
• excessive taxes,• delayed payments,• high interest rates.On the basis of their short experience, SMEs representa-
tives formulated recommendations for governmental policystressing the need for accelerated privatization, improvementand clarification of laws and regulations and accessible creditswith lower interest rates and fewer collateral requirements.Looking at the current situation, we may state that the first rec-ommendation was realized (fast privatization had been on theagenda of the Czech government anyway), however, manyproblems with respect to laws, regulations and credit policy ofthe banking sector still remain unsolved.
The 1997 survey revealed that the main problems affectingCzech SMEs at present, are as follows:
1. Court registration – a difficult and time consumingprocess;
2. High level of taxation (including social security and healthinsurance contributions);
3. Poor access to credits caused by collateral requirementand high interest rates – the main barrier to investment expan-sion,
4. Insufficient protection of ownership rights in a broadsense (an inadequate enforcement of law, crime, corruption);
5. Lack of qualified workers and managers.Beside such SMEs' problems as the tax burden and access
to cheap credits, which are common in other countries as well,Czech entrepreneurs face a specific problem: a badly function-ing state. This fact was also stressed by the EU administrationwhen evaluating the preparedness of the country for its futureEU membership. A remedy of this situation could be the rec-ommendation for the main policy based on the presentedresearch.
The comparison of the current situation with the early1990s shows a positive and fast development of competitionwithin the SME sector and its growth. At present, the maincompetitors of interviewed SMEs are foreign firms and jointventures established in the country, followed by domestic SMEsproducing similar goods or services. While until recently, SMEshad faced a stronger competition from state enterprisesexploiting advantages of economies of scale and, to a muchlesser extent, competition from new entrants taking advan-tages of low entry costs.
9. Barriers to Entry and Growth of NewFirms in Albania
Lindita Xhillari
9.1. Introduction
The political change of 1990 in Albania came in conditionsof a deep economic crisis, manifested in all dimensions at thebeginning of 1980. Roots of the crisis can be found in 50 yearsof the centrally planned economy. The Albanian economy of1990 was dominated by state property in all sectors includingtrade, industry, construction and food processing. At the begin-ning of 1990 the Albanian industrial sector comprised approxi-mately 400 state-owned enterprises. They accounted forapproximately 45percent of net employment and for about 23percent of the working population. Agriculture was a base sec-tor for the Albanian economy providing almost 50 percent ofthe labour force. From a size point of view, enterprises wereorganized as large vertical integrated units or so-called "kombi-nats" with thousands of employees operating in different sec-tors, while small enterprises were mostly present in trade,catering, restaurants and grocery stores, handcrafts etc. As inmost ex-socialist countries, Albanian enterprises were notcompanies in a market economy sense. There did not exist anycorporate laws and SOE were essentially production units withextreme restrictions in a financial and managerial autonomy.Most means of production, including land, were under the stateownership. Not owning any means of production Albanian cit-izens could not engage in any significant economic activity.
Until 1990, the state budget had been based on three mainrevenue sources: the turnover tax, enterprise profits transfersand social security contributions all paid by enterprises.
The State Bank of Albania was in charge of both centralbanking and commercial banking functions. In the situation ofthis extreme centralization the role of the State Bank in mone-tary interventions had been diminished for many years. In 1991only 3 banks were operating in Albania, while in some of East-ern European countries their number had increased substan-tially. Due to a low economic development level during social-ist era, the legacy in the field of financial institutions was verypoor and their establishment took place later than in otherEuropean and Balkan countries. Until the beginning of 1990 thefinancial sector like all the other sectors of the Albanian econo-my had operated in the framework of an extreme centraliza-tion. The comprehensive economic reform program whichbegan at the beginning of Albanian transformation, alongsidewith reforming other sectors of economy, also aimed at thesetting up of a new financial system.
Imposed by the above-mentioned initial conditions, macro-economic stabilization was the first step of the Albanian eco-nomic reform. The economic reform was directed towards:decreasing budget deficit, monitoring inflation, solving the for-
CASE Reports No. 14
43
Barriers to Entry ...
eign debt problem, introducing a floating exchange regime,keeping a domestic convertibility of the national currency –Lek, creating a two tier banking system and a system of non-bank institutions, initiating a modern legal framework for afinancial system.
An informal financial sector emerged and developed as aphenomenon accompanying deep economic changes in theongoing economic transition towards the market economy.The establishment of the informal market and its developmentas a reaction towards difficulties of transition period, filled inthe vacuum of non-existent market institutions and this led toan overall financial crisis. The Albanian experience of the 1990sproves that building strong institutions seems to be indispens-able for a successful reform.
The economic reform of 1991 was aimed at overcomingthe very difficult challenge of adoption and transition fromsocialist economic structures to a well-developed market sys-tem. The assumption had been made that creation of the pri-vate sector will pave way to the growth of the economy andthe alleviation of the 1980s crisis. This was to be achievedthrough privatization of state enterprises, the establishment ofthe legal framework and the creation of the favourable envi-ronment for private business.
Governments which took office after the collapse of thecommunist regime, had made their best to take institutional,economic and legal measures in support of economic reform inall dimensions. They wanted to contribute to the establishmentof the necessary environment for a new private sector devel-opment. In August 1991 the Law on Sanctioning and Protec-tion of Private Property, Free Initiative of Independent PrivateActivities and Privatization was adopted, thus opening the wayto privatization of the state property as well as the establish-ment of new private entities. In a short time period, a legalframework had been established for promoting private busi-nesses, supporting labour market, the protection of privateeconomic rights and implementation of a fast privatizationprocess of state-owned enterprises. It should be stressed thatas a result, the Albanian private sector has impressively grownsince the collapse of the communist regime.
The year 1991 marked the beginning of the privatization ofsmall units like shops, restaurants, and minor manufacturingcompanies. It was then followed by a rapid privatization ofsmall and medium size enterprises. The economic reformwithin the financial sector started with the decentralization ofthe mono bank system and its change to a two-tier bank sys-tem. The Bank of Albania performed traditional functions of acentral bank, while commercial banks lent money to commer-cial clients and received deposits. The foreign trade and priceliberalization in the middle of 1992 paved the way to a signifi-cant growth of the private sector, mainly the trade sector. Itenabled creating new workplaces. As a result of the above-described economic policy in 1995, 60 percent of GDP was
generated (up to 55 percent in 1994) and 75 percent of theworkplaces were offered by the private sector. Since then theeconomic situation has undergone some important changes.The crisis caused by pyramid schemes and the second onecaused by Serbia's and Albania's dispute over Kosovo affectedthe private sector development in general and had a terribleimpact on SME formation and survival. There was a decline inGDP in 1997 and an accompanying rise in unemployment upto 17percent (an official figure). This period observed thegrowth of an informal economy. Many fiscal changes wereintroduced which directly or indirectly affected SMEs. Despitethe fact that credit lines were increased in both number andavailable funds, the credit reimbursement is still very low.
In the following sections of this chapter, I will examine dif-ferent groups of factors and their impact on the developmentof the private sector in Albania in the early transition period.These groups of factors include regulatory framework, fiscalconstraints, credit policies and availability and cost of othersources of financing the establishment, functioning and growthof a private company. The impact of these factors and poten-tial barriers they create was highlighted in the course of a sur-vey done in 50 newly established companies in two regions ofAlbania. One was the capital city of Tirana where 30 compa-nies were interviewed; the other city was Elbasan, 50 km awayfrom the capital. The survey was assisted by the Albanian Insti-tute of Statistics INSTAT and originally, it was to cover theregion of Pogradec which is one of less developed areas of thecountry. However, due to a dramatic financial crisis (break-down of financial pyramids) which brought about politicalunrest at the beginning of 1997, it was shifted to the Elbasanregion, which is also considered to be a less developed area.Most of the surveyed firms were very small. It was hard to findnew private firms having over 50 employees, especially inElbasan.
As it was already mentioned above, the transition had start-ed in Albania later than in other Central and Eastern Europeancountries, therefore the sample does not contain any compa-nies established in 1990. Among interviewed firms there was 1company registered in 1991, 9 companies registered in 1992,25 companies registered in 1993 and 15 companies registeredin 1994 [ ]. Interviewees were supposed to be owners or co-owners of the firms, general directors or other directors andmanagers. In fact, in the majority of cases (64percent of thesample) owners preferred to answer questions themselves.
9.2. Regulatory Constraints
When asked to evaluate subsequent stages of the registra-tion process and license obtaining Albanian entrepreneurs onaverage did not considered registration and licensing as diffi-cult, costly or time consuming processes. Almost all the proce-
CASE Reports No. 14
[21] For more details about the Albanian sample - see chapter 5.
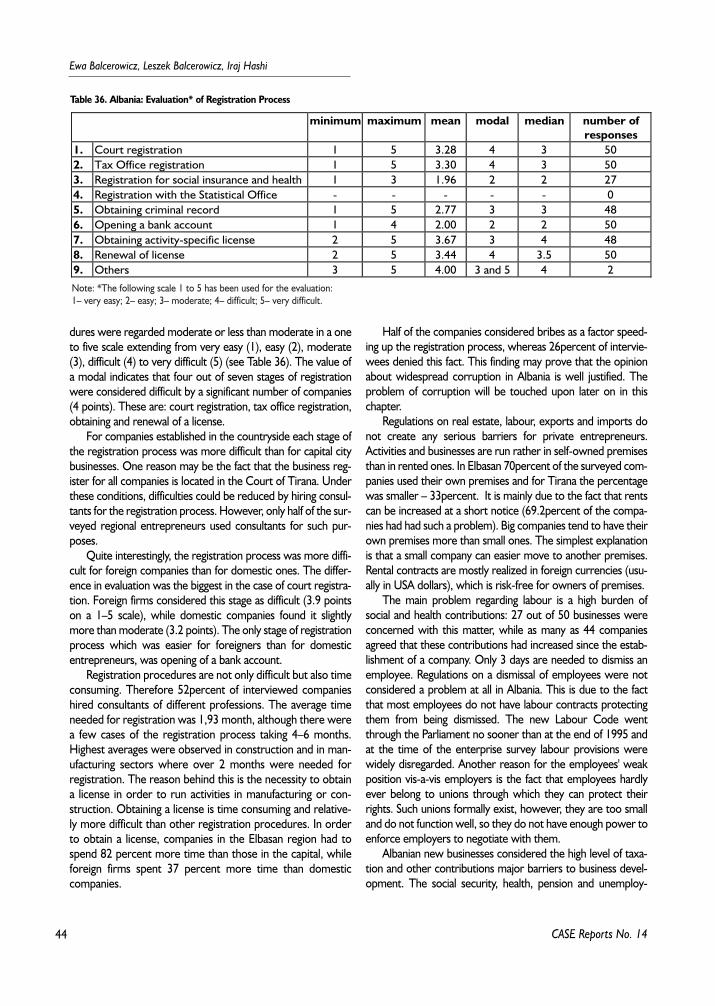
44
Ewa Balcerowicz, Leszek Balcerowicz, Iraj Hashi
dures were regarded moderate or less than moderate in a oneto five scale extending from very easy (1), easy (2), moderate(3), difficult (4) to very difficult (5) (see Table 36). The value ofa modal indicates that four out of seven stages of registrationwere considered difficult by a significant number of companies(4 points). These are: court registration, tax office registration,obtaining and renewal of a license.
For companies established in the countryside each stage ofthe registration process was more difficult than for capital citybusinesses. One reason may be the fact that the business reg-ister for all companies is located in the Court of Tirana. Underthese conditions, difficulties could be reduced by hiring consul-tants for the registration process. However, only half of the sur-veyed regional entrepreneurs used consultants for such pur-poses.
Quite interestingly, the registration process was more diffi-cult for foreign companies than for domestic ones. The differ-ence in evaluation was the biggest in the case of court registra-tion. Foreign firms considered this stage as difficult (3.9 pointson a 1–5 scale), while domestic companies found it slightlymore than moderate (3.2 points). The only stage of registrationprocess which was easier for foreigners than for domesticentrepreneurs, was opening of a bank account.
Registration procedures are not only difficult but also timeconsuming. Therefore 52percent of interviewed companieshired consultants of different professions. The average timeneeded for registration was 1,93 month, although there werea few cases of the registration process taking 4–6 months.Highest averages were observed in construction and in man-ufacturing sectors where over 2 months were needed forregistration. The reason behind this is the necessity to obtaina license in order to run activities in manufacturing or con-struction. Obtaining a license is time consuming and relative-ly more difficult than other registration procedures. In orderto obtain a license, companies in the Elbasan region had tospend 82 percent more time than those in the capital, whileforeign firms spent 37 percent more time than domesticcompanies.
Half of the companies considered bribes as a factor speed-ing up the registration process, whereas 26percent of intervie-wees denied this fact. This finding may prove that the opinionabout widespread corruption in Albania is well justified. Theproblem of corruption will be touched upon later on in thischapter.
Regulations on real estate, labour, exports and imports donot create any serious barriers for private entrepreneurs.Activities and businesses are run rather in self-owned premisesthan in rented ones. In Elbasan 70percent of the surveyed com-panies used their own premises and for Tirana the percentagewas smaller – 33percent. It is mainly due to the fact that rentscan be increased at a short notice (69.2percent of the compa-nies had had such a problem). Big companies tend to have theirown premises more than small ones. The simplest explanationis that a small company can easier move to another premises.Rental contracts are mostly realized in foreign currencies (usu-ally in USA dollars), which is risk-free for owners of premises.
The main problem regarding labour is a high burden ofsocial and health contributions: 27 out of 50 businesses wereconcerned with this matter, while as many as 44 companiesagreed that these contributions had increased since the estab-lishment of a company. Only 3 days are needed to dismiss anemployee. Regulations on a dismissal of employees were notconsidered a problem at all in Albania. This is due to the factthat most employees do not have labour contracts protectingthem from being dismissed. The new Labour Code wentthrough the Parliament no sooner than at the end of 1995 andat the time of the enterprise survey labour provisions werewidely disregarded. Another reason for the employees' weakposition vis-a-vis employers is the fact that employees hardlyever belong to unions through which they can protect theirrights. Such unions formally exist, however, they are too smalland do not function well, so they do not have enough power toenforce employers to negotiate with them.
Albanian new businesses considered the high level of taxa-tion and other contributions major barriers to business devel-opment. The social security, health, pension and unemploy-
CASE Reports No. 14
Table 36. Albania: Evaluation* of Registration Process
minimum maximum mean modal median number ofresponses
1. Court registration 1 5 3.28 4 3 502. Tax Office registration 1 5 3.30 4 3 503. Registration for social insurance and health 1 3 1.96 2 2 274. Registration with the Statistical Office - - - - - 05. Obtaining criminal record 1 5 2.77 3 3 486. Opening a bank account 1 4 2.00 2 2 507. Obtaining activity-specific license 2 5 3.67 3 4 488. Renewal of license 2 5 3.44 4 3.5 509. Others 3 5 4.00 3 and 5 4 2
Note: *The following scale 1 to 5 has been used for the evaluation: 1– very easy; 2– easy; 3– moderate; 4– difficult; 5– very difficult.
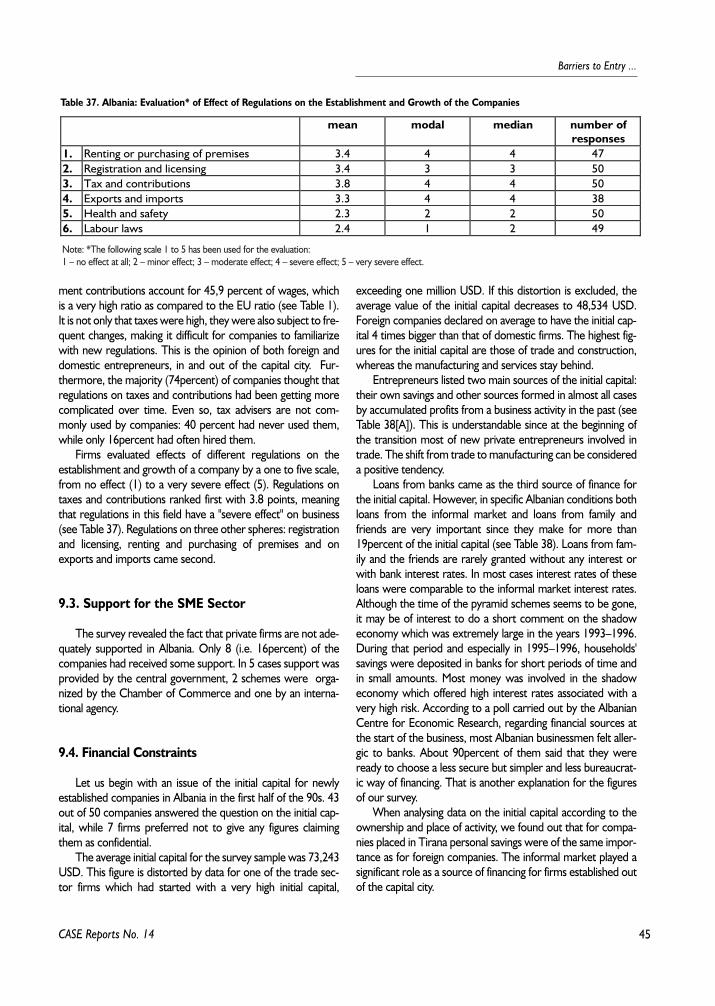
45
Barriers to Entry ...
ment contributions account for 45,9 percent of wages, whichis a very high ratio as compared to the EU ratio (see Table 1).It is not only that taxes were high, they were also subject to fre-quent changes, making it difficult for companies to familiarizewith new regulations. This is the opinion of both foreign anddomestic entrepreneurs, in and out of the capital city. Fur-thermore, the majority (74percent) of companies thought thatregulations on taxes and contributions had been getting morecomplicated over time. Even so, tax advisers are not com-monly used by companies: 40 percent had never used them,while only 16percent had often hired them.
Firms evaluated effects of different regulations on theestablishment and growth of a company by a one to five scale,from no effect (1) to a very severe effect (5). Regulations ontaxes and contributions ranked first with 3.8 points, meaningthat regulations in this field have a "severe effect" on business(see Table 37). Regulations on three other spheres: registrationand licensing, renting and purchasing of premises and onexports and imports came second.
9.3. Support for the SME Sector
The survey revealed the fact that private firms are not ade-quately supported in Albania. Only 8 (i.e. 16percent) of thecompanies had received some support. In 5 cases support wasprovided by the central government, 2 schemes were orga-nized by the Chamber of Commerce and one by an interna-tional agency.
9.4. Financial Constraints
Let us begin with an issue of the initial capital for newlyestablished companies in Albania in the first half of the 90s. 43out of 50 companies answered the question on the initial cap-ital, while 7 firms preferred not to give any figures claimingthem as confidential.
The average initial capital for the survey sample was 73,243USD. This figure is distorted by data for one of the trade sec-tor firms which had started with a very high initial capital,
exceeding one million USD. If this distortion is excluded, theaverage value of the initial capital decreases to 48,534 USD.Foreign companies declared on average to have the initial cap-ital 4 times bigger than that of domestic firms. The highest fig-ures for the initial capital are those of trade and construction,whereas the manufacturing and services stay behind.
Entrepreneurs listed two main sources of the initial capital:their own savings and other sources formed in almost all casesby accumulated profits from a business activity in the past (seeTable 38[A]). This is understandable since at the beginning ofthe transition most of new private entrepreneurs involved intrade. The shift from trade to manufacturing can be considereda positive tendency.
Loans from banks came as the third source of finance forthe initial capital. However, in specific Albanian conditions bothloans from the informal market and loans from family andfriends are very important since they make for more than19percent of the initial capital (see Table 38). Loans from fam-ily and the friends are rarely granted without any interest orwith bank interest rates. In most cases interest rates of theseloans were comparable to the informal market interest rates.Although the time of the pyramid schemes seems to be gone,it may be of interest to do a short comment on the shadoweconomy which was extremely large in the years 1993–1996.During that period and especially in 1995–1996, households'savings were deposited in banks for short periods of time andin small amounts. Most money was involved in the shadoweconomy which offered high interest rates associated with avery high risk. According to a poll carried out by the AlbanianCentre for Economic Research, regarding financial sources atthe start of the business, most Albanian businessmen felt aller-gic to banks. About 90percent of them said that they wereready to choose a less secure but simpler and less bureaucrat-ic way of financing. That is another explanation for the figuresof our survey.
When analysing data on the initial capital according to theownership and place of activity, we found out that for compa-nies placed in Tirana personal savings were of the same impor-tance as for foreign companies. The informal market played asignificant role as a source of financing for firms established outof the capital city.
CASE Reports No. 14
Table 37. Albania: Evaluation* of Effect of Regulations on the Establishment and Growth of the Companies
mean modal median number ofresponses
1. Renting or purchasing of premises 3.4 4 4 472. Registration and licensing 3.4 3 3 503. Tax and contributions 3.8 4 4 504. Exports and imports 3.3 4 4 385. Health and safety 2.3 2 2 506. Labour laws 2.4 1 2 49
Note: *The following scale 1 to 5 has been used for the evaluation: 1 – no effect at all; 2 – minor effect; 3 – moderate effect; 4 – severe effect; 5 – very severe effect.
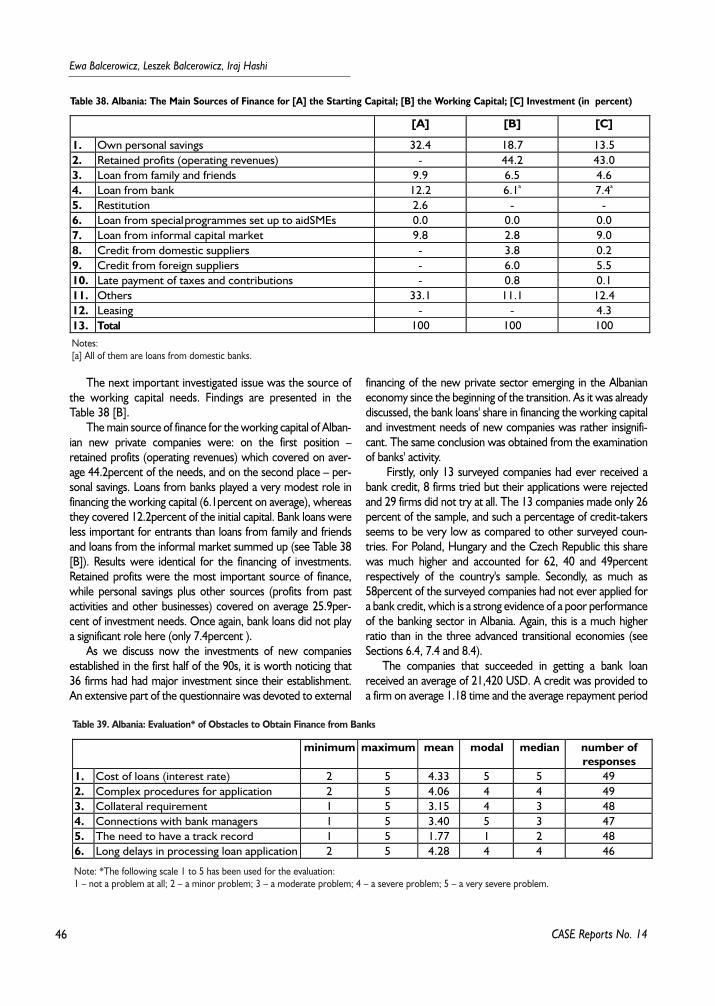
46
Ewa Balcerowicz, Leszek Balcerowicz, Iraj Hashi
The next important investigated issue was the source ofthe working capital needs. Findings are presented in theTable 38 [B].
The main source of finance for the working capital of Alban-ian new private companies were: on the first position –retained profits (operating revenues) which covered on aver-age 44.2percent of the needs, and on the second place – per-sonal savings. Loans from banks played a very modest role infinancing the working capital (6.1percent on average), whereasthey covered 12.2percent of the initial capital. Bank loans wereless important for entrants than loans from family and friendsand loans from the informal market summed up (see Table 38[B]). Results were identical for the financing of investments.Retained profits were the most important source of finance,while personal savings plus other sources (profits from pastactivities and other businesses) covered on average 25.9per-cent of investment needs. Once again, bank loans did not playa significant role here (only 7.4percent ).
As we discuss now the investments of new companiesestablished in the first half of the 90s, it is worth noticing that36 firms had had major investment since their establishment.An extensive part of the questionnaire was devoted to external
financing of the new private sector emerging in the Albanianeconomy since the beginning of the transition. As it was alreadydiscussed, the bank loans' share in financing the working capitaland investment needs of new companies was rather insignifi-cant. The same conclusion was obtained from the examinationof banks' activity.
Firstly, only 13 surveyed companies had ever received abank credit, 8 firms tried but their applications were rejectedand 29 firms did not try at all. The 13 companies made only 26percent of the sample, and such a percentage of credit-takersseems to be very low as compared to other surveyed coun-tries. For Poland, Hungary and the Czech Republic this sharewas much higher and accounted for 62, 40 and 49percentrespectively of the country's sample. Secondly, as much as58percent of the surveyed companies had not ever applied fora bank credit, which is a strong evidence of a poor performanceof the banking sector in Albania. Again, this is a much higherratio than in the three advanced transitional economies (seeSections 6.4, 7.4 and 8.4).
The companies that succeeded in getting a bank loanreceived an average of 21,420 USD. A credit was provided toa firm on average 1.18 time and the average repayment period
CASE Reports No. 14
Table 38. Albania: The Main Sources of Finance for [A] the Starting Capital; [B] the Working Capital; [C] Investment (in percent)
[A] [B] [C]
1. Own personal savings 32.4 18.7 13.52. Retained profits (operating revenues) - 44.2 43.03. Loan from family and friends 9.9 6.5 4.64. Loan from bank 12.2 6.1a 7.4a
5. Restitution 2.6 - -6. Loan from special programmes set up to aid SMEs 0.0 0.0 0.07. Loan from informal capital market 9.8 2.8 9.08. Credit from domestic suppliers - 3.8 0.29. Credit from foreign suppliers - 6.0 5.510. Late payment of taxes and contributions - 0.8 0.111. Others 33.1 11.1 12.412. Leasing - - 4.313. Total 100 100 100Notes:[a] All of them are loans from domestic banks.
Table 39. Albania: Evaluation* of Obstacles to Obtain Finance from Banks
minimum maximum mean modal median number ofresponses
1. Cost of loans (interest rate) 2 5 4.33 5 5 492. Complex procedures for application 2 5 4.06 4 4 493. Collateral requirement 1 5 3.15 4 3 484. Connections with bank managers 1 5 3.40 5 3 475. The need to have a track record 1 5 1.77 1 2 486. Long delays in processing loan application 2 5 4.28 4 4 46
Note: *The following scale 1 to 5 has been used for the evaluation:1 – not a problem at all; 2 – a minor problem; 3 – a moderate problem; 4 – a severe problem; 5 – a very severe problem.
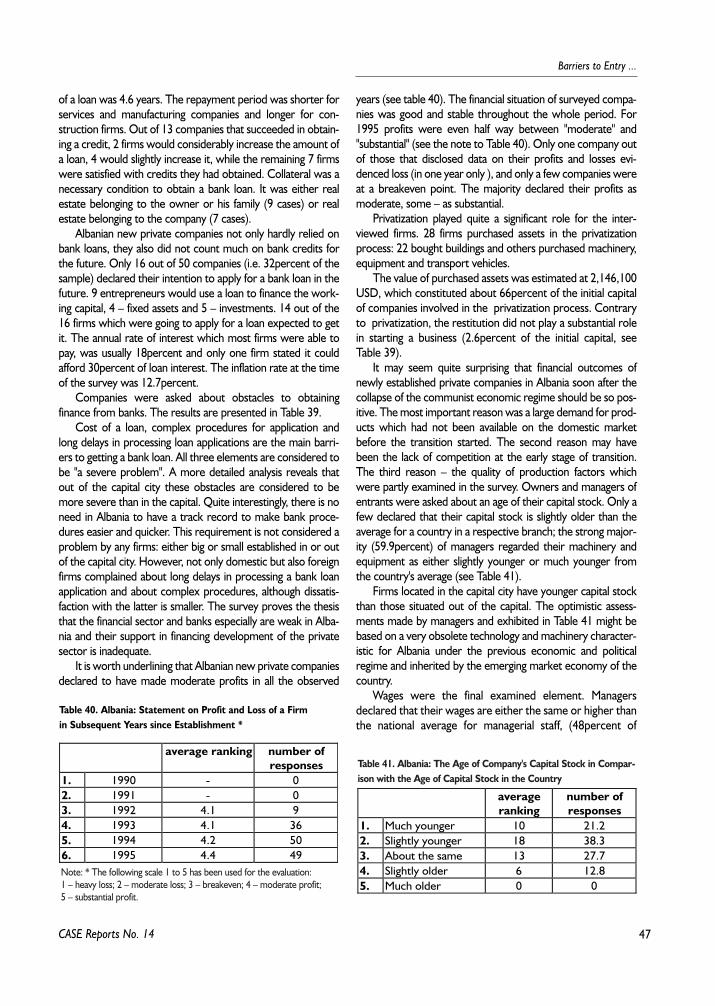
47
Barriers to Entry ...
of a loan was 4.6 years. The repayment period was shorter forservices and manufacturing companies and longer for con-struction firms. Out of 13 companies that succeeded in obtain-ing a credit, 2 firms would considerably increase the amount ofa loan, 4 would slightly increase it, while the remaining 7 firmswere satisfied with credits they had obtained. Collateral was anecessary condition to obtain a bank loan. It was either realestate belonging to the owner or his family (9 cases) or realestate belonging to the company (7 cases).
Albanian new private companies not only hardly relied onbank loans, they also did not count much on bank credits forthe future. Only 16 out of 50 companies (i.e. 32percent of thesample) declared their intention to apply for a bank loan in thefuture. 9 entrepreneurs would use a loan to finance the work-ing capital, 4 – fixed assets and 5 – investments. 14 out of the16 firms which were going to apply for a loan expected to getit. The annual rate of interest which most firms were able topay, was usually 18percent and only one firm stated it couldafford 30percent of loan interest. The inflation rate at the timeof the survey was 12.7percent.
Companies were asked about obstacles to obtainingfinance from banks. The results are presented in Table 39.
Cost of a loan, complex procedures for application andlong delays in processing loan applications are the main barri-ers to getting a bank loan. All three elements are considered tobe "a severe problem". A more detailed analysis reveals thatout of the capital city these obstacles are considered to bemore severe than in the capital. Quite interestingly, there is noneed in Albania to have a track record to make bank proce-dures easier and quicker. This requirement is not considered aproblem by any firms: either big or small established in or outof the capital city. However, not only domestic but also foreignfirms complained about long delays in processing a bank loanapplication and about complex procedures, although dissatis-faction with the latter is smaller. The survey proves the thesisthat the financial sector and banks especially are weak in Alba-nia and their support in financing development of the privatesector is inadequate.
It is worth underlining that Albanian new private companiesdeclared to have made moderate profits in all the observed
years (see table 40). The financial situation of surveyed compa-nies was good and stable throughout the whole period. For1995 profits were even half way between "moderate" and"substantial" (see the note to Table 40). Only one company outof those that disclosed data on their profits and losses evi-denced loss (in one year only ), and only a few companies wereat a breakeven point. The majority declared their profits asmoderate, some – as substantial.
Privatization played quite a significant role for the inter-viewed firms. 28 firms purchased assets in the privatizationprocess: 22 bought buildings and others purchased machinery,equipment and transport vehicles.
The value of purchased assets was estimated at 2,146,100USD, which constituted about 66percent of the initial capitalof companies involved in the privatization process. Contraryto privatization, the restitution did not play a substantial rolein starting a business (2.6percent of the initial capital, seeTable 39).
It may seem quite surprising that financial outcomes ofnewly established private companies in Albania soon after thecollapse of the communist economic regime should be so pos-itive. The most important reason was a large demand for prod-ucts which had not been available on the domestic marketbefore the transition started. The second reason may havebeen the lack of competition at the early stage of transition.The third reason – the quality of production factors whichwere partly examined in the survey. Owners and managers ofentrants were asked about an age of their capital stock. Only afew declared that their capital stock is slightly older than theaverage for a country in a respective branch; the strong major-ity (59.9percent) of managers regarded their machinery andequipment as either slightly younger or much younger fromthe country's average (see Table 41).
Firms located in the capital city have younger capital stockthan those situated out of the capital. The optimistic assess-ments made by managers and exhibited in Table 41 might bebased on a very obsolete technology and machinery character-istic for Albania under the previous economic and politicalregime and inherited by the emerging market economy of thecountry.
Wages were the final examined element. Managersdeclared that their wages are either the same or higher thanthe national average for managerial staff, (48percent of
CASE Reports No. 14
Table 40. Albania: Statement on Profit and Loss of a Firmin Subsequent Years since Establishment *
average ranking number ofresponses
1. 1990 - 02. 1991 - 03. 1992 4.1 94. 1993 4.1 365. 1994 4.2 506. 1995 4.4 49Note: * The following scale 1 to 5 has been used for the evaluation:1 – heavy loss; 2 – moderate loss; 3 – breakeven; 4 – moderate profit;5 – substantial profit.
Table 41. Albania: The Age of Company's Capital Stock in Compar-ison with the Age of Capital Stock in the Country
averageranking
number ofresponses
1. Much younger 10 21.22. Slightly younger 18 38.33. About the same 13 27.74. Slightly older 6 12.85. Much older 0 0
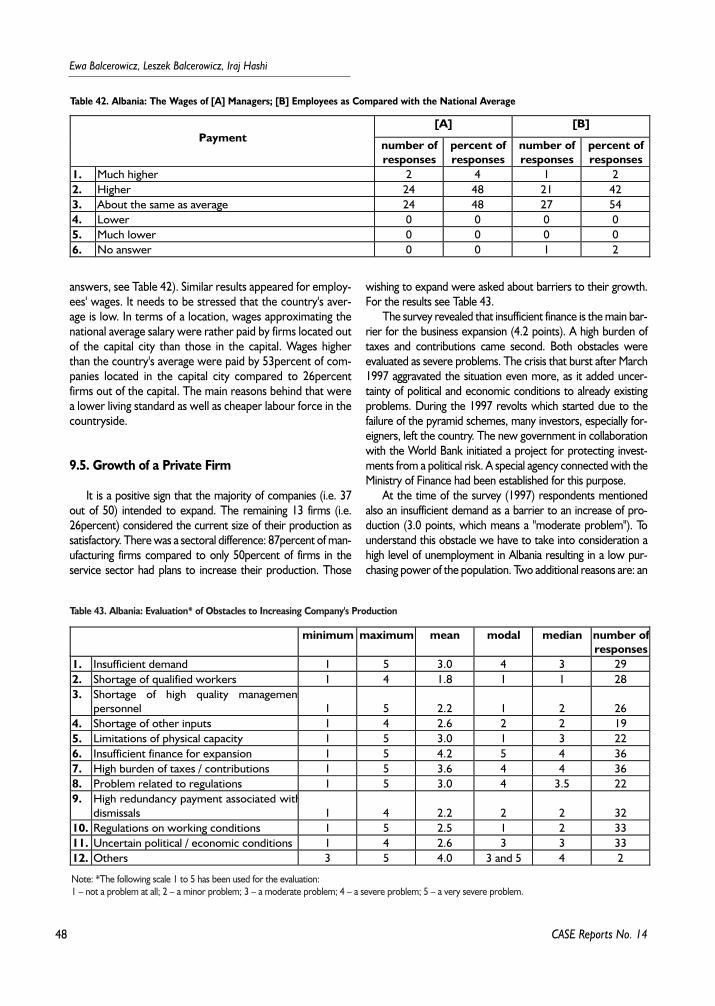
48
Ewa Balcerowicz, Leszek Balcerowicz, Iraj Hashi
answers, see Table 42). Similar results appeared for employ-ees' wages. It needs to be stressed that the country's aver-age is low. In terms of a location, wages approximating thenational average salary were rather paid by firms located outof the capital city than those in the capital. Wages higherthan the country's average were paid by 53percent of com-panies located in the capital city compared to 26percentfirms out of the capital. The main reasons behind that werea lower living standard as well as cheaper labour force in thecountryside.
9.5. Growth of a Private Firm
It is a positive sign that the majority of companies (i.e. 37out of 50) intended to expand. The remaining 13 firms (i.e.26percent) considered the current size of their production assatisfactory. There was a sectoral difference: 87percent of man-ufacturing firms compared to only 50percent of firms in theservice sector had plans to increase their production. Those
wishing to expand were asked about barriers to their growth.For the results see Table 43.
The survey revealed that insufficient finance is the main bar-rier for the business expansion (4.2 points). A high burden oftaxes and contributions came second. Both obstacles wereevaluated as severe problems. The crisis that burst after March1997 aggravated the situation even more, as it added uncer-tainty of political and economic conditions to already existingproblems. During the 1997 revolts which started due to thefailure of the pyramid schemes, many investors, especially for-eigners, left the country. The new government in collaborationwith the World Bank initiated a project for protecting invest-ments from a political risk. A special agency connected with theMinistry of Finance had been established for this purpose.
At the time of the survey (1997) respondents mentionedalso an insufficient demand as a barrier to an increase of pro-duction (3.0 points, which means a "moderate problem"). Tounderstand this obstacle we have to take into consideration ahigh level of unemployment in Albania resulting in a low pur-chasing power of the population. Two additional reasons are: an
CASE Reports No. 14
Table 42. Albania: The Wages of [A] Managers; [B] Employees as Compared with the National Average
[A] [B]Payment
number ofresponses
percent ofresponses
number ofresponses
percent ofresponses
1. Much higher 2 4 1 22. Higher 24 48 21 423. About the same as average 24 48 27 544. Lower 0 0 0 05. Much lower 0 0 0 06. No answer 0 0 1 2
Table 43. Albania: Evaluation* of Obstacles to Increasing Company's Production
minimum maximum mean modal median number ofresponses
1. Insufficient demand 1 5 3.0 4 3 292. Shortage of qualified workers 1 4 1.8 1 1 283. Shortage of high quality management
personnel 1 5 2.2 1 2 264. Shortage of other inputs 1 4 2.6 2 2 195. Limitations of physical capacity 1 5 3.0 1 3 226. Insufficient finance for expansion 1 5 4.2 5 4 367. High burden of taxes / contributions 1 5 3.6 4 4 368. Problem related to regulations 1 5 3.0 4 3.5 229. High redundancy payment associated with
dismissals 1 4 2.2 2 2 3210. Regulations on working conditions 1 5 2.5 1 2 3311. Uncertain political / economic conditions 1 4 2.6 3 3 3312. Others 3 5 4.0 3 and 5 4 2
Note: *The following scale 1 to 5 has been used for the evaluation:1 – not a problem at all; 2 – a minor problem; 3 – a moderate problem; 4 – a severe problem; 5 – a very severe problem.
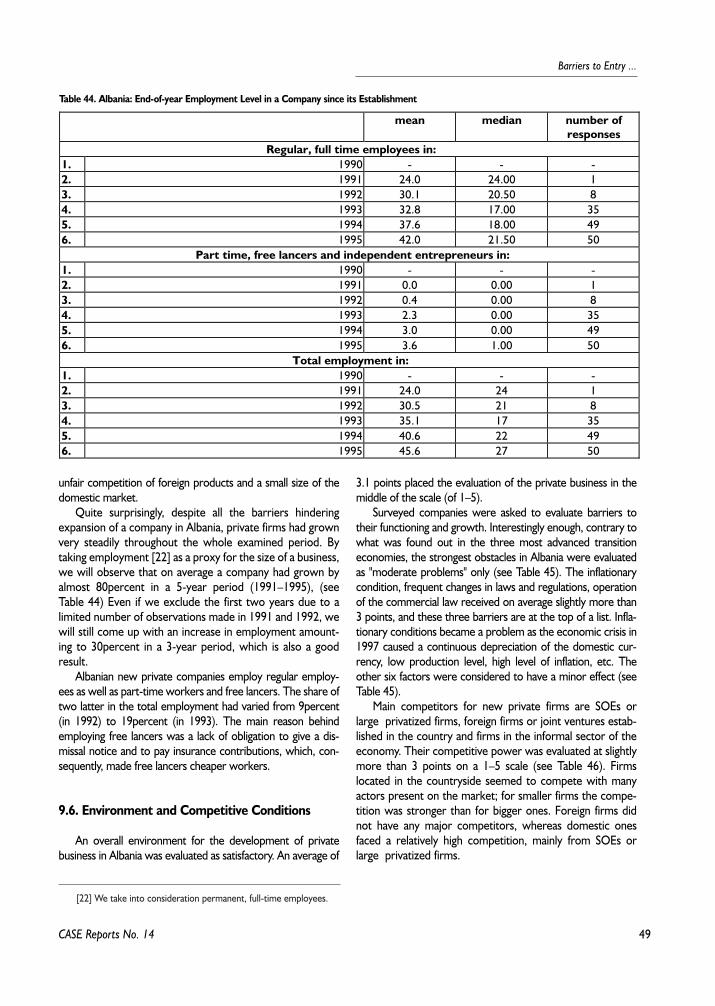
49
Barriers to Entry ...
unfair competition of foreign products and a small size of thedomestic market.
Quite surprisingly, despite all the barriers hinderingexpansion of a company in Albania, private firms had grownvery steadily throughout the whole examined period. Bytaking employment [22] as a proxy for the size of a business,we will observe that on average a company had grown byalmost 80percent in a 5-year period (1991–1995), (seeTable 44) Even if we exclude the first two years due to alimited number of observations made in 1991 and 1992, wewill still come up with an increase in employment amount-ing to 30percent in a 3-year period, which is also a goodresult.
Albanian new private companies employ regular employ-ees as well as part-time workers and free lancers. The share oftwo latter in the total employment had varied from 9percent(in 1992) to 19percent (in 1993). The main reason behindemploying free lancers was a lack of obligation to give a dis-missal notice and to pay insurance contributions, which, con-sequently, made free lancers cheaper workers.
9.6. Environment and Competitive Conditions
An overall environment for the development of privatebusiness in Albania was evaluated as satisfactory. An average of
3.1 points placed the evaluation of the private business in themiddle of the scale (of 1–5).
Surveyed companies were asked to evaluate barriers totheir functioning and growth. Interestingly enough, contrary towhat was found out in the three most advanced transitioneconomies, the strongest obstacles in Albania were evaluatedas "moderate problems" only (see Table 45). The inflationarycondition, frequent changes in laws and regulations, operationof the commercial law received on average slightly more than3 points, and these three barriers are at the top of a list. Infla-tionary conditions became a problem as the economic crisis in1997 caused a continuous depreciation of the domestic cur-rency, low production level, high level of inflation, etc. Theother six factors were considered to have a minor effect (seeTable 45).
Main competitors for new private firms are SOEs orlarge privatized firms, foreign firms or joint ventures estab-lished in the country and firms in the informal sector of theeconomy. Their competitive power was evaluated at slightlymore than 3 points on a 1–5 scale (see Table 46). Firmslocated in the countryside seemed to compete with manyactors present on the market; for smaller firms the compe-tition was stronger than for bigger ones. Foreign firms didnot have any major competitors, whereas domestic onesfaced a relatively high competition, mainly from SOEs orlarge privatized firms.
CASE Reports No. 14
Table 44. Albania: End-of-year Employment Level in a Company since its Establishment
mean median number ofresponses
Regular, full time employees in:1. 1990 - - -2. 1991 24.0 24.00 13. 1992 30.1 20.50 84. 1993 32.8 17.00 355. 1994 37.6 18.00 496. 1995 42.0 21.50 50
Part time, free lancers and independent entrepreneurs in:1. 1990 - - -2. 1991 0.0 0.00 13. 1992 0.4 0.00 84. 1993 2.3 0.00 355. 1994 3.0 0.00 496. 1995 3.6 1.00 50
Total employment in:1. 1990 - - -2. 1991 24.0 24 13. 1992 30.5 21 84. 1993 35.1 17 355. 1994 40.6 22 496. 1995 45.6 27 50
[22] We take into consideration permanent, full-time employees.
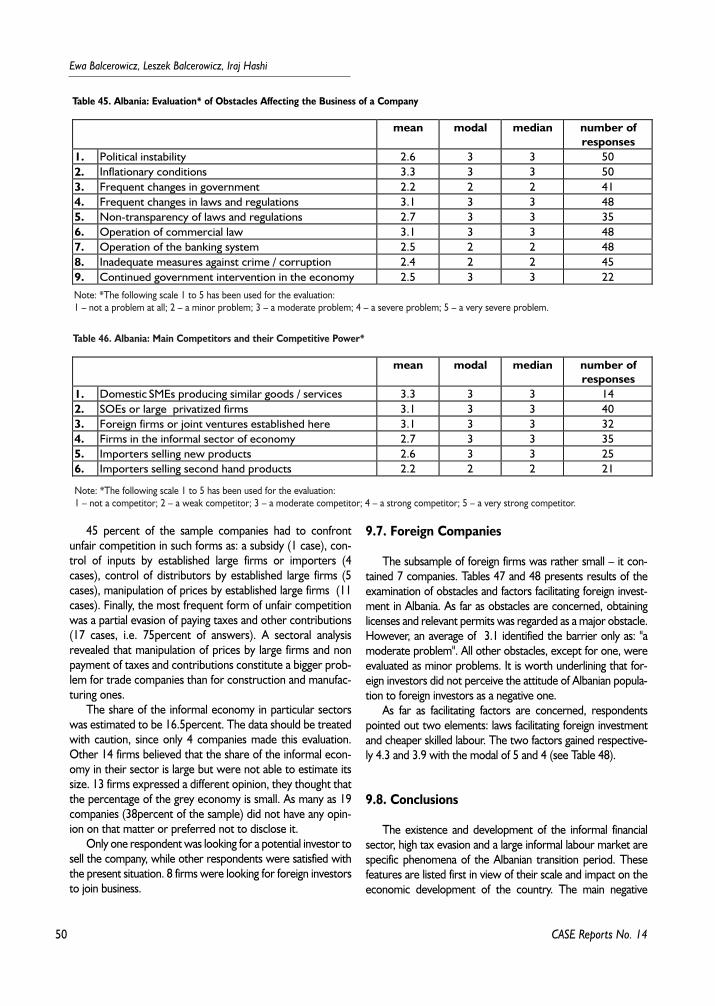
50
Ewa Balcerowicz, Leszek Balcerowicz, Iraj Hashi
45 percent of the sample companies had to confrontunfair competition in such forms as: a subsidy (1 case), con-trol of inputs by established large firms or importers (4cases), control of distributors by established large firms (5cases), manipulation of prices by established large firms (11cases). Finally, the most frequent form of unfair competitionwas a partial evasion of paying taxes and other contributions(17 cases, i.e. 75percent of answers). A sectoral analysisrevealed that manipulation of prices by large firms and nonpayment of taxes and contributions constitute a bigger prob-lem for trade companies than for construction and manufac-turing ones.
The share of the informal economy in particular sectorswas estimated to be 16.5percent. The data should be treatedwith caution, since only 4 companies made this evaluation.Other 14 firms believed that the share of the informal econ-omy in their sector is large but were not able to estimate itssize. 13 firms expressed a different opinion, they thought thatthe percentage of the grey economy is small. As many as 19companies (38percent of the sample) did not have any opin-ion on that matter or preferred not to disclose it.
Only one respondent was looking for a potential investor tosell the company, while other respondents were satisfied withthe present situation. 8 firms were looking for foreign investorsto join business.
9.7. Foreign Companies
The subsample of foreign firms was rather small – it con-tained 7 companies. Tables 47 and 48 presents results of theexamination of obstacles and factors facilitating foreign invest-ment in Albania. As far as obstacles are concerned, obtaininglicenses and relevant permits was regarded as a major obstacle.However, an average of 3.1 identified the barrier only as: "amoderate problem". All other obstacles, except for one, wereevaluated as minor problems. It is worth underlining that for-eign investors did not perceive the attitude of Albanian popula-tion to foreign investors as a negative one.
As far as facilitating factors are concerned, respondentspointed out two elements: laws facilitating foreign investmentand cheaper skilled labour. The two factors gained respective-ly 4.3 and 3.9 with the modal of 5 and 4 (see Table 48).
9.8. Conclusions
The existence and development of the informal financialsector, high tax evasion and a large informal labour market arespecific phenomena of the Albanian transition period. Thesefeatures are listed first in view of their scale and impact on theeconomic development of the country. The main negative
CASE Reports No. 14
Table 45. Albania: Evaluation* of Obstacles Affecting the Business of a Company
mean modal median number ofresponses
1. Political instability 2.6 3 3 502. Inflationary conditions 3.3 3 3 503. Frequent changes in government 2.2 2 2 414. Frequent changes in laws and regulations 3.1 3 3 485. Non-transparency of laws and regulations 2.7 3 3 356. Operation of commercial law 3.1 3 3 487. Operation of the banking system 2.5 2 2 488. Inadequate measures against crime / corruption 2.4 2 2 459. Continued government intervention in the economy 2.5 3 3 22Note: *The following scale 1 to 5 has been used for the evaluation:1 – not a problem at all; 2 – a minor problem; 3 – a moderate problem; 4 – a severe problem; 5 – a very severe problem.
Table 46. Albania: Main Competitors and their Competitive Power*
mean modal median number ofresponses
1. Domestic SMEs producing similar goods / services 3.3 3 3 142. SOEs or large privatized firms 3.1 3 3 403. Foreign firms or joint ventures established here 3.1 3 3 324. Firms in the informal sector of economy 2.7 3 3 355. Importers selling new products 2.6 3 3 256. Importers selling second hand products 2.2 2 2 21
Note: *The following scale 1 to 5 has been used for the evaluation:1 – not a competitor; 2 – a weak competitor; 3 – a moderate competitor; 4 – a strong competitor; 5 – a very strong competitor.
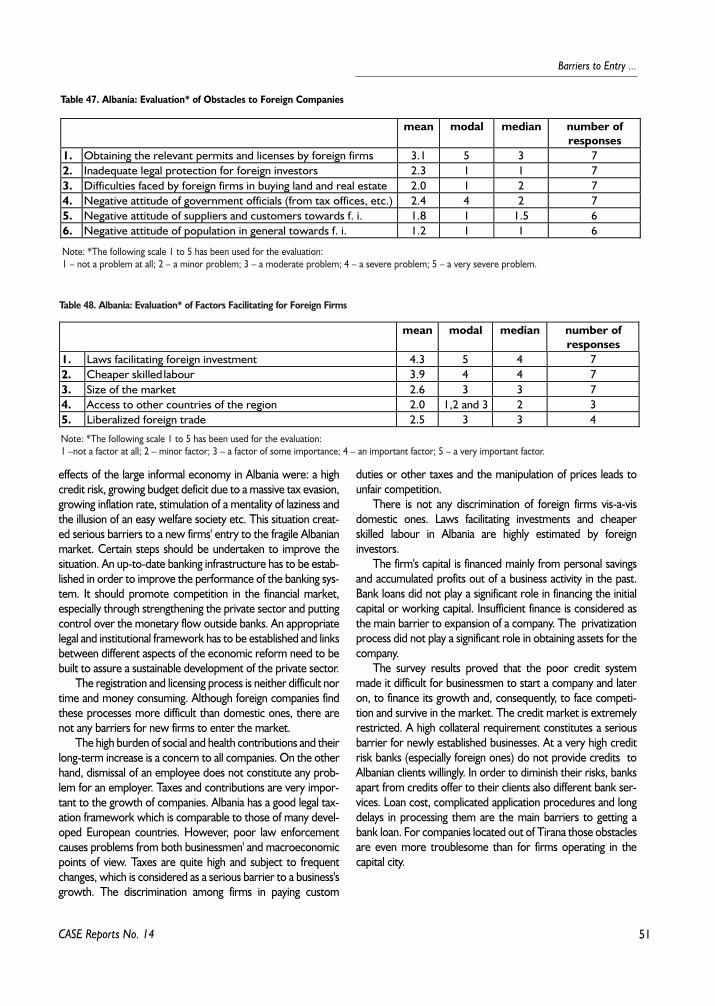
51
Barriers to Entry ...
effects of the large informal economy in Albania were: a highcredit risk, growing budget deficit due to a massive tax evasion,growing inflation rate, stimulation of a mentality of laziness andthe illusion of an easy welfare society etc. This situation creat-ed serious barriers to a new firms' entry to the fragile Albanianmarket. Certain steps should be undertaken to improve thesituation. An up-to-date banking infrastructure has to be estab-lished in order to improve the performance of the banking sys-tem. It should promote competition in the financial market,especially through strengthening the private sector and puttingcontrol over the monetary flow outside banks. An appropriatelegal and institutional framework has to be established and linksbetween different aspects of the economic reform need to bebuilt to assure a sustainable development of the private sector.
The registration and licensing process is neither difficult nortime and money consuming. Although foreign companies findthese processes more difficult than domestic ones, there arenot any barriers for new firms to enter the market.
The high burden of social and health contributions and theirlong-term increase is a concern to all companies. On the otherhand, dismissal of an employee does not constitute any prob-lem for an employer. Taxes and contributions are very impor-tant to the growth of companies. Albania has a good legal tax-ation framework which is comparable to those of many devel-oped European countries. However, poor law enforcementcauses problems from both businessmen' and macroeconomicpoints of view. Taxes are quite high and subject to frequentchanges, which is considered as a serious barrier to a business'sgrowth. The discrimination among firms in paying custom
duties or other taxes and the manipulation of prices leads tounfair competition.
There is not any discrimination of foreign firms vis-a-visdomestic ones. Laws facilitating investments and cheaperskilled labour in Albania are highly estimated by foreigninvestors.
The firm's capital is financed mainly from personal savingsand accumulated profits out of a business activity in the past.Bank loans did not play a significant role in financing the initialcapital or working capital. Insufficient finance is considered asthe main barrier to expansion of a company. The privatizationprocess did not play a significant role in obtaining assets for thecompany.
The survey results proved that the poor credit systemmade it difficult for businessmen to start a company and lateron, to finance its growth and, consequently, to face competi-tion and survive in the market. The credit market is extremelyrestricted. A high collateral requirement constitutes a seriousbarrier for newly established businesses. At a very high creditrisk banks (especially foreign ones) do not provide credits toAlbanian clients willingly. In order to diminish their risks, banksapart from credits offer to their clients also different bank ser-vices. Loan cost, complicated application procedures and longdelays in processing them are the main barriers to getting abank loan. For companies located out of Tirana those obstaclesare even more troublesome than for firms operating in thecapital city.
CASE Reports No. 14
Table 47. Albania: Evaluation* of Obstacles to Foreign Companies
mean modal median number ofresponses
1. Obtaining the relevant permits and licenses by foreign firms 3.1 5 3 72. Inadequate legal protection for foreign investors 2.3 1 1 73. Difficulties faced by foreign firms in buying land and real estate 2.0 1 2 74. Negative attitude of government officials (from tax offices, etc.) 2.4 4 2 75. Negative attitude of suppliers and customers towards f. i. 1.8 1 1.5 66. Negative attitude of population in general towards f. i. 1.2 1 1 6
Note: *The following scale 1 to 5 has been used for the evaluation:1 – not a problem at all; 2 – a minor problem; 3 – a moderate problem; 4 – a severe problem; 5 – a very severe problem.
Table 48. Albania: Evaluation* of Factors Facilitating for Foreign Firms
mean modal median number ofresponses
1. Laws facilitating foreign investment 4.3 5 4 72. Cheaper skilled labour 3.9 4 4 73. Size of the market 2.6 3 3 74. Access to other countries of the region 2.0 1,2 and 3 2 35. Liberalized foreign trade 2.5 3 3 4
Note: *The following scale 1 to 5 has been used for the evaluation:1 –not a factor at all; 2 – minor factor; 3 – a factor of some importance; 4 – an important factor; 5 – a very important factor.
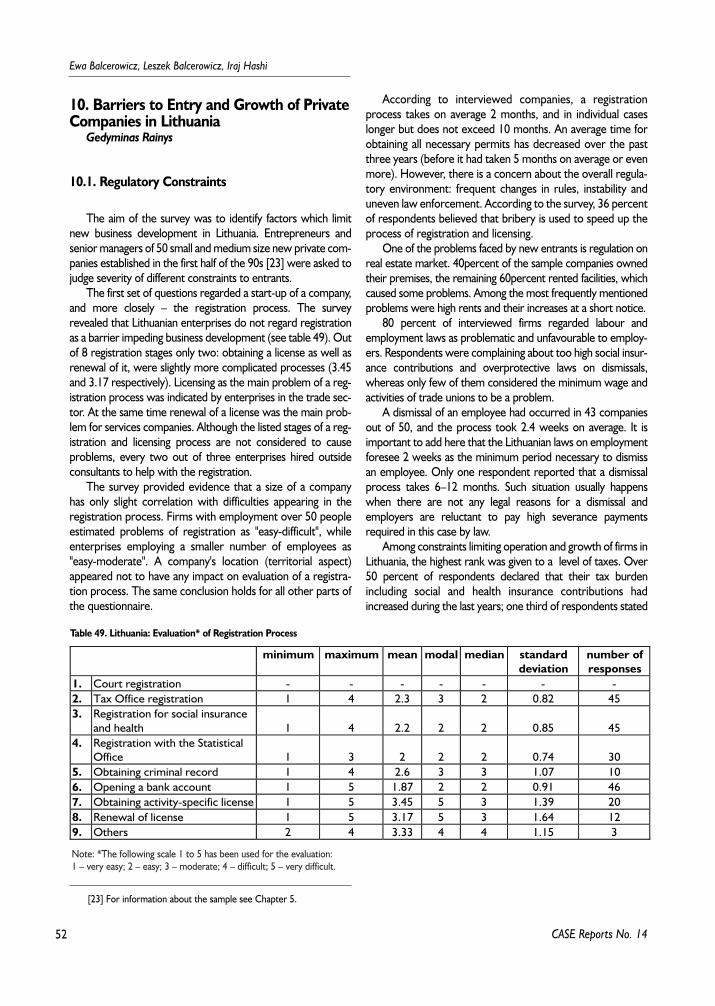
52
Ewa Balcerowicz, Leszek Balcerowicz, Iraj Hashi
10. Barriers to Entry and Growth of PrivateCompanies in Lithuania
Gedyminas Rainys
10.1. Regulatory Constraints
The aim of the survey was to identify factors which limitnew business development in Lithuania. Entrepreneurs andsenior managers of 50 small and medium size new private com-panies established in the first half of the 90s [23] were asked tojudge severity of different constraints to entrants.
The first set of questions regarded a start-up of a company,and more closely – the registration process. The surveyrevealed that Lithuanian enterprises do not regard registrationas a barrier impeding business development (see table 49). Outof 8 registration stages only two: obtaining a license as well asrenewal of it, were slightly more complicated processes (3.45and 3.17 respectively). Licensing as the main problem of a reg-istration process was indicated by enterprises in the trade sec-tor. At the same time renewal of a license was the main prob-lem for services companies. Although the listed stages of a reg-istration and licensing process are not considered to causeproblems, every two out of three enterprises hired outsideconsultants to help with the registration.
The survey provided evidence that a size of a companyhas only slight correlation with difficulties appearing in theregistration process. Firms with employment over 50 peopleestimated problems of registration as "easy-difficult", whileenterprises employing a smaller number of employees as"easy-moderate". A company's location (territorial aspect)appeared not to have any impact on evaluation of a registra-tion process. The same conclusion holds for all other parts ofthe questionnaire.
According to interviewed companies, a registrationprocess takes on average 2 months, and in individual caseslonger but does not exceed 10 months. An average time forobtaining all necessary permits has decreased over the pastthree years (before it had taken 5 months on average or evenmore). However, there is a concern about the overall regula-tory environment: frequent changes in rules, instability anduneven law enforcement. According to the survey, 36 percentof respondents believed that bribery is used to speed up theprocess of registration and licensing.
One of the problems faced by new entrants is regulation onreal estate market. 40percent of the sample companies ownedtheir premises, the remaining 60percent rented facilities, whichcaused some problems. Among the most frequently mentionedproblems were high rents and their increases at a short notice.
80 percent of interviewed firms regarded labour andemployment laws as problematic and unfavourable to employ-ers. Respondents were complaining about too high social insur-ance contributions and overprotective laws on dismissals,whereas only few of them considered the minimum wage andactivities of trade unions to be a problem.
A dismissal of an employee had occurred in 43 companiesout of 50, and the process took 2.4 weeks on average. It isimportant to add here that the Lithuanian laws on employmentforesee 2 weeks as the minimum period necessary to dismissan employee. Only one respondent reported that a dismissalprocess takes 6–12 months. Such situation usually happenswhen there are not any legal reasons for a dismissal andemployers are reluctant to pay high severance paymentsrequired in this case by law.
Among constraints limiting operation and growth of firms inLithuania, the highest rank was given to a level of taxes. Over50 percent of respondents declared that their tax burdenincluding social and health insurance contributions hadincreased during the last years; one third of respondents stated
CASE Reports No. 14
[23] For information about the sample see Chapter 5.
Table 49. Lithuania: Evaluation* of Registration Process
minimum maximum mean modal median standarddeviation
number ofresponses
1. Court registration - - - - - - -2. Tax Office registration 1 4 2.3 3 2 0.82 453. Registration for social insurance
and health 1 4 2.2 2 2 0.85 454. Registration with the Statistical
Office 1 3 2 2 2 0.74 305. Obtaining criminal record 1 4 2.6 3 3 1.07 106. Opening a bank account 1 5 1.87 2 2 0.91 467. Obtaining activity-specific license 1 5 3.45 5 3 1.39 208. Renewal of license 1 5 3.17 5 3 1.64 129. Others 2 4 3.33 4 4 1.15 3
Note: *The following scale 1 to 5 has been used for the evaluation: 1 – very easy; 2 – easy; 3 – moderate; 4 – difficult; 5 – very difficult.
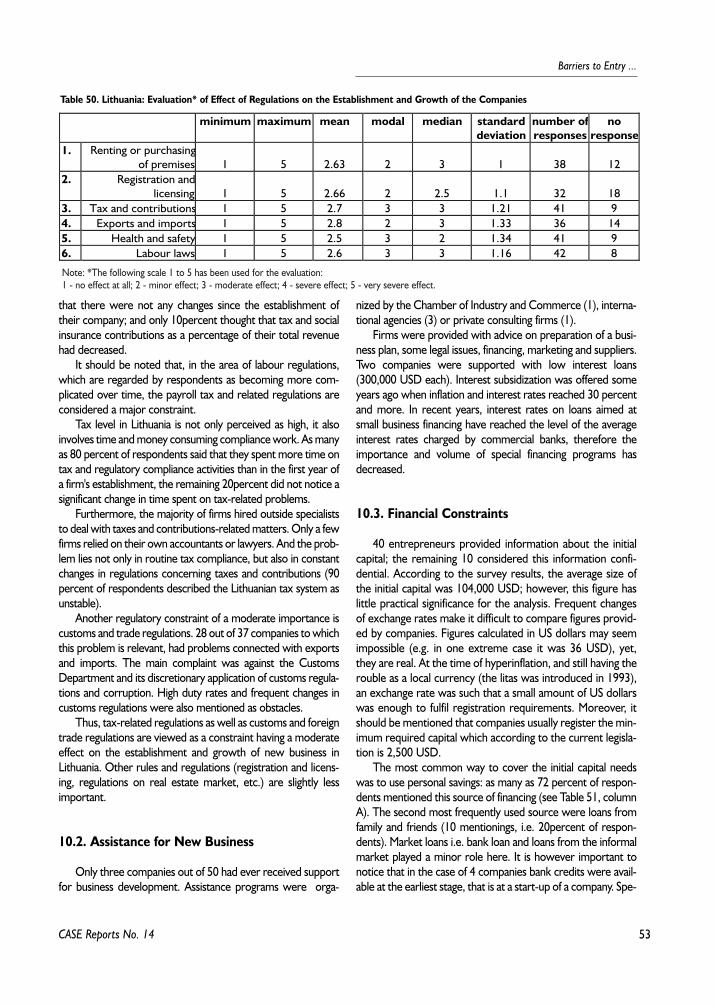
53
Barriers to Entry ...
that there were not any changes since the establishment oftheir company; and only 10percent thought that tax and socialinsurance contributions as a percentage of their total revenuehad decreased.
It should be noted that, in the area of labour regulations,which are regarded by respondents as becoming more com-plicated over time, the payroll tax and related regulations areconsidered a major constraint.
Tax level in Lithuania is not only perceived as high, it alsoinvolves time and money consuming compliance work. As manyas 80 percent of respondents said that they spent more time ontax and regulatory compliance activities than in the first year ofa firm's establishment, the remaining 20percent did not notice asignificant change in time spent on tax-related problems.
Furthermore, the majority of firms hired outside specialiststo deal with taxes and contributions-related matters. Only a fewfirms relied on their own accountants or lawyers. And the prob-lem lies not only in routine tax compliance, but also in constantchanges in regulations concerning taxes and contributions (90percent of respondents described the Lithuanian tax system asunstable).
Another regulatory constraint of a moderate importance iscustoms and trade regulations. 28 out of 37 companies to whichthis problem is relevant, had problems connected with exportsand imports. The main complaint was against the CustomsDepartment and its discretionary application of customs regula-tions and corruption. High duty rates and frequent changes incustoms regulations were also mentioned as obstacles.
Thus, tax-related regulations as well as customs and foreigntrade regulations are viewed as a constraint having a moderateeffect on the establishment and growth of new business inLithuania. Other rules and regulations (registration and licens-ing, regulations on real estate market, etc.) are slightly lessimportant.
10.2. Assistance for New Business
Only three companies out of 50 had ever received supportfor business development. Assistance programs were orga-
nized by the Chamber of Industry and Commerce (1), interna-tional agencies (3) or private consulting firms (1).
Firms were provided with advice on preparation of a busi-ness plan, some legal issues, financing, marketing and suppliers.Two companies were supported with low interest loans(300,000 USD each). Interest subsidization was offered someyears ago when inflation and interest rates reached 30 percentand more. In recent years, interest rates on loans aimed atsmall business financing have reached the level of the averageinterest rates charged by commercial banks, therefore theimportance and volume of special financing programs hasdecreased.
10.3. Financial Constraints
40 entrepreneurs provided information about the initialcapital; the remaining 10 considered this information confi-dential. According to the survey results, the average size ofthe initial capital was 104,000 USD; however, this figure haslittle practical significance for the analysis. Frequent changesof exchange rates make it difficult to compare figures provid-ed by companies. Figures calculated in US dollars may seemimpossible (e.g. in one extreme case it was 36 USD), yet,they are real. At the time of hyperinflation, and still having therouble as a local currency (the litas was introduced in 1993),an exchange rate was such that a small amount of US dollarswas enough to fulfil registration requirements. Moreover, itshould be mentioned that companies usually register the min-imum required capital which according to the current legisla-tion is 2,500 USD.
The most common way to cover the initial capital needswas to use personal savings: as many as 72 percent of respon-dents mentioned this source of financing (see Table 51, columnA). The second most frequently used source were loans fromfamily and friends (10 mentionings, i.e. 20percent of respon-dents). Market loans i.e. bank loan and loans from the informalmarket played a minor role here. It is however important tonotice that in the case of 4 companies bank credits were avail-able at the earliest stage, that is at a start-up of a company. Spe-
CASE Reports No. 14
Table 50. Lithuania: Evaluation* of Effect of Regulations on the Establishment and Growth of the Companies
minimum maximum mean modal median standarddeviation
number ofresponses
noresponse
1. Renting or purchasingof premises 1 5 2.63 2 3 1 38 12
2. Registration andlicensing 1 5 2.66 2 2.5 1.1 32 18
3. Tax and contributions 1 5 2.7 3 3 1.21 41 94. Exports and imports 1 5 2.8 2 3 1.33 36 145. Health and safety 1 5 2.5 3 2 1.34 41 96. Labour laws 1 5 2.6 3 3 1.16 42 8
Note: *The following scale 1 to 5 has been used for the evaluation: 1 - no effect at all; 2 - minor effect; 3 - moderate effect; 4 - severe effect; 5 - very severe effect.
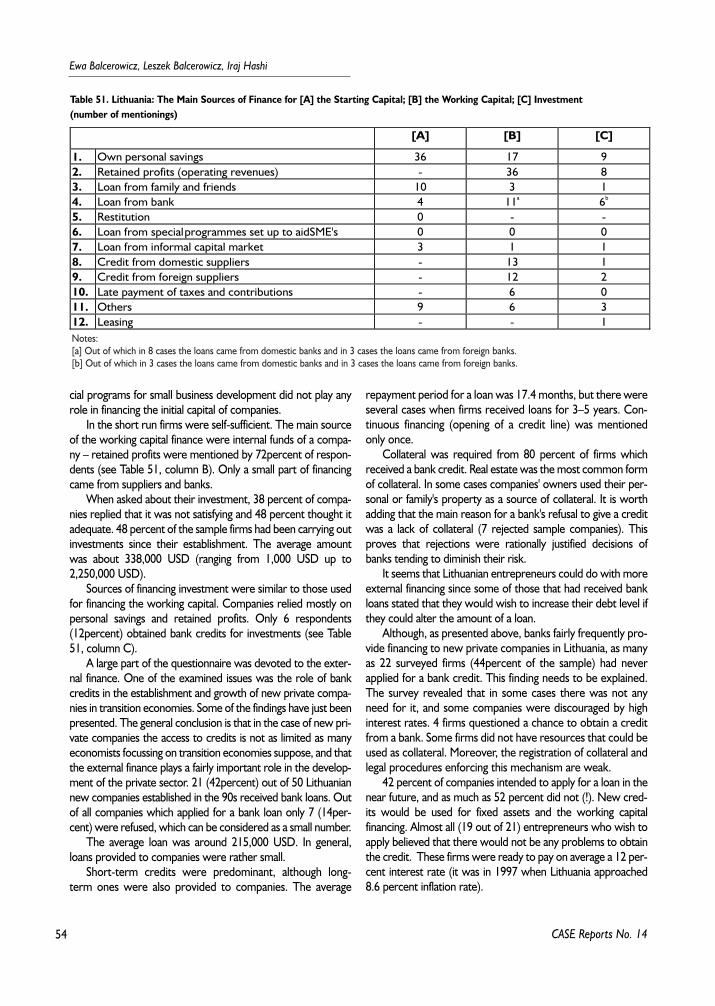
54
Ewa Balcerowicz, Leszek Balcerowicz, Iraj Hashi
cial programs for small business development did not play anyrole in financing the initial capital of companies.
In the short run firms were self-sufficient. The main sourceof the working capital finance were internal funds of a compa-ny – retained profits were mentioned by 72percent of respon-dents (see Table 51, column B). Only a small part of financingcame from suppliers and banks.
When asked about their investment, 38 percent of compa-nies replied that it was not satisfying and 48 percent thought itadequate. 48 percent of the sample firms had been carrying outinvestments since their establishment. The average amountwas about 338,000 USD (ranging from 1,000 USD up to2,250,000 USD).
Sources of financing investment were similar to those usedfor financing the working capital. Companies relied mostly onpersonal savings and retained profits. Only 6 respondents(12percent) obtained bank credits for investments (see Table51, column C).
A large part of the questionnaire was devoted to the exter-nal finance. One of the examined issues was the role of bankcredits in the establishment and growth of new private compa-nies in transition economies. Some of the findings have just beenpresented. The general conclusion is that in the case of new pri-vate companies the access to credits is not as limited as manyeconomists focussing on transition economies suppose, and thatthe external finance plays a fairly important role in the develop-ment of the private sector. 21 (42percent) out of 50 Lithuaniannew companies established in the 90s received bank loans. Outof all companies which applied for a bank loan only 7 (14per-cent) were refused, which can be considered as a small number.
The average loan was around 215,000 USD. In general,loans provided to companies were rather small.
Short-term credits were predominant, although long-term ones were also provided to companies. The average
repayment period for a loan was 17.4 months, but there wereseveral cases when firms received loans for 3–5 years. Con-tinuous financing (opening of a credit line) was mentionedonly once.
Collateral was required from 80 percent of firms whichreceived a bank credit. Real estate was the most common formof collateral. In some cases companies' owners used their per-sonal or family's property as a source of collateral. It is worthadding that the main reason for a bank's refusal to give a creditwas a lack of collateral (7 rejected sample companies). Thisproves that rejections were rationally justified decisions ofbanks tending to diminish their risk.
It seems that Lithuanian entrepreneurs could do with moreexternal financing since some of those that had received bankloans stated that they would wish to increase their debt level ifthey could alter the amount of a loan.
Although, as presented above, banks fairly frequently pro-vide financing to new private companies in Lithuania, as manyas 22 surveyed firms (44percent of the sample) had neverapplied for a bank credit. This finding needs to be explained.The survey revealed that in some cases there was not anyneed for it, and some companies were discouraged by highinterest rates. 4 firms questioned a chance to obtain a creditfrom a bank. Some firms did not have resources that could beused as collateral. Moreover, the registration of collateral andlegal procedures enforcing this mechanism are weak.
42 percent of companies intended to apply for a loan in thenear future, and as much as 52 percent did not (!). New cred-its would be used for fixed assets and the working capitalfinancing. Almost all (19 out of 21) entrepreneurs who wish toapply believed that there would not be any problems to obtainthe credit. These firms were ready to pay on average a 12 per-cent interest rate (it was in 1997 when Lithuania approached8.6 percent inflation rate).
CASE Reports No. 14
Table 51. Lithuania: The Main Sources of Finance for [A] the Starting Capital; [B] the Working Capital; [C] Investment (number of mentionings)
[A] [B] [C]
1. Own personal savings 36 17 92. Retained profits (operating revenues) - 36 83. Loan from family and friends 10 3 14. Loan from bank 4 11a 6b
5. Restitution 0 - -6. Loan from special programmes set up to aid SME's 0 0 07. Loan from informal capital market 3 1 18. Credit from domestic suppliers - 13 19. Credit from foreign suppliers - 12 210. Late payment of taxes and contributions - 6 011. Others 9 6 312. Leasing - - 1Notes:[a] Out of which in 8 cases the loans came from domestic banks and in 3 cases the loans came from foreign banks.[b] Out of which in 3 cases the loans came from domestic banks and in 3 cases the loans came from foreign banks.
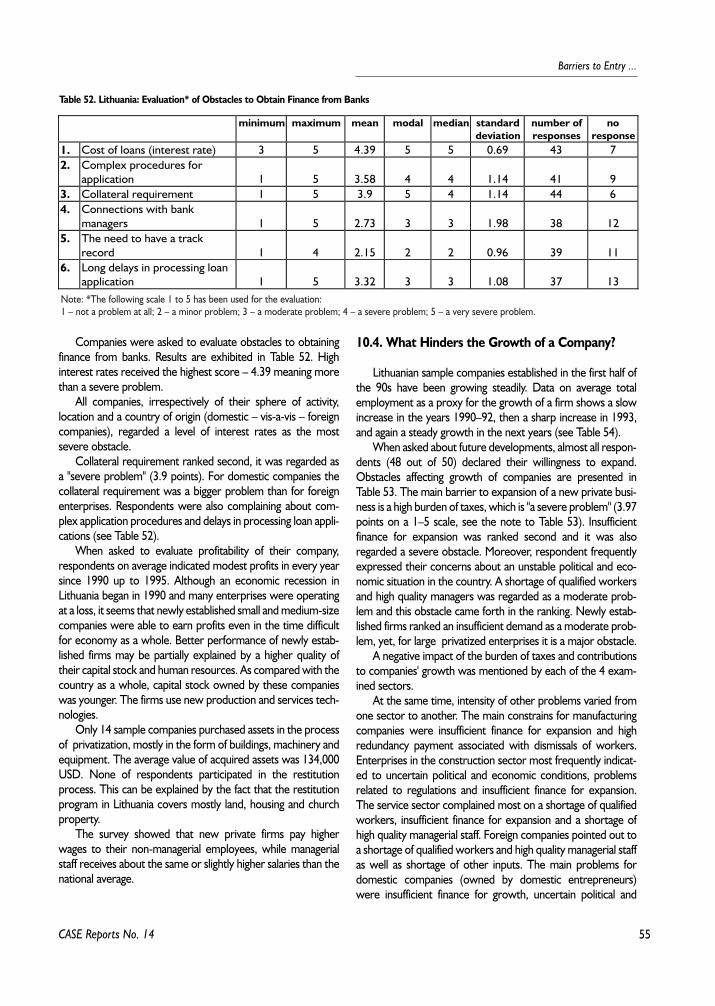
55
Barriers to Entry ...
Companies were asked to evaluate obstacles to obtainingfinance from banks. Results are exhibited in Table 52. Highinterest rates received the highest score – 4.39 meaning morethan a severe problem.
All companies, irrespectively of their sphere of activity,location and a country of origin (domestic – vis-a-vis – foreigncompanies), regarded a level of interest rates as the mostsevere obstacle.
Collateral requirement ranked second, it was regarded asa "severe problem" (3.9 points). For domestic companies thecollateral requirement was a bigger problem than for foreignenterprises. Respondents were also complaining about com-plex application procedures and delays in processing loan appli-cations (see Table 52).
When asked to evaluate profitability of their company,respondents on average indicated modest profits in every yearsince 1990 up to 1995. Although an economic recession inLithuania began in 1990 and many enterprises were operatingat a loss, it seems that newly established small and medium-sizecompanies were able to earn profits even in the time difficultfor economy as a whole. Better performance of newly estab-lished firms may be partially explained by a higher quality oftheir capital stock and human resources. As compared with thecountry as a whole, capital stock owned by these companieswas younger. The firms use new production and services tech-nologies.
Only 14 sample companies purchased assets in the processof privatization, mostly in the form of buildings, machinery andequipment. The average value of acquired assets was 134,000USD. None of respondents participated in the restitutionprocess. This can be explained by the fact that the restitutionprogram in Lithuania covers mostly land, housing and churchproperty.
The survey showed that new private firms pay higherwages to their non-managerial employees, while managerialstaff receives about the same or slightly higher salaries than thenational average.
10.4. What Hinders the Growth of a Company?
Lithuanian sample companies established in the first half ofthe 90s have been growing steadily. Data on average totalemployment as a proxy for the growth of a firm shows a slowincrease in the years 1990–92, then a sharp increase in 1993,and again a steady growth in the next years (see Table 54).
When asked about future developments, almost all respon-dents (48 out of 50) declared their willingness to expand.Obstacles affecting growth of companies are presented inTable 53. The main barrier to expansion of a new private busi-ness is a high burden of taxes, which is "a severe problem" (3.97points on a 1–5 scale, see the note to Table 53). Insufficientfinance for expansion was ranked second and it was alsoregarded a severe obstacle. Moreover, respondent frequentlyexpressed their concerns about an unstable political and eco-nomic situation in the country. A shortage of qualified workersand high quality managers was regarded as a moderate prob-lem and this obstacle came forth in the ranking. Newly estab-lished firms ranked an insufficient demand as a moderate prob-lem, yet, for large privatized enterprises it is a major obstacle.
A negative impact of the burden of taxes and contributionsto companies' growth was mentioned by each of the 4 exam-ined sectors.
At the same time, intensity of other problems varied fromone sector to another. The main constrains for manufacturingcompanies were insufficient finance for expansion and highredundancy payment associated with dismissals of workers.Enterprises in the construction sector most frequently indicat-ed to uncertain political and economic conditions, problemsrelated to regulations and insufficient finance for expansion.The service sector complained most on a shortage of qualifiedworkers, insufficient finance for expansion and a shortage ofhigh quality managerial staff. Foreign companies pointed out toa shortage of qualified workers and high quality managerial staffas well as shortage of other inputs. The main problems fordomestic companies (owned by domestic entrepreneurs)were insufficient finance for growth, uncertain political and
CASE Reports No. 14
Table 52. Lithuania: Evaluation* of Obstacles to Obtain Finance from Banks
minimum maximum mean modal median standarddeviation
number ofresponses
noresponse
1. Cost of loans (interest rate) 3 5 4.39 5 5 0.69 43 72. Complex procedures for
application 1 5 3.58 4 4 1.14 41 93. Collateral requirement 1 5 3.9 5 4 1.14 44 64. Connections with bank
managers 1 5 2.73 3 3 1.98 38 125. The need to have a track
record 1 4 2.15 2 2 0.96 39 116. Long delays in processing loan
application 1 5 3.32 3 3 1.08 37 13Note: *The following scale 1 to 5 has been used for the evaluation:1 – not a problem at all; 2 – a minor problem; 3 – a moderate problem; 4 – a severe problem; 5 – a very severe problem.
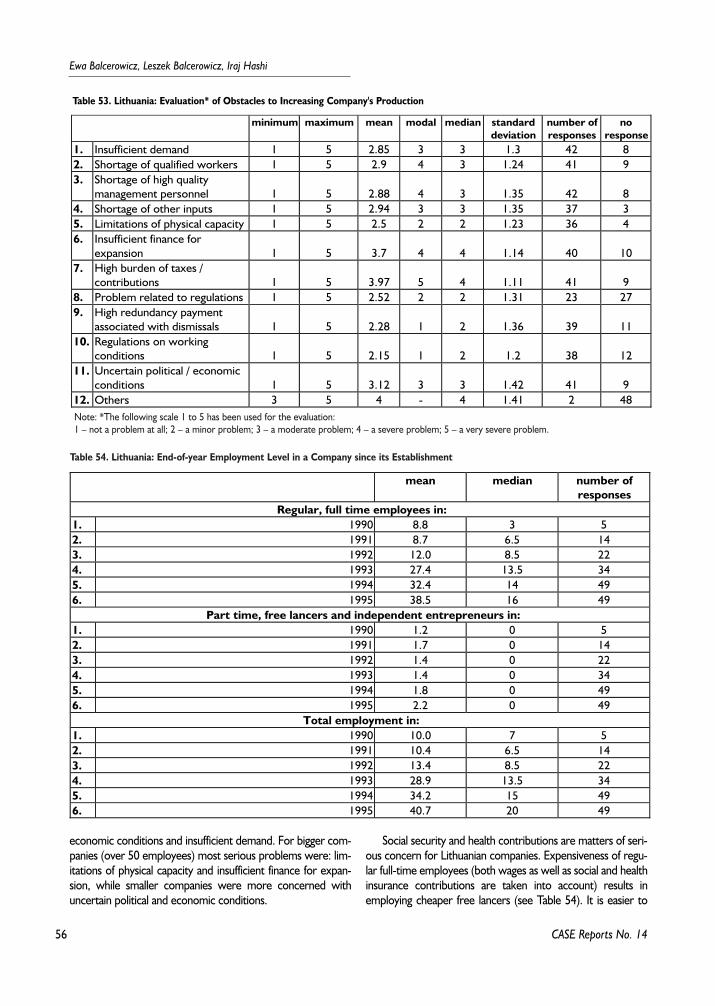
56
Ewa Balcerowicz, Leszek Balcerowicz, Iraj Hashi
economic conditions and insufficient demand. For bigger com-panies (over 50 employees) most serious problems were: lim-itations of physical capacity and insufficient finance for expan-sion, while smaller companies were more concerned withuncertain political and economic conditions.
Social security and health contributions are matters of seri-ous concern for Lithuanian companies. Expensiveness of regu-lar full-time employees (both wages as well as social and healthinsurance contributions are taken into account) results inemploying cheaper free lancers (see Table 54). It is easier to
CASE Reports No. 14
Table 53. Lithuania: Evaluation* of Obstacles to Increasing Company's Production
minimum maximum mean modal median standarddeviation
number ofresponses
noresponse
1. Insufficient demand 1 5 2.85 3 3 1.3 42 82. Shortage of qualified workers 1 5 2.9 4 3 1.24 41 93. Shortage of high quality
management personnel 1 5 2.88 4 3 1.35 42 84. Shortage of other inputs 1 5 2.94 3 3 1.35 37 35. Limitations of physical capacity 1 5 2.5 2 2 1.23 36 46. Insufficient finance for
expansion 1 5 3.7 4 4 1.14 40 107. High burden of taxes /
contributions 1 5 3.97 5 4 1.11 41 98. Problem related to regulations 1 5 2.52 2 2 1.31 23 279. High redundancy payment
associated with dismissals 1 5 2.28 1 2 1.36 39 1110. Regulations on working
conditions 1 5 2.15 1 2 1.2 38 1211. Uncertain political / economic
conditions 1 5 3.12 3 3 1.42 41 912. Others 3 5 4 - 4 1.41 2 48Note: *The following scale 1 to 5 has been used for the evaluation:1 – not a problem at all; 2 – a minor problem; 3 – a moderate problem; 4 – a severe problem; 5 – a very severe problem.
Table 54. Lithuania: End-of-year Employment Level in a Company since its Establishment
mean median number ofresponses
Regular, full time employees in:1. 1990 8.8 3 52. 1991 8.7 6.5 143. 1992 12.0 8.5 224. 1993 27.4 13.5 345. 1994 32.4 14 496. 1995 38.5 16 49
Part time, free lancers and independent entrepreneurs in:1. 1990 1.2 0 52. 1991 1.7 0 143. 1992 1.4 0 224. 1993 1.4 0 345. 1994 1.8 0 496. 1995 2.2 0 49
Total employment in:1. 1990 10.0 7 52. 1991 10.4 6.5 143. 1992 13.4 8.5 224. 1993 28.9 13.5 345. 1994 34.2 15 496. 1995 40.7 20 49
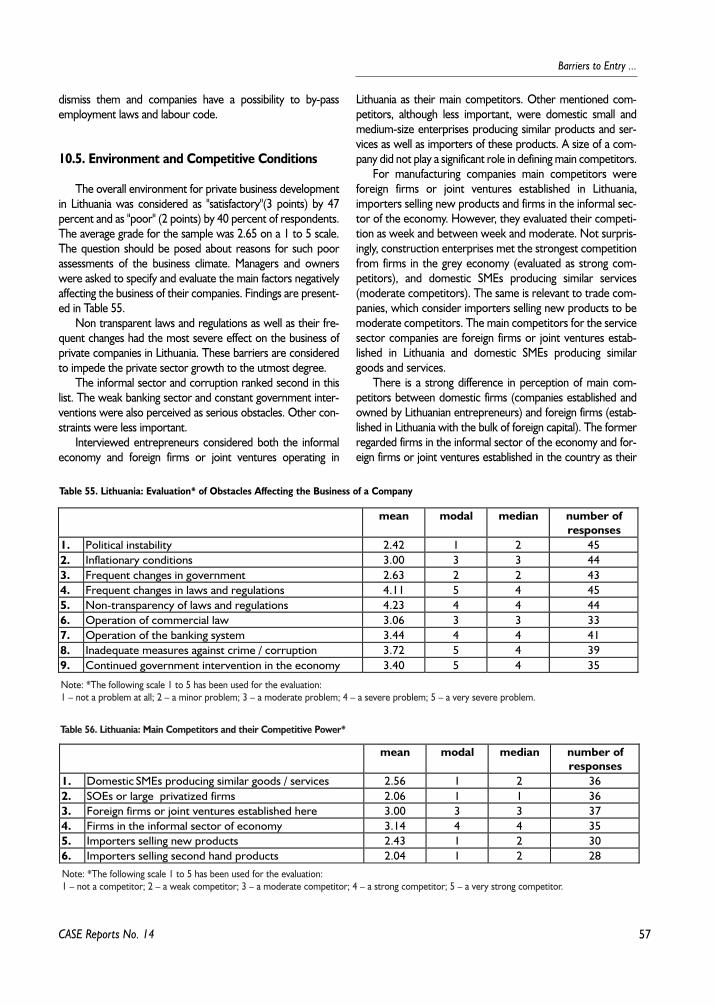
57
Barriers to Entry ...
dismiss them and companies have a possibility to by-passemployment laws and labour code.
10.5. Environment and Competitive Conditions
The overall environment for private business developmentin Lithuania was considered as "satisfactory"(3 points) by 47percent and as "poor" (2 points) by 40 percent of respondents.The average grade for the sample was 2.65 on a 1 to 5 scale.The question should be posed about reasons for such poorassessments of the business climate. Managers and ownerswere asked to specify and evaluate the main factors negativelyaffecting the business of their companies. Findings are present-ed in Table 55.
Non transparent laws and regulations as well as their fre-quent changes had the most severe effect on the business ofprivate companies in Lithuania. These barriers are consideredto impede the private sector growth to the utmost degree.
The informal sector and corruption ranked second in thislist. The weak banking sector and constant government inter-ventions were also perceived as serious obstacles. Other con-straints were less important.
Interviewed entrepreneurs considered both the informaleconomy and foreign firms or joint ventures operating in
Lithuania as their main competitors. Other mentioned com-petitors, although less important, were domestic small andmedium-size enterprises producing similar products and ser-vices as well as importers of these products. A size of a com-pany did not play a significant role in defining main competitors.
For manufacturing companies main competitors wereforeign firms or joint ventures established in Lithuania,importers selling new products and firms in the informal sec-tor of the economy. However, they evaluated their competi-tion as week and between week and moderate. Not surpris-ingly, construction enterprises met the strongest competitionfrom firms in the grey economy (evaluated as strong com-petitors), and domestic SMEs producing similar services(moderate competitors). The same is relevant to trade com-panies, which consider importers selling new products to bemoderate competitors. The main competitors for the servicesector companies are foreign firms or joint ventures estab-lished in Lithuania and domestic SMEs producing similargoods and services.
There is a strong difference in perception of main com-petitors between domestic firms (companies established andowned by Lithuanian entrepreneurs) and foreign firms (estab-lished in Lithuania with the bulk of foreign capital). The formerregarded firms in the informal sector of the economy and for-eign firms or joint ventures established in the country as their
CASE Reports No. 14
Table 55. Lithuania: Evaluation* of Obstacles Affecting the Business of a Company
mean modal median number ofresponses
1. Political instability 2.42 1 2 452. Inflationary conditions 3.00 3 3 443. Frequent changes in government 2.63 2 2 434. Frequent changes in laws and regulations 4.11 5 4 455. Non-transparency of laws and regulations 4.23 4 4 446. Operation of commercial law 3.06 3 3 337. Operation of the banking system 3.44 4 4 418. Inadequate measures against crime / corruption 3.72 5 4 399. Continued government intervention in the economy 3.40 5 4 35
Note: *The following scale 1 to 5 has been used for the evaluation:1 – not a problem at all; 2 – a minor problem; 3 – a moderate problem; 4 – a severe problem; 5 – a very severe problem.
Table 56. Lithuania: Main Competitors and their Competitive Power*
mean modal median number ofresponses
1. Domestic SMEs producing similar goods / services 2.56 1 2 362. SOEs or large privatized firms 2.06 1 1 363. Foreign firms or joint ventures established here 3.00 3 3 374. Firms in the informal sector of economy 3.14 4 4 355. Importers selling new products 2.43 1 2 306. Importers selling second hand products 2.04 1 2 28
Note: *The following scale 1 to 5 has been used for the evaluation:1 – not a competitor; 2 – a weak competitor; 3 – a moderate competitor; 4 – a strong competitor; 5 – a very strong competitor.
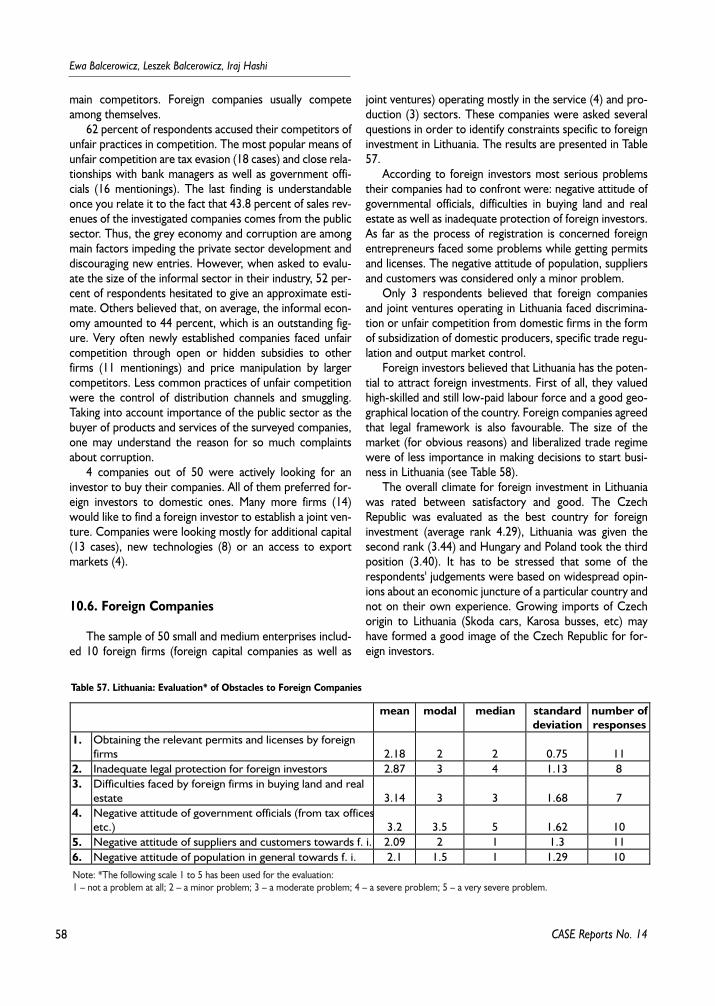
58
Ewa Balcerowicz, Leszek Balcerowicz, Iraj Hashi
main competitors. Foreign companies usually competeamong themselves.
62 percent of respondents accused their competitors ofunfair practices in competition. The most popular means ofunfair competition are tax evasion (18 cases) and close rela-tionships with bank managers as well as government offi-cials (16 mentionings). The last finding is understandableonce you relate it to the fact that 43.8 percent of sales rev-enues of the investigated companies comes from the publicsector. Thus, the grey economy and corruption are amongmain factors impeding the private sector development anddiscouraging new entries. However, when asked to evalu-ate the size of the informal sector in their industry, 52 per-cent of respondents hesitated to give an approximate esti-mate. Others believed that, on average, the informal econ-omy amounted to 44 percent, which is an outstanding fig-ure. Very often newly established companies faced unfaircompetition through open or hidden subsidies to otherfirms (11 mentionings) and price manipulation by largercompetitors. Less common practices of unfair competitionwere the control of distribution channels and smuggling.Taking into account importance of the public sector as thebuyer of products and services of the surveyed companies,one may understand the reason for so much complaintsabout corruption.
4 companies out of 50 were actively looking for aninvestor to buy their companies. All of them preferred for-eign investors to domestic ones. Many more firms (14)would like to find a foreign investor to establish a joint ven-ture. Companies were looking mostly for additional capital(13 cases), new technologies (8) or an access to exportmarkets (4).
10.6. Foreign Companies
The sample of 50 small and medium enterprises includ-ed 10 foreign firms (foreign capital companies as well as
joint ventures) operating mostly in the service (4) and pro-duction (3) sectors. These companies were asked severalquestions in order to identify constraints specific to foreigninvestment in Lithuania. The results are presented in Table57.
According to foreign investors most serious problemstheir companies had to confront were: negative attitude ofgovernmental officials, difficulties in buying land and realestate as well as inadequate protection of foreign investors.As far as the process of registration is concerned foreignentrepreneurs faced some problems while getting permitsand licenses. The negative attitude of population, suppliersand customers was considered only a minor problem.
Only 3 respondents believed that foreign companiesand joint ventures operating in Lithuania faced discrimina-tion or unfair competition from domestic firms in the formof subsidization of domestic producers, specific trade regu-lation and output market control.
Foreign investors believed that Lithuania has the poten-tial to attract foreign investments. First of all, they valuedhigh-skilled and still low-paid labour force and a good geo-graphical location of the country. Foreign companies agreedthat legal framework is also favourable. The size of themarket (for obvious reasons) and liberalized trade regimewere of less importance in making decisions to start busi-ness in Lithuania (see Table 58).
The overall climate for foreign investment in Lithuaniawas rated between satisfactory and good. The CzechRepublic was evaluated as the best country for foreigninvestment (average rank 4.29), Lithuania was given thesecond rank (3.44) and Hungary and Poland took the thirdposition (3.40). It has to be stressed that some of therespondents' judgements were based on widespread opin-ions about an economic juncture of a particular country andnot on their own experience. Growing imports of Czechorigin to Lithuania (Skoda cars, Karosa busses, etc) mayhave formed a good image of the Czech Republic for for-eign investors.
CASE Reports No. 14
Table 57. Lithuania: Evaluation* of Obstacles to Foreign Companies
mean modal median standarddeviation
number ofresponses
1. Obtaining the relevant permits and licenses by foreignfirms 2.18 2 2 0.75 11
2. Inadequate legal protection for foreign investors 2.87 3 4 1.13 83. Difficulties faced by foreign firms in buying land and real
estate 3.14 3 3 1.68 74. Negative attitude of government officials (from tax offices,
etc.) 3.2 3.5 5 1.62 105. Negative attitude of suppliers and customers towards f. i. 2.09 2 1 1.3 116. Negative attitude of population in general towards f. i. 2.1 1.5 1 1.29 10Note: *The following scale 1 to 5 has been used for the evaluation:1 – not a problem at all; 2 – a minor problem; 3 – a moderate problem; 4 – a severe problem; 5 – a very severe problem.
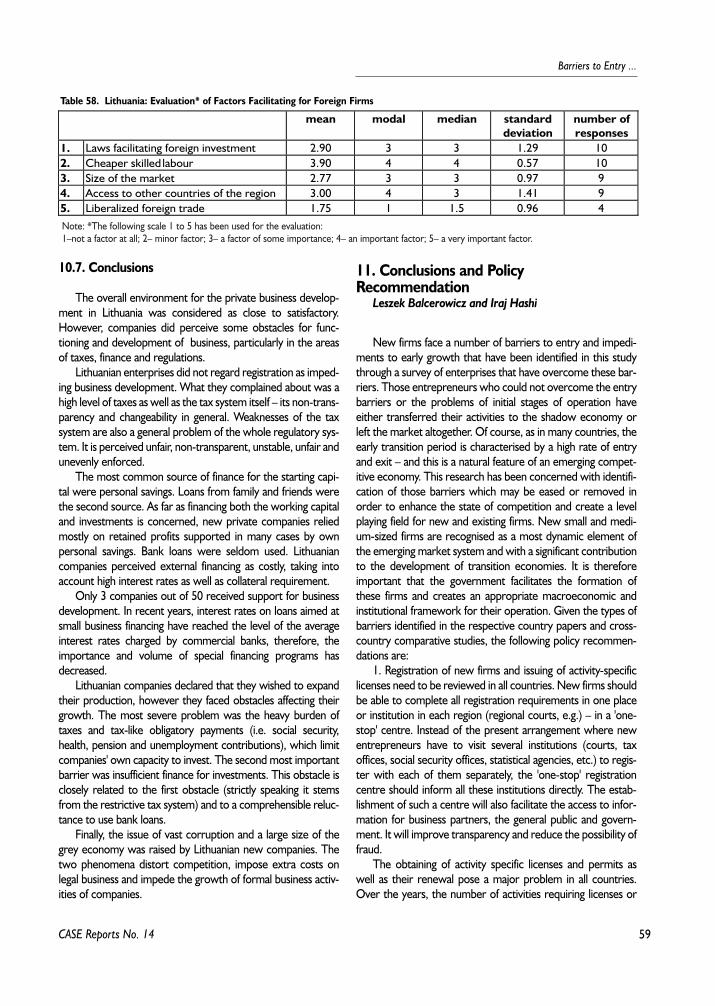
59
Barriers to Entry ...
10.7. Conclusions
The overall environment for the private business develop-ment in Lithuania was considered as close to satisfactory.However, companies did perceive some obstacles for func-tioning and development of business, particularly in the areasof taxes, finance and regulations.
Lithuanian enterprises did not regard registration as imped-ing business development. What they complained about was ahigh level of taxes as well as the tax system itself – its non-trans-parency and changeability in general. Weaknesses of the taxsystem are also a general problem of the whole regulatory sys-tem. It is perceived unfair, non-transparent, unstable, unfair andunevenly enforced.
The most common source of finance for the starting capi-tal were personal savings. Loans from family and friends werethe second source. As far as financing both the working capitaland investments is concerned, new private companies reliedmostly on retained profits supported in many cases by ownpersonal savings. Bank loans were seldom used. Lithuaniancompanies perceived external financing as costly, taking intoaccount high interest rates as well as collateral requirement.
Only 3 companies out of 50 received support for businessdevelopment. In recent years, interest rates on loans aimed atsmall business financing have reached the level of the averageinterest rates charged by commercial banks, therefore, theimportance and volume of special financing programs hasdecreased.
Lithuanian companies declared that they wished to expandtheir production, however they faced obstacles affecting theirgrowth. The most severe problem was the heavy burden oftaxes and tax-like obligatory payments (i.e. social security,health, pension and unemployment contributions), which limitcompanies' own capacity to invest. The second most importantbarrier was insufficient finance for investments. This obstacle isclosely related to the first obstacle (strictly speaking it stemsfrom the restrictive tax system) and to a comprehensible reluc-tance to use bank loans.
Finally, the issue of vast corruption and a large size of thegrey economy was raised by Lithuanian new companies. Thetwo phenomena distort competition, impose extra costs onlegal business and impede the growth of formal business activ-ities of companies.
11. Conclusions and Policy Recommendation
Leszek Balcerowicz and Iraj Hashi
New firms face a number of barriers to entry and impedi-ments to early growth that have been identified in this studythrough a survey of enterprises that have overcome these bar-riers. Those entrepreneurs who could not overcome the entrybarriers or the problems of initial stages of operation haveeither transferred their activities to the shadow economy orleft the market altogether. Of course, as in many countries, theearly transition period is characterised by a high rate of entryand exit – and this is a natural feature of an emerging compet-itive economy. This research has been concerned with identifi-cation of those barriers which may be eased or removed inorder to enhance the state of competition and create a levelplaying field for new and existing firms. New small and medi-um-sized firms are recognised as a most dynamic element ofthe emerging market system and with a significant contributionto the development of transition economies. It is thereforeimportant that the government facilitates the formation ofthese firms and creates an appropriate macroeconomic andinstitutional framework for their operation. Given the types ofbarriers identified in the respective country papers and cross-country comparative studies, the following policy recommen-dations are:
1. Registration of new firms and issuing of activity-specificlicenses need to be reviewed in all countries. New firms shouldbe able to complete all registration requirements in one placeor institution in each region (regional courts, e.g.) – in a 'one-stop' centre. Instead of the present arrangement where newentrepreneurs have to visit several institutions (courts, taxoffices, social security offices, statistical agencies, etc.) to regis-ter with each of them separately, the 'one-stop' registrationcentre should inform all these institutions directly. The estab-lishment of such a centre will also facilitate the access to infor-mation for business partners, the general public and govern-ment. It will improve transparency and reduce the possibility offraud.
The obtaining of activity specific licenses and permits aswell as their renewal pose a major problem in all countries.Over the years, the number of activities requiring licenses or
CASE Reports No. 14
Table 58. Lithuania: Evaluation* of Factors Facilitating for Foreign Firms
mean modal median standarddeviation
number ofresponses
1. Laws facilitating foreign investment 2.90 3 3 1.29 102. Cheaper skilled labour 3.90 4 4 0.57 103. Size of the market 2.77 3 3 0.97 94. Access to other countries of the region 3.00 4 3 1.41 95. Liberalized foreign trade 1.75 1 1.5 0.96 4Note: *The following scale 1 to 5 has been used for the evaluation:1–not a factor at all; 2– minor factor; 3– a factor of some importance; 4– an important factor; 5– a very important factor.
60
Ewa Balcerowicz, Leszek Balcerowicz, Iraj Hashi
permits have increased – to a large extent by pressure frominterest groups such as the incumbent firms or their represen-tatives. A distinction must be made between a need for pro-fessional licensing (providing the public with information aboutthe quality of service they can expect e.g. in the fields of med-ical care and public health), and licensing which is aimed at con-trolling a number of competitors and protecting an interestgroup. The latter type serves no economic purpose and shouldbe removed. Moreover, as some country studies indicate, theissuing of permits by government departments provides ampleopportunities for corruption and rent seeking by officials at var-ious levels. The removal of this barrier will also help to reducethe scope for corruption.
2. The majority of firms in our study do not own their prop-erty and have to lease their premises, often from municipalitiesor other state institutions. The shortage of commercial realestate and the possibility of owners to raise rents at shortnotice are identified as the main impediments in this area.Given the nature of ownership of real estate, the governmentcan improve the situation by speeding up the privatization ofpublicly owned real estate. Of course, this will have a majoreffect on the income of local governments (who stand to loosea permanent, reliable and increasing source of income) andalternative sources must be found for this purpose.
3. Taxes and contributions are by far the most importantimpediment to the early growth of new firms in all five coun-tries. Taxes in transition economies are high because of the par-ticular structure of public finance, including a large state sector,continued subsidization of certain industries, and the preva-lence of the informal economy. Only with the reform of publicfinances can the government begin to reduce the rate or levelof taxation. This is exactly what has been happening in theCzech Republic, Hungary and Poland.
The social and health insurance contributions are a morecomplicated issue and rich with serious social and politicalimplications. In four of the five countries under consideration(except Lithuania, and yet, Lithuanian entrepreneurs com-plained about these contributions as entrepreneurs in othercountries did), contribution rates are far higher than those of,for example, the U.K. and most EU countries. At present,these contributions are paid into special funds, which, togetherwith funds from the budget, support the provision of health,pensions, social insurance, unemployment, disability and otherbenefits. The level of contributions are high because this wasthe only way that a welfare system largely left over from the olddays (except for the unemployment benefit, which is relativelynew) could be maintained. A reduction in contributions, there-fore, has to await an urgently needed reform of the welfare sys-tem. In some countries (like e.g. Poland), this is now at the topof the government's agenda. Other countries will have toembark on a fundamental reform of the pension system andhealth service urgently if they wish to be in a position to reducethe burden of these contributions on their employers andemployees.
In addition to the level of taxes and contributions, it is gen-erally agreed that new firms in their early growth have to dealwith regularly changing fiscal rules and regulations. Thesechanges create a high degree of uncertainty and impose com-pliance costs on entrants at a time in their life cycle when theycan least afford it. It diverts resources and management timeaway from the firm and into professional advisors.
4. Very few firms in our sample had received informationand support from national or international schemes which hadbeen set up to help and support the small and medium-sizedenterprise sector. Of course, there is a wide-ranging debateamongst economists as to whether small and medium sizedfirms should be given special support. Without entering thisdebate, it is important that the government aims at creating alevel playing field in which new firms can compete with estab-lished firms on equal terms. Furthermore, it is essential toincrease the level of information available to potential and actu-al new firms about the wide-ranging SME support pro-grammes.
5. Enterprise surveys in all five countries point to a numberof other common issues which concern the great majority ofentrepreneurs. These are: the macroeconomic environmentand institutions, frequency of changing laws and regulations andtheir non-transparency. Making regulations transparent andreducing uncertainty by avoiding frequent changes in regula-tions are feasible and practical measures that can be taken bythe governments.
6. There is a generally held view that financial constraints,particularly a new firms' access to bank credits, act as a majorbarrier to entry – and therefore the government is expected tostep in to support new enterprises. Our study does not sup-port this view. Given a small size of companies in samples, par-ticularly in the Hungarian one, it has to be admitted that com-panies generally had better access to credit than it had been ini-tially expected. A bank credit was the second most importantsource of finance for investment in Poland, Hungary and theCzech Republic, and the third in Lithuania (Albania was anexception here). The majority of firms received a bank credit(however small) and furthermore, in each of the five countries(including Albania) there was a group of companies whichobtained bank loans even at the time of establishment. Banksseem to have been 'rational' in supplying credits and enterpris-es in applying for them. Our study of finance and investment insample enterprises has found no traces of adverse selection –which leads to credit rationing. Obviously, a word of caution isnecessary here. Our sample consisted of firms that have actu-ally entered their market and survived their initial phase. Entre-preneurs who did not survive for a variety of reasons, includinglack of access to bank credit, were by definition excluded.
CASE Reports No. 14
61
Barriers to Entry ...
References
Bain J. (1968), Industrial organization, New York: Wiley.Balcerowicz E. (1996), Downsizing in Manufacturing
Sector, Poland 1989–1994, a paper prepared within theresearch project "The Process of Enterprise Exit in Transi-tion to a Market Economy" supported by ACE Phare Pro-gramme –1992, CASE, Warsaw 1996, a manuscript; in Pol-ish published as a chapter in: Mujzel, Jan (ed.), Przed-siêbiorstwa w procesie transformacji, INE PAN, Warszawa1997, p.111–127;
Balcerowicz E. (1998), Government Sponsored Barriersto Entry and Growth of Private Companies: Regulatory andFiscal Constraints in Poland in the Years 1990–1997, War-saw: CASE (manuscript).
Balcerowicz L. (1995), Socialism, Capitalism and Trans-formation, Budapest: Central European University Press.
Balcerowicz L., C.W. Gray and I. Hashi (1998), Enter-prise Exit Processes in Transition Economies, Budapest:Central European University Press.
Belka M., S. Estrin, M.E. Schafer and I.J. Singh (1995),Enterprise Adjustment in Poland: Evidence from a Survey of200 Private, privatized, and State-Owned Firms, Centre forEconomic Performance (LSE), Working paper No. 223,April.
Blanchard O. (1997), The Economics of Post-Commu-nist Transition, Oxford: Clarendon Press.
Blaszczyk B. (1997a), privatization in Poland: Accom-plishments, Delays and Things to Do, in: Economic Scenar-ios for Poland: Conference Papers, Warsaw: CASE ReportsNo 5.
Blaszczyk B. (1997b), Progress of privatization in Polandand Resulting Ownership Structure, in: privatization andCompany Restructuring in Poland, a final report preparedfor the ACE Phare Project No P95-2019, Warsaw: CASE,manuscript.
Blejer M.I. and F. Coricelli (1995), The Making of Eco-nomic Reform in Eastern Europe, Aldershot: Edward Elgar.
Bohata M. (1993), Small and Medium-sized Enterprisesin Czechoslovak Manufacturing Industry, in: Hughes K., etall. (1993), Restructuring Manufacturing Industry and theEmergence of New Firms in Czechoslovakia and Hungary:Strategies for Efficiency and Reindustrialisation, ACE ProjectReport, London: Policy Studies Institute.
Borish M. and M. Noel (1996), Private Sector Develop-ment during Transition: The Visegrad Countries, WorldBank Discussion Paper No. 318, February.
Boycko M., M. Shleifer and R.W. Vishny (1996), A The-ory of privatization, The Economic Journal, March:309–319.
Chmiel J. (1998), Statistics of the Entry of Enterprisesinto a Branch: Measurement Problems and Results of
Inquiry, CASE-CEU Working Paper Series No. 3, Warsaw:CASE and CEU.
Earle J., R. Frydman, A. Rapaczynski, J. Turkewitz (1994),East European Experience with Small Scale privatization,CFS Discussion Papers Series, Washington DC: The WorldBank.
Demsetz H. (1982), Barriers to Entry, American Eco-nomic Review, 72, (March): 47–57.
EBRD (1997), Transition Report 1997. Enterprise Per-formance and Growth.
Friedman M. (1962), Capitalism and Freedom, Chicago:University of Chicago Press.
Frydman R. and A. Rapaczynski (1991), Markets andInstitutions in Large Scale privatization, in: V. Corbo, F.Coricelli and J. Bossak (eds.) (1991), Reforming Central andEast European Economies, Washington DC: The WorldBank.
GUS (1997), Zmiany strukturalne grup podmiotówgospodarki narodowej w 1996 (Structural Changes ofGroups of Economic Units in 1996), Warsaw: The CentralStatistical Office (GUS).
Hussain A. (1994), Private Sector Development inEconomies in Transition, Journal of Comparative Econom-ics, No. 19, (October): 260–271.
Johnson S., D. Kaufmann and A. Shleifer (1997), Politicsand Entrepreneurship in Transition Economies, The WilliamDavidson Institute Working Paper No. 57, June.
Kaufmann D. (1995), Diminishing Returns to Adminis-trative Controls and the Emergence of the Unofficial Econ-omy: a Framework of Analysis and Applications to Ukraine,Economic Policy, No. 19 (December).
Kaufmann D. and A. Kaliberda (1995), Integrating theUnofficial Economy into the Dynamics of Post-SocialistEconomies: A framework of Analysis and Evidence. TheWorld Bank, Office in Kiev.
Shleifer A. and R.W. Vishny (1993), Corruption, Quar-terly Journal of Economics, CVIII: 599–618.
Shleifer A. and R.W. Vishny (1994), Politicians and Firms,Quarterly Journal of Economics, CIX, November:995–1025.
Shleifer A. (1997), Government in Transition, HarvardInstitute for International Development, Development Dis-cussion Paper No. 573 (March).
Stigler G. (1968), Barriers to Entry, Economies of Scale,and Firm Size, in: Stigler G., The organization of Industry,Homewood, Ill.: Richard D Irwin Inc.
Szanyi M. (1998), Foreign Direct Investments in SmallBusiness in Transition Economies, CASE-CEU WorkingPapers Series No.15, Warsaw: CASE and CEU.
Von Wizsacker C. (1980), A Welfare Analysis of Barriersto Entry, Bell Journal of Economics, 11: 399–420.
CASE Reports No. 14
62
Ewa Balcerowicz, Leszek Balcerowicz, Iraj Hashi
List of Tables
Table 1. Taxes and Contributions in Five Transition Economies, 1998 . . . . . . . . . . . . . . . . . . . . . . . . . . . . . . . . . . . . . . .Table 2. Share of Shadow Economy in GDP in the Czech Republic, Hungary, Lithuania and Poland, 1989–1995 . . . . . .Table 3. Types of Constraints to Entry and Development of New Firms . . . . . . . . . . . . . . . . . . . . . . . . . . . . . . . . . . . . .Table 4. Number of Registered Firms . . . . . . . . . . . . . . . . . . . . . . . . . . . . . . . . . . . . . . . . . . . . . . . . . . . . . . . . . . . . . . . .Table 5. Net Entry . . . . . . . . . . . . . . . . . . . . . . . . . . . . . . . . . . . . . . . . . . . . . . . . . . . . . . . . . . . . . . . . . . . . . . . . . . . . . .Table 6. Net Rate of Entry (in percent) . . . . . . . . . . . . . . . . . . . . . . . . . . . . . . . . . . . . . . . . . . . . . . . . . . . . . . . . . . . . . . .Table 7. Initial Capital Requirement for two Main Legal Forms of Business . . . . . . . . . . . . . . . . . . . . . . . . . . . . . . . . . . .Table 8. Poland: Evaluation of Registration Process . . . . . . . . . . . . . . . . . . . . . . . . . . . . . . . . . . . . . . . . . . . . . . . . . . . . . .Table 9. Poland: Evaluation of Effect of Regulations on the Establishment and Growth of the Companies . . . . . . . . . . . .Table 10. Poland: Evaluation of Obstacles to Obtain Finance from Banks . . . . . . . . . . . . . . . . . . . . . . . . . . . . . . . . . . . .Table 11. Poland: Evaluation of Obstacles to Increasing Company's Production . . . . . . . . . . . . . . . . . . . . . . . . . . . . . . . .Table 12. Poland: The Overall Environment for Development of Private Business in Poland . . . . . . . . . . . . . . . . . . . . . .Table 13. Poland: Evaluation of Obstacles Affecting the Business of Company . . . . . . . . . . . . . . . . . . . . . . . . . . . . . . . . .Table 14. Poland: Main Competitors and their Competitive Power . . . . . . . . . . . . . . . . . . . . . . . . . . . . . . . . . . . . . . . . .Table 15. Poland: Evaluation of Obstacles to Foreign Companies . . . . . . . . . . . . . . . . . . . . . . . . . . . . . . . . . . . . . . . . . . .Table 16. Poland: Evaluation of Factors Facilitating for Foreign Firms . . . . . . . . . . . . . . . . . . . . . . . . . . . . . . . . . . . . . . . .Table 17. Poland: Evaluation of Overall Environment for Foreign Investment in Poland as compared to: . . . . . . . . . . . .Table 18. Hungary: Evaluation of Registration Process . . . . . . . . . . . . . . . . . . . . . . . . . . . . . . . . . . . . . . . . . . . . . . . . . . .Table 19. Hungary: Evaluation of Effect of Regulations on the Establishment and Growth of the Companies . . . . . . . . .Table 20. Hungary: The main Sources of Finance for [A] Working Capital Needs; [B] Investment . . . . . . . . . . . . . . . . .Table 21. Hungary: Evaluation of Obstacles to Obtain Finance from Banks . . . . . . . . . . . . . . . . . . . . . . . . . . . . . . . . . . .Table 22. Hungary: Statement on Profit and Loss of a Firm in Subsequent Years since Establishment . . . . . . . . . . . . . . .Table 23. Hungary: Evaluation of Obstacles to Increasing Company's Production . . . . . . . . . . . . . . . . . . . . . . . . . . . . . .Table 24. Hungary: End-of-year Employment Level in a Company since its Establishment . . . . . . . . . . . . . . . . . . . . . . .Table 25. Hungary: Evaluation of Obstacles Affecting the Business of Company . . . . . . . . . . . . . . . . . . . . . . . . . . . . . . .Table 26. Hungary: Main Competitors and their Competitive Power . . . . . . . . . . . . . . . . . . . . . . . . . . . . . . . . . . . . . . . .Table 27. Hungary: Evaluation of Obstacles to Foreign Companies . . . . . . . . . . . . . . . . . . . . . . . . . . . . . . . . . . . . . . . . .Table 28. Hungary: Evaluation of Factors Facilitating for Foreign Firms . . . . . . . . . . . . . . . . . . . . . . . . . . . . . . . . . . . . . .Table 29. The Czech Republic: Evaluation of Registration Process . . . . . . . . . . . . . . . . . . . . . . . . . . . . . . . . . . . . . . . . . .Table 30. The Czech Republic: Evaluation of Effect of Regulations on the Establishment and Growth
of the Companies . . . . . . . . . . . . . . . . . . . . . . . . . . . . . . . . . . . . . . . . . . . . . . . . . . . . . . . . . . . . . . . . . . . . . . . .Table 31. The Czech Republic: The Main Sources of Finance for [A] the Starting Capital;
[B] the Working Capital; [C] Investment (in %) . . . . . . . . . . . . . . . . . . . . . . . . . . . . . . . . . . . . . . . . . . . . . . . . .Table 32. The Czech Republic: Evaluation of Obstacles to Obtain Finance from Banks . . . . . . . . . . . . . . . . . . . . . . . . . .Table 33. The Czech Republic: Evaluation of Obstacles to Increasing Company's Production . . . . . . . . . . . . . . . . . . . . .Table 34. The Czech Republic: Evaluation of Obstacles Affecting the Business of a Company . . . . . . . . . . . . . . . . . . . . .Table 35. The Czech Republic: Main Competitors and their Competitive Power . . . . . . . . . . . . . . . . . . . . . . . . . . . . . .Table 36. Albania: Evaluation of Registration Process . . . . . . . . . . . . . . . . . . . . . . . . . . . . . . . . . . . . . . . . . . . . . . . . . . . .Table 37. Albania: Evaluation of Effect of Regulations on the Establishment and Growth of the Companies . . . . . . . . . .Table 38. Albania: The Main Sources of Finance for [A] the Starting Capital; [B] the Working Capital;
[C] Investment (in %) . . . . . . . . . . . . . . . . . . . . . . . . . . . . . . . . . . . . . . . . . . . . . . . . . . . . . . . . . . . . . . . . . . . .Table 39. Albania: Evaluation of Obstacles to Obtain Finance from Banks . . . . . . . . . . . . . . . . . . . . . . . . . . . . . . . . . . . .Table 40. Albania: Statement on Profit and Loss of a Firm in Subsequent Years since Establishment . . . . . . . . . . . . . . .Table 41. Albania: The Age of Company's Capital Stock in Comparison with the Age of Capital Stock
in the Country . . . . . . . . . . . . . . . . . . . . . . . . . . . . . . . . . . . . . . . . . . . . . . . . . . . . . . . . . . . . . . . . . . . . . . . . . .
CASE Reports No. 14
63
Barriers to Entry ...
Table 42. Albania: The Wages of [A] Managers; [B] Employees as Compared with the National Average . . . . . . . . . . . .Table 43. Albania: Evaluation of Obstacles to Increasing Company's Production . . . . . . . . . . . . . . . . . . . . . . . . . . . . . . .Table 44. Albania: End-of-year Employment Level in a Company since its Establishment . . . . . . . . . . . . . . . . . . . . . . . .Table 45. Albania: Evaluation of Obstacles Affecting the Business of a Company . . . . . . . . . . . . . . . . . . . . . . . . . . . . . .Table 46. Albania: Main Competitors and their Competitive Power . . . . . . . . . . . . . . . . . . . . . . . . . . . . . . . . . . . . . . . . .Table 47. Albania: Evaluation of Obstacles to Foreign Companies . . . . . . . . . . . . . . . . . . . . . . . . . . . . . . . . . . . . . . . . . .Table 48. Albania: Evaluation of Factors Facilitating for Foreign Firms . . . . . . . . . . . . . . . . . . . . . . . . . . . . . . . . . . . . . . .Table 49. Lithuania: Evaluation of Registration Process . . . . . . . . . . . . . . . . . . . . . . . . . . . . . . . . . . . . . . . . . . . . . . . . . . .Table 50. Lithuania: Evaluation of Effect of Regulations on the Establishment and Growth of the Companies . . . . . . . . .Table 51. Lithuania: The Main Sources of Finance for [A] the Starting Capital; [B] the Working Capital;
[C] Investment . . . . . . . . . . . . . . . . . . . . . . . . . . . . . . . . . . . . . . . . . . . . . . . . . . . . . . . . . . . . . . . . . . . . . . . . .Table 52. Lithuania: Evaluation of Obstacles to Obtain Finance from Banks . . . . . . . . . . . . . . . . . . . . . . . . . . . . . . . . . . .Table 53. Lithuania: Evaluation of Obstacles to Increasing Company's Production . . . . . . . . . . . . . . . . . . . . . . . . . . . . .Table 54. Lithuania: End-of-year Employment Level in a Company since its Establishment . . . . . . . . . . . . . . . . . . . . . . .Table 55. Lithuania: Evaluation of Obstacles Affecting the Business of a Company . . . . . . . . . . . . . . . . . . . . . . . . . . . . .Table 56. Lithuania: Main Competitors and their Competitive Power . . . . . . . . . . . . . . . . . . . . . . . . . . . . . . . . . . . . . . .Table 57. Lithuania: Evaluation of Obstacles to Foreign Companies . . . . . . . . . . . . . . . . . . . . . . . . . . . . . . . . . . . . . . . .Table 58. ,Lithuania: Evaluation of Factors Facilitating for Foreign Firms . . . . . . . . . . . . . . . . . . . . . . . . . . . . . . . . . . . . .
List of Figures
Figure 1. The Main Activity of Sample Firms in Five Countries . . . . . . . . . . . . . . . . . . . . . . . . . . . . . . . . . . . . . . . . . . . . .Figure 2. The Date of Establishment of Sample Firms . . . . . . . . . . . . . . . . . . . . . . . . . . . . . . . . . . . . . . . . . . . . . . . . . . .Figure 3. Distribution of Sample Firms According to Their Size (by 1995 Employment) . . . . . . . . . . . . . . . . . . . . . . . . .Figure 4. Average Number of Employees in Sample Firms in 1995 . . . . . . . . . . . . . . . . . . . . . . . . . . . . . . . . . . . . . . . . .Figure 5. The Legal Form of Sample Firms . . . . . . . . . . . . . . . . . . . . . . . . . . . . . . . . . . . . . . . . . . . . . . . . . . . . . . . . . . . .Figure 6. The Czech Republic: Nature of Changes in Regulations on Real Estate, Taxes and Contributions, . . . . . . . . . .
Employment . . . . . . . . . . . . . . . . . . . . . . . . . . . . . . . . . . . . . . . . . . . . . . . . . . . . . . . . . . . . . . . . . . . . . . . . . . . .
CASE Reports No. 14

64
Ewa Balcerowicz, Leszek Balcerowicz, Iraj Hashi
CASE Reports No. 14

65
Barriers to Entry ...
CASE Reports No. 14

66
Ewa Balcerowicz, Leszek Balcerowicz, Iraj Hashi
CASE Reports No. 14

67
Barriers to Entry ...
CASE Reports No. 14

68
Ewa Balcerowicz, Leszek Balcerowicz, Iraj Hashi
CASE Reports No. 14

69
Barriers to Entry ...
CASE Reports No. 14

70
Ewa Balcerowicz, Leszek Balcerowicz, Iraj Hashi
CASE Reports No. 14