evropskÝ Časopis ekonomiky a...
TRANSCRIPT

EVROPSKÝ ČASOPIS EKONOMIKY
A MANAGEMENTU
Svazek 3
1. vydání
2017
EUROPEAN JOURNAL
OF ECONOMICS AND MANAGEMENT
Volume 3
Issue 1
2017
Редакційна політика Європейський журнал економіки та менеджменту – міжнародний журнал, присвячений
актуальним проблемам економіки та менеджменту. До публікації в журналі приймаються статті високої якості, які представляють важливий інноваційний, теоретичний, концептуальний, методологічний та емпіричний внесок у відповідних галузях науки. Журнал використовує систему анонімного рецензування (peer-rewiev) з метою верифікації наукової якості статей. Європейський журнал економіки та менеджменту особливо зацікавлений в роботах на
макроекономічну тематику, які можуть продемонструвати перспективні шляхи розвитку державної економіки, а також відображатимуть досвід успішного розвитку національної економіки. Європейський журнал економіки та менеджменту приймає для публікації оригінальні матеріали
і не розглядає можливості публікації раніше надрукованих матеріалів.
Редакційна колегія: Беата Стенпєнь, професор, Голова
післядипломних бізнес студій Познанського університету економіки, Польща
Анатолій Гончарук, професор, доктор економічних наук, Міжнародний гуманітарний університет, Україна
Дагмара Левіцька, професор, доктор наук, Краківська гірничо-металургійна академія, Факультет менеджменту, Кафедра управління персоналом та господарського права, Польща
Маріуш Куделко, професор, доктор наук, Краківська гірничо-металургійна академія, Факультет менеджменту, Кафедра управління персоналом та господарського права, Польща
Наталія Івашчук, професор, доктор наук, Краківська гірничо-металургійна академія, Факультет менеджменту, Кафедра управління в енергетиці, Польща
Станіслав Шидло, професор, доктор наук, Краківська гірничо-металургійна академія, Факультет менеджменту, Кафедра управління в енергетиці, Польща
Наталія Андрєєва, професор, доктор економічних наук, головний науковий співробітник відділу економіко-екологічних проблем приморських регіонів, Інститут проблем ринку та економіко-екологічних досліджень, Україна
Ігор Гуцал, професор, доктор економічних наук, Тернопільський національний економічний університет, Україна
Юрий Зайцев, профессор, доктор економічних наук, Державний вищий навчальний заклад «Київський національний економічний університет імені Вадима Гетьмана», Україна
Олександра Москаленко, доцент, доктор економічних наук, Державний вищий навчальний заклад «Київський національний економічний університет імені Вадима Гетьмана», Україна
Доктор Олена Пономаренко, Amway Business Centre
Доктор Константин Дмітрусенко, Shell Polska Sp. z o. o., аналітик фінансових операцій, Польща
Přístup redakce «Evropský časopis ekonomiky a managementu» – mezinárodní časopis věnovaný aktuálním otázkam
ekonomiky a managementu. Pro publikaci v časopisu přijímají se vysoce kvalitní články, což představují důležité inovativní,
teoretické, koncepční, metodické a empirické příspěvky v příslušných oborech vědy. V časopisu se uplatn´uje systém anonymního recenzování (peer-rewiev) pro ověření vědecké kvalifikace článků.
Evropský časopis ekonomiky a managementu má velký zájem zejména o výzkumy v makroekonomických tématech, kteří mohou prokázat perspektívní způsoby rozvoje ekonomiky země a take odrážejí zkušenosti úspěšného rozvoje národního hospodářství.
Redakční kolégie:
Beata Stępen´, PhD., Vedoucí business-studia pro
absolventi Univerzity Vyšší Školy Ekonomické v Poznani (Polsko).
Anatolii Goncharuk, PhD., Doktor ekonomických věd, vedoucí katedry podnikové a obchodní administrativy a ekonomiky a podnikové bezpečnosti, Mezinárodní gumanitární Univerzita (Ukrajina).
Dagmar Levická, PhD., profesorkyně, Akadémie hutníctví a hornictví v Krakově, fakulta managementu, karedra správy zaměstnanců (personnel management) a Obchodního práva.
Mariuszcz Kudelko, PhD., profesor, Akadémie hutníctví a hornictví v Krakově, fakulta managementu, karedra správy zaměstnanců (personnel management) a Obchodního práva.
Natalia Ivashchuk, PhD., profesor, Akadémie hutníctví a hornictví v Krakově, fakulta managementu, karedra řízení v energetice.
Stanislav Šidlo, PhD., profesor, Akadémie hutníctví a hornictví v Krakově, fakulta managementu, karedra řízení v energetice.
Natalia Andrejeva, PhD., Doctor ekonomických věd, vedoucí výzkumník oddělení ekonomických a ekologických problémů pobřežních regionů, Ústav problemů trhu a hospodářských a ekologických studia.
Igor Gucal, PhD., Doctor ekonomických věd, profesor, vedoucí katedry Financi podníků a pojišťování Ternopilské Národní ekonomická univerzity.
Yurii Zajtsev, PhD., Doctor ekonomických věd, profesor, zástupce vedoucího katedry politické ekonomie účetních a ekonomických fakult Státní vysoké školy “Kyjivská národní ekonomická univerzita jm. Vadima Get´mana”.
Oleksandra Moskalenko, PhD., Doctor ekonomických věd, profesor katedry politické ekonómie účetních a ekonomických fakult Státní vysoké školy “Kyjivská národní ekonomická univerzita jm. Vadima Get´mana”.
Olena Ponomarenko, PhD., Amway Business Centre.
Konstantin Dmitrusenko, PhD., Shell Polska Sp. z o. o., analytik finančních transakci.

Editorial Policy The European Journal of Economics and Management is international journal dedicated to topical issues
of economy and management. The journal aims at publishing of high quality articles that may bring innovative and significant theoretical, conceptual, methodological and empirical contribution to relevant scientific fields. The journal works with anonymous peer-review system that verifies scientific quality of submitted articles.
The European Journal of Economics and Management has a particular interest in macroeconomic researches that may demonstrate promising ways of national economy development, but by no means restricts its interests to these spaces, welcoming any relevant contribution from and about different parts of the World.
The European Journal of Economics and Management accepts original materials which are not under consideration elsewhere at the time of submission and does not accept already published materials.
Editorial Committee:
Beata Stępień, prof., Head of Postgraduate
International Business Studies Poznan University of Economics, Poland
Anatoliy G. Goncharuk, prof., International Humanitarian University, Ukraine
Dagmara Lewicka, dr hab., honoured professor, AGH University of Science and Technology, Faculty of Management, Department of Personnel Administration and Economic Law, Poland
Mariusz Kudełko, dr hab., honoured professor, AGH University of Science and Technology, Faculty of Management, Department of Personnel Administration and Economic Law, Poland
Natalia Iwaszczuk, dr hab., professor, AGH University of Science and Technology, Faculty of Management, Head of the Department of Energy Administration, Poland
Stanisław Szydło, dr hab., professor, AGH University of Science and Technology, Faculty of Management, Department of Energy Administration, Poland
Natalyia Andrieieva, dr., professor, main scientific specialist of the department of economic and ecological problems of seasides regions, Institute of market, economic and ecological studies, Ukraine
Igor Gutsal, dr., professor, Ternopol National Economic University, Ukraine
Yurii Zaitsev, dr., professor, State Higher Education Establishment “Kyiv National Economic University named after Vadym Hetman”, Ukraine
Oleksandra Moskalenko, dr., associated professor, State Higher Education Establishment “Kyiv National Economic University named after Vadym Hetman”, Ukraine
Dr. Olena Ponomarenko, Amway Business Centre – Europe Sp. z o.o. accountant.
Dr. Konstanyn Dmitrusenko, Shell Polska Sp. z o. o., finance operations analyst, Poland
_________________________________________________________________________ EVROPSKÝ ČASOPIS EKONOMIKY A MANAGEMENTU
Evidenční číslo: MK ČR E 22310 Vydavatel: BEROSTAV DRUŽSTVO
Adresa: Vlastislavova 562/15, 140 00, Praha 4 – Nusle http://eujem.cz
EUROPEAN JOURNAL OF ECONOMICS AND MANAGEMENT • Volume 3 Issue 1 2017
5
Table of contents
Wlodzimiezh Olshewski, Hryhorii Bashnianyn, Oleksandr Svintsov, PUBLIC AND PRIVATE FINANCING OF EDUCATION IN UKRAINE: STATE, PROBLEMS AND PROSPECTS ................................................................................................ 6
Yulia Vlasenko, THE ROLE AND PLACE OF THE CLUSTER APPROACH IN THE CURRENT NIS STUDIES ............................................................................................. 13
Oksana Volkova, MONITORING OF DEBT RISKS OF UKRAINE ........................................ 20
Alina Snetkova, FOREIGN DIRECT INVESTMENT IN UKRAINE: PROBLEMS AND SOLUTIONS................................................................................................. 30
Sergii Sheludko, KEY ASPECTS OF FOREIGN EXCHANGE REGULATION IN TERMS OF EUROPEAN INTEGRATION OF UKRAINE .................................................. 38
Taras Vasiunyk, ABOUT DETERMINATION OF EFFICIENCY OF STATE REGULATION OF CAPITAL REPRODUCTION .................................................................... 45
Anton Shevchuk, ECONOMIC CAPITAL IN RISK MANAGEMENT OF BANKING SYSTEM ............................................................................................................. 53
Viktoriya Fedosova, INCOME TAXATION SYSTEM: A NEW PARADIGM FOR UKRAINE............................................................................................................................ 61
Vira Khomutenko, Alla Khomutenko, FRAGMENTARY ANALYSIS OF THE MECHANISM OF REGULATORY FUNCTION OF CORPORATE INCOME TAX IN UKRAINE ..................................................................................................... 70
Larysa Prodanova, Karyna Sherstyukova, DISTRIBUTION AND REDISTRIBUTION OF NATURAL RESOURCE RENT: OPPORTUNITIES OF NATIONAL RENTAL FUND........................................................................................................................... 77
Oksana Senyshyn, APPLICATION OF SWOT-ANALYSIS METHOD IN FORMING THE STRATEGY OF ORGANIC FARMING DEVELOPMENT IN UKRAINE ............................................................................................................................... 87
Maksym Gorikhovskyi, FORMATION OF COMPETITIVENESS OF FARMS IN KHMELNYTSKYI REGION BASED ON FORESIGHT TECHNOLOGIES ........................... 94
Larysa Lazorenko, ROLE OF CORPORATE SOCIAL RESPONSIBILITY IN THE BUSINESS DEVELOPMENT .......................................................................................100
REQUIREMENTS TO MANUSCRIPTS (in Ukrainian) ............................................................107
REQUIREMENTS TO MANUSCRIPTS (in Czech) ..................................................................111
REQUIREMENTS TO MANUSCRIPTS (in English) ...............................................................114

ISSN 2533‐4794 EVROPSKÝ ČASOPIS EKONOMIKY A MANAGEMENTU
6
Влодзімеж Ольшевській, д. е. н. Університет Яна Вижиковського, Польща Григорій Башнянин, д. е. н. Львівська комерційна академія, Україна Олександр Свінцов, д. е. н. Дрогобицький державний педагогічний університет імені Івана Франка, Україна
ДЕРЖАВНЕ І ПРИВАТНЕ ФІНАНСУВАННЯ ОСВІТИ В УКРАЇНІ: СТАН, ПРОБЛЕМИ, ПЕРСПЕКТИВИ Wlodzimiezh Olshewski, ScD in Economics University of Jan Vyzhykovsky, Poland
Hryhorii Bashnianyn, ScD in Economics Lviv Academy of Commerce, Ukraine
Oleksandr Svintsov, ScD in Economics Ivan Franko State Pedagogical University of Drohobych, Ukraine
PUBLIC AND PRIVATE FINANCING OF EDUCATION IN UKRAINE: STATE, PROBLEMS AND PROSPECTS
State and prospects of public and private financing of education in Ukraine are investigated. The benefits of individuals and society from investments into education are analyzed. It is revealed that production of human recourses of a high adaptability based on economic balancing specialist and basic training requires adequate financial support. The structure of the education system is considered, problems of financing of educational institutions in Ukraine are traced. The problem of financing education systems in transition economy is investigated, that has targeted two components: wages, adequate intellectual power expenses in the production of educational services and intellectual‐innovative product; resources for training. The basic ways of their solutions are offered. Key words: education system, education, financing, investments, public educational institutions, private financing.
Постановка проблеми. Основним фактором приросту суспільного багатства у сучасному інформаційному постіндустріальному суспільстві є збільшення нагромаджуваного обсягу знань. Перетворення інформації в знання, її якісне перетворення відбувається внаслідок наукових досліджень та освітньої діяльності. Від освітньої діяльності в першу чергу залежить сума нагромаджуваних знань, навичок і досвіду, тобто, освітній потенціал суспільства. Освітній потенціал – сукупність наявних засобів, можливостей суспільства у будь-якій сфері діяльності – перш за все залежить від фонду освіти. Величина фонду, тобто сума фінансових ресурсів, виділених на освіту, визначається інвестиційною політикою країни.
Мета статті полягає в дослідженні державного та приватного фінансування освіти в Україні з врахуванням методів визначення вигідності інвестування в освіту, структури системи освіти, проблем фінансування вітчизняних закладів освіти.
Стан дослідження. Проблема державного фінансування системи освіти в України досить широко досліджена у працях вітчизняних економістів: В. Андрієнка1,
1 Лисенко, Ю. (2002). Перебудова фінансування в державному ВНЗ. Економіка України, 5, 68–74.

EUROPEAN JOURNAL OF ECONOMICS AND MANAGEMENT • Volume 3 Issue 1 2017
7
І. Каленюк1, В. Коваленка2, О. Красій3, В. Лагутіна4, Ю. Лисенка5, В. Новікова6, С. Пирога7, О. Стельмаха8, М. Шаварини9 та ін. Проте недостатнє державне фінансування освіти в Україні зумовлює аналіз існуючих та перспективи формування нових джерел фінансування освіти.
Виклад основних положень. Будь-яка інвестиція – це акт цільовий, спонукуваний перспективою очікування доходу. Інтелектуальні інвестиції – це, перш за все, очікування віддачі від впровадження інновацій. Процес фінансування капіталовкладень інтелектуального порядку реалізується із трьох джерел: державного бюджету і коштів державних підприємств; інвестицій приватного сектора національної економіки; вкладів спонсорів, благодійницьких установ або коштів домогосподарств.
Тобто є два суб’єкти підприємницької діяльності, які здійснюють інтелектуальні інвестиції – держава і приватний капітал. Інвестиційна діяльність держави і приватного підприємництва має свої особливості, які більш виразно простежуються у перехідних економіках. Якщо на Заході корпоративний капітал на рівних із державою інвестує наукові дослідження, масштабні інноваційно-технологічні експерименти із величезними фінансовими витратами, то приватний капітал країн Східної Європи орієнтується на виробництво таких товарів і послуг, які у максимально стислий термін дають дохід із ставкою, не нижчою від середньої у промисловості.
В Україні інвестиції більше поширення отримали у галузі освіти ніж у науково-дослідній діяльності. Приватний бізнес неохоче фінансує розробку фундаментальних науково-технічних інновацій. Внаслідок цього має місце наростання невідворотності негативних тенденцій у мотивації відтворення інтелектуальних ресурсів – а це вже соціальна проблема та проблема національної безпеки і майбутнього. Скорочення пропозиції на інтелектуальні послуги на вітчизняному ринку переміщує останні за кордон. До прикладу, кожен четвертий винахідник України реєструє свою раціоналізацію в Росії.
Щодо впроваджень у людський капітал, то в Україні, як і в розвинутих країнах світу, одночасно із безкоштовною державною освітою має місце і приватна освіта, причому приватні інвестиції в галузі освіти в Україні набрали більшого поширення, ніж інтелектуальні інвестиції у науково-дослідну діяльність. Ця тенденція полягає в тому, що інвестиції в освіту безпосередньо формують людський капітал – найперспективніший, стратегічний ресурс розвитку кожної країни. Згідно із результатами досліджень, які здійснили провідні спеціалісти Світового банку під егідою ЮНЕСКО в 30 країнах світу, 1/3 приросту ВНП зумовлена інвестиціями у систему освіти, рентабельність якої загалом становить від 12 до 24 %10. Тобто ефективність виробництва прямо залежить від підвищення освітнього рівня населення. Знання, здобуті у ВНЗ, кристалізовані у відповідних документах, передусім у дипломі про закінчення вищого навчального закладу, на ринку трудових ресурсів стають чи не найвагомішим спонукальним фактором вибору для
1 Каленюк, І.С. (2000). Диверсифікація джерел фінансування освіти. Фінанси України, 11, 72–78. 2 Коваленко, В.М. (2001). Організаційні та фінансові аспекти використання трудового потенціалу робочої сили. Фінанси України, 9, 43–48. 3 Красій, О.І. (2000). Фінансування народної освіти. Фінанси України, 4, 49–53. 4 Лагутін, В.Д. (1998). Фінансові проблеми платного навчання у державних вищих закладах освіти. Фінанси України, 12, 95–99. 5 Лисенко, Ю. (2002). Перебудова фінансування в державному ВНЗ. Економіка України, 5, 68–74. 6 Новіков, В. (2000). Кредитування вищої освіти. Економіка України, 4, 72–76. 7 Пирога, С., Пирога, І. (1997). Джерело фінансування освіти. Економіка України, 2, 87–89. 8 Стельмах, О.М. (2003). Особливості франдрейзингу та індаументу в системі фінансування вищих навчальних закладів. Вісник Тернопільської академії народного господарства, 5, 221–227. 9 Шаварина, М.П. (2000). Проблеми фінансів вищих закладів освіти. Фінанси України, 6, 79–83. 10 Яхтенфукс, М., Колєр-Кох, М. (2007). Європейська інтеграція: навчальний посібник. Київ: Києво-Могилянська академія.

ISSN 2533‐4794 EVROPSKÝ ČASOPIS EKONOMIKY A MANAGEMENTU
8
покупця-роботодавця. Однак поруч із перспективою отримання престижної, високооплачуваної роботи, здобувач освітніх послуг стає перед суто індивідуально-економічною проблемою окупності і дохідності інвестицій в освіту. Адже для студента, скажімо, існують так звані витрати не одержаних, втрачених за роки навчання доходів. Крім цього, випускник ВНЗ на початках своєї кар’єри має невисокі доходи, інколи нижчі, ніж працівники із середньою освітою, але із багаторічним стажем. Але тут спрацьовує фактор часу – при оцінці витрат і надбань, пов’язаних з одержанням освіти, грошові доходи дипломованого фахівця збільшуються із віком. Одним із джерел фінансування освіти, у розвинутих країнах та все частіше і у країнах перехідних (в тому числі й Україні), для індивіда виступає банківська позика. Для визначення вигідності інвестування у вищу освіту економісти пропонують підрахувати внутрішню норму інвестиційної дохідності та порівняти її з ринковою ставкою процента: якщо норма інвестиційної дохідності вища або дорівнює ставці процента – інвестиція в освіту виправдана1.
Зауважимо, що не дивлячись на логіко-раціоналістичну сторону проблеми, особа інвестує в освіту, щоб здобути нові знання і стати висококонкурентним претендентом на престижне робоче місце. Здобута освіта дає відчуття стабільності професійного становища, теоретична база дає арсенал оперативного добору засобів для досягнення виробничих цілей, пристосування до нових умов діяльності, що особливо актуально. Відомо, що на початку ХХ ст. знань, отриманих людиною в результаті закінчення ВНЗ, вистачало на все життя, у середині ХХ ст. – на півжиття, а в нинішніх умовах – на 5-10 років. А це зумовлює необхідність постійного інформаційного самовдосконалення через швидкість морального старіння знань фахівців.
Можемо відмітити позитивні зрушення в суспільній свідомості як українського соціуму, так і держави. Суспільство розуміє ключову роль освіти у формуванні конкурентоздатного трудового ресурсу, що дасть відчуття безпеки і стабільності. Роль і значення освіти у суспільному житті зростає в міру ущільнення системи відносин, становлення інституцій та кристалізації соціальної інформації через культуру, мистецтво і техногенез. Структура системи освіти у сучасному баченні може бути відображена з урахуванням системно-синергетичного підходу (див. рис. 1.).
Рис. 1. Структура системи освіти та її елементи
1 Мортиков, В.В. (1998). Окупність і дохідність інвестицій в освіту. Фінанси України, 5, 34–41.

EUROPEAN JOURNAL OF ECONOMICS AND MANAGEMENT • Volume 3 Issue 1 2017
9
Основними її елементами є цільова, керуюча та функціональна підсистеми, а також наукове обґрунтування системи освіти, економіка системи освіти, зовнішнє середовище системи освіти і підсистема забезпечення.
Первинною ланкою освітнього комплексу є національна система середньої освіти, яка є важливою галуззю довгострокового капіталовкладення, вигод переливу усього суспільства у перспективі десятиліття. Саме середня освіта на сьогодні стала тим мінімальним освітнім рівнем, який дозволяє індивідові “знайти” собі нішу у системі суспільних відносин, звести до мінімуму кількість непотрібних суспільству людей, оскільки вартість робочої сили вже довший час не визначається фізіологічним споживчим кошиком, і навіть не соціальним споживчим кошиком. Із середини ХХ ст. середня освіта у розвинутих країнах світу стає обов’язковою. Коли освіта була приватною, освітні послуги підлягали індивідуальній оплаті. Коли ж необхідність освіти набрала загальнонаціональних масштабів, природно, що проблему фінансування освіти зобов’язана була взяти на себе найвища соціальна інституція – держава.
У кінці ХІХ ст. мінімальні вкладення в освіту не знижувалися нижче 5% ВНП. Однак, техногенез у країнах індустріальної економіки вимагав збільшення обсягу інвестицій в освітній комплекс, а бурхливий розвиток інформаційних технологій в кінці ХХ ст. вказав на те, що саме освітній рівень є індикатором конкурентоспроможності суспільства у сучасних світових інтеграційних процесах. У 80-90 рр. ХХ ст. у Західній Європі прокотилася хвиля часткової приватизації підприємств суспільного сектора економіки, що не оминула і освітній комплекс. Західні суспільства пішли шляхом диверсифікації джерел фінансування освіти, причому домінуючою формою фінансування освіти залишилися державні ресурси. Приватизація реалізується у два способи: 1) створенням навчальних закладів приватної форми власності; 2) переходом на приватні джерела фінансування. Приватний сектор у структурі освітнього комплексу більшості розвинутих країн світу не перевищує 10-15 % усієї спискової чисельності учнів, а в країнах із низьким рівнем доходу вона вища ніж у країнах із середнім та високим рівнями доходу, хоча у Фінляндії та Швейцарії приватне фінансування у відсотках до сукупних видатків на освіту становить, відповідно, 50 % та 55%1.
Зауважимо, що володіючи на час проголошення незалежності одним із найвищих інтелектуальних потенціалів у світі, Україна, внаслідок квазіринкової трансформації, виплекала дві ключові проблеми, через котрі деградує національний освітній комплекс: залишковий принцип фінансування та висока плинність кадрів. Причому друга проблема, значною мірою, є похідною від першої. Правда, освітній комплекс України, задіяв механізми залучення альтернативних джерел фінансування – приватні інвестиції фізичних та юридичних осіб. Однак ріст частки приватних джерел у фінансуванні освіти в сучасних умовах – це переважно тенденція, характерна для слаборозвинутих країн, таких як Кенія, Уганда, Гаїті, Шрі-Ланка та ін. Платна освіта в Україні розрахована на студентів, набраних понад державний план прийому, а отримані при цьому кошти є некомерційними ресурсами, що спрямовуються на розвиток матеріальної бази ВНЗ та у дохід бюджету. Натомість у розвинутих країнах світу має місце тенденція посилення державного фінансування освіти. Наприклад, у Франції за останні 20 років державні витрати на освіту коливаються від 6,4 % до 6,8 %. У Королівстві Швеція освіта повністю фінансується державою, навчання безкоштовне. У Великобританії – змішана система фінансування, що дозволило мати найвищий відсоток вузівської молоді серед Європейських країн – 30 %.
Першим показником успішного функціонування освіти є кадрове забезпечення. Якісний склад кадрового забезпечення в Україні знижується внаслідок високої плинності. Згідно статистичних даних, у середині 90-х років ХХ ст. в університетах України працювало в середньому майже півтори тисячі докторів та більше 6000 кандидатів наук. На
1 Каленюк, І.С. (2000). Диверсифікація джерел фінансування освіти. Фінанси України, 11, 72–78.

ISSN 2533‐4794 EVROPSKÝ ČASOPIS EKONOMIKY A MANAGEMENTU
10
початок ХХІ ст., незважаючи на щорічні захисти дисертацій, кількість докторів наук у вищих закладах освіти знизилася більш як на сто чоловік, а кандидатів зменшилася на тридцять осіб. Ключовою причиною плинності кадрів є недостатнє фінансування.
Проблема фінансування освітнього комплексу України має дві цільові компоненти: 1) оплату праці, адекватну інтелектуально-енергетичним затратам у виробництві освітньої послуги та інтелектуально-інноваційного продукту; 2) ресурсне забезпечення підготовки кадрів. Оплата праці та її розмір має ґрунтуватися передусім на стимуляційному факторі праці, а не командно-адміністративному. Зарплата українського науковця у 3-4 рази нижча ніж в його колеги із Східної Європи, та у 5-7 разів нижча ніж в аналогічного фахівця на Заході (мінімальна річна зарплата професора у США становить 50 тис. дол.). Низький рівень зарплати є основною причиною плинності кадрів у ВНЗ та зниження якості освітніх послуг.
Матеріально-технічна база навчальних закладів повинна постійно оновлюватись адекватно до рівня техногенезу. У розвинутих країнах світу із (в середньому) 5 % ВВП державних інвестицій в освіту, щонайменше 2 % має скеровуватися на ресурсне забезпечення. У Японії цей показник – 3,05 %, в Ізраїлі – 3,5 %, у США – 2,75 %, в Україні приблизно – 0,3 %. Досвід економічно розвинутих країн свідчить, що інвестиції в науку стають рентабельними на рівні 1,7 % ВВП. Проте на закупівлю нового обладнання і техніки держава грошей майже не виділяє. У зв’язку з цим, випускник вітчизняного навчального закладу без серйозної і довготривалої адаптації не спроможний обслуговувати на підприємстві сучасне обладнання, що робить його неконкурентоспроможним на ринку праці.
На сьогодні в Україні існує ситуація з розмежуванням видатків, що спричиняє проблему неефективного використання обсягу фінансових ресурсів, спрямованих на освіту. Важливим інструментом підвищення якості освіти є розподіл фінансових ресурсів на фінансування освітніх послуг з місцевих бюджетів. Проте існують перешкоди для застосування такого розподілу Міністерством освіти, науки, молоді та спорту достатньо ефективно та в повному обсязі. Для розподілу необхідне здійснення Міністерством освіти та науки відповідного аналізу та встановлення коригування коефіцієнтів згідно з аналізом зв’язку між освітніми змінами на місцевому рівні та коефіцієнтами і внесення належних коригувань. В існуючій на сьогодні системі функції Міністерства освіти та науки і Міністерства фінансів розподілені таким чином, що Міністерство освіти, науки, молоді та спорту немає достатніх можливостей для здійснення такого аналізу. Як наслідок, функції забезпечення розвитку освіти та фінансування розділені таким чином:
Міністерство освіти та науки здійснює заходи щодо розвитку освіти, проте не може самостійно перерозподілити кошти на фінансування освіти згідно з визначеними пріоритетами;
Міністерство фінансів розподіляє кошти на освіту відповідно до встановлених нормативів, проте не аналізує вплив фінансування на її розвиток.
Згідно з Бюджетним кодексом протягом п’яти років після набрання ним чинності може бути застосований міжбюджетний трансферт з Державного бюджету України на зменшення фактичних диспропорцій між місцевими бюджетами через нерівномірність мережі бюджетних установ. Розмір цього міжбюджетного трансферту на перший рік встановлюється в розмірі 5 % від загального обсягу дотацій вирівнювання з Державного бюджету України місцевим бюджетам. Кожного наступного року розмір трансферту зменшується на 1 % від загального обсягу дотації вирівнювання. Розподіл такого трансферту наразі відбувається, на думку ряду вітчизняних фахівців1, без врахування позиції Міністерства освіти та науки й місцевих управлінь освіти. Без такого врахування
1 Стратегія реформування освіти в Україні: рекомендації з освітньої політики (2003). Київ, 296.

EUROPEAN JOURNAL OF ECONOMICS AND MANAGEMENT • Volume 3 Issue 1 2017
11
додаткові фінанси можуть розподілятися механічно і сприятимуть неефективному використанню коштів. Натомість розподіл додаткового трансферту має відбуватись згідно з пріоритетами освітньої політики.
Українськими вченими-експертами з аналізу освітньої політики за напрямом “Економіка освіти”1 розроблено три варіанти політики підвищення ефективності використання розрахунку обсягу фінансових ресурсів, що спрямовуються на фінансування освітніх послуг з місцевих бюджетів.
Варіант політики А. Передати відповідальність та права щодо формування освітнього бюджету та правил розподілу міжбюджетних трансферів між місцевими бюджетами на формування локальних освітніх бюджетів з Міністерства фінансів до Міністерства освіти та науки.
Варіант політики Б. Покращити формулу розподілу міжбюджетних трансфертів на формування локальних освітніх бюджетів за такими сценаріями:
1) фінансування “на учня” з єдиним коефіцієнтом приведення для всіх учнів шкіл сільської місцевості України;
2) фінансування “на учня” з єдиним коефіцієнтом приведення для учнів шкіл сільської місцевості для кожної області;
3) фінансування “на учня” з коефіцієнтом приведення для учнів шкіл сільської місцевості, що залежить від об’єктивних відмінностей районів України, які спричиняють різну вартість навчання у школах сільської місцевості.
Варіант політики В. Розробити механізми залучення центральних та локальних рівнів управління освітою до прийняття рішень щодо розподілу додаткових міжбюджетних трансфертів.
Механізми залучення передусім повинні передбачати чіткі правила розподілу таких резервів. Частку резервів, що надходитиме на освіту, необхідно розподіляти за прозорими правилами. Прозорість може бути збережена за умови проведення конкурсів заявок за участю представників освіти як центрального (Міністерств освіти, науки, молоді та спорту України), так і місцевих рівнів (заявниками). Застосування запропонованих оптимізаційних механізмів, навіть при недофінансуванні галузі, дасть можливість досягнути поліпшення фінансування таких ключових освітніх ланок як дошкільна, загальна середня, а також і спеціальна освіта.
Висновки. Продукування трудових ресурсів високого ступеня економічної адаптованості на основі збалансування спеціалізованої та фундаментальної підготовки потребує відповідного фінансового забезпечення. Проблема фінансування освіти у перехідних системах економіки (в тому числі в Україні) має дві цільові компоненти: 1) оплату праці, адекватну інтелектуально-енергетичним затратам у виробництві освітньої послуги та інтелектуально-інноваційного продукту; 2) ресурсне забезпечення підготовки кадрів. Фінансування здійснюються за рахунок трьох джерел: бюджетних асигнувань і коштів державних підприємств; приватно-підприємницького капіталу; спонсорських коштів, благодійних субсидій тощо. Передумовою інвестування в освітні проекти є оцінка окупності і доходності вкладень в освіту. Для оцінки інвестиційної віддачі від затрат на вищу освіту розраховують дисконтовий потік витрат і доходів. Вкрай актуальним для освітнього комплексу України є диверсифікація джерел фінансування, надання особливих освітніх послуг на які є високий попит з боку економіки і суспільства. Окрім цього вагомим інструментом підвищення якості освіти є оптимальний розподіл фінансових ресурсів на фінансування освітніх послуг з місцевих бюджетів. У той же час держава повинна фінансувати освітні проекти із перспективою навчання за кордоном і здобуття спеціальностей у галузях біотехнологій та Інтернет-економіки.
1 Стратегія реформування освіти в Україні: рекомендації з освітньої політики (2003). Київ, 296.
ISSN 2533‐4794 EVROPSKÝ ČASOPIS EKONOMIKY A MANAGEMENTU
12
References: 1. Lysenko, Iu. (2002). Perebudova finansuvannia v derzhavnomu VNZ [Restructuring of financing in public universities]. Ekonomika Ukrainy [Economy of Ukraine], 5, 68–74. [in Ukrainian]. 2. Kaleniuk, I.S. (2000). Dyversyfikatsiia dzherel finansuvannia osvity [Diversifying sources of education funding]. Finansy Ukrainy [Finance of Ukraine], 11, 72–78. [in Ukrainian]. 3. Kovalenko, V.M. (2001). Orhanizatsiini ta finansovi aspekty vykorystannia trudovoho potentsialu robochoi syly [Organizational and financial aspects of the employment potential workforce]. Finansy Ukrainy [Finance of Ukraine], 9, 43–48. [in Ukrainian]. 4. Krasii, O.I. (2000). Finansuvannia narodnoi osvity [Funding of Public Education]. Finansy Ukrainy [Finance of Ukraine], 4, 49–53. [in Ukrainian]. 5. Lahutin, V.D. (1998). Finansovi problemy platnoho navchannia u derzhavnykh vyshchykh zakladakh osvity [Financial problems of paid education in public higher education institutions]. Finansy Ukrainy [Finance of Ukraine], 12, 95–99. [in Ukrainian]. 1. 11. Mortykov, V.V. (1998). Okupnist i dokhidnist investytsii v osvitu [Payback and profitability of investments in education]. Finansy Ukrainy [Finance of Ukraine], 5, 34–41. [in Ukrainian]. 6. Novikov, V. (2000). Kredytuvannia vyshchoi osvity [Lending of Higher Education]. Ekonomika Ukrainy [Economy of Ukraine], 4, 72–76. [in Ukrainian]. 7. Pyroha, S., Pyroha, I. (1997). Dzherelo finansuvannia osvity [Funding source of education]. Ekonomika Ukrainy [Economy of Ukraine], 2, 87–89. [in Ukrainian]. 8. Stelmakh, O.M. (2003). Osoblyvosti frandreizynhu ta indaumentu v systemi finansuvannia vyshchykh navchalnykh zakladiv [Features of fundraising and endowment in the system of financing higher education institutions]. Visnyk Ternopilskoi akademii narodnoho hospodarstva [Bulletin of Ternopil Academy of National Economy], 5, 221–227. [in Ukrainian]. 9. Stratehiia reformuvannia osvity v Ukraini: rekomendatsii z osvitnoi polityky (2003) [Reform Strategy for Education in Ukraine: Educational Policy Recommendations (2003)]. Kyiv, 296. [in Ukrainian]. 10. Shavaryna, M.P. (2000). Problemy finansiv vyshchykh zakladiv osvity [The problems of finance of higher education institutions]. Finansy Ukrainy [Finance of Ukraine], 6, 79–83. [in Ukrainian]. 11. Yakhtenfuks, M., Kolier-Kokh, M. (2007). Yevropeiska intehratsiia: navchalnyi posibnyk [European Integration: Tutorial]. Kyiv: Kyievo-Mohylianska akademiia [Kyiv-Mohyla Academy]. [in Ukrainian].

EUROPEAN JOURNAL OF ECONOMICS AND MANAGEMENT • Volume 3 Issue 1 2017
13
Yulia Vlasenko Kyiv National Economic University named after Vadym Hetman, Ukraine
THE ROLE AND PLACE OF THE CLUSTER APPROACH IN THE CURRENT NIS STUDIES
Innovation through creation, diffusion and use of knowledge has become a key driver of economic growth and provides part of the response to many new societal challenges. However, the determinants of innovation performance have changed in a globalising knowledge‐based economy, partly as a result of recent developments in information and communication technologies. Innovation results from increasingly complex interactions at the local, national and world levels among individuals, firms and other knowledge institutions. Governments exert a strong influence on the innovation process through the financing and steering of public organisations that are directly involved in knowledge generation and diffusion (universities, public labs), and through the provision of financial and regulatory incentives to all actors of the innovation system. They need a sound conceptual framework and an empirical basis to assess how the contribution of public policy to national innovation performance could be improved. Through a decade of academic research and policy analysis, the National Innovation Systems (NIS) approach has been developed to provide such framework and quantitative information. Obviously, the organization of innovation within an economy plays an important role in market‐based economies and in their institutional set‐ups, which is due to the meanwhile uncontested growth‐spurring impact of innovation. The results from this study may be relevant to the design and the efficiency of political measures directed towards innovative action on the country level. The reason for this is that the identified different clusters of national systems of innovation show the degree and the areas of structural similarities across the analyzed systems. In this way, the country clusters that are detected may affect the efficiency of mutual learning processes when it comes to the planning, the conduct and the targeted international coordination of technology policy action. Key words: national system of innovation, innovation, technology, cluster approach, Star–model.
Formulation of the problem. Features of the present stage of economic development, accelerating the pace of globalization cause high importance of science and technology for economic and social well-being of society. The main economic achievements of foreign countries, in most cases related to the prioritization of science and technology, as well as the state scientific and technical policy. On the other hand, it is those countries which at a certain stage of their development have focused on the quality of life and the main purpose of development identified improving the level and quality of life of its citizens, could through activation of the scientific potential and strengthening the innovation component of the economy to achieve high rates of economic growth and making a serious step towards the creation of a socially oriented economy. Currently, scientists and economists around the world are exploring measurement issues and quantification of various parameters of quality of life, trying to find its objective characteristics. However, comprehensive studies of the relationship between the development of the national innovation system, an innovative component of the economy and changing the quality of life at the moment, are not represented. Despite numerous studies, there are a lot of controversial issues related to the creation of an innovative economy, the emergence of the national innovation system, the commercialization of science, and most importantly - research methods of effective functioning national innovation system.
Analysis of recent research and publications. The founders of the modern approach to understanding the problems of formation and functioning of the national innovation system were the following scientists: J.Schumpeter, G.Mensch, R.Solow, E.Toffler, D.Galbraith, F.Mashlup, T.Styoart, D.Tapscott, F.Webster, P.Drucker, J.Masuda, M.Porat, A.Pikkaluga, L.Ferruchchi,
ISSN 2533‐4794 EVROPSKÝ ČASOPIS EKONOMIKY A MANAGEMENTU
14
D.Porkeddu, M.Latstseroni, A.Gambardella. Questions of creation and functioning of innovative clusters contained in the writings of
L.Ablasa, M.Bell, E.Dahm, A.Marshall, M.Porter, S.Rosenfeld, E.Hill, M.Enright. Setting the objective. The aim of the article is the theoretical rationale for the study of the
national innovation system, and the relevance of the use of the cluster approach in the process. Conceptual genesis of the phenomenon of the national innovation system in this context of globalization
The basic material of research. The term national system of innovation has been around for more than 20 years and today it has become widely spread among policy makers as well as scholars all over the world. In this lecture I will take stock and look ahead from a personal point of view. I will give some insight in why and how the concept came about and give some space to criticism and self-criticism. I will mention but certainly not give justice to alternative conceptualizations of innovation system.
As gives OECD, National Innovation System means a core concept for analyzing an economy’s capacity to produce, commercialize, import, and utilize knowledge and technology. Innovation, learning and technological development, indispensable for long-term economic development of a nation, are now seen as systemic activities involving many and diverse economic actors. Therefore the NIS concept rests on the premise that enhancing linkages among various actors, especially with respect to knowledge creation, diffusion and use, is a crucial for improving a country’s innovative performance.
The innovation system concept was developed in parallel at different places in Europe and in the US in the eighties. There is no doubt that the collaboration between Christopher Freeman and the IKE-group in Aalborg in the beginning of the eighties was important in coining and shaping the earliest versions of the concept1 (Freeman 1982 and Lundvall 1985) but the basic ingredients and the inspiration may be found in the work of many other innovation scholars before that. Freeman brought deep understanding of innovation processes, historical insight and wisdom to the collaboration. His reference to Friedrich List was crucial since it linked the concept to the role of the state in catching-up processes2. The IKE-group, inspired by French structuralist Marxists and development economists, contributed with ideas about ‘national production systems’ and industrial complexes’ where vertical interaction was crucial for performance and outcome and linked this to the analysis of international specialisation and international competitiveness. Within the IKE-group Esben Sloth Andersen and Gert Willumsen played key roles in respectively developing the systemic aspects and the idea of interactive learning between users and producers as the micro-foundation of the concept. Bent Dalum and Jan Fagerberg made important contributions to respectively technology and trade while Björn Johnson brought in perspectives from institutional economics and applied them on innovation. My own starting point was actually the analysis of slack and diversity at the level the firm. The NSI-concept became more widely diffused through Christopher Freeman’s book on Japan (Freeman 1987) through a publication edited by Freeman and myself on small countries (Freeman and Lundvall 1988) and not least through the publication of the Dosi et al book on technical change and economic theory with contributions by Freeman, Nelson, Lundvall and Pelikan (Dosi et al 1988). More recent standard references on national systems of innovations are three books edited by Lundvall (1992), Nelson (1993) and Edquist (1996). Other contributions referring to systems and operating at the national level refer to ‘social systems of innovation’ (Amable et al 1997) and to ‘national business systems’ (Whitley 1994 and 1996). Over the last decade there have been several new concepts emphasizing the systemic
1 Freeman, C. (1995). The national system of innovation in historical perspective. Cambridge Journal of Economics, 19 (1), 5-24. 2 Lundvall, B-Å. (2007). National Innovation Systems: analytical concept and development tool. Industry & Innovation, 14(1), 95-119.
EUROPEAN JOURNAL OF ECONOMICS AND MANAGEMENT • Volume 3 Issue 1 2017
15
characteristics of innovation but with focus at other levels of the economy than the nation state1. Bo Carlsson with colleagues from Sweden developed the concept ‘technological systems’ in the beginning of the nineties (Carlsson and Stankiewitz, 1993). The literature on ‘regional systems of innovation’ has grown rapidly since the middle of the nineties (Cooke, 1996; Maskell and Malmberg, 1997) while Franco Malerba with colleagues developed the concept of ‘sectoral systems of innovation’ (Breschi and Malerba, 1997). Some of the crucial ideas inherent in the innovation system concept on (vertical interaction and innovation as an interactive process) appear in Porter’s industrial clusters as well as in Etzkowitz&Leydesdorff’s Triple Helix-concept (Etzkowitz and Leydesdorff 2000)2.
More representative study the functioning of the national innovation system is a cluster approach.
Clusters are networks of interdependent firms, knowledge-producing institutions (universities, research institutes, technology-providing firms), bridging institutions (e.g. providers of technical or consultancy services) and customers, linked in a production chain which creates added value. The concept of cluster goes beyond that of firm networking, as it captures all forms of knowledge sharing and exchange. The analysis of clusters also goes beyond traditional sectoral analysis, as it takes into account the links to firms outside traditional sectoral boundaries. Сluster analysis is regarded in several OECD countries as an important tool for providing a sound basis for industrial and technology policy. In this respect, cluster analysis is one of the core elements of the work on national innovation systems. Co-operation in clusters is increasingly required for firms to be successful. Moreover, it offers a direct way to improve economic performance and reduce costs. Co-operation can lower costs if firms acquire knowledge and thus meet their needs more cheaply than by producing that knowledge in-house. It also creates greater opportunities for learning, an essential requirement for productivity improvement; it may make possible economies of scale and scope, enable the sharing of risks and R&D costs, and allow greater flexibility. It also may help to reduce the time to market for new products and processes. Analysis of several mature OECD-area industries (textiles, steel and automobiles) suggests that co-operation with suppliers and customers, in increasingly stable arrangements (clusters), has significantly helped these industries to revitalise and regain competitive strength (OECD, 1998a)3.
Despite Porter’s detailed definition of a cluster it is rather difficult to draw clear boarders around a cluster. Porter (1998) himself criticizes aligning clusters in broad groupings, such as manufacturing, consumer goods, or high tech. According to him, discussions about cluster constraints and bottlenecks in such groupings fall into generalities. On the other hand also labeling a single industry as a cluster overlooks crucial cross-industry and institutional interconnections that strongly affect competitiveness. Porter admits that drawing cluster boarders is often a matter of degree. According to him the strength of linkages, their importance to productivity and innovation determine the ultimate boundaries of a cluster. In other words cluster boundaries should encompass all firms, industries, and institutions with strong linkages, whether vertical, horizontal, or institutional; those with weak or non-existent linkages can be safely left out.
According to Davis the cluster approach is feasible for creative industries because it is consistent with the literature that investigates clusters in many other industries and sectors. The key characteristics of clusters remain unchanged despite the industry. These key characteristics are numerous linkages among geographically proximate firms and institutions, especially suppliers, business services, research institutions, and educational institutions. Also Bagwell agrees that the advantages of clustering such as increased competitiveness, higher productivity, new firm
1 Nelson, R. (1993). National Systems of Innovation: A Comparative Study. Oxford University Press, Oxford. 2 Porter, M., Stern, S. (2002). National Innovative Capacity, in World Economic Forum, The Global Competitiveness Report 2001-2002. Oxford University Press, New York. 3 OECD (2008). Competitive Regional Clusters.National Policy Approaches, OECD Publications. Paris.

ISSN 2533‐4794 EVROPSKÝ ČASOPIS EKONOMIKY A MANAGEMENTU
16
formation, growth, profitability, job growth and innovation are applicable to creative clusters as well as for other business clusters. The result of these advantages has been that policy makers around the globe have supported clusters as an economic development strategy for various industries and creative industries are no exception. Creative cluster development is now central to the economic strategies of regional development agencies across many regions of the world.
According to the best-known taxonomy of innovating firms, clusters can be categorised as: 1) science-based; 2) scale-intensive; 3) supplierdominated; 4) specialised suppliers1. Each type has its own characteristics as regards predominant forms of knowledge flows. For
the science-based clusters (e.g. pharmaceuticals, aerospace), direct access to basic research and to public research institutes and universities is important to complement their own research activities. These sectors are highly R&D- and patent-intensive and tend to exhibit closer collaboration with the public research sector. Scale-intensive clusters (e.g. food-processing, vehicles) tend to establish links with technical institutes and universities without performing much research on their own; their innovative performance depends on their ability to import and build upon science developed elsewhere, particularly with regard to process improvements. Supplier-dominated clusters (e.g. forestry, services) tend to import technology mainly in the form of capital goods and intermediary products; their innovative performance is largely determined by their ability to interact with their suppliers as well as extension services. Specialised supplier clusters (e.g. computer hardware and software) are R&D intensive and emphasize product innovations, generally working closely with each other, customers and users.
In studies of national innovation systems, countries have used different approaches to identifying clusters of industries. For the most part, they group sectors according to the intersectoral intensity of different types of knowledge flows, including:
1) embodied technology flows (the purchase of products and intermediate goods from other sectors) and producer-user interactions;
2) technical interactions as measured by the structure of patenting, citations of patents and scientific publications in other sectors, and joint research activities;
3) personnel mobility or the level and flows of skilled workers in and out of sectors. Countries are increasingly using a “cluster approach” to analysing knowledge flows in
national innovation systems in recognition of the close interaction between certain types of firms and industries2. These interactions may evolve around key technologies, shared knowledge or skills or producersupplier relationships. Nations, whatever their overall level of innovative performance, do not usually succeed across the whole range of industries, but “in clusters of industries connected through vertical and horizontal relationships” (Porter, 1990). According to the “diamond scheme”, clusters of related and supporting industries can be created through demand patterns for products, rivalry among firms as well as specialised factors or inputs such as skilled personnel or natural resources. Patterns of knowledge flows can differ markedly from cluster to cluster and also within countries specialised around different clusters.
Clusters can be identified at various levels of analysis. Micro-level analysis focuses on inter-firm linkages, industry- (meso-) level analysis on inter- and intra-industry linkages in a production chain, and macro-level analysis on how industry groups constitute the broader economic structure. Cluster analysis can also be applied at the regional level. Regional clusters are often based on
1 Potts, J., Cunningham, S. (2008). Four Models of the Creative Industries. International Journal of Cultural Policy, 14(3), 233-247. 2 Roelandt, T. Den Hertog, P. (1999). Cluster Analysis and Cluster- Based Policy Making in OECD Countries: An Introduction to the Theme. Ch 1 in OECD (“Boosting Innovation: The Cluster Approach”. Paris: OECD, 9-23.
EUROPEAN JOURNAL OF ECONOMICS AND MANAGEMENT • Volume 3 Issue 1 2017
17
certain local strengths, such as a strong knowledge infrastructure (possibly linked to the strengths of a local university or research institute), the geographical location or infrastructure (such as the proximity of a major port or airport) or the presence of a major firm. At the aggregate level, most OECD countries for which cluster studies have been made identify certain successful clusters in which these countries possess a strong competitive advantage. For example:
Australia: Commercial services, agro-food, metals/electrical, transport and communication, biomedical, ICT.
Austria: Construction, chemicals, media, metals/electrical, transport and communication, ICT, wood and paper.
Belgium: Energy, ICT, biotechnology, materials. Denmark: Construction, energy, health, agro-food, shipping, technical, pharmaceuticals/bio-technology and medical technology, mink.
Finland: Construction, chemicals, energy, health, forestry, basic metals, telecommunications, environment.
Netherlands: Construction, chemicals, commercial services, agro-food, energy, health, paper, media, transport and communication, metal/electrical.
Sweden: Construction, agro-food, energy, metals/electrical, ICT, wood and paper, materials, machinery, transport equipment.
United States: Construction, chemicals, energy, agro-food, media, metal/electrical, ICT, wood and paper, biotechnology, transport equipment, aerospace1.
Cluster analysis relies on various techniques (input-output analysis, innovation interaction matrices, graph theory, correspondence analysis, case studies), depending on the questions to be addressed. Using these techniques, it is possible to trace the interdependence of firms, which is sometimes based on trade linkages, sometimes on innovation linkages, sometimes on knowledge flow linkages and sometimes on a common knowledge base or common factor conditions. More generally, such studies rely on the idea that innovation is basically an interactive learning process which demands knowledge exchange, interaction and co-operation between various actors in a network of production or value chain.
Today the most popular in cluster system analysis of national innovative systems is the Star–model.
The most distinctive feature of the Star-model is the central role of clusters. The reasons for lifting clusters to the spotlight are clear. According to Porter (1998) clusters represent a new and complementary way of dividing and understanding an economy, organizing economic development thinking and practice, and setting public policy. Also OECD (1997) points out that cluster approach seems to be increasingly popular among innovation system theorists and countries developing innovation policies. There are numerous advantages of cluster approach to innovations. Just for recap a few, benefits of cluster approach consist of overcoming limitations of traditional sectorbased analysis and capturing more fully important linkages both inside the cluster and inside the whole innovation system. Clusters also emphasize cooperation, ease the access for the firms to specialized inputs and promote new business formation in related sectors. All these reasons speak for giving clusters more attention in modeling national innovation system. In addition to raising clusters to the spotlight also other modifications are necessary for the model to be better suited for modern economy. To make the new model take all aspects of economy into account it is very important to avoid the trap of overstressing science and technology. Especially OECD fails to do so by designing its national innovation system –model around a narrow innovation approach, thus neglecting the high innovation potential of other industries, such as creative industries for example. In order to avoid the bias towards science and technology a broader definition of innovation must be used when designing the national innovation system –model. As it was described earlier OECD’s model separates a narrow innovation system from a
1 OECD (2008). Competitive Regional Clusters.National Policy Approaches. OECD Publications, Paris.

ISSN 2533‐4794 EVROPSKÝ ČASOPIS EKONOMIKY A MANAGEMENTU
18
broad one. The Star–model uses a different approach1. Here the core of the model consists of innovation cycle and clusters surrounding the innovation cycle. An interrelationship between the core and the rest of the elements included in the model is dependent on boundaries of a cluster. However, drawing cluster boarders is often the matter of degree. Different links are important to different industries and clusters vary in size, breadth and state of development. Some clusters innovations depend highly on linkages to science system (e.g. biotechnology) and some are quite independent of it (e.g. many non-tech sectors). These are the reasons why an unambiguous boundary cannot be drawn between clusters and the rest of national innovation system. Ultimately, the strength of linkages and their importance to productivity and innovation determine the boundaries of a cluster. Thus, drawing boarders between the core of the Star–model and the rest of included elements is possible only in case of a single cluster but this approach cannot be generalized to the model as a whole. Due to these arguments there is no distinction to a narrow and a broad innovation system in the Star–model. Also the role of the state is emphasized in influencing the national innovation system. This feature makes the new model more suitable for countries in the process of transition to knowledge/creative economy and/or countries where the state has a traditionally strong role in the society. Examples of such countries are Russia and China. These distinctive features alter the very core of national innovation system and they have a significant impact on deciding which key elements to include in the national innovation system –model.
The core of the Star–model is innovation cycle surrounded by clusters. The original concept of innovation cycle was developed by OECD. The innovation cycle includes knowledge production – creating and producing knowledge, knowledge application – applying new knowledge to practical solutions in commercial and social terms, and knowledge diffusion – the spread of new knowledge applications across the economy and society until it is absorbed into our evolving way of life.
The rest of the Star–model consists of seven different elements of national innovation system and the state which is given the role of a background actor for the whole national innovation system. The seven elements completing national innovation system are: market conditions, macro- and regulatory environment, education and training, science and research, international network, financing and support organizations, and creative milieu. The state is given separate attention due to its potentially significant influence on every element of national innovation system.
All of these elements can be found in either OECD‟s model or in Porter’s Diamond model and its later modifications2. Several pieces of Porter’s competitive view on innovation system are regrouped under one notion of:
market conditions; macro- and regulatory environment; science and research; education and training; international networks; financing and support organizations; creative milieu. Conclusions. Clusters are engines of innovation, and represent a manageable system for
governments to implement the NIS framework by complementing horizontal policies by more targeted and customised policies. The Focus Group on Clusters has provided ample insights on how cluster policy should be part of a wider innovation policy. Its main policy recommendations are the following:
1 Roelandt, T. Den Hertog, P. (1999). Cluster Analysis and Cluster- Based Policy Making in OECD Countries: An Introduction to the Theme. Ch 1 in OECD “Boosting Innovation: The Cluster Approach”. Paris: OECD, 9-23. 2 Porter, M. (1990). The Competitive Advantage of Nations, MacMillan. London.
EUROPEAN JOURNAL OF ECONOMICS AND MANAGEMENT • Volume 3 Issue 1 2017
19
• Support emerging/existing clusters. Clusters emerge from traditional strengths in the economy or from more random events. The task for governments is to support clusters in their formation and further development. A cluster-based approach to innovation policy is particularly well suited to respond to shocks like major downsizing of large firms and closure of government operations.
• Both macro-level input-output analysis and more micro-level analysis help policy makers identify innovation bottlenecks and missing links in the clusters.
• Avoid high-tech myopia by considering both “low-tech” and “hightech” clusters. • Assess from a cluster perspective the impact on innovation of a wide range of policies.
Evidence shows that defence policy and land-use planning are often driving forces in the formation of clusters.
• Emerging clusters may often benefit from catalytic programmes to stimulate networking, including links with capital markets and business angels.
• The lack of advanced demand is a common bottleneck to cluster development and can justify, for example, specific export programmes and government technology procurement.
Cluster analysis offers other benefits: • It offers a new way of thinking about the economy and helps overcome the limitations of
traditional sectoral analysis. • It captures important linkages in terms of technology, skills, information, marketing and
customer needs, which are increasingly regarded as fundamental to competition and to the direction and pace of innovation.
• It provides ways to redefine the role of the private and public sector and that of other institutions and can provide a starting point for a constructive business-government dialogue.
References: 1. Freeman, C. (1995). The national system of innovation in historical perspective. Cambridge Journal of Economics, 19 (1), 5-24. 2. Lundvall, B-Å. (2007). National Innovation Systems: analytical concept and development tool. Industry & Innovation, 14(1), 95-119. 3. Nelson, R. (1993). National Systems of Innovation: A Comparative Study. Oxford University Press, Oxford. 4. OECD (2008). Competitive Regional Clusters.National Policy Approaches, OECD Publications. Paris. 5. Porter, M. (1990). The Competitive Advantage of Nations, MacMillan. London. 6. Porter, M., Stern, S. (2002). National Innovative Capacity, in World Economic Forum, The Global Competitiveness Report 2001-2002. Oxford University Press, New York. 7. Potts, J., Cunningham, S. (2008). Four Models of the Creative Industries. International Journal of Cultural Policy, 14(3), 233-247. 8. Roelandt, T. Den Hertog, P. (1999). Cluster Analysis and Cluster- Based Policy Making in OECD Countries: An Introduction to the Theme. Ch 1 in OECD (“Boosting Innovation: The Cluster Approach”. Paris: OECD, 9-23.

ISSN 2533‐4794 EVROPSKÝ ČASOPIS EKONOMIKY A MANAGEMENTU
20
Оксана Волкова, к. е. н. Одеський національний економічний університет, Україна
МОНІТОРИНГ БОРГОВИХ РИЗИКІВ УКРАЇНИ Oksana Volkova, PhD in Economics Odesa National Economic University, Ukraine
MONITORING OF DEBT RISKS OF UKRAINE
The article examines the concept of public debt and associated concept of debt sustainability of the state. The results of the study are the factors that increase risks of debt sustainability of Ukraine and set priorities for the debt policy of the state. Stated that only the complex of measures of monetary, fiscal and debt policy, consistency and coherence of state bodies responsible for implementation of the latter, transparency and stability of legislative regulation of the rules of doing business, simplification of it administration, reduction of the level of shadow economy are able to achieve macroeconomic stability and growth. As a result, this will change financial viability, reduce debt risks to the state and increase its debt sustainability. Key words: public debt, debt obligations, debt sustainability, debt security, risks of debt sustainability.
Постановка проблеми в загальному вигляді. Стрімке зростання державного боргу України впродовж останніх років, високі ризики його обслуговування актуалізують проблеми дослідження державного боргу та пов’язаного з ним поняття боргової стійкості держави.
Аналіз останніх досліджень і публікацій останніх років. Дослідження сутності державного боргу та його вплив на економічний розвиток держави започатковано класиками економіки А.Смітом, Дж. Рікардо та інш. Серед українських вчених проблемою державного боргу на сучасному етапі розвитку опікуються С.Л. Лондар, О.І. Олійник, О.В. Сергієнко, Т. Вахненко та інш.
Невирішені частини загальної проблеми. Сучасні тенденції розвитку світової економіки та її кризові стани обумовлюють необхідність не тільки дослідження природи державного боргу та його макроекономічних наслідків, а й проблематики забезпечення боргової стійкості держави, низький рівень якої веде до неплатоспроможності останньої.
Постановка завдань. Метою даної статті є визначення співвідношення понять «боргова безпека» та «боргова стійкість», дослідження боргових ризиків України, визначення пріоритетних завдань боргової політики України.
Виклад основного матеріалу. «Під борговою стійкістю, як правило, розуміють здатність держави виконати свої зобов’язання за державним боргом своєчасно, в повному обсязі, без істотного накопичення додаткового боргу, здійснення реструктуризації чи списання боргу, за одночасного забезпечення прийнятного рівня економічного зростання»1.
Боргову стійкість визначають і як «якісну характеристику обсягу та структури державної заборгованості, при якій забезпечується здатність держави виконувати боргові зобов’язання, не збільшуючи боргового навантаження на бюджет за умов підтримання на достатньому рівні ліквідності й платоспроможності та виключаючи необхідність вдаватися до списання чи реструктуризації державної заборгованості» 2.
1 Лондар, С.Л., Кузнєцов, К.В., Верещака, І.В. (2016). Вплив реструктуризації зовнішніх боргових зобов’язань перед приватними кредиторами на боргову стійкість України. Фінанси України, вип.1, 40. 2 Олійник, О.В., Сідельнікова, І.В. (2011). Боргова безпеки України: стан, проблеми, перспективи. Вісник Національної юридичної академії України імені Ярослава Мудрого, вип. 2 (5), 42.
EUROPEAN JOURNAL OF ECONOMICS AND MANAGEMENT • Volume 3 Issue 1 2017
21
Сергієнко О. В. визначає боргову стійкість як «здатність держави виконувати зобов’язання за державним боргом своєчасно і в повному обсязі без суттєвого накопичення заборгованості, застосування реструктуризації чи списання боргу одночасним підтриманням прийнятного рівня економічного зростання»1.
Отже, з наведених вище визначень боргової стійкості можна констатувати, що боргова стійкість тісно пов’язані з такими поняттями як “боргова безпека”, “платоспроможність”, суть яких полягає у здатності держави виконувати взяті на себе боргові зобов‘язання. Разом з тим, “боргова безпека” є ширшим поняттям, адже без забезпечення безпечного стану держави не може бути її стійкості. Щодо платоспроможності держави вона є зовнішнім проявом її боргової стійкості.
Мінекономрозвитку України боргову безпеку країни визначив як «відповідний рівень внутрішньої та зовнішньої заборгованості з урахуванням вартості її обслуговування й ефективності використання внутрішніх і зовнішніх запозичень та оптимального співвідношення між ними, достатній для задоволення нагальних соціально-економічних потреб, що не загрожує суверенітету держави та її фінансовій системі» 2.
Боргова стійкість держави є кількісної характеристикою її боргової безпеки, яка може змінюватися під впливом зовнішніх та внутрішніх факторів та визначає здатність держави виконувати зобов’язання за залученими коштами, тобто бути платоспроможною.
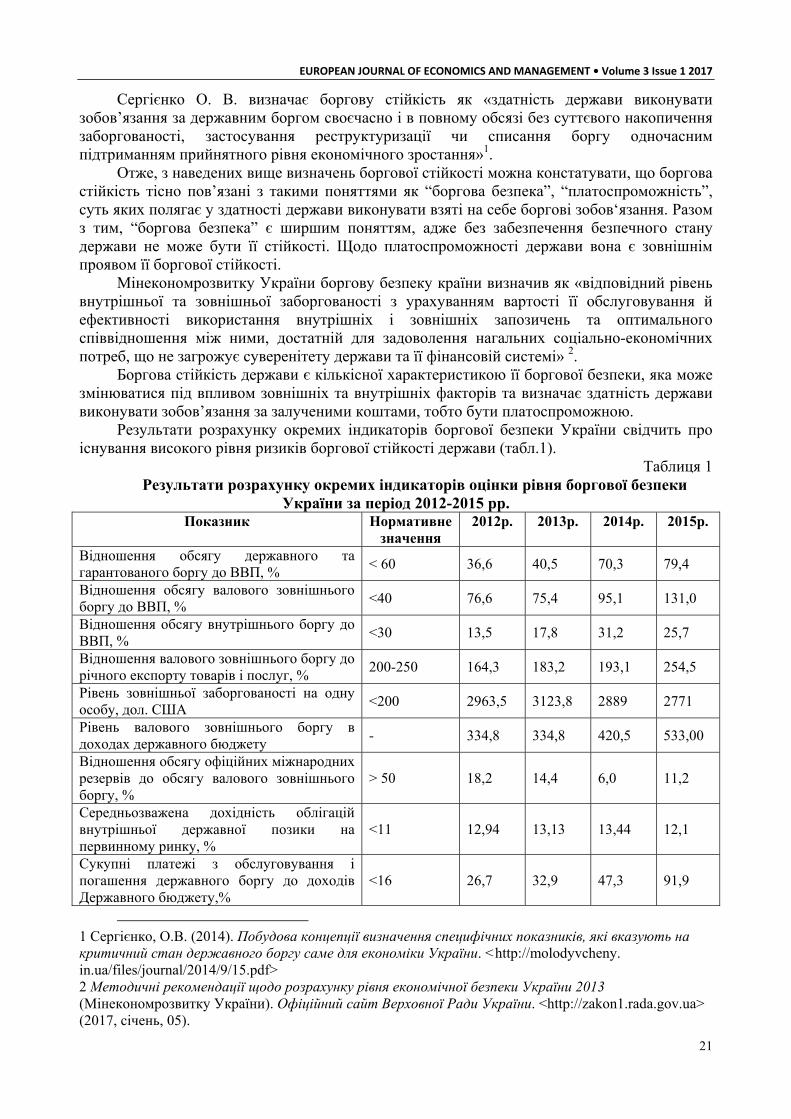
Результати розрахунку окремих індикаторів боргової безпеки України свідчить про існування високого рівня ризиків боргової стійкості держави (табл.1).
Таблиця 1 Результати розрахунку окремих індикаторів оцінки рівня боргової безпеки
України за період 2012-2015 рр. Показник Нормативне
значення 2012р. 2013р. 2014р. 2015р.
Відношення обсягу державного та гарантованого боргу до ВВП, %
< 60 36,6 40,5 70,3 79,4
Відношення обсягу валового зовнішнього боргу до ВВП, %
<40 76,6 75,4 95,1 131,0
Відношення обсягу внутрішнього боргу до ВВП, %
<30 13,5 17,8 31,2 25,7
Відношення валового зовнішнього боргу до річного експорту товарів і послуг, %
200-250 164,3 183,2 193,1 254,5
Рівень зовнішньої заборгованості на одну особу, дол. США
<200 2963,5 3123,8 2889 2771
Рівень валового зовнішнього боргу в доходах державного бюджету
- 334,8 334,8 420,5 533,00
Відношення обсягу офіційних міжнародних резервів до обсягу валового зовнішнього боргу, %
> 50
18,2 14,4 6,0 11,2
Середньозважена дохідність облігацій внутрішньої державної позики на первинному ринку, %
<11 12,94 13,13 13,44 12,1
Сукупні платежі з обслуговування і погашення державного боргу до доходів Державного бюджету,%
<16 26,7 32,9 47,3 91,9
1 Сергієнко, О.В. (2014). Побудова концепції визначення специфічних показників, які вказують на критичний стан державного боргу саме для економіки України. <http://molodyvcheny. in.ua/files/journal/2014/9/15.pdf> 2 Методичні рекомендації щодо розрахунку рівня економічної безпеки України 2013 (Мінекономрозвитку України). Офіційний сайт Верховної Ради України. <http://zakon1.rada.gov.ua> (2017, січень, 05).

ISSN 2533‐4794 EVROPSKÝ ČASOPIS EKONOMIKY A MANAGEMENTU
22
В економічній літературі до боргових ризиків відносять ризик структури боргового портфелю, валютні, процентні, операційні, ліквідності, інвестиційні, рефінансування, бюджетний ризик, ризик девальвації національної валюти, дефіцитності платіжного балансу1,2.
За останні п’ять років сукупний державний борг України зріс в три рази, що само по собі не може оцінюватись негативно (табл.2). Однак, причини зростання державного богу України свідчать про проблемний стан державних фінансів та національної економіки загалом. Зокрема, збільшення державного боргу обумовлено необхідністю покриття хронічного дефіциту державного бюджету, платіжного балансу України, фінансування квазіфіскальних інститутів, підтримки ліквідності банківського сектору.
Таблиця 2 Структура державного боргу України у період 2011–30.09.2016 рр.
Сукупний Державний борг
Державний внутрішній борг
Державний зовнішній борг
Гарантований державою борг
Роки
млрд.грн % млрд.грн % млрд.грн % млрд.грн %
2011 473,1 100 161,5 34,1 195,8 41,4 115,8 24,5
2012 515,7 100 190,5 36,9 208,9 40,5 116,3 22,6 2013 584,9 100 257,0 43,9 223,3 38,2 104,6 17,9
2014 1100,8 100 461,0 41,9 486,0 44,2 153,8 13,9 2015 1571,8 100 508,0 32,3 825,9 52,5 237,9 15,2
30.09.2016р. 1708,2 100 553,6 32,4 913,5 53,5 244,0 14,1
Зауважимо, що до позитивних зрушень щодо показників державного боргу у 2016 році
слід віднести уповільнення темпів його зростання порівняно з попередніми роками. Разом з тим, відмітимо, що за 3 кв. 2016р. державний борг України становить 97,7% від запланованого його розміру у 1501,5 млрд. грн відповідно до Закону України «Про Державний бюджет України на 2016 рік» 3.
Погодимось, що реальні показники боргового тягаря України спотворюються, з огляду на те, що у складі державного та гарантованого державою боргу України не відображається заборгованість держави перед суб’єктами господарювання з податку на додану вартість, заборгованість по зарплаті бюджетним працівникам, заборгованість за неповернутими кредитами, наданими під державні гарантії 4. Зокрема, зростання гарантованого державного боргу України в умовах економічного спаду обумовлює ризик його трансформації в прямий борг, що підтверджується станом розрахунків за кредитами, виданими під державні гарантії (табл.3).
1 Вахненко, Т. (2008). Державний борг України: оптимізація структури та управління ризиками. Світ фінансів, вип. 1, 9. 2 Кукіна, Н.В., Захарченко, О.Г. (2013). Державний борг як фактор ризику безпеки України: макроекономічний погляд. Збірник наукових праць Таврійського державного агротехнічного університету, 3, 117. 3 Закон Про Державний бюджету України на 2016 рік 2015 (Верховна Рада України) Офіційний сайт Верховної Ради України. <http://zakon1.rada.gov.ua> (2017, січень, 05). 4 Лондар, С.Л., Кузнєцов, К.В., Верещака, І.М. (2016). Вплив реструктуризації зовнішніх боргових зобов’язань перед приватними кредиторами на боргову стійкість України. Фінанси України, 1, 40.

EUROPEAN JOURNAL OF ECONOMICS AND MANAGEMENT • Volume 3 Issue 1 2017
23
Таблиця 3 Окремі показники гарантованого державою боргу та простроченої
заборгованості за кредитами, гарантованими державою у період 2012-30.09.2016рр. Показник 2012р. 2013р. 2014р. 2015р. 30.09.2016р./
30.09.2015р. Темпи росту гарантованого державою боргу,%
100,4 89,9 147,0 154,7 104,1
Темпи росту суми простроченої заборгованості,%
101,3 104,9 192,6 143,5 122,8
Питома вага заборгованості ліквідованих суб’єктів господарювання у загальній сумі простроченої заборгованості, %
11,4 11.4 12,3 12,5 12,6
Збільшення питомої ваги заборгованості ліквідованих суб’єктів господарювання
свідчить про неефективність роботи уповноважених державних органів щодо стягнення кредитної заборгованості та зумовлює необхідність посилення ефективності контрольних заходів щодо повернення кредитів під державні гарантії, зокрема вдосконалення системи оцінювання кредитоспроможності позичальника, встановлення персональної фінансової відповідальності посадових осіб держави за не своєчасне стягнення кредитної заборгованості.
Порівняльний аналіз темпів зростання ВВП, обсягів реалізованої промислової продукції та державного боргу України за останні п’ять років підтверджує непродуктивне використання державних запозичень (рис.1).
Рис.1. Темпи зростання ВВП, обсягів реалізованої промислової продукції та державного боргу України у період 2011-2015рр.,%
В Україні державне залучення коштів носить хвильовий та ситуативний характер, на
різних умовах для виконання поточних зобов’язань. Держава вдається до додаткових позик, які спрямовуються на погашення попередніх, що зумовлює формування боргової піраміди. Так, розмір витрат на погашення та обслуговування державного боргу, перевищили нові запозичення, а їх питома вага у загальних видатках Зведеного бюджету у 2015 році суттєво зросла (табл.4).

ISSN 2533‐4794 EVROPSKÝ ČASOPIS EKONOMIKY A MANAGEMENTU
24
Таблиця 4 Державні запозичення та погашення боргових зобов’язань, видатки на
погашення та обслуговування державного боргу Зведеного бюджету України у період 2011-30.09.2016рр.
Показник 2011р. 2012р. 2013р. 2014р. 2015р. 30.09 2016р./ 30.09
2015р. Державні запозичення, млрд..грн 83,8 115,4 160,9 325,0 514,2 170,3
Погашення, млрд..грн 47,5 70,7 80,5 124,0 429,9 85,1
Витрати на погашення та обслуговування боргу, млрд..грн
71,4 95,9 113,7 173,4 516,1 161,7
Питома вага видатків по обслуговуванню державного боргу у загальних видатках,%
17,1 19,5 22,5 33,1 75,8 23,5
Видатки на обслуговування боргу, млрд.грн
23,9 25,2 33,2 49,4 86,2 76,6
Питома вага видатків по обслуговуванню державного боргу у загальних видатках,%
6,1 5,5 7,1 10,0 12,7 13,8
Зростання витрат на погашення та обслуговування державного боргу більшими
темпами порівняно з державними запозиченнями ілюструють посилення бюджетного ризику боргової стійкості країни (рис.2).
Рис. 2. Темпи росту державних запозичень та витрат на погашення та обслуговування державного боргу у період 2011-30.09.2016рр. ,%
Загострення бюджетного ризику підтверджує й аналіз темпів зростання видатків на
обслуговування державного боргу, які зростають більшими темпами відносно загальних видатків та доходів Зведеного бюджету (рис.3). Для державних фінансів України існує реальна проблема в фінансуванні видатків на обслуговування боргових зобов’язань за рахунок власних надходжень державного бюджету.

EUROPEAN JOURNAL OF ECONOMICS AND MANAGEMENT • Volume 3 Issue 1 2017
25
Рис. 3. Темпи росту доходів, видатків Зведеного бюджету України у період 2011-30.09.2016рр.
У структурі державного боргового портфелю України переважає зовнішній державний
борг, що зумовлює відповідну структуру державного боргу України в розрізі валют погашення позик, у якій найбільш питома вага припадає на кредитні зобов’язання виражені в іноземній валюті (рис.4).
Рис. 4 Структура Державного боргу України в розрізі валют погашення станом
на 31.12.2015р.,% Збільшення боргових зобов’язань в іноземній валюті продукує валютні ризики та
чинить тиск на вартість національної валюти. Україна вже неодноразово відчула на собі вплив валютних ризиків на борговий стан держави. Зокрема, девальвація національної валюти у 2015 році 2400 грн за 100 дол. США проти 1576 грн за 100 дол. США обумовила зростання внутрішнього державного боргу та витрат на обслуговування боргу.
Відмітимо, що у 2010 році Міністерством фінансів України було оприлюднено прогнозні платежі погашення державного боргу, з якого вбачається що 2013р, 2015 р. мали бути піковими років за борговими виплатами (рис.5).
Разом з тим, саме у 2015 році уряд вдався до заходів щодо реструктуризацію зовнішнього боргу. Отже, Україна підтвердила справедливість того, що ризик

ISSN 2533‐4794 EVROPSKÝ ČASOPIS EKONOMIKY A MANAGEMENTU
26
рефінансування отримав назву «кризою настання строку погашення боргу»1, оскільки, як правило, до рефінансування держава звертається наприкінці настання строків погашення боргових зобов’язань.
Рис.5. Прогноз Міністерства фінансів України 2010року щодо погашення
державного боргу у період 2010-2020рр. Аналіз структури державного боргу за видами відсоткових ставок свідчить про
переважання фіксованих процентних ставок та збільшення питомої ваги заборгованості за ставками LIBOR (табл.5).
Таблиця 5 Структура державного боргу України за видами відсоткових ставок у період
2011-31.08.2016рр. Показник 2011р. 2012р. 2013р. 2014р. 2015р. 31.08.2016р.
Ставка LIBOR,% 8,7 7,9 9,5 11,49 13,47 13,44 Ставка МВФ,% 27,38 15,9 9,87 10,90 19,07 18,87 Фіксована ставка,% 63,49 76,1 80,46 77,61 67,46 67,70
Відзначимо, що на протязі останнього десятиріччя ставки LIBOR знижувалися. Однак,
за прогнозними розрахунками експертів ставка LIBOR буде зростати. Зокрема, у січні 2016р. вона становила 1, 139% проти 0,56% у січні 2014 та 0,62% у січні 2015р. Вказані тенденції свідчать про існування високої ймовірності посилення процентних ризиків.
Загальновідомо, що запозичення за фіксованими ставками мінімізують процентні ризики. Проте, низька дохідність державних цінних паперів для України, на фоні низької ємності та нерозвиненістю фінансового ринку, не стимулює попит на державні цінні папери. Середньозважена дохідність облігацій внутрішньої державної позики коливається в межах 12-25% (для порівняння: інфляція у 2015 році становила 43,3%) 2. Отже, для вітчизняних державних боргових цінних паперів характерним є високий інфляційний ризик, який зменшує реальний інвестиційний дохід. Ще однією з причин, яка негативно позначається на інвестиційній діяльності ринку державних облігацій, є значний ризик девальвації гривні, що змушує інвесторів вкладати кошти в іноземні валюти.
Для комерційних банків України наявність в активах державних цінних паперів обумовлюється не їх дохідністю, а можливістю отримання рефінансування НБУ. Загалом, у 2015 році комерційні банки володіли 6,5% облігацій внутрішньої державної позики, а основним їх покупцем виступив Національний банк України задля фінансування дефіциту державного бюджету, а також фінансування потреб квазіфіскальних установ: НАК
1 Основні питання управління державним боргом: проект розвитку фінансового сектору (2010). FINREP. <http://www.finrep.kiev.ua/download/lmote_debtmanagement_june2010_ua.pdf> (2017, січень, 05). 2 Грошово-кредитна та фінансова статистика. <http://www.bank.gov.ua/control/uk/index> (2017, січень, 05).

EUROPEAN JOURNAL OF ECONOMICS AND MANAGEMENT • Volume 3 Issue 1 2017
27
«Нафтогаз України», АТ «Укргазбанк», Фонду гарантування вкладів фізичних осіб. Така монетарна політика держави сприяла девальвації національної валюти.
Щодо структури боргового портфелю за строками, то загальновизнаним є пріоритетність довгострокових зобов’язань, що зумовлюється не тільки більш низькою ціною позикових коштів, а й можливістю управління інфляційними очікування кредиторів, які не мають можливості реально прорахувати величину інфляції в довгостроковій перспективі. За таких умов, держава має можливість скорочувати державний борг за рахунок інфляції 1. Разом з тим, погодимось, що для національного фінансового ринку, в умовах низької інвестиційної активності, вбачається за доцільним випуск коротко- та середньо- строкових цінних паперів з фіксованою ставкою, індексованою на рівень інфляції, що може підвищити їх привабливість для інвесторів 2.
У борговій політиці держави мають бути перенесені акценти з зовнішнього ринку на внутрішній ринок боргових зобов’язань, що не тільки знизить валютний ризик, а й стимулюватиме розвиток національного ринку цінних паперів.
Про значний рівень ризику платіжного балансу України свідчить індикатор «Відношення валового зовнішнього боргу до річного експорту товарів і послуг», який за результатами 2015 р. досяг 254,5% (табл.1). Отже, Україна не спроможна покрити заборгованість валютними надходженнями від експорту товарів та послуг.
У світовій практиці важливим показником стійкості національної економіки до впливу зовнішніх факторів є «Відношення сальдо поточного рахунку платіжного балансу держави до ВВП», який не може перевищувати 4% ВВП 3. В Україні цей показник в останні 2 роки знаходиться на безпечному рівні (табл.6). Однак, покриття дефіциту поточного рахунку платіжного балансу забезпечується за рахунок нових зовнішніх запозичень та використанням урядом міжнародних валютних резервів, що, у свою чергу, виступає додатковим чинником девальвації національної валюти.
Таблиця 6 Показники платіжного балансу України у період 2011-2015рр. Показник 2011р. 2012р. 2013р. 2014р. 2015р.
Поточний рахунок, млн.дол США -10233 -14335 -16558 -4596 -189 Фінансовий рахунок, млн.дол США -7677 10120 -18601 9111 -582
Відношення сальдо поточного рахунку платіжного балансу держави до ВВП,%
6,3 8,2 9,0 3,5 0,2
Висновки та перспективи подальших досліджень. За результатами проведеного дослідження зазначимо, що для України зберігаються актуальними чинники, які збільшують ризики боргової стійкості державі: непродуктивне використання запозичень, дефіцитність платіжного балансу; залежність державного сектору від зовнішніх кредитних ресурсів, погіршення стану розрахунків за кредитами, виданими під гарантії держави, тиск на вартість національної валюти, внаслідок збільшення зовнішнього боргу.
Високий рівень ризиків боргової стійкості України свідчить про надзвичайну актуальність питання підвищення ефективності системи управління державним боргом країни. З урахуванням проведеного аналізу ризиків боргової стійкості України, серед пріоритетних завдань боргової політики держави визначимо наступні:
1 Бенч, Л.Я., Бец, О.І. (2015). Державний борг у контексті монетарної складової макрофінансової стабілізації: концептуальні засади та прагматичні аспекти. Фінанси, облік і аудит, 2, 24. 2 Богдан, Т.П. (2013). Боргова політика держави в умовах глобальної нестабільності. Економіка України, 2, 11. 3 Report from the Commission to the European Parlament, the Council, the European Central Bank, the European Economic and Social Committee, the Committee of the Regions and the European Investment Bank on the Alert Mechanism Report 2013. <http:/ec.europa.eu/europe2020/pdf/amreport2013_pdf> (2017, січень, 05).

ISSN 2533‐4794 EVROPSKÝ ČASOPIS EKONOMIKY A MANAGEMENTU
28
‐ використання запозичень в інвестиційних проектах з посилення контролю за результативністю їх використання;
‐ припинення практики боргового фінансування НАК «НАфтогаз Україна», дефіциту Пенсійного фонду;
‐ заміщення зовнішніх кредитів внутрішніми, номінованими в національній валюті; ‐ стимулювання розвитку внутрішнього ринку державних цінних паперів, розміщення
НБУ державних цінних паперів виключно на ринкових умовах, запровадження облігацій з фіксованою ставкою індексованою на рівень інфляції;
‐ посилення ефективності контрольних заходів щодо повернення кредитів під державні гарантії із встановленням фінансової відповідальності посадових осіб державних органів, уповноважених на здійснення заходів щодо стягнення кредиторської заборгованості.
Підкреслимо, що запровадження виключно вказаних заходів не забезпечить зниження боргового навантаження держави та зміцнення її боргової стійкості. Лише комплекс заходів монетарної, фіскальної та боргової політики держави, узгодженість та координованість державних органів, відповідальних за реалізацію останніх, прозорість та стабільність законодавчого регламентування правил ведення бізнесу, спрощення умов його адміністрування, зниження рівня тінізації господарювання здатні забезпечити макроекономічну стабільність та зростання, наслідком яких буде змінення фінансової спроможності та зниження боргових ризиків держави і, як наслідок, зростання боргової стійкості останньої.
References: 1. Bench, L.Ya., Becz, O.I. (2015). Derzhavnyj borg u konteksti monetarnoyi skladovoyi makrofinansovoyi stabilizaciyi: konceptual`ni zasady ta pragmatychni aspekty [Public debt in the context of the monetary component of the macro stabilization: conceptual foundations and pragmatic aspects]. Finansy, oblik i audyt [Finance, accounting and auditing ], no. 2, 23-35. [in Ukrainian]. 2. Bogdan, T.P. (2013). Borgova polityka derzhavy v umovax globalnoyi nestabilnosti [Debt policy of the state in conditions of global instability]. Ekonomika Ukrayiny [Economics of Ukraine], no.2, 4–17. [in Ukrainian]. 3. Vaxnenko, T. (2008). Derzhavnyj borg Ukrayiny: optymizaciya struktury ta upravlinnya ryzykamy. [The state debt of Ukraine: structure optimization and risk management]. Svit finansiv [The world of Finance], no. 1, 9-28. [in Ukrainian]. 4. Groshovo-kredytna ta finansova statystyka [Monetary and financial statistics]. <http://www.bank.gov.ua/control/uk/index> [in Ukrainian]. 5. Zakon pro Derzhavnyj byudzhet Ukrayiny na 2016 rik 2015 [The law of Ukraine "On State budget of Ukraine for 2016"]. <http://www.rada.gov.ua/> [in Ukrainian]. 6. Kukina, N.V., Zaxarchenko, O.G. (2013). Derzhavnyj borg yak faktor ryzyku bezpeky Ukrayiny: makroekonomichnyj poglyad [State debt as a risk factor of security of Ukraine: macroeconomic view]. Tavrijskyj derzhavnyj agrotexnichnyj universytet: Zbirnyk naukovyx pracz [Tavria state agrotechnical University:Collected papers], no. 3, 116-121. [in Ukrainian]. 7. Londar, S.L., Kuznietsov, K.V., Vereschaka, I.M. (2016). Vplyv restrukturyzaciyi zovnishnix borgovyx zobovyazan pered pryvatnymy kredytoramy na borgovu stijkist Ukrayiny [The impact of restructuring of external debt owed to private creditors on debt sustainability of Ukraine]. Finansy Ukrayiny [Finance Of Ukraine], no. 1, 39-56. [in Ukrainian]. 8. Ministry of Economic Development and Trade of Ukraine (2013). On approval of guidelines for the calculation of economic security of Ukraine. <http://zakon.rada.gov.ua> [in Ukrainian]. 9. Oliinik, О.B., Sidelnikova, I.V. (2011). Borgova bezpeky Ukrayiny: stan, problemy, perspektyvy [A debt security of Ukraine: state, problems, prospects]. Bulletin of the National law Academy of Ukraine named after Yaroslav Mudryi [Visnyk Natsional'noi iurydychnoi akademii Ukrainy imeni Yaroslava Mudroho], no. 2 (5), 41–48. [in Ukrainian]. 10. Osnovni pytannya upravlinnya derzhavnym borgom: proekt rozvytku finansovogo sektoru FINREP [The main issues in public debt management: project for development of financial sector FINREP] (2010). <http://www.finrep.kiev.ua/download/lmote_debtmanagement_june2010_ua.pdf> [in Ukrainian].

EUROPEAN JOURNAL OF ECONOMICS AND MANAGEMENT • Volume 3 Issue 1 2017
29
11. Sergienko, A.V. (2014). Pobudova koncepciyi vyznachennya specyfichnyx pokaznykiv, yaki vkazuyut na krytychnyj stan derzhavnogo borgu same dlya ekonomiky Ukrayiny [Construction concept definition of specific indicators that point to critical state of public debt to the economy of Ukraine]. <http://molodyvcheny. in.ua/files/journal/2014/9/15.pdf> [in Ukrainian]. 12. Report from the Commission to the European Parlament, the Council, the European Central Bank, the European Economic and Social Committee, the Committee of the Regions and the European Investment Bank on the Alert Mechanism Report (2013). <http:/ec.europa.eu/europe2020/pdf/amreport2013_pdf> [in English].
ISSN 2533‐4794 EVROPSKÝ ČASOPIS EKONOMIKY A MANAGEMENTU
30
Alina Snetkova Taras Shevchenko National University of Kyiv, Ukraine
FOREIGN DIRECT INVESTMENT IN UKRAINE: PROBLEMS AND SOLUTIONS
The paper considers the main problems and prospects of foreign investment in Ukraine, analyzes statistical data reflecting the dynamics of foreign investment. International investment activity has a special place in the system of modern business, due to changes in global economic processes. International investment activity is set of subjects for investment abroad and attracts foreign investment into the country. Problems of foreign investment related to current issues in the global economy require practical solutions. This is due to current trends of globalization and internationalization of economic relations in modern economies. Currently, international trade and foreign direct investments serve an important function in the economic development of states. The volume of foreign investments is one of the indicators of the degree of country integration into the world community and depends on the attractiveness the investment object. Foreign investment and conditions of their involvement are factors that affect investment activity and further development of foreign economic relations. Key words: non‐current assets, tangible fixed assets, long‐term investments, investment property, foreign direct investments, investment climate.
Problem statement. The development of modern Economics is hard to imagine without effective investment. Attracting investment, including foreign, provides the scientific and technological progress, economic growth, create additional employment and preservation of existing places business activity etc. At the same time, the analysis of statistical data shows that the investment attractiveness of Ukraine quite low. To increase the investment attractiveness of the national economy is necessary to create a favorable investment climate.
Analysis of recent research and publications. The problem of Investing activities and their impact on socio-economic development of a state are considered in scientific papers of foreign and domestic economic scholars, namely Lawrence J. Gitman1, William F. Sharpe2, A. A.Peresada3, Borsch L.M.4 Despite the long and comprehensive coverage of investment activity in existing literature, this subject still remains relevant.
The aim of the article. The purpose of the article is to determine the place and role of foreign investment in the development of the national economy; identify barriers that hinder the inflow of foreign capital in Ukraine; defining the main directions of improving the investment climate in Ukraine.
Key study findings. The development of the economy directly related to its investment attractiveness. For increase the investment attractiveness Ukraine is an important strategic objective and the basis to address socio-economic problems facing Ukrainian society.
In accordance with the Law of Ukraine "Foreign investments regime"5, foreign investment activity seen as consistent, purposeful activity that is the capitalization of property, in the formation and use of investment resources, regulation of investment processes and international movement of investment and capital goods, creating appropriate investment climate and a for-
1 Gitman, Lawrence J., Joehnk, Michael D., Scott, B. (2010). Fundamentals of Investing (11th Edition). 2 Sharpe, William F., Gordon, Alexander J., Bailey, Jeffrey (2000). Fundamentals of Investments. Prentice-Hall. 3 Пересада, А.А. (2002). Управління інвестиційним процесом. Київ: Фінанси і статистика. 4 Борщ, Л.М. (2005). Інвестування: теорія і практика. Київ: Знання. 5 Закон про режим іноземного інвестування 1996 (Верховна Рада України). Київ: Парлам. вид-во, 19, ст. 80.
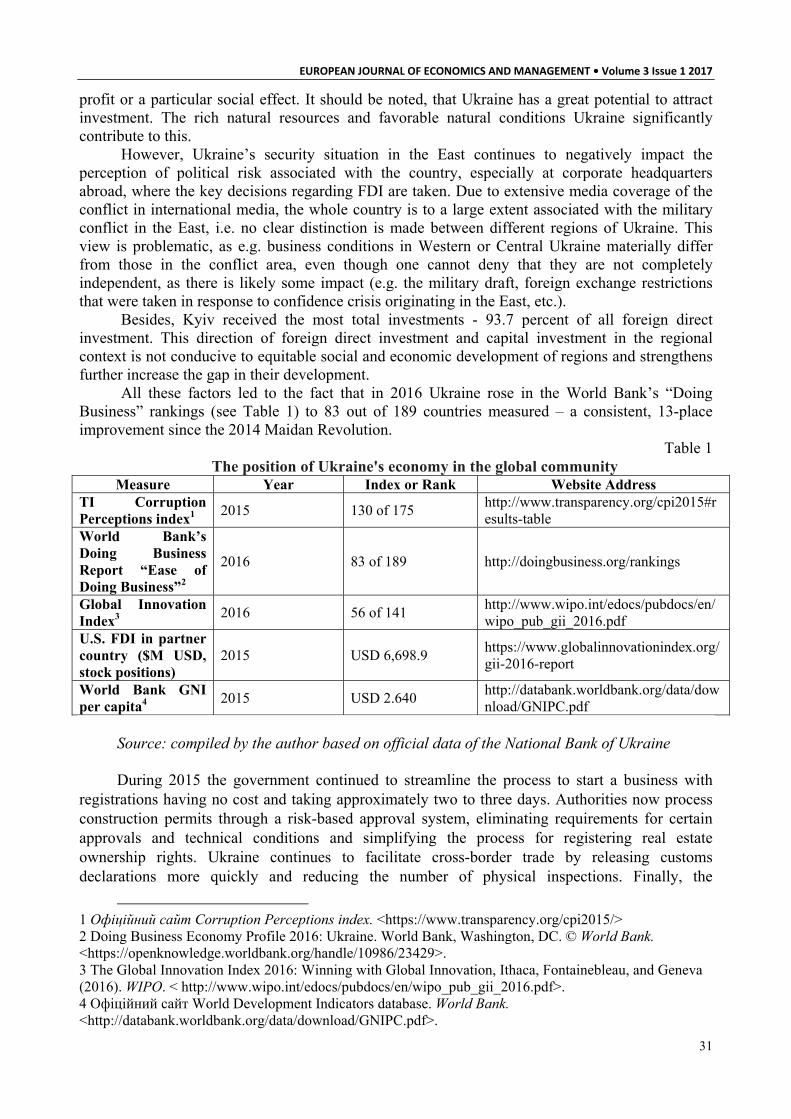
EUROPEAN JOURNAL OF ECONOMICS AND MANAGEMENT • Volume 3 Issue 1 2017
31
profit or a particular social effect. It should be noted, that Ukraine has a great potential to attract investment. The rich natural resources and favorable natural conditions Ukraine significantly contribute to this.
However, Ukraine’s security situation in the East continues to negatively impact the perception of political risk associated with the country, especially at corporate headquarters abroad, where the key decisions regarding FDI are taken. Due to extensive media coverage of the conflict in international media, the whole country is to a large extent associated with the military conflict in the East, i.e. no clear distinction is made between different regions of Ukraine. This view is problematic, as e.g. business conditions in Western or Central Ukraine materially differ from those in the conflict area, even though one cannot deny that they are not completely independent, as there is likely some impact (e.g. the military draft, foreign exchange restrictions that were taken in response to confidence crisis originating in the East, etc.).
Besides, Kyiv received the most total investments - 93.7 percent of all foreign direct investment. This direction of foreign direct investment and capital investment in the regional context is not conducive to equitable social and economic development of regions and strengthens further increase the gap in their development.
All these factors led to the fact that in 2016 Ukraine rose in the World Bank’s “Doing Business” rankings (see Table 1) to 83 out of 189 countries measured – a consistent, 13-place improvement since the 2014 Maidan Revolution.
Table 1 The position of Ukraine's economy in the global community
Measure Year Index or Rank Website Address TI Corruption Perceptions index1
2015 130 of 175 http://www.transparency.org/cpi2015#results-table
World Bank’s Doing Business Report “Ease of Doing Business”2
2016 83 of 189 http://doingbusiness.org/rankings
Global Innovation Index3
2016 56 of 141 http://www.wipo.int/edocs/pubdocs/en/wipo_pub_gii_2016.pdf
U.S. FDI in partner country ($M USD, stock positions)
2015 USD 6,698.9 https://www.globalinnovationindex.org/gii-2016-report
World Bank GNI per capita4
2015 USD 2.640 http://databank.worldbank.org/data/download/GNIPC.pdf
Source: compiled by the author based on official data of the National Bank of Ukraine During 2015 the government continued to streamline the process to start a business with
registrations having no cost and taking approximately two to three days. Authorities now process construction permits through a risk-based approval system, eliminating requirements for certain approvals and technical conditions and simplifying the process for registering real estate ownership rights. Ukraine continues to facilitate cross-border trade by releasing customs declarations more quickly and reducing the number of physical inspections. Finally, the
1 Офіційний сайт Corruption Perceptions index. <https://www.transparency.org/cpi2015/> 2 Doing Business Economy Profile 2016: Ukraine. World Bank, Washington, DC. © World Bank. <https://openknowledge.worldbank.org/handle/10986/23429>. 3 The Global Innovation Index 2016: Winning with Global Innovation, Ithaca, Fontainebleau, and Geneva (2016). WIPO. < http://www.wipo.int/edocs/pubdocs/en/wipo_pub_gii_2016.pdf>. 4 Офіційний сайт World Development Indicators database. World Bank. <http://databank.worldbank.org/data/download/GNIPC.pdf>.

ISSN 2533‐4794 EVROPSKÝ ČASOPIS EKONOMIKY A MANAGEMENTU
32
government introduced an electronic system for filing and paying labor taxes. In addition to the efforts of central authorities, officials at local levels continue looking to attract investment and jobs to their regions.
Ukrainian legislation provides for national treatment of foreign investors, in line with its World Trade Organization (WTO) commitments. Due in part to conflicts in the body of laws that govern investment and commercial activity in Ukraine, and persistent issues with corruption, foreign investors have found it difficult to pursue cases in Ukrainian courts and often seek arbitration outside of the country - judicial reform is still clearly needed.
Over the past three years, Ukraine's economy has experienced rapid capital flight to offshore zones, almost 70 billion USD annually. However, about 94% (see Table 2) of the Ukrainian capital were taken to Cyprus.
Table 2 Direct investment (equity) of Ukraine in the economy of countries in the world, million.
USA Direct investment on 1.10.2016 In% of total
In all 6236,9 100,0 including Cyprus 5824,8 93,4 Russian Federation 139,2 2,2 Latvia 70,8 1,1 Vyrhynskye Islands (British). 52,0 0,8 Poland 50,2 0,8 Other countries 99,9 1,7
Source: compiled by the author based on official data of the State Statistics Committee of
Ukraine1 Almost 85% of the total direct investment from Ukraine to Cyprus was formed as a result of
some Ukrainian companies to restructure their operations by transferring the assets of the parent company shares in other Ukrainian companies to their foreign affiliates.
Thus, investment of Cyprus and the Virgin Islands can consider funds, that were withdrawn from the budget that were not taxed and are earned on cheap labor.
Cyprus has traditionally been the largest source of FDI in Ukraine (Figure 1). As of January 2014, the share of Cyprus-registered investors in the FDI stock was 32.7%, while currently it equals 24.4%. Three tax havens, Cyprus, British Virgin Islands, and Belize, together account for 29.6% of FDI stock (38.8% at the beginning of 2014).
Investments from Cyprus and other tax havens are usually of Ukrainian or Russian origin. Investors use special purpose entities (SPEs) in those countries in order to pay less tax and to acquire a special legal status etc. For instance, according to a study cited by the OECD Investment Policy Review2, real Russian investment in Ukraine was at least thrice as large as the official data suggested at the end of 2014 (about $9.9 billion compared to $2.7 billion).
At first glance, such developed countries as Germany and the Netherlands also seem to invest quite a lot in Ukraine. Yet German FDI mostly comes from Indian ArcelorMittal, the largest foreign investor in Ukraine, which uses its Germany subsidiary to control a steel plant in Ukraine. Another large investor, Commerzbank, left the Ukrainian banking sector in 2016.
1 Офіційний сайт Державного комітету статистики України. <http://www.ukrstat.gov.ua/operativ/operativ2016/zd/izu/izu_u/izu0316.html> 2 OECD Investment Policy Reviews OECD Investment Policy Reviews: Ukraine 2016. OECD. <http://www.oecd.org/investment/oecd-investment-policy-reviews-ukraine-2016-9789264257368-en.htm>.

EUROPEAN JOURNAL OF ECONOMICS AND MANAGEMENT • Volume 3 Issue 1 2017
33
Fig. 1. FDI stock in Ukraine by countries, $ million
Source: compiled by the author based on official data from the National Bank of Ukraine1 and the State Treasury Service of Ukraine
Similarly to Cyprus, the Netherlands is a popular conduit for capital from all over the world and ranks only formally among the largest global sources of FDI. For instance, part of $1.8 billion of its FDI stock in the telecommunications sector in Ukraine comes from Dutch-registered VimpelCom, which owns Kyivstar, the largest Ukrainian cell-phone operator. Yet the largest owner of VimpelCom (through intermediaries) is Russian Alfa-Group. Genuine FDI from the Netherlands is actually not that large and is represented, e.g., by Unilever (Fig.2.).
Fig.2. Foreign direct investment (equity) of the world economy in Ukraine in 2016, million. USA
Source: compiled by the author based on official data from the National Bank of Ukraine1 and the State Treasury Service of Ukraine

ISSN 2533‐4794 EVROPSKÝ ČASOPIS EKONOMIKY A MANAGEMENTU
34
The origin of FDI in Ukraine becomes even more evident when we look at the sources of the growth of FDI stock in the years immediately before the crisis.
The growth of investment from the Netherlands and Switzerland mostly reflects the reinvestment of Ukrainian and Russian capital. For instance, in February 2016, a Dutch-registered subsidiary of Rinat Akmetov’s DTEK increased its share in the largest private gas producer in Ukraine, “Naftogazvydobuvannia”, to 55%. At least one of the co-owners of Risoil, a Swiss-registered company that invested $70 million in the construction of a grain elevator in Chornomorsk (former Illichivsk) seaport in 2014-2016, is reportedly a businessman from Ukraine.
Yet the fighting in the East has not scared off some (genuinely) foreign investors. For instance, French Biocodex has invested in the relatively stable pharmaceutical industry. US-based Cargill and Chinese Cofco invest in agricultural logistics. France’s Nexans and Japan’s Fujikura have built production facilities in Lviv region, finally seizing on such advantages of Ukraine as its educated and cheap workforce, as well as the proximity to the EU market. The success of these investments could become a signal for other potential investors.
Indeed, investors pay attention to a plethora of factors, both of economic and political nature. According to the MIGA survey, the concerns of investors in conflict-afflicted countries are more focused on unexpected and arbitrary changes in government policies in relation to their investments than on security issues. 62% of respondents named “regulatory changes” as their top political risk concern, while only 15% and 4% responded that war and terrorism were the main threats to their investments. In developing countries, more investors have experienced losses after the government intervention than because of a military conflict — through regulatory changes, breach of contract, restrictions on transfer and convertibility of profits and incomes, or non-honoring of sovereign guarantees.
Fig.3. Major obstacles to foreign investment in Ukraine
Source: compiled by the author based on official data from the FBA Dragon Capital1
According to a survey by Ukraine-based Dragon Capital, potential investors are less preoccupied with the military conflict with Russia than with widespread corruption and lack of trust in the judiciary. Unpredictable currency and unstable financial system, as well as restrictive capital controls, are only slightly less important than the security issues. The survey might
1 Офіційний сайт Dragon Capital. <http://www.dragon-capital.com/en/about/media/press_releases/corruption_and_lack_of_trust_in_the_judiciary_in_ukraine_are_the_largest_obstacles_for_foreign_investors.html>.

EUROPEAN JOURNAL OF ECONOMICS AND MANAGEMENT • Volume 3 Issue 1 2017
35
underestimate the influence of the military conflict, as the respondents are already interested in investing in Ukraine despite the hostilities in the East. Yet the survey reminds that the military conflict is only one of many factors affecting foreign investment in Ukraine.
Among the most positive actions that the government of Ukraine has to take to attract foreign investment, businesspeople mentioned relaunching the judiciary by vetting existing members and hiring new judges (average score – 7.6 points out of 10 possible), and the prosecution of large numbers of high-level officials and judges for corruption (7.4 points). At the same time, the third most highly ranked government action is ensuring the IMF program remains on track and liberalization of foreign exchange controls (including canceling the dividend repatriation ban) – both received a score of 6.2 points.
Implementation of the IMF programs was ranked as less important for investors with no prior experience of business in Ukraine (8th place, 4.6 points) than streamlining tax administration, which they ranked in 3rd place with 6.4 points. At the same time in general investors worried less about tax rates than about tax administration – with the rates per se occupying last place among the listed obstacles (offering tax breaks is less of an issue than simplification of administration). Lifting the moratorium on land sales is not as important for investors as other possible reforms. However, investors who are actively looking for new business opportunities in Ukraine, evaluate its importance as above average. Cancelation of the moratorium on agricultural land sales is even more important than overhauling infrastructure and establishing an investment promotion office as a one-stop shop for foreign investors.
Fig.4. Possible reforms and steps Source: compiled by the author based on official data from the FBA Dragon Capital1
Conclusions and prospects for future research. The result of the study, found that in Ukraine established certain conditions for effectively attracting foreign investment, but there are still a number of problems that must be addressed by applying modern organizational and economic mechanism of foreign direct investment into the country.
Foreign investors believe that the biggest obstacles for investment in Ukraine are widespread corruption (average score – 8.5 points out of 10 possible) and lack of trust in the judiciary (7.5 points). The military conflict with Russia (6.1 points), as well as unstable currency and financial
1 Офіційний сайт Dragon Capital. <http://www.dragon-capital.com/en/about/profile.html>.

ISSN 2533‐4794 EVROPSKÝ ČASOPIS EKONOMIKY A MANAGEMENTU
36
system (6 points) were the next most highly ranked obstacles. Despite the negative factors, Ukraine remains a potentially interesting country for
investment and businesses plan to continue their activity. To improve the investment climate, run a number of priority actions, namely: improvement of the regulatory and legal framework to attract long-term foreign
investment; simplification of the registration process for foreign investments; improvement of information support of foreign investors about potential investment
opportunities; channeling public investment resources to the certain priority areas of the economy only; reducing the level of taxation for enterprises with foreign investment when a certain
volume of investment is exceeded; stimulating the development of the stock market, credit, investment funds and other
financial institutions, which should ensure the corporate (general) financing of investment projects by domestic and foreign investors;
arranging the list of measures to strengthen the responsibility of representatives of executive and local bodies for corruption and other discriminatory practices used with investors;
introducing the practice of concluding transparent agreements between investors and authorities on mutual obligations in the sphere of competitive business behavior and competitive business policy of the state in certain medium-and long-term markets;
formation of favorable investment image through organizing and participating in international exhibitions, fairs, investment projects, publications in international printed matters;
preparing an action plan to ensure a favorable investment climate within the proclaimed priorities of socio-economic development, attracting a large number of experts, scientists, public authorities and representatives of business to its development and discussion;
development of regional plans to improve the investment attractiveness of regions, taking into account the peculiarities of their current ratings of investment attractiveness, provision of state monitoring of their implementation as a criterion for success of the activities of local administrations;
development of mechanisms for providing public services to improve the qualification and certification of specialists in the field of investment.
References: 1. Zakon pro rezhym inozemnoho investuvannya 1996 [The law on foreign investment] (Verkhovna Rada Ukrayiny). Kyiv: Parlam. vyd-vo, 19, st. 80. [in Ukrainian]. 2. Gitman, Lawrence J., Joehnk, Michael D., Scot,t B. (2010). Fundamentals of Investing (11th Edition). [in English]. 3. Sharpe, William F., Gordon, Alexander J., Bailey, Jeffrey (2000). Fundamentals of Investments. Prentice-Hall. [in English]. 4. The Global Innovation Index 2016: Winning with Global Innovation, Ithaca, Fontainebleau, and Geneva (2016). WIPO. <http://www.wipo.int/edocs/pubdocs/en/wipo_pub_gii_2016.pdf>. [in English]. 5. Peresada, A.A. (2002). Upravlinnya investytsiynym protsesom [Management of the investment process]. Kyiv: Finansy i statystyka. [in Ukrainian]. 6. Borshch, L.M. (2005). Investuvannya: teoriya i praktyka [Investment: Theory and Practice]. Kyiv: Znannya. [in Ukrainian]. 7. OECD Investment Policy Reviews OECD Investment Policy Reviews: Ukraine 2016. OECD. <http://www.oecd.org/countries/ukraine/oecd-investment-policy-reviews-ukraine-2016-9789264257368-en.htm>. [in English]. 8. Official site Corruption Perceptions index. <https://www.transparency.org/cpi2015/>. [in English]. 9. Doing Business Economy Profile 2016: Ukraine. World Bank, Washington, DC. World Bank. <https://openknowledge.worldbank.org/handle/10986/23429>. [in English].

EUROPEAN JOURNAL OF ECONOMICS AND MANAGEMENT • Volume 3 Issue 1 2017
37
10. Official site World Development Indicators database. World Bank. <http://databank.worldbank. org/data/download/GNIPC.pdf> [in English]. 11. The official website of the State Statistics Committee of Ukraine. <http://www.ukrstat.gov.ua/ operativ/operativ2016/zd/izu/izu_u/izu0316.html>. 12. Official site Dragon Capital. <http://www.dragon-capital.com/en/about/media/press_releases/ corruption_and_lack_of_trust_in_the_judiciary_in_ukraine_are_the_largest_obstacles_for_foreign_investors.html>. [in English].

ISSN 2533‐4794 EVROPSKÝ ČASOPIS EKONOMIKY A MANAGEMENTU
38
Sergii Sheludko Odesa National Economic University, Ukraine
KEY ASPECTS OF FOREIGN EXCHANGE REGULATION IN TERMS OF EUROPEAN INTEGRATION OF UKRAINE
The article concerns macroeconomic analysis of the key aspects of foreign exchange regulation in terms of European integration of Ukraine. It was considered the whole complex of instruments of the National Bank of Ukraine for influence on the foreign exchange relations in the state. It was estimated and analyzed the negative impact of an unbalanced policy toward NBU's rate of required reserves. It was showed that the authorized banks in Ukraine actively used mistakes, that the central bank made in the implementation of monetary and foreign exchange regulation, to increase profitability of their activities. It was analyzed credit operations of Ukrainian banks, and was showed their negative impact on the economy of the state. It was proved and justified, that in Ukraine there is a credit boom in foreign currency, which arose and developed due to the short‐sighted decisions of NBU in the foreign exchange regulation. Key words: credit boom, credit expansion, foreign currency, foreign exchange regulation, monetary policy, National Bank of Ukraine.
Under conditions of deepening crisis in the economy of Ukraine, main manifestations of which is the rapid devaluation of the national currency, chaotic fluctuations in the currency market, accelerating inflation and the panic at all levels of domestic economy, extraordinary relevance have the studies in foreign exchange regulation, which must not only effective, but – most importantly – adequate under its objectives. Equally significant nowadays is the reforms of the system of this regulation, upgrading its instruments and methods, due to outdated and even obvious inadequacy of current management mechanisms of currency relations in Ukraine. Some progress in this area can occur of European Integration's processes in the state, where the National Bank of Ukraine (hereinafter – NBU) has an access to the information and practical support from the central banks of the EU-member states.
The aim of this article is to identify and characterize the main areas of the modern foreign exchange regulation's modernization process in terms of European integration of Ukraine.
The studying of theoretical basis and practical aspects of mechanism, instruments and methods of foreign exchange regulation is devoted works of Ukrainian and foreign economists, including O. Bereslavskaya, N. Bodrova, O. Dzyublyuk, F. Zhuravka, H. Canales-Krilenko, N. Tamirisa, V. Mishchenko, C. J. Neely, M. Savluk, A. Moroz. The reform of regulation in currency markets has been many told by Nobel Memorial Prize laureates P. Krugman and R. Mundell, as well as by prominent US researchers J. Taylor and J. Frankel. Methodological basis of using the foreign exchange regulation's instruments a lot of attention has been paid by such economists as K. Basu, P. Kenen, R. Fatum, S. Moiseev, A. Varoudakis.
The main objective of the NBU, as the central bank, in conduction the foreign exchange regulation is to ensure an economic development through the use of a whole arsenal of its instruments. Its exclusive jurisdiction include the following: operations with government securities in the open markets, foreign exchange reserves, discount rate, economic specifications for banks, currency restrictions, rate of required reserves1. Referring to the last, we notice, that this instrument is able to directly and quickly affect the volume of money supply (including foreign ones) in the domestic market through the regulation of credit.
Based on the fact that the increase of money supply is due to the authorized banks, by their
1 Шелудько, С.А. (2015). Інструменти валютного регулювання: склад, класифікація, методи застосування. Вісник Одеського національного університету. Серія: Економіка, Т. 20, 2/2, 166-167.
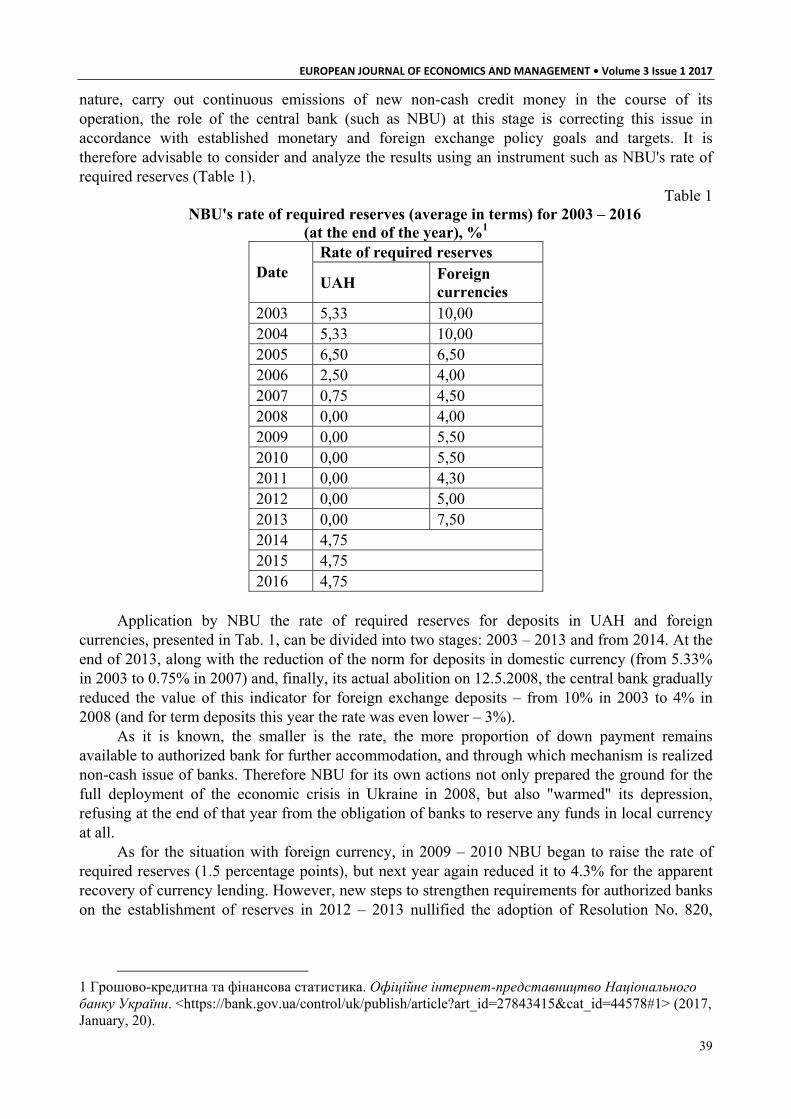
EUROPEAN JOURNAL OF ECONOMICS AND MANAGEMENT • Volume 3 Issue 1 2017
39
nature, carry out continuous emissions of new non-cash credit money in the course of its operation, the role of the central bank (such as NBU) at this stage is correcting this issue in accordance with established monetary and foreign exchange policy goals and targets. It is therefore advisable to consider and analyze the results using an instrument such as NBU's rate of required reserves (Table 1).
Table 1 NBU's rate of required reserves (average in terms) for 2003 – 2016
(at the end of the year), %1 Rate of required reserves
Date UAH
Foreign currencies
2003 5,33 10,00 2004 5,33 10,00 2005 6,50 6,50 2006 2,50 4,00 2007 0,75 4,50 2008 0,00 4,00 2009 0,00 5,50 2010 0,00 5,50 2011 0,00 4,30 2012 0,00 5,00 2013 0,00 7,50 2014 4,75 2015 4,75 2016 4,75
Application by NBU the rate of required reserves for deposits in UAH and foreign
currencies, presented in Tab. 1, can be divided into two stages: 2003 – 2013 and from 2014. At the end of 2013, along with the reduction of the norm for deposits in domestic currency (from 5.33% in 2003 to 0.75% in 2007) and, finally, its actual abolition on 12.5.2008, the central bank gradually reduced the value of this indicator for foreign exchange deposits – from 10% in 2003 to 4% in 2008 (and for term deposits this year the rate was even lower – 3%).
As it is known, the smaller is the rate, the more proportion of down payment remains available to authorized bank for further accommodation, and through which mechanism is realized non-cash issue of banks. Therefore NBU for its own actions not only prepared the ground for the full deployment of the economic crisis in Ukraine in 2008, but also "warmed" its depression, refusing at the end of that year from the obligation of banks to reserve any funds in local currency at all.
As for the situation with foreign currency, in 2009 – 2010 NBU began to raise the rate of required reserves (1.5 percentage points), but next year again reduced it to 4.3% for the apparent recovery of currency lending. However, new steps to strengthen requirements for authorized banks on the establishment of reserves in 2012 – 2013 nullified the adoption of Resolution No. 820,
1 Грошово-кредитна та фінансова статистика. Офіційне інтернет-представництво Національного банку України. <https://bank.gov.ua/control/uk/publish/article?art_id=27843415&cat_id=44578#1> (2017, January, 20).

ISSN 2533‐4794 EVROPSKÝ ČASOPIS EKONOMIKY A MANAGEMENTU
40
which equalizes deposits in different currencies at a single rate1, distinguishing now only term and current deposits.
To evaluate the results of such decisions of NBU, we analyzed the dynamics of banking multipliers (Fig. 1).
Fig. 1. Dynamics of banking multipliers in Ukraine for 2003 – 20162
As it shows in Fig. 1, commercial banks in Ukraine since 2003 received more and more
opportunities to multiply the money supply, and in 2007 (i.e. before the crisis) each cash UAH could create more than 133 new non-cash UAH. Moreover, in 2008 – 2013 banks were given the opportunity of unlimited credit, which demonstrates the expansionary nature of monetary policy NBU.
However, analyzing the actual value of the multiplier, which, although it has increased from 2.5 in general on the eve of zeroing regulation reserving to 3 on the eve of its return, but it was below the normative in 6-20 times. This indicates a degree of cautious banks to resort to large-scale lending in unstable conditions prevailing in the economy of Ukraine in 2009, which is consistent with the capital-creating theory of credit3.
At the same time, the normative multiplier in foreign currency was within 10-25, which, on the one hand, was a low value comparing with the domestic ones, and on the other – means that the banks have every right to issue non-cash items 10-25 currency per unit of cash involved. Thus, the use of this instrument of NBU's foreign exchange regulation hardly can be called an effective.
Consider the impact of such decisions of NBU on the loan and deposit transactions of authorized banks, which are the most common foreign currency transactions, and thus their analysis is a particular interest to determine and quantify the role of the authorized banks in the foreign exchange regulation (Table 2).
1 Постанова № 820 про зміну порядку формування та зберігання обов'язкових резервів, п. 4 (2014) (Правління Національного банку України). Офіційний сайт Верховної Ради України. <http://zakon3.rada.gov.ua/laws/show/v0820500-14> (2016, грудень, 28). 2 Грошово-кредитна та фінансова статистика. Офіційне інтернет-представництво Національного банку України. <https://bank.gov.ua/control/uk/publish/article?art_id=27843415&cat_id=44578#1> (2017, January, 20). 3 Рябініна, Л.М. (2013). Грошово-кредитне регулювання економіки, його методи, інструменти та механізми. Потенціал економічного розвитку в контексті європейської інтеграції. Збірник наукових праць з актуальних проблем економічних наук. Дніпропетровськ: Гельветика, 132.

EUROPEAN JOURNAL OF ECONOMICS AND MANAGEMENT • Volume 3 Issue 1 2017
41
Table 2 Volume, composition and structure of credit operations of authorized banks in Ukraine
in terms of currencies for 2006 – 20161 Deposit Loans
including including domestic
currencies foreign
currencies domestic
currencies foreign
currencies Date Total,
bn. UAH bn.
UAH %
bn. UAH
%
Total, bn.
UAH bn. UAH
% bn.
UAH %
2006 134,75 87,77 65,13 46,99 34,87 143,42 81,28 56,67 62,14 43,33
2007 185,92 115,10 61,91 70,81 38,09 245,23 123,79 50,48 121,44 49,52
2008 283,87 192,30 67,74 91,58 32,26 426,87 213,80 50,09 213,07 49,91
2009 359,74 201,83 56,11 157,91 43,89 734,02 300,22 40,90 433,80 59,10
2010 334,95 173,09 51,68 161,86 48,32 723,30 355,52 49,15 367,77 50,85
2011 416,65 239,30 57,43 177,35 42,57 732,82 395,50 53,97 337,32 46,03
2012 491,76 280,44 57,03 211,32 42,97 801,81 478,60 59,69 323,21 40,31
2013 572,34 320,27 55,96 252,07 44,04 815,14 515,58 63,25 299,56 36,75
2014 669,97 421,75 62,95 248,22 37,05 910,78 602,78 66,18 308,01 33,82
2015 675,09 365,45 54,13 309,64 45,87 1020,67 547,99 53,69 472,68 46,31
2016 716,73 391,91 54,68 324,82 45,32 981,63 433,83 44,19 547,80 55,81
As it can be seen from Tab. 2, the analyzed period volumes of either deposit and loan
operations of authorized banks significantly increased, and volume of the last of them greatly exceeded the deposit ones, which in 2006 – 2016 increased only for a five times, while the volume of lending during the same period increased almost for seven times, which suggests that in general over the period the volume of loans of authorized banks in Ukraine is almost 1.5 times higher than the volume of borrowed funds.
However, if the share of deposit in foreign currencies increased over the period from 34.87% to 45.32%, the share of lending operations in foreign currencies for the same period increased from 43.33% up to 55.81%, although the volume of transactions in domestic currency (both deposit and loan) during the same period decreased its share.
The increase in the share either deposit and loan operations in foreign currencies, while reducing the share of the same transactions in domestic currency shows, that the 1.5-times excess of the total amount of loan volume of transactions on deposit operations was largely due to increased loan in foreign currencies' operations. From this we can conclude the realization by the authorized banks in Ukraine in 2006 – 2016 the credit expansion (mainly, foreign-exchange) and even foreign exchange credit boom.
It is worth to be noted, that the credit boom, as the process of credit expansion (in this case, foreign exchange) in substance and economic consequences significantly different from credit expansion, which has broader goals to promote its sphere of influence in the competitive environment, while the purpose of the credit boom is to maximize profits using existing situation. For particular note worth the fact that the authorized banks, except the provision of foreign exchange loans borrowed within the funds provided as loans in excess of the available foreign exchange resources, creating imaginary deposits that adversely affect the liquidity of banks.
In this context, it is advisable to consider the sources of replenishment of the authorized
1 Грошово-кредитна та фінансова статистика. Офіційне інтернет-представництво Національного банку України. <https://bank.gov.ua/control/uk/publish/article?art_id=27843415&cat_id=44578#1> (2017, January, 20).

ISSN 2533‐4794 EVROPSKÝ ČASOPIS EKONOMIKY A MANAGEMENTU
42
banks their credit resources in foreign currency and to analyze the cost of their attraction for banks (Table 3).
Table 3 Average interest rates on deposits in foreign currency, attracted by banks in Ukraine in
2006 – 20161, % Interest rates on deposits in foreign currency of:
residents nonresidents including including
Date total
banks business populationtotal
banks business 2006 5,49 3,17 6,21 7,09 5,74 5,35 6,12 2007 5,41 4,74 4,97 6,51 5,69 6,55 4,84 2008 5,74 5,67 5,19 6,38 5,83 4,93 6,74 2009 5,58 5,73 3,83 7,17 6,42 4,77 8,06 2010 7,25 3,89 7,88 9,97 6,23 2,39 10,07 2011 5,30 1,53 5,65 8,73 4,97 1,70 8,25 2012 3,63 1,25 3,41 6,25 4,38 1,54 7,22 2013 3,82 1,33 3,06 7,05 3,98 0,69 7,26 2014 3,98 1,46 3,70 6,77 6,01 4,93 7,09 2015 5,00 2,54 4,76 7,70 6,36 5,92 6,80 2016 4,73 1,97 4,68 7,54 7,58 8,36 6,80
Tab. 3 shows the average-weighted interest rates for the dates on which Ukrainian banks
have attracted funds in foreign currency to its deposit portfolio. As it can be seen, the cheapest source of foreign exchange funds were other banks, and in 2008 – 2009 (before the crisis) it was provided by foreign banks the cheapest resources at 4.77 – 4.93%, and for the end of 2013 their value was less than 1%.
At the same time residents (both banks and enterprises and population) were not ready to open deposit accounts for less than 1.33% per annum. But already from 2014, i.e. during the deployment of a new wave of economic crisis in Ukraine, foreign sources of currency have significantly rise (up to 7.58% in 2016), don't want to risk by their own money, at a time when Ukrainian subjects of economy, by contrast, provide own funds at lower percentage.
This can be explained by high credit risk for investors of Ukrainian banks, and to compensate for the increasing cost of borrowed funds, authorized banks had respectively increased interest income from loans, both by raising interest rates and by increasing the volume of lending, which also needed the foreign exchange credit expansion, which has already been shown.
It is pertinent to point out, that the IMF in 2007 recommended for Ukraine to contain stimulating the credit boom, adequately assessing the ability of the borrowers and the expectations of creditors, and eventually begin an institutional reform for creating a favorable investment climate in the state with high impact.
However, NBU, which creates monetary (and, consequently, foreign exchange) policy in the country, not in a hurry to restrain credit boom own leverage on banks2, and therefore bank’s lending in foreign currencies increased sharply, helping to create credit boom since the beginning of 2009 and 2015, and the economic crisis, which intensified in Ukraine against the background of the global crisis.
Not by chance Ludwig von Mises, one of the brightest representatives of the Austrian
1 Фінансові ринки. Офіційне інтернет-представництво Національного банку України. <https://bank.gov.ua/control/uk/publish/article?art_id=27843415&cat_id=44578#2> (2017, January, 20). 2 МВФ уехал, но обещал вернуться. Интернет-газета «Экономика». <http://www.economica.com.ua/finance/article/523161.html> (2016, December, 17).

EUROPEAN JOURNAL OF ECONOMICS AND MANAGEMENT • Volume 3 Issue 1 2017
43
School, believed that "...credit expansion always leads to economic crisis"1. It is no accident, that since the crisis in 2008 nearly 70 banks lost their licenses, which created mistrust of the citizens to domestic banks (table 4).
Table 4 Number of authorized banks in Ukraine, including the foreign-capital, in 2007 – 20162
Number of banks including, in %
foreign capital Date Total domestic
capital total including
100%-foreign 2007 175 73,14 26,86 36,17 2008 184 71,20 28,80 32,08 2009 182 71,98 28,02 35,29 2010 176 68,75 31,25 36,36 2011 176 69,89 30,11 41,51 2012 176 69,89 30,11 41,51 2013 180 72,78 27,22 38,78 2014 163 68,71 31,29 37,25 2015 117 64,96 35,04 41,46 2016 98 60,20 39,80 43,59
The content of the tab. 4 shows, that the number of banks in Ukraine has decreased
dramatically, and since 2014 this process has only accelerated. Thus, in 2008 the bank had 184 licensed institutions, by the end of 2016 their number decreased to 98 (i.e. 86 banks went bankrupt, and investors lost their interest and even the deposit).
If we analyze the capital structure of the banking system, we immediately noticed a gradual increase in banks with foreign capital – from 27% in 2007 to 40% in 2016 – which was not due to the opening of new establishments, both through a general bankruptcy of banks with Ukrainian capital because of lack (as opposed to foreign) access to replenish foreign exchange reserves. This is supported by relatively high share of banks with 100% foreign capital, which by the end of 2016 reached the level of 43.59%.
Conclusions. Distribution foreign currency credit expansion by banks is contributed to the loss of its liquidity on deposits in foreign currency and, consequently, caused the need for refinancing loans. Distribution foreign exchange credit expansion by banks at the same time has increased the volume of outstanding debt (primarily, it is in foreign currencies), increased cost of establishing reserves to protect against credit risk and increased the level of capitalization of banks, which eventually affected the financial results of banking contributing to the emergence and increasing losses.
On the background of the reduction of regulatory capital in 2014, NBU was forced to increase the volume of refinancing loans for liquidity support authorized banks, such loans rose almost 116 times (!) – with almost 1 bn. UAH in 2005 to 105.8 bn. UAH at the end of 20163. All this does not help Ukrainian economy out of crisis, but rather only worsen her condition.
1 Людвиг фон Мизес. Экономические последствия дешевых денег. Научно-исследовательский центр Мизеса. <http://liberty-belarus.info/o-kapitalizme/ekonomicheskaya-teoriya/9316-jekonomicheskij-cikl-i-kreditnaja-jekspansija-9316> (2016, November, 23). 2 Грошово-кредитна та фінансова статистика. Офіційне інтернет-представництво Національного банку України. <https://bank.gov.ua/control/uk/publish/article?art_id=27843415&cat_id=44578#1> (2017, January, 20). 3 Аналітика. Асоціація українських банків. <http://aub.org.ua/index.php?option=com_arhive_docs&show=2005&Itemid=112> (2017, January, 21).
ISSN 2533‐4794 EVROPSKÝ ČASOPIS EKONOMIKY A MANAGEMENTU
44
All this leads to the conclusion that the role of banks in the occurrence and distribution in Ukraine in the analyzed period foreign currency credit expansion and, even, foreign currency credit boom is decisive and, in addition, a negative role belongs exactly to the authorized banks.
References: 1. Sheludko, S.A. (2015). Instrumenty valjutnoho rehuljuvannja: sklad, klasyfikacija, metody zastosuvannja [Instruments of the Foreign-Exchange Regulation: Composition, Classification, Methods of Use]. Visnyk Odeskoho natsionalnoho universytetu (Ceriia Ekonomika) [Herald of Odesa National University (Series Economy)], Vol. 20, 2/2, 165-168. [in Ukrainian]. 2. Hroshovo-kredytna ta finansova statystyka [Monetary and finance statistics]. Ofitsiine internet-predstavnytstvo Natsionalnoho banku Ukrainy [Official web-site of National bank of Ukraine]. <https://bank.gov.ua/control/uk/publish/article?art_id=27843415&cat_id=44578#1> [in Ukrainian]. 3. Postanova № 820 pro zminu poryadku formuvannya ta zberihannya obov"yazkovykh rezerviv [Decree # 820 on change of the order of formation and storage of required reserves] (2014) (National Bank of Ukraine' Governance). Ofitsiinyi sait Verkhovnoi Rady Ukrainy [Official web-site of Verkhovna Rada of Ukraine]. <http://zakon3.rada.gov.ua/laws/show/v0820500-14> [in Ukrainian]. 4. Ryabinina, L.M. (2013). Hroshovo-kredytne rehulyuvannya ekonomiky, yoho metody, instrumenty ta mekhanizmy [Monetary regulation, its methods, instruments and mechanisms]. Potentsial ekonomichnoho rozvytku v konteksti yevropeyskoyi intehratsiyi: Zbirnyk naukovykh pratsz aktualnykh problem ekonomichnykh nauk [The potential for economic development in the context of European integration: Proceedings of the actual problems of economics]. Dnipropetrivsk: Helvetyka. [in Ukrainian]. 5. Finansovi rynky [Financial markets]. Ofitsiine internet-predstavnytstvo Natsionalnoho banku Ukrainy [Official web-site of National bank of Ukraine] <https://bank.gov.ua/control/uk/publish/article?art_id=27843415&cat_id=44578#2> [in Ukrainian]. 6. MVF uehal, no obeshhal vernut'sja [IMF left, but promised to return]. Internet-gazeta «Jekonomika» [Internet newspaper "Economics"]. <http://www.economica.com.ua/finance/article/523161.html> [in Russian]. 7. Ludwig von Mises. Jekonomicheskie posledstvija deshevyh deneg [The economic consequences of cheap money]. Nauchno-issledovatel'skij centr Mizesa [Mises' Scientific and Research Center]. <http://liberty-belarus.info/o-kapitalizme/ekonomicheskaya-teoriya/9316-jekonomicheskij-cikl-i-kreditnaja-jekspansija-9316> [in Russian]. 8. Analityka [Analytics]. Asotsiatsiya ukrayinskykh bankiv [Association of Ukrainian Banks]. <http://aub.org.ua/index.php?option=com_arhive_docs&show=2005&Itemid=112> [in Ukrainian].

EUROPEAN JOURNAL OF ECONOMICS AND MANAGEMENT • Volume 3 Issue 1 2017
45
Тарас Васюник Львівський торговельно‐економічний університет, Україна
ДО ПИТАННЯ ВИЗНАЧЕННЯ ЕФЕКТИВНОСТІ ДЕРЖАВНОГО РЕГУЛЮВАННЯ ВІДТВОРЕННЯ ОСНОВНОГО КАПІТАЛУ Taras Vasiunyk Lviv Trade and Economic University, Ukraine
ABOUT DETERMINATION OF EFFICIENCY OF STATE REGULATION OF CAPITAL REPRODUCTION
In the article the term «efficiency of state regulation of capital reproduction» is substantiated. The approaches of different researchers to ratio between concepts of «efficiency» and «effectiveness» are analyzed. The article indicates that the works of some authors equate the concepts of «efficiency» and «effectiveness», which in our opinion is explained by characteristics of the economic systems in which the study was conducted. The author proposed own method of evaluating effectiveness of state regulation of capital reproduction based on two approaches – economic and financial. The total effectiveness of state regulation of capital reproduction is proposed to be determined by the integral index using of taxonomic analysis. The argument in favor of using this method is that it works with multidimensional economic concept that describes a large number of indicators. Key words: capital, investment, efficiency, reproduction, criteria of efficiency.
Постановка проблеми. Як в теорії так і практиці державного регулювання відтворення основного капіталу одним із найважливіших питань є визначення критеріїв його ефективності. На думку автора цього дослідження, критеріями ефективності виступають головні відмінні ознаки й визначальна міра вірогідності пізнання суті процесів, пов’язаних з відтворенням основного капіталу.
Аналіз останніх досліджень і публікацій. Питання наукового тлумачення сутності ефективності актуальна для наукового доробку таких вчених як: Е. Долана, П. Друкера, М. Коробова Л. П. Єщенко, М. Звєрякова, Б. Кваснюка, С. Кірєєва, О. Кундицького, І. Крючкоа, В. Мандибура, М. Меламеда, В. Мунтіяна, І. Малого, А. Ревенка, Л. Федулової та інших вчених.
Мета і завдання дослідження. Метою статті є вироблення методики оцінки ефективності державного регулювання відтворення основного капіталу.
Виклад основного матеріалу. Досліджуючи походження терміну «ефективність» нами встановлено, що він походить від латинського «effectus», що в перекладі означає виконання, результат певної причини або дії. У загальному розумінні, ефект — це результат, досягнутий від будь-якого заходу. В сучасній економічній літературі ефективність виступає як міра раціонального використання різноманітних ресурсів для досягнення поставлених цілей як на макро- так і на мікро- рівнях. Хоча зустрічаються підходи за якими поняття «ефект» і «ефективність» ототожнюються. Так, зокрема, колектив авторів під керівництвом М. Лапигіна під ефективністю розуміє1:
- конкретний результат (ефективність дії чого-небудь); - відповідність результату або процесу максимально можливому, ідеальному або
1 Лапыгин, Ю.Н., Лапыгин, Д.Ю., Лачинина, Т.А. (2005). Стратегическое развитие организации. Москва: КНОРУС.

ISSN 2533‐4794 EVROPSKÝ ČASOPIS EKONOMIKY A MANAGEMENTU
46
плановому; - функціональну різноманітність систем; - числову характеристику задовільності функціонування; - вірогідність виконання цільових установок і функцій; - відношення реального ефекту до необхідного (нормативного) ефекту. Цікавим, з точки зору нашого дослідження є підхід С. Яшина, який виділяє наступні
підходи щодо розуміння поняття ефективності1: 1) ефективність розглядається як відносний показник (ресурсна або цільова
ефективність); 2) ефективність визначається через прибуткові методи, що дають абсолютні значення
показників. В рамках цих підходів використовуються метод дисконтованого грошового потоку, метод капіталізації доходів, метод терміну окупності, розрахунок точки беззбитковості проекту;
3) ефективність визначається через прибуткові методи, але розраховується як відносний показник – метод індексу прибутковості (індекс прибутковості) і рентабельності проекту, метод внутрішньої норми прибутковості (внутрішня норма прибутку, рентабельності, повернення інвестицій);
4) ефективність розглядається як індивідуальний набір фінансових і нефінансових показників підприємства (збалансована система показників).
В загальному ефективність визначається шляхом співставлення отриманих результатів із затраченими ресурсами. Отримана величина служить підставою для оцінки доцільності проведення заходів, у тому числі тих, які пов’язанні з відтворенням основного капіталу. Виходячи із вищесказаного ефективність державного регулювання відтворення основного капіталу можна визначити за наступною формулою:
,ярегулюванндержавненаВитрати
ярегулюванндержавногорезультатЕфектярегулюванндержавноготьЕфективніс
(1)
Як бачимо із наведеної формули (1), у формалізованому вигляді ефективність державного регулювання відтворення основного капіталу є відносною величиною. Якщо в знаменник даної формули ми відносимо всі ресурси за допомогою яких здійснюється відтворення основного капіталу, то в чисельник – результати, до яких призводять ці капіталовкладення. В даному випадку особливої актуальності набуває питання розмежування понять «ефективності» та «результативності». Це пояснюється тим, що використання системи показників результативності вирішує проблему ідентифікації витрат, пов’язаних з державним регулюванням відтворення основного капіталу та дозволяє більш широко використовувати не фінансові індикатори для характеристики діяльності держави. Вирішення поставленого завдання передбачає дослідження думок різних вчених стосовно цих понять (табл. 1).
Наведена таблиця засвідчує, що в працях окремих авторів відбувається ототожнення понять «ефективність» і «результативність», що на нашу думку пояснюється характеристикою економічних систем в яких проводили дослідження вищеназвані науковці.
1 Яшин, С.Н. (2005). Сравнительная оценка совокупного экономико-организационного эффекта функционирования предприятий. Экономический анализ: теория и практика, Тернопіль, 6, 8-14.

EUROPEAN JOURNAL OF ECONOMICS AND MANAGEMENT • Volume 3 Issue 1 2017
47
Таблиця 1 Співставлення понять «ефективність» та «результативність»1
Трактування поняття Автор
«ефективність» «результативність»
Е. Долан вибір вірних цілей, на яких фокусується вся енергія підприємства
досягнення поставлених цілей 3 найменшими витратами і помилками
П. Друкер наслідок того, що «правильно створюються необхідні речі»
наслідок того, що «створюються необхідні, правильні речі»
Д. Хан вміння правильно робити намічене вміння правильно намітити, що робити
М. Мескон, М. Альберт, Ф. Хедоурі
внутрішня ефективність, економічність, яка оцінює найкраще використання ресурсів
зовнішня ефективність, яка оцінює досягнення цілей підприємства, що відображає не лише економічність, але й характеризує взаємовідносини з зовнішнім середовищем
А. Д. Шеремет, Р.С. Сайфулін
складна категорія, що характеризується результативністю роботи підприємства і рентабельністю його капіталу, ресурсів або продукції
величина, що характеризує ступінь ділової активності підприємства
Ю.В. Перевалов, І.Е. Гімаді, В.В. Добродей
неоднорідне поняття, що слід розглядати в двох аспектах 1) результативність, 2) економічність
ступінь досягнення основних поставлених цілей, що характеризується кількісними показниками, що відображають цілі, без врахування економічності їх виконання
В.В. Ковальов
відносний показник, що співвідносить отриманий ефект з витратами або ресурсами, використаними для досягнення цього ефекту, один з показників оцінки фінансово-господарської діяльності
величина, що відображає прибутковість, динамічність виконання цілей, ефективність використання економічного потенціалу, положення на ринку цінних паперів
Для усунення дискусійності питання щодо ототожнення понять «ефективність» та
«результативність» ми підтримуємо тих науковців, які вважають, що найвичерпніше визначення цих понять наведене в стандарті ISO:9000:2000, за яким ефективність – це співвідношення між досягнутим результатом і використаними ресурсами, а результативність – ступінь реалізації запланованої діяльності і досягнення запланованих результатів2.
Також складність дослідження даного питання полягає в тому, що на сьогодні не існує чітких рекомендацій на рахунок того, яка кількість критеріїв має застосовуватись як для характеристики ефективності державного регулювання загалом так і державного регулювання відтворення основного капіталу зокрема. Найбільш поширеною, в даному випадку, є точка зору, яку репрезентує Л. Дмитриченко, і, за якою критерій ефективності має відображати необхідність державного регулювання, його оптимальні межі, а також реальний ефект від державного впливу на соціально-економічні процеси3. В загальному погоджуючись з даною точкою зору, хотілось би зазначити, що процеси, пов’язані з
1 Тищенко, А.Н., Кизим, Н.А., Догадайло, Я.В. (2005). Экономическая результативность деятельности предприятий. Xарьков: ИНЖЭК. 2 Климаш, Н.І. (2009). Науково-теоретичні аспекти сутності понять ефективність та результативність. Наукові праці Національного університету харчових технологій. Київ, 28, 124-126. 3 Дмитриченко, Л.И. (2001). Государственное регулирование экономики: методология и теория. Донецк: УкрНТЭК.
ISSN 2533‐4794 EVROPSKÝ ČASOPIS EKONOMIKY A MANAGEMENTU
48
відтворенням основного капіталу, зазвичай, є каталізатором розвитку суспільного виробництва, продуктивних сил тощо. Однак ми не погоджуємось з думкою про те, що єдиним критерієм ефективності державного регулювання відтворення основного капіталу є показник ВВП, оскільки одна і та ж сама величина ВВП може досягатись при використанні різного за структурою, обсягом і якістю основного капіталу.
Ми висловлюємо думку, що критерії ефективності державного регулювання відтворення основного капіталу безпосередньо пов’язані із стадіями відтворювального процесу. Крім того, недостатність та обмеженість ресурсів відтворення основного капіталу спонукають до систематизації показників, які б з одного боку характеризували ефективність державного регулювання відтворення основного капіталу, а з іншого – визначали пріоритетні цілі в цьому напрямі.
Складність формування критеріїв ефективності державного регулювання відтворення основного капіталу, на наш погляд, викликана такими чинниками:
- по-перше, державне регулювання, в залежності від обставин, є чинником прямого або опосередкованого впливу на процес відтворення основного капіталу;
- по-друге, ефективність державного регулювання відтворення основного капіталу в великій мірі залежить від суміжних напрямів державної політики, пов’язаної з вдосконаленням основних засобів та розвитком науково-технічного процесу;
- по-третє, узгодженості інтересів на макро- і мікро- рівнях, де з одного боку підприємства, як власники основного капіталу, а з іншого – держава, яка одночасно є і власником і покупцем основних засобів.
На основі вищесказаного вважаємо, що ефективність державного регулювання відтворення основного капіталу є системною категорією, яка виражає величину достатності основних засобів за кількісними і якісними характеристиками на макро- і мікро- рівнях. Хоча підхід науковців до цього питання неоднозначний. Так, переважна їх більшість переконана у використанні системи натуральних і вартісних показників1. Інші пропонують використовувати один узагальнюючий показник економічного ефекту2. Ми вважаємо, що ефективність державного регулювання відтворення основного капіталу на макро- рівні можна визначити одним узагальнюючим показником, основою для розрахунку якого є комплексна система показників ефективності відтворювальних процесів на мікро- рівнях тобто стадіях.
Макроекономічна ефективність державного регулювання відтворення основного капіталу має оцінюватися як за окремими стадіями внаслідок суттєвої різниці їх часової тривалості і руху форм вартості основного капіталу та і в цілому виходячи із впливу на стабільність економічного зростання в країні. У США для цих цілей використовується «індикатор відтворювального резерву основного капіталу». Даний показник розраховується як відношення фактично нарахованої амортизації в складі собівартості реалізованої продукції до початкової вартості основних засобів. На думку окремих економістів, за своєю суттю даний показник є ключовим показником ефективності відтворення основного капіталу та оцінки державного впливу на нього. Проте його розрахунок у сучасних умовах є малоймовірним, оскільки офіційна статистика не подає інформації щодо частки амортизаційних відрахувань в собівартості реалізованої продукції.
Ми підтримуємо думку науковців3, які вважають, що запровадження в практику державного регулювання індикатора відтворювального резерву основного капіталу дозволить об’єктивно оцінити, координувати і контролювати внутріфазовий і міжфазовий
1 Поддєрьогін, А.М., Білик, М.Д., Буряк, Л.Д. (2005). Фінанси підприємств. Київ: КНЕУ. 2 Підлісецький, Г.М. (2003). Формування ринків фінансових ресурсів в АПК. Київ: ІАЕ УААН. 3 Онуфриева, А.С. (2006). Направления государственного регулирования воспроизводства основного капитала на стадии незавершенного строительства промышленных объектов в России. Экономика. Управление. Культура. Москва, 15, 156-167.
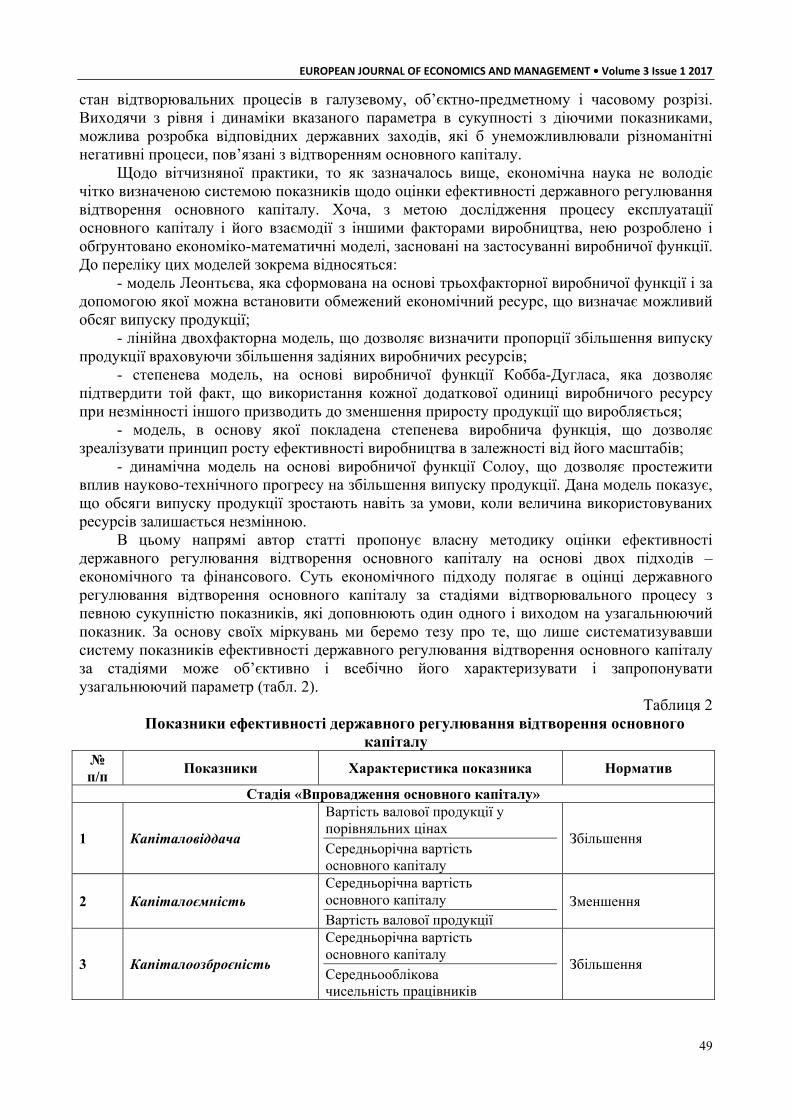
EUROPEAN JOURNAL OF ECONOMICS AND MANAGEMENT • Volume 3 Issue 1 2017
49
стан відтворювальних процесів в галузевому, об’єктно-предметному і часовому розрізі. Виходячи з рівня і динаміки вказаного параметра в сукупності з діючими показниками, можлива розробка відповідних державних заходів, які б унеможливлювали різноманітні негативні процеси, пов’язані з відтворенням основного капіталу.
Щодо вітчизняної практики, то як зазначалось вище, економічна наука не володіє чітко визначеною системою показників щодо оцінки ефективності державного регулювання відтворення основного капіталу. Хоча, з метою дослідження процесу експлуатації основного капіталу і його взаємодії з іншими факторами виробництва, нею розроблено і обґрунтовано економіко-математичні моделі, засновані на застосуванні виробничої функції. До переліку цих моделей зокрема відносяться:
- модель Леонтьєва, яка сформована на основі трьохфакторної виробничої функції і за допомогою якої можна встановити обмежений економічний ресурс, що визначає можливий обсяг випуску продукції;
- лінійна двохфакторна модель, що дозволяє визначити пропорції збільшення випуску продукції враховуючи збільшення задіяних виробничих ресурсів;
- степенева модель, на основі виробничої функції Кобба-Дугласа, яка дозволяє підтвердити той факт, що використання кожної додаткової одиниці виробничого ресурсу при незмінності іншого призводить до зменшення приросту продукції що виробляється;
- модель, в основу якої покладена степенева виробнича функція, що дозволяє зреалізувати принцип росту ефективності виробництва в залежності від його масштабів;
- динамічна модель на основі виробничої функції Солоу, що дозволяє простежити вплив науково-технічного прогресу на збільшення випуску продукції. Дана модель показує, що обсяги випуску продукції зростають навіть за умови, коли величина використовуваних ресурсів залишається незмінною.
В цьому напрямі автор статті пропонує власну методику оцінки ефективності державного регулювання відтворення основного капіталу на основі двох підходів – економічного та фінансового. Суть економічного підходу полягає в оцінці державного регулювання відтворення основного капіталу за стадіями відтворювального процесу з певною сукупністю показників, які доповнюють один одного і виходом на узагальнюючий показник. За основу своїх міркувань ми беремо тезу про те, що лише систематизувавши систему показників ефективності державного регулювання відтворення основного капіталу за стадіями може об’єктивно і всебічно його характеризувати і запропонувати узагальнюючий параметр (табл. 2).
Таблиця 2 Показники ефективності державного регулювання відтворення основного
капіталу № п/п
Показники Характеристика показника Норматив
Стадія «Впровадження основного капіталу»
1 Капіталовіддача
Вартість валової продукції у порівняльних цінах Середньорічна вартість основного капіталу
Збільшення
2 Капіталоємність Середньорічна вартість основного капіталу Вартість валової продукції
Зменшення
3 Капіталоозброєність
Середньорічна вартість основного капіталу Середньооблікова чисельність працівників
Збільшення

ISSN 2533‐4794 EVROPSKÝ ČASOPIS EKONOMIKY A MANAGEMENTU
50
продовження таблиці 2 № п/п
Показники Характеристика показника Норматив
Стадія «Продуктивного використання основного капіталу»
4 Коефіцієнт ефективності використання основного капіталу
Прибуток від операційної діяльності Середньорічна вартість основного капіталу
Збільшення
Стадія «Відтворення основного капіталу»
5 Коефіцієнт зростання
Вартість основного капіталу на кінець року Вартість основного капіталу на початок року
Збільшення
6 Коефіцієнт оновлення
Вартість введеного основного капіталу Середньорічна вартість основного капіталу
Збільшення
7 Коефіцієнт вибуття
Вартість вибулого основного капіталу Середньорічна вартість основного капіталу
Збільшення
Коефіцієнт сукупного відтворення
Вартість основного капіталу що надійшов протягом року Вартість основного капіталу на початок року
Збільшення
8 Загальна ефективність відтворення ОК
Збільшення
Так, на нашу думку, ефективність державного регулювання відтворення основного
капіталу на стадії «Впровадження основного капіталу» вимірюється порівнянням витрат, пов’язаних з його формуванням та результатів тобто обсягу випущеної продукції. До основних показників тут належать показники капіталовіддачі, капіталоємності та капіталоозброєності; на стадії «Продуктивного використання» – коефіцієнт ефективності використання основного капіталу (норми прибутку від функціонування основного капіталу); на стадії «Відтворення» – коефіцієнти динаміки, оновлення, вибуття та сукупного відтворення.
Найважливішим показником, який характеризує ефективність використання і відтворення основного капіталу з позицій державного регулювання на стадії «Впровадження основного капіталу» є капіталовіддача, зворотною величиною якої є капіталомісткість. У даний час капіталовіддача визначається як вартість валової продукції у порівняльних цінах до середньорічної вартості основного капіталу. Вона показує скільки продукції отримано з кожної гривні основного капіталу. Цілком погоджуючись з формулою даного показника, відзначимо наступне:
- використання даної формули призводить до отримання результату за рахунок використання лише основного капіталу, хоча для виготовлення продукції використовуються і інші види ресурсів, за збалансованості яких зміна витрат якогось одного із них у вартісному виразі призводить до зміни обсягів реалізації продукції в тій же пропорції;
- використання у формулі середньорічної вартості капіталу призводить до такого парадоксу. У разі, якщо придбання нових основних фондів не відбувається, то внаслідок амортизації їх вартість постійно зменшується, що в свою чергу призводить до збільшення капіталовіддачі. Це нелогічно, оскільки основні засоби старіють, а віддача від них збільшується. Усунення даного недоліку можливе при використанні не середньої вартості

EUROPEAN JOURNAL OF ECONOMICS AND MANAGEMENT • Volume 3 Issue 1 2017
51
основного капіталу, а початкової. Ефективність «Продуктивного використання основного капіталу» визначається
порівнянням результатів від цього використання та витрат. Для цієї цілі найбільш доступним і об’єктивним з точки зору державного регулювання є «коефіцієнт ефективності використання основного капіталу», який визначається як відношення прибутку від операційної діяльності до середньорічної вартості основного капіталу1. В окремих джерелах даний показник відомий як «Норма прибутку».
Ефективність «Відтворення основного капіталу» визначається порівнянням обсягів задіяних основних засобів. Для цього доречним є використання коефіцієнтів динаміки, вибуття та оновлення. Показник зростання розкриває темпи збільшення або зменшення вартості основного капіталу.
Коефіцієнт сукупного відтворення дає змогу судити про те, яка частка нововведених основних засобів використана на просте відтворення, а яка – на розширене. Так, якщо основний капітал, що надійшов протягом року, рівний основному капіталу, який вибув протягом року, то забезпечується лише просте відтворення основного капіталу. У разі якщо основний капітал, що надійшов протягом року, більший за основний капітал, який вибув протягом року, то забезпечується лише розширене відтворення основного капіталу.
Загальну ефективність державного регулювання відтворення основного капіталу ми пропонуємо визначити за допомогою інтегрального показника з використанням методу таксономічного аналізу, розробленого В’ячеславом Плютою2. Аргументом на користь використання даного методу, на нашу думку, є те, що він працює з багатовимірними економічними поняттями, які описуються значною кількістю показників. Також використання даної методики дозволить вирішити проблему упорядкування багатомірності такої категорії, як ефективність державного регулювання відтворення основного капіталу відносно нормативного вектору-еталону. Ми переконані, що застосування методу таксономії для оцінки ефективності державного регулювання відтворення основного капіталу є новим прийомом у наукових розвідках щодо цього питання.
References: 1. Lapygin, Ju.N., Lapygin, D.Ju., Lachinina, T.A. (2005). Strategicheskoe razvitie organizacii [The strategic development of the organization]. Moscow: KNORUS. [in Russian]. 2. Jashin, S.N. (2005). Sravnitelnaja ocenka sovokupnogo jekonomiko-organizacionnogo jeffekta funkcionirovanija predprijatij [Comparative assessment of the cumulative effect of economic and organizational functioning of enterprises]. Jekonomicheskij analiz: teorija i praktika [Economic analysis: theory and practice]. Ternopіl, no. 6, 8-14 [in Russian]. 3. Tishhenko, A.N., Kizim, N.A., Dogadajlo, Ja.V. (2005). Jekonomicheskaja rezultativnost dejatelnosti predprijatij [Economic performance of enterprises]. Kharkiv: INZhJeK. [in Russian]. 4. Klymash, N.I. (2009). Naukovo-teoretychni aspekty sutnosti poniat efektyvnist ta rezultatyvnist [Scientific and theoretical aspects of the nature of concepts efficiency and effectiveness]. Naukovi pratsi Natsionalnoho universytetu kharchovykh tekhnolohii [Scientific articles of National University of Food Technologies]. Kyiv, no. 28, 124-126 [in Ukrainian]. 5. Dmitrichenko, L.I. (2001). Gosudarstvennoe regulirovanie jekonomiki: metodologija i teorija [State regulation of economy: theory and methodology]. Donetsk: UkrNTJeK. [in Russian]. 6. Poddierohin, A.M., Bilyk, M.D., Buriak, L.D. (2005). Finansy pidpryiemstv [Finance of Enterprises]. Kyiv: KNEU. [in Ukrainian]
1 Скворцов, І.Б. (2003). Ефективність інвестиційного процесу: методологія, методи і практика. Львів : Львівська політехніка. 2 Плюта, В. (1989). Сравнительный многомерный анализ в экономических исследованиях. Москва : Финансы и статистика.

ISSN 2533‐4794 EVROPSKÝ ČASOPIS EKONOMIKY A MANAGEMENTU
52
7. Pidlisetskyi, H.M. (2003). Formuvannia rynkiv finansovykh resursiv v APK [Formation of financial resources in AIC]. Kyiv: IAE UAAN. [in Ukrainian] 8. Onufrieva, A.S. (2006). Napravlenija gosudarstvennogo regulirovanija vosproizvodstva osnovnogo kapitala na stadii nezavershennogo stroitel'stva promyshlennyh obiektov v Rossii [Directions of state regulation of capital reproduction at the stage of unfinished construction of industrial facilities in Russia]. Jekonomika. Upravlenie. Kultura [Economy. Management. Culture]. Moscow, no. 15, 156-167. [in Russian]. 9. Skvortsov, I.B. (2003). Efektyvnist investytsiinoho protsesu: metodolohiia, metody i praktyka [The effectiveness of the investment process, methodology, methods and practices]. Lviv: Lvivska politekhnika. [in Ukrainian] 10. Pljuta, V. (1989). Sravnitelnyj mnogomernyj analiz v jekonomicheskih issledovanijah [Comparative multivariate analysis in economic research]. Moscow: Finansy i statistika. [in Russian].

EUROPEAN JOURNAL OF ECONOMICS AND MANAGEMENT • Volume 3 Issue 1 2017
53
Антон Шевчук Тернопільський національний економічний університет, Україна
ЕКОНОМІЧНИЙ КАПІТАЛ У СИСТЕМІ УПРАВЛІННЯ РИЗИКАМИ В БАНКІВСЬКІЙ СИСТЕМІ Anton Shevchuk Ternopil National Economic University, Ukraine
ECONOMIC CAPITAL IN RISK MANAGEMENT OF BANKING SYSTEM
The development of banking system in crisis and post‐crisis more acutely put demands on the system of public banking regulation to ensure financial stability, liquidity and profitability of banks of their potential impact on economic growth. One of the mechanisms of state regulation is to establish requirements for risk management at banks that reserve requirements for domestic banks themselves. Therefore, one of the main tasks of bank management is to create a risk management system, which should be adequate to requirements of modern banking system of Ukraine, whose purpose is to determine responsibility for the banks to their own customers, the economy as a whole. Through analytical assessment of risk management in the banking system should examine its organizational, analytical and methodical, informational and functional and mechanical support. It depends on the level of ensuring effective functioning of any system as well and risk management. Moreover, the risk management system implemented at all levels of the bank and covers all aspects of financial activity, acting as optimizing development and use of financial resources in view of the risks. A quality risk management is a key element of corporate governance and directly influences the market value of the bank. Trend Analysis of organizational support risk management covers select the type of organizational structure of the risk management in banks. Key words: banking system, risk management, economic capital.
Постановка проблеми. Збільшення обсягів фінансової діяльності банків, кількості виконуваних ними функцій, зростання операцій та ріст їх вагомості на фінансових ринках призводить до збільшення кількості ризиків та періоду їх настання, які негативно можуть впливати на роботу банківської установи та призвести до фінансових втрат. Умови конкурентного середовища на ринках фінансово-банківських послуг ставлять все більш високі вимоги до систем управління ризиками банків. У зв'язку з цим постійно зростає число банків, які прагнуть до вдосконалення систем управління ризиками та їх приведення у відповідність з передовими міжнародними практиками.
Метою дослідження про наявність тих чи інших ризиків у банківській системі виникає з взаємозв’язком стабільності економіки країни в загальному та коливаннями у банківській системі.
Аналіз останніх досліджень і публікацій. Проблемами економічного капіталу у системі управління ризиками в банківській системі займалися такі світові вчені: Д. Бокка, Р.Бернеса, С. Маттена, С. Фроста, Л. Овербека, М. Хаубенштока, В.М. Козунін, М.В. Кошель, В.М. Вяткін, І.В. Костіков, І.С. Гуцал, Г.П. Бортніков, С.М. Смірнов, Л.О. Примостка.
Виклад основного матеріалу дослідження. У сучасній економіці банківська система є не лише базовою ланкою кредитних відносин, але і ключовим елементом усієї економічної системи держави. З огляду на особливе місце банків в економічній системі

ISSN 2533‐4794 EVROPSKÝ ČASOPIS EKONOMIKY A MANAGEMENTU
54
суспільства її ефективне функціонування випливає на розвиток економіки та соціальну сферу країни. При цьому, термін ефективність є багатозначним поняттям і відображає відношення різних аспектів діяльності – результату та витрат, результату і цілей, результату і цінності тощо. Тому ефективність діяльності банку це не тільки результати його діяльності але і ефективна система управління та менеджменту, що ґрунтується на науково обґрунтованій стратегії діяльності банку. Економічна ефективність – це інтегроване поняття, яке характеризує банківську діяльність та вимірюється співвідношенням певних показників1.
Сама сукупність ефективності банківської діяльності зводиться до аналізу конфліктних цілей : «одержання прибутку – підтримання на достатньому рівні ліквідності – забезпечення надійності через управління ризиками».
Виходячи з цього, розглядатимемо ефективність банківської діяльності на трьох організаційно – функціональних рівнях – банківська система, окремі банківські установи та структурний підрозділ банку. Між даними рівнями існує тісний взаємозв’язок і кожен із них випливає на результати діяльності як вищого так і нижчого рівня2.
Згідно з наведеними статистичними даними табл. 1 із 2009 по 2015 рр. ефективність банківської діяльності можна розділити на три умовні тріоди – період кризи 2009 р., посткризовий період 2010 – 2013, та період стагнації і загострення проблем банківської діяльності 2014-2015 рр.3.
Таблиця 1 Динаміка показників ефективності банківської діяльності
Назва показника 01.01.09 01.01.10 01.01.11 01.01.12 01.01.13 01.01.14 01.01.15 01.01.16
Кількість банків за реєстром, млн.. грн..
198 197 194 198 176 180 163 117
Активи банків, млн. грн.
926086 880302 942088 1054280
1127192
1278095
1316852
1254385
Готівкові кошти та банківські метали, млн. грн.
20668 21725 26749 27008 30346 36390 28337 34353
Кошти в Національному банку України, млн. грн.
18768 23337 26190 31310 33740 47222 27554 27392
Кореспондентські рахунки в інших банках, млн. грн..
40406 51323 67596 78395 99472 78106 99752 129512
Кредити надані, млн. грн.
792244 747348 755030 825320 815327 911402 10006358
965093
В т.ч. кредити, надані фізичним особам, млн. грн.
268857 222 538
186540 174650 161775 167773 179040 152371
Прострочена заборгованість за кредитами, млн. грн. %
18015 2,3
69935 9,4
84851 11,2
79292 9,6
72520 8,9
70177 7,7
135858 13,5
213285 22,1
Вкладення в цінні папери, млн. грн..
40610 39335 83559 87719 96340 138287 168928 198841
1 Мещеряков, А.А. (2006). Організаційно-технологічні аспекти підвищення ефективності функціонування комерційного банку: монографія. Київ: Наук. Світ. 2 Коваленко, В.В. (2008). Ефективність системи в умовах глобальної конкуренції. Актуальні проблеми економіки, 5(83), 169-176. 3 Річні звіти НБУ за 2008 – 2015 роки. <http://www.bank.gov.ua/>.

EUROPEAN JOURNAL OF ECONOMICS AND MANAGEMENT • Volume 3 Issue 1 2017
55
продовження таблиці 1 Назва показника 01.01.09 01.01.10 01.01.11 01.01.12 01.01.13 01.01.14 01.01.15 01.01.16
Резерви під активні операції банків, млн. грн.
48409 122433 148839 157907 141319 131252 204931 321303
Пасиви, млн. грн. 926086 880302 942088 1054280
1127192
1278095
1316852
1254385
Капітал, млн. грн. 119263 115175 137725 155487 169320 192599 148023 103713
Зобов’язання банків, млн. грн.
806823 765127 804363 898793 957872 1085496
1168829
1150672
Регулятивний капітал 123066 135802 160897 178454 178909 204976 188949 130974
Достатність (адекватність) регулятивного капіталу (H2) %
14,01 18,08 20,83 18,90 18,06 18,26 15,60 12,74
Результат діяльності, млн. грн.
7304 -38450 -13027 -7708 4899 1436 -52967 -66600
Рентабельність активів,%
1,03 -4,38 -1,45 -0,76 0,45 0,12 -4,07 -5,46
Рентабельність капіталу, %
8,51 -32,52 -10,90 -5,27 3,03 0,81 -30,46 -51,91
Нинішня стагнація у розвитку банківської системи свідчить про недостатньо
комплектність політики щодо подолання наслідків фінансової кризи. Адже значні обсяги проблемних кредитів, що зумовили значні збитки банківській системі, значні запозичення на міжнародних фінансових ринках та отримані кредити рефінансування засвідчує з одного боку, недостатньо її фінансову стійкість у посткризовий період, а з іншого – про необхідність реформування банківської системи, підвищення ефективності капіталізації банків та впровадження ефективного ризик-менеджменту і переходу до нової моделі банківського нагляду.
Адже в умовах недостатньої капіталізації, надвисоких темпів зростання обсягів діяльності банків та масштабних запозичень на зовнішніх ринках зросте ризик банківської діяльності, зокрема, кредитні, валютний та ризик ліквідності, що в даних умовах потребує впровадження ризик-менеджменту у всіх вітчизняних банках.
У 2008 році в умовах низьких темпів росту валового внутрішнього продукту – 102% (за 2007 він склав 108%), скорочення обсягів промислового виробництва на 3,1%, будівництва – на 15,8% банківська система демонструвала високі темпи зростання в основному за рахунок девальвації гривні (60%). За 2008 рік банківські активи досягли рівня 599396 млн. грн. і збільшилися на 54.5% порівняно із 2007 роком, відповідно, надані банківські кредити – 485368 млн. грн.. і зросли на 63,2%, зобов’язання банків зросли на 52,3% і досягли рівня 529 396 млн. грн.1
Населення, яке було основним кредитором для банківської системи, формуючи пасиви поступилося своїми позиціями запозиченням на зовнішніх ринках. Так, протягом 2004 – 2008 р. зовнішня заборгованість банків зросла з 1.75 млрд. дол. США (2004р.) до 39,424 млрд. дол.. США (2009р.) при цьому питома вага зовнішньої заборгованості банків у валовому зовнішньому борзі України за цей період підвищилось більш ніж у п’ять разів – (із 7,3% у 2004 до 37,8% у 2009р. (див табл. 2)
1 Річний звіт НБУ за 2008 рік. <http://www.bank.gov.ua/>.

ISSN 2533‐4794 EVROPSKÝ ČASOPIS EKONOMIKY A MANAGEMENTU
56
Таблиця 2 Динаміка зовнішньої заборгованості банків України за 2004 – 2009 рр.
Показник 2004 2005 2006 2007 2008 2009
Зовнішня заборгованість банків (млн. дол. США)
1746 2662 6112 14089 30971 39424
Питома вага зовнішньої заборгованості банків у вагомому зовнішньому борзі (%)
7,3 8,7 15,4 25,8 36,6 37,8
Кредити фізичним особам за 2008 різко зростали більшими темпами ніж юридичних і
сплати на 1.01.2009р. 268,857 млрд.грн. (див. табл. 1), а питома вага споживчих кредитів склала 70% і лише 30% - іпотечні кредити. Тільки у 2010 році частки споживчих кредитів в іноземній валюті скоротилася на 6,9%. Більш того, банки при кредитуванні фізичних осіб все частіше використовували «безпечний» скоринг, що давало змогу класифікувати далі позики за оптимістичним сценарієм як надійні і відповідно формувати резерви в мінімальних розмірах, отримуючи при цьому додаткові прибутки через мінімізацію витрат на формування резервів за кредитними операціями. Починаючи із 2010 року обсяги та темпи росту кредитів фізичним особам (див. табл. 2) знизилися і їх обсяг на 08.01.2016 року досяг рівня 152 371 млн. грн., що на 1261 млн. менше рівня 2008 року.
Починаючи з 2010 року появилися певні ознаки стабілізації банківської системи про що свідчить дані про зростання рівня ліквідності та капіталізації банківської системи. Протягом даного періоду обсяг високоліквідних активів (готівка + кошти в НБУ та інших банках) збільшилися на 25,4 млрд. грн. і їх частка в загальних активах досягла рівня 10,3 %. Проте, незважаючи на підвищення рівня ліквідності та капіталізації на 1.01.2016 рік загальний обсяг капіталу банку склав 1150 672 млн. грн. (див. табл. 1). Подальший розвиток банківської системи, високі ризики в діяльності банків, зокрема, зростання в значних обсягах проблемних кредитів, що зумовлює формування додаткових резервів та спричиняє величезні збитки банківській системі.
Таблиця 3 Динаміка обсягів простроченої заборгованості
2008 2009 2010 2011 2012 2013 2014 2015 Кредити надані 792244 747398 755030 825320 815327 911402 1006358 965093 % до попереднього року
- 94.3 101.0 109.3 98.8 911402 1006358 965093
Прострочена заборгованість за кред.(млн.)
18015 69935 84851 79292 72520 70177 135858 213285
у % до попереднього року
- 388,2 121,3 93,4 91,5 96,8 193,6 157
у % до суми наданих кредитів
2,3 9,4 11,2 9,6 8,9 7,7 13,5 22,1
Аналізуючи дані табл. 3 слід відмітити, що обсяг простроченої заборгованості стрімко
зростав: до 2011р. року та із 2014р. Так, у 2010 році загальний обсяг простроченої заборгованості 84851 млн. грн., зріс у порівнянні із 2008 у 4,7 рази, а у 2014 - 135858 і у 1,9 рази порівняно із 2013 роком. При цьому сума наданих кредитів за період 2008 – 2016 рр. зросла у 1,2 рази.
Найбільш активно обсяг простроченої заборгованості зростав у 2009 та у 2014 роках,
EUROPEAN JOURNAL OF ECONOMICS AND MANAGEMENT • Volume 3 Issue 1 2017
57
коли приріст даного показника складав 388,8% та 193,6% відповідно. За період із 2010 по 2013 рік обсяг та темпи росту простроченої заборгованості мали
тенденцію до зниження. Таке зниження приросту заборгованості можна пояснити наступними чинниками:
активізація роботи банків в сфері списання безнадійної заборгованості; активізація роботи по реструктуризації заборгованості; передача в управління проблемних портфелів третім особам (коллекторам); активізація проблем по реалізації заставного майна. Активному списанню безнадійної заборгованості сприяло прийняття Постанови
правління Національного банку України № 424 від 13.09.2010р, котрою був затверджений порядок формування банками резервів за кредитами та нарахування відсотків по них.
Відповідно до цієї постанови банк надавалося право списання кредитної заборгованості за наступних умов:
якщо заборгованість віднесена до категорії безнадійної у відповідності до положення про порядок формування та використання резерву для відшкодування можливих витрат за кредитними операціями банків, затвердженого постановою Правління НБУ № 279 від 06.07.2000 р, тобто до дати набрання чинності постанови № 424;
якщо фінансовий стан позичальника кваліфікується як незадовільний; якщо прострочення платежів за позикою складає більше 90 днів. Причому списання безнадійної заборгованості за рахунок сформованого резерву після
набрання чинності Постанови №424 проводилась за умови її відповідності хоча б одній із ознак безнадійної заборгованості, визначених податкових законодавством. Проте, після списання безнадійної заборгованості банк продовжував роботу щодо відшкодування списаної за рахунок резерву заборгованості, включаючи проведення претензійно – позовної роботи.
На сьогодні, порядок списання безнадійної заборгованості регламентує постанова НБУ № 172 від 01.06.2011р. «Про затвердження порядку відшкодовування банками України безнадійної заборгованості за рахунок резерву», відповідно до якості банк визначає заборгованість як безнадійну відповідно до методики встановленої положенням про порядок формування та використання банками України резервів для відшкодування можливих втрат за активними банківськими операціями, затвердженим постановою Правління НБУ від 25.01.2012р. № 23. Згідно даного Положення банк має право списати за рахунок резерву безнадійну заборгованість яка має прострочення погашення боргу понад 180 днів. Проте як і у Постанові № 424 так і в постанові №172 банк продовжує роботу по відшкодування списаної за рахунок резерву суми безнадійної заборгованості.
Наступним чинником, який вплинув на уповільнення типів росту простроченої заборгованості стала активізація програм реструктуризації проблемних кредитів - пролонгація кредиту, надання кредитних канікул, рефінансування та зниження процентних ставок. Як зазначає агентство «Кредит – Рейтинг», серед методів реструктуризації банки найчастіше використовувати списання частини боргу при умові часткового погашення. суми заборгованості.
Слід зазначити, що банки застосовуючи реструктуризацію викривлення реальну ситуацію проблемної заборгованості, адже реструктуризовані кредити не включали до категорії проблемних: тим самим уникали необхідності формування додаткових резервів.
Позитивний вплив на зниження простроченої заборгованості мала передача проблемної заборгованості третім особам – колекторським компаніям шляхом передачі проблемного портфеля з виплатою комісійної винагороди за повернутий кредит (аутсорсинг) та продаж проблемного портфеля.
На основі приведених даних у табл. 1 у 2014 р. кредити надані фізичним особам зросли у 1.1 рази і досягли рівня 179040 млн. грн. і відповідно за цей період зросла
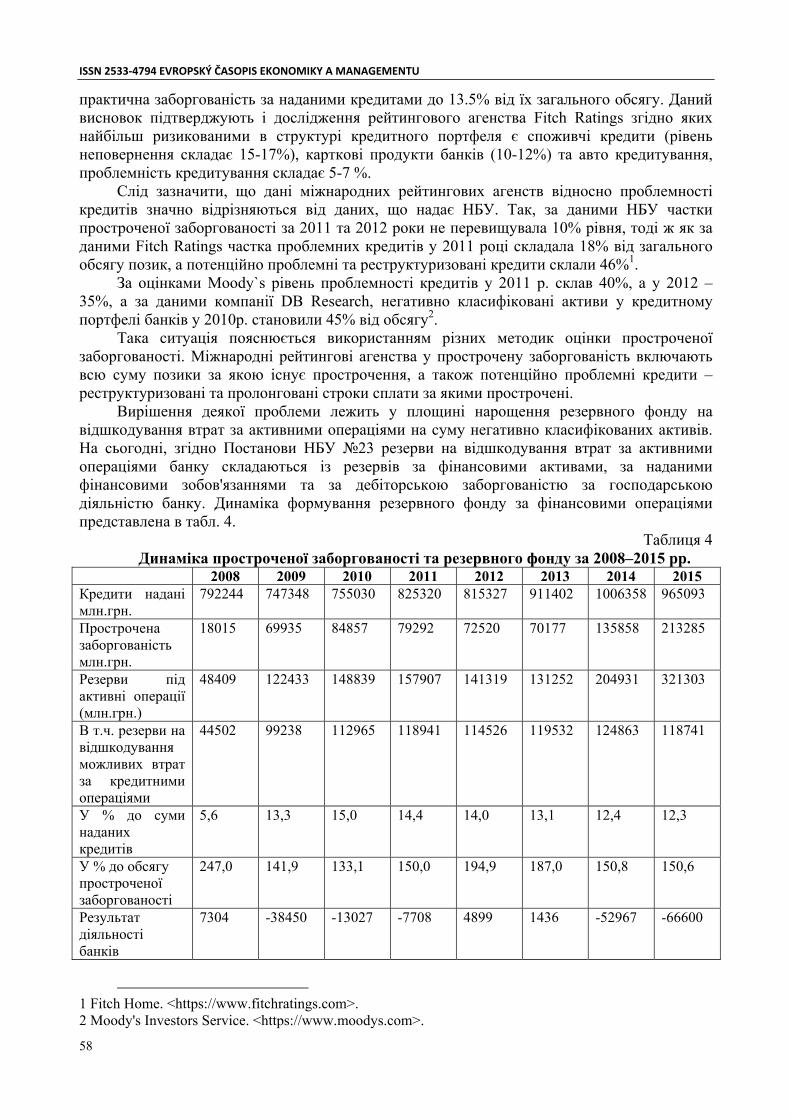
ISSN 2533‐4794 EVROPSKÝ ČASOPIS EKONOMIKY A MANAGEMENTU
58
практична заборгованість за наданими кредитами до 13.5% від їх загального обсягу. Даний висновок підтверджують і дослідження рейтингового агенства Fitch Ratings згідно яких найбільш ризикованими в структурі кредитного портфеля є споживчі кредити (рівень неповернення складає 15-17%), карткові продукти банків (10-12%) та авто кредитування, проблемність кредитування складає 5-7 %.
Слід зазначити, що дані міжнародних рейтингових агенств відносно проблемності кредитів значно відрізняються від даних, що надає НБУ. Так, за даними НБУ частки простроченої заборгованості за 2011 та 2012 роки не перевищувала 10% рівня, тоді ж як за даними Fitch Ratings частка проблемних кредитів у 2011 році складала 18% від загального обсягу позик, а потенційно проблемні та реструктуризовані кредити склали 46%1.
За оцінками Moody`s рівень проблемності кредитів у 2011 р. склав 40%, а у 2012 – 35%, а за даними компанії DB Research, негативно класифіковані активи у кредитному портфелі банків у 2010р. становили 45% від обсягу2.
Така ситуація пояснюється використанням різних методик оцінки простроченої заборгованості. Міжнародні рейтингові агенства у прострочену заборгованість включають всю суму позики за якою існує прострочення, а також потенційно проблемні кредити – реструктуризовані та пролонговані строки сплати за якими прострочені.
Вирішення деякої проблеми лежить у площині нарощення резервного фонду на відшкодування втрат за активними операціями на суму негативно класифікованих активів. На сьогодні, згідно Постанови НБУ №23 резерви на відшкодування втрат за активними операціями банку складаються із резервів за фінансовими активами, за наданими фінансовими зобов'язаннями та за дебіторською заборгованістю за господарською діяльністю банку. Динаміка формування резервного фонду за фінансовими операціями представлена в табл. 4.
Таблиця 4 Динаміка простроченої заборгованості та резервного фонду за 2008–2015 рр.
2008 2009 2010 2011 2012 2013 2014 2015 Кредити надані млн.грн.
792244 747348 755030 825320 815327 911402 1006358 965093
Прострочена заборгованість млн.грн.
18015 69935 84857 79292 72520 70177 135858 213285
Резерви під активні операції (млн.грн.)
48409 122433 148839 157907 141319 131252 204931 321303
В т.ч. резерви на відшкодування можливих втрат за кредитними операціями
44502 99238 112965 118941 114526 119532 124863 118741
У % до суми наданих кредитів
5,6 13,3 15,0 14,4 14,0 13,1 12,4 12,3
У % до обсягу простроченої заборгованості
247,0 141,9 133,1 150,0 194,9 187,0 150,8 150,6
Результат діяльності банків
7304 -38450 -13027 -7708 4899 1436 -52967 -66600
1 Fitch Home. <https://www.fitchratings.com>. 2 Moody's Investors Service. <https://www.moodys.com>.
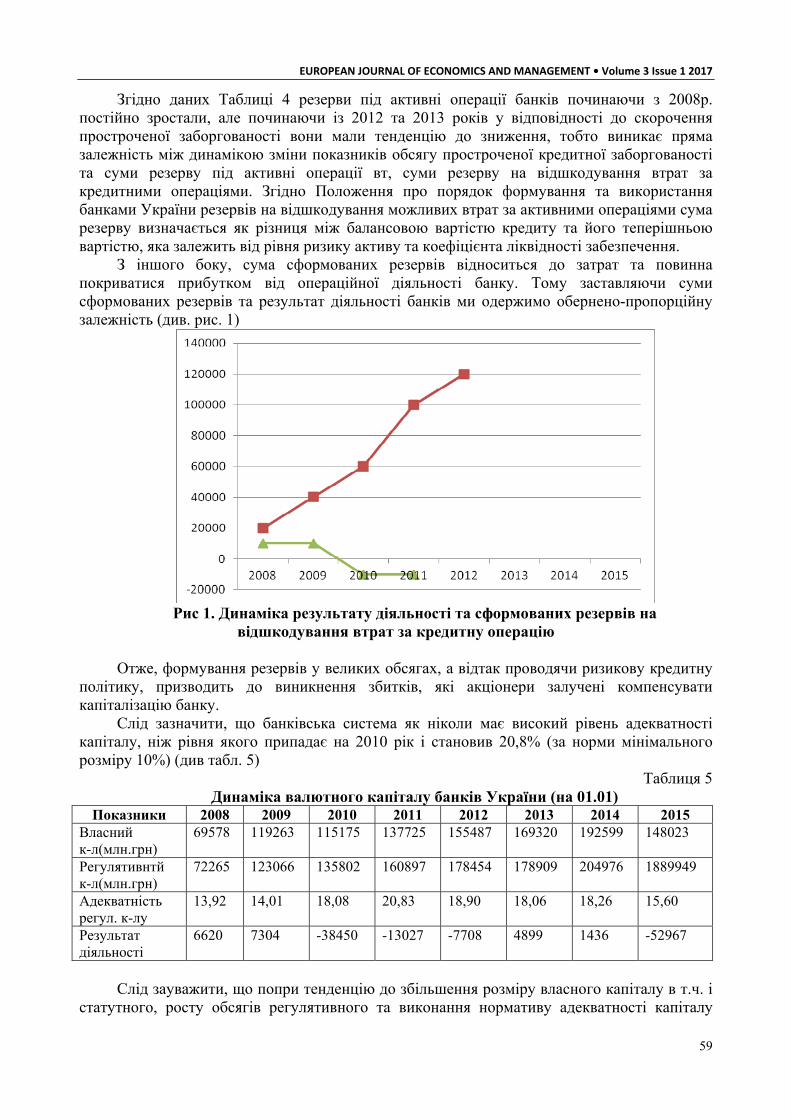
EUROPEAN JOURNAL OF ECONOMICS AND MANAGEMENT • Volume 3 Issue 1 2017
59
Згідно даних Таблиці 4 резерви під активні операції банків починаючи з 2008р. постійно зростали, але починаючи із 2012 та 2013 років у відповідності до скорочення простроченої заборгованості вони мали тенденцію до зниження, тобто виникає пряма залежність між динамікою зміни показників обсягу простроченої кредитної заборгованості та суми резерву під активні операції вт, суми резерву на відшкодування втрат за кредитними операціями. Згідно Положення про порядок формування та використання банками України резервів на відшкодування можливих втрат за активними операціями сума резерву визначається як різниця між балансовою вартістю кредиту та його теперішньою вартістю, яка залежить від рівня ризику активу та коефіцієнта ліквідності забезпечення.
З іншого боку, сума сформованих резервів відноситься до затрат та повинна покриватися прибутком від операційної діяльності банку. Тому заставляючи суми сформованих резервів та результат діяльності банків ми одержимо обернено-пропорційну залежність (див. рис. 1)
Рис 1. Динаміка результату діяльності та сформованих резервів на
відшкодування втрат за кредитну операцію Отже, формування резервів у великих обсягах, а відтак проводячи ризикову кредитну
політику, призводить до виникнення збитків, які акціонери залучені компенсувати капіталізацію банку.
Слід зазначити, що банківська система як ніколи має високий рівень адекватності капіталу, ніж рівня якого припадає на 2010 рік і становив 20,8% (за норми мінімального розміру 10%) (див табл. 5)
Таблиця 5 Динаміка валютного капіталу банків України (на 01.01)
Показники 2008 2009 2010 2011 2012 2013 2014 2015 Власний к-л(млн.грн)
69578 119263 115175 137725 155487 169320 192599 148023
Регулятивнтй к-л(млн.грн)
72265 123066 135802 160897 178454 178909 204976 1889949
Адекватність регул. к-лу
13,92 14,01 18,08 20,83 18,90 18,06 18,26 15,60
Результат діяльності
6620 7304 -38450 -13027 -7708 4899 1436 -52967
Слід зауважити, що попри тенденцію до збільшення розміру власного капіталу в т.ч. і
статутного, росту обсягів регулятивного та виконання нормативу адекватності капіталу

ISSN 2533‐4794 EVROPSKÝ ČASOPIS EKONOMIKY A MANAGEMENTU
60
банків необхідно збільшувати «запал міцності» тобто нарощувати обсяги власного капіталу. Адже в регулятивному капіталі враховано тільки кредитний та валютний ризики, а всі інші банківські ризики( процентний, інвестиційний операційний) на які наражалися банки у кризові роки та відповідно зазнавати значних збитків, про що свідчить дані табл. 5.
Проте, слід зазначити, що обмеженість внутрішніх фінансових джерел стає одним із основних факторів, які стримують підвищення рівня капіталізації вітчизняного банківського сектору. Тому , б іноземне інвестування як джерело фінансових ресурсів в процесі капіталізації може стати важливим фактором посилення ролі банків в економічних процесах.
Висновки. В процесі участі іноземного капіталу у формуванні капіталу необхідно вжити зі сторони НБУ ряд заходів для мінімізації ризиків, які супроводжують процес залучення іноземних інвестицій, тобто посилати регулятивний вплив НБУ та відповідні банківські установи шляхом обчислення дострокового вилучення інвестицій тощо.
Фінансова криза показала ряд недоліків у функціонуванні вітчизняної банківської системи, зокрема:
низьку рентабельність активів через їх загальну низьку якість; недостатній рівень капіталізації банків; низький рівень банківського менеджменту та ризик - менеджменту – зокрема; низький рівень управління ризиками, панування та стратегій розвитку; недостатню ефективність банківського нагляду щодо оцінки ризиків; необхідність прискорення роботи щодо реалізації підходів Базелю ІІ «Міжнародна
конвергенція вимірювання капіталу і стандартів капіталу: нові підходи» впровадження яких сприятиме наближенню оцінки достатності капіталу вітчизняних банків до міжнародних стандартів.
References: 1. Meshcheryakov, A.A. (2006). Orhanizatsiyno-tekhnolohichni aspekty pidvyshchennya efektyvnosti funktsionuvannya komertsiynoho banku: monohrafiya [Organizational-technological aspects of improving functioning of commercial banks: monograph]. Kyiv: Nauk. Svit. [in Ukrainian]. 2. Kovalenko, V.V. (2008). Efektyvnist systemy v umovakh hlobalnoyi konkurentsiyi [The effectiveness of a system in a global competition]. Aktualni problemy ekonomiky [Actual problems of economy], 5(83), 169-176. [in Ukrainian]. 3. Richni zvity NBU za 2008 – 2015 roky [Annual reports of the NBU for 2008 - 2015 years]. <http://www.bank.gov.ua/> [in Ukrainian]. 4. Richnyy zvit NBU za 2008 rik [National Bank Annual Report for 2008]. <http://www.bank.gov.ua/> [in Ukrainian]. 5. Fitch Home <https://www.fitchratings.com> [in English]. 6. Moody's Investors Service <https://www.moodys.com> [in English].

EUROPEAN JOURNAL OF ECONOMICS AND MANAGEMENT • Volume 3 Issue 1 2017
61
Вікторія Федосова Київський національний університет імені Тараса Шевченка, Україна
СИСТЕМА ОПОДАТКУВАННЯ ДОХОДІВ ГРОМАДЯН: НОВА ПАРАДИГМА ДЛЯ УКРАЇНИ Viktoriya Fedosova Taras Shevchenko National University of Kyiv,Ukraine
INCOME TAXATION SYSTEM: A NEW PARADIGM FOR UKRAINE
The article substantiates the necessity of construction a new model of income taxation in Ukraine. The main purpose of these changes is to strengthen and stimulating social functions of taxes on income and improving on this basis individual solvency in segments of current consumption, investment and savings. The new model of income taxation should be based on the following key elements: the use of individual and joint taxation; the introduction of non‐taxable minimum level of real living wage; the establishment of an effective system of tax
preferences, both individual and group; implementation of integrated taxation by assessing the total tax burden on income taxes at introduction the source of payment which is not income
derived from the use of the objects from which new taxes are paid, but current income.
Key words: income taxation, taxation of households, non‐taxable minimum, Ukraine.
Постановка проблеми. Україна постійно декларує необхідність якісної трансформації національної податкової системи, акцентуючи увагу на перетворенні її в ефективний інструмент стимулювання економічного зростання, каталізатор активізації ділової активності, дієвий важіль забезпечення фінансової стійкості територій. Водночас практичні кроки у напрямі реформування податкового законодавства свідчать про загалом досить спрощений підхід у цьому напрямі. Зусилля законодавця зводяться, головним чином, до формального перегляду складу податків з наступним об’єднанням окремих з них в укрупнені групи (наприклад, в частині екологічного податку), підвищення розмірів податкових ставок (включаючи їх щорічну індексацію на індекс інфляції), запровадження нових податків (наприклад, майнових), зменшення обсягу пільгового оподаткування (зокрема, в частині механізму повернення податку на додану вартість для господарюючих суб’єктів в агропромисловому секторі тощо). За своїм змістом (якщо не враховувати окремі заходи організаційного плану з удосконалення окремих елементів адміністрування податків, включаючи, наприклад, запровадження електронного кабінету платника податку, впорядкування податкових перевірок тощо) законодавчі новели у сфері оподаткування зводяться, як правило, до посилення фіскальної функції податкової системи в країні.
Не є виключенням з цього тренду і сегмент оподаткування доходів громадян, в якому, з точки зору оцінки сукупного фіскального тиску, спостерігається збільшення податкового навантаження на статки населення, причому як поточні, так і сформовані у попередні періоди. Це, у свою чергу, одночасно із суттєвим збільшенням видатків на оплату спожитих житлово-комунальних послуг через удорожчання останніх, активним знеціненням національної грошової одиниці внаслідок інфляції та девальвації, негативно впливає на платоспроможність населення у сферах поточного споживання та здійснення заощаджень, звужуючи ємність відповідних ринків та обмежуючи можливості зростання ділової активності в реальному та фінансовому секторах національної економіки. Подолання цих негативних тенденцій вбачається в якісній трансформації системи оподаткування доходів громадян в Україні на основі формування нової парадигми, яка забезпечувала б органічне поєднання її стимулюючої, регулюючої та фіскальної функцій, що сприяло б належному

ISSN 2533‐4794 EVROPSKÝ ČASOPIS EKONOMIKY A MANAGEMENTU
62
балансуванню загальносуспільних та індивідуальних інтересів. Аналіз останніх досліджень і публікацій. Проблематика оподаткування доходів
громадян загалом знаходить належне місце в наукових дослідженнях. Водночас слід констатувати, що увага вітчизняних науковців концентрується
переважно на дослідженні таких її аспектів, як: джерела формування ресурсної бази місцевого самоврядування, включаючи її поелементну структуру, в широкому аспекті в контексті загальної проблеми реформи територіальної організації влади, фінансово-бюджетної децентралізації, підвищення спроможності територіальних громад (Ю.Ганущак, Ю.Шушкова); порядок адміністрування податку на доходи фізичних осіб, його статус (Н.Проць, І.Луніна, М.Трещов, О.Крайник, С.Слухай, Н.Здерка, Ю.Петленко, С.Бондар, І.Патока). При цьому серед дослідників зазначеної проблематики до цього часу не вироблено єдиної позиції щодо порядку адміністрування податку на доходи фізичних осіб, його статусу, обсягу компетенції органів місцевого самоврядування щодо встановлення ставок цього податку чи надбавок до них, недостатньо досліджені питання трансформації бюджетоутворюючої функції податку на доходи громадян в контексті загальної трансформації системи оподаткування доходів громадян, насамперед, в частині запровадження податку на майно, відмінне від земельної ділянки, покликаного певною мірою виконувати роль компенсатора втрат доходів бюджету, пов’язаних з недоліками адміністрування податку на доходи фізичних осіб, диспропорцій в ресурсному забезпеченні бюджетів територіальних громад в залежності від обраної моделі їх розвитку тощо.
Попри достатньо високу активність досліджень проблематики фінансів домогосподарств (Т.Кізима, О.Кириленко, Г.Багатюк, В.Головенко, Х.Демчишин, А.Миропольська, В.Погорілець, О.Прокопчук, І.Юрик), такі її сегменти як оподаткування доходів домогосподарств, сім’ї, формування розгалуженої системи дієвих податкових стимулів для інвестування власних доходів в підвищення людського капіталу (освіта, охорона здоров’я тощо), схильності до споживання та заощаджень, реалізацію програм підвищення комфортності та економічності власного житла тощо, а також взаємозв’язок між оподаткуванням та такими базовими категоріями, як добробут, рівень життя тощо залишаються, варто зауважити необгрунтовано, з нашої точки зору, малодослідженими. Їх торкаються лише окремі дослідники (С.Юрій, Т.Кізима, І.Радько), проте саме зазначений напрям, як вбачається, є перспективним з точки зору формування бачення майбутньої моделі системи оподаткування особистих доходів.
Метою статті є визначення стратегічних напрямів формування нової моделі системи оподаткування доходів громадян в Україні.
Виклад основного матеріалу дослідження. У сфері законодавчого регулювання оподаткування доходів громадян Україна пройшла кілька етапів – від Декрету Кабінету Міністрів України «Про прибутковий податок з громадян» (від 1993 р.) до Закону України «Про податок з доходів фізичних осіб» (з 2004 р.) та згодом до Податкового кодексу України (з 2011 р. до цього часу). Водночас слід констатувати, що, не дивлячись на зміну інструментів регулювання, зазначений процес не супроводжувався якісною зміною загальної схеми оподаткування особистих доходів. Законодавчим змінам, як засвідчує їх аналіз, властивий загалом косметичний та вибірковий характер, оскільки вони стосувалися окремих елементів податку на доходи фізичних осіб без сутнісної зміни самої моделі оподаткування, орієнтація на посилення фіскальної функції податку.
Систематизація змін до Податкового кодексу України в частині удосконалення порядку оподаткування доходів громадян, наприклад, засвідчує, що вони зводились, головним чином, до уточнення положень, які визначають базу оподаткування, зокрема, в частині доходів, які включаються до загального місячного (річного) оподатковуваного доходу платника податку (12 змін), складу доходів, які не включаються до розрахунку загального місячного (річного) оподатковуваного доходу (17 змін), порядку застосування

EUROPEAN JOURNAL OF ECONOMICS AND MANAGEMENT • Volume 3 Issue 1 2017
63
права на податкову знижку (4 зміни) та переліку витрат, дозволених до включення до такої податкової знижки (1 зміна), порядку нарахування, утримання та сплати (перерахування) податку до бюджету (6 змін), особливостей нарахування (виплати) та оподаткування окремих видів доходів (14 змін), порядку оподаткування доходів від окремих операцій (продаж рухомого та нерухомого майна, спадщина, дарування тощо) (4 зміни).
Дев’ять змін було спрямовано на зміну розміру ставки податку, причому у бік збільшення. Зокрема, якщо на момент прийняття Податкового кодексу України (02.12.2010 р.) основна ставка податку становила 15% бази оподаткування та 17% у разі перевищення загальної суми отриманих платником податку у звітному податковому місяці доходів десятикратний розмір мінімальної заробітної плати, встановленої законом на 1 січня звітного податкового року, при цьому пасивні доходи, до яких, зокрема, відносяться процент на поточний або депозитний (вкладний) банківський рахунок, процентний або дисконтний дохід за іменним ощадним (депозитним) сертифікатом, дивіденди, оподатковувалися за ставкою 5%, то на сьогодні (січень 2017 р.) загальна ситуація суттєво змінилася. Так, основна ставка податку становить вже 18% бази оподаткування. При цьому за цією ж ставкою (18%) оподатковуються пасивні доходи (крім доходів у вигляді дивідендів по акціях та корпоративних правах, нарахованих резидентами - платниками податку на прибуток підприємств, які оподатковуються за ставкою 5%). Такими пасивними доходами, зокрема, є: проценти (у тому числі дисконтні доходи), в тому числі на поточний або депозитний (вкладний) банківський рахунок, вклад (депозит) у кредитних спілках; процентний або дисконтний дохід за іменним ощадним (депозитним) сертифікатом; плата (відсотки), що розподіляється відповідно до пайових членських внесків членів кредитної спілки; дохід, який виплачується компанією, що управляє активами інституту спільного інвестування, на розміщені активи; дохід за іпотечними цінними паперами (іпотечними облігаціями та сертифікатами); відсотки (дисконт), отримані власником облігації від їх емітента; дохід за сертифікатом фонду операцій з нерухомістю та дохід, отриманий платником податку у результаті викупу (погашення) управителем сертифікатів фонду операцій з нерухомістю; інвестиційний прибуток, включаючи прибуток від операцій з облігаціями внутрішніх державних позик, у тому числі від зміни курсу іноземної валюти; роялті; дивіденди. Також за ставкою 18% оподатковується дохід в частині перевищення суми пенсії (включаючи суму її індексації, нараховану відповідно до закону), щомісячного довічного грошового утримання, які отримуються платником податку з Пенсійного фонду України чи бюджету згідно із законом1.
При формуванні перспективної моделі оподаткування доходів громадян вбачається доцільним орієнтуватися, принаймні, на такі наступні її основні елементи.
1. На нашу думку, така модель повинна передбачати можливість застосування як індивідуального, так і спільного (виходячи із сукупного доходу сім’ї, домогосподарства) оподаткування. Вибір способу оподаткування платником (платниками) податку, з нашої точки зору, має бути добровільним, виключно за заявницьким принципом. Платник податку повинен сам оцінювати майбутні переваги та вигоди від того чи іншого способу оподаткування для себе та своєї сім’ї (домогосподарства) в залежності від характеру взаємовідносин в ній її членів, власної мотиваційної поведінки кожного з них щодо управління своїми статками тощо. Підхід, за якого допускається наявність лише одного способу оподаткування (його, зокрема, дотримується Т.О.Кізима, яка зазначає, що «з огляду на складну демографічну ситуацію та песимістичні прогнози фахівців, пов’язані з негативними змінами у кількісному і якісному складі українських родин, визнано за
1 Податковий кодекс України 2010 (Верховна Рада України). Офіційний сайт Верховної Ради України. <http://zakon0.rada.gov.ua/rada/show/2755-17> (2017, січень, 18).

ISSN 2533‐4794 EVROPSKÝ ČASOPIS EKONOMIKY A MANAGEMENTU
64
доцільне здійснювати поступовий перехід від індивідуального оподаткування доходів громадян до спільного оподаткування доходів сім’ї за прикладом розвинених країн світу»1), на наше переконання, видається недостатньо обґрунтованим, з точки зору, насамперед, обмеження платника податку в розпорядженні власними доходами.
2. Незалежно від того, в який спосіб оподатковуватимуться доходи громадян – індивідуально, чи сукупно, виходячи з доходу сім’ї чи домогосподарства, вбачається доцільним запровадження неоподатковуваного мінімуму. Такий мінімум, на нашу думку, має бути встановлений на рівні прожиткового мінімуму. При цьому у випадку оподаткування сукупного доходу сім’ї чи домогосподарства, тобто при спільному оподаткуванні, розмір такого неоподатковуваного мінімуму має становити суму прожиткових мінімумів, встановлених для відповідних соціальних і демографічних груп населення, з розрахунку на кожного члена таких сім’ї чи домогосподарства. Обов’язковою умовою при такому підході також вбачається доцільним використовувати саме реальний прожитковий мінімум, що повною мірою відповідало б сутності цієї категорії та її цільовій спрямованості, сприяючи, а також сприяло реалізації соціальної функції податку на доходи громадян.
На необхідність застосування такого підходу вказує, зокрема, Т.О.Кізима, яка пропонує «… при оподаткуванні доходів від найманої праці надавати право платнику податку при спільному (об’єднаному) оподаткуванні доходів сім’ї зменшувати розмір доходу, що підлягає оподаткуванню, на величину неоподатковуваного мінімуму доходів громадян (встановлену на рівні реального прожиткового мінімуму), кратну кількості членів сім’ї, які перебувають на утриманні платника податку»2.
Потреба у застосуванні саме реального значення прожиткового мінімуму зумовлена, передусім, самою сутністю цього поняття. Національне законодавство, зокрема, кваліфікує «прожитковий мінімум», як вартісну величину достатнього для забезпечення нормального функціонування організму людини, збереження його здоров’я набору продуктів харчування, а також мінімального набору непродовольчих товарів та мінімального набору послуг, необхідних для задоволення основних соціальних і культурних потреб особистості3.
На жаль, на сьогодні фактичний розмір прожиткового мінімуму, за вітчизняним законодавством, використовується лише для «спостереження за динамікою рівня життя в Україні»4, проте не виступає базовим державним соціальним стандартом, на основі якого мали б визначатися державні соціальні гарантії та стандарти у сферах доходів населення, житлово-комунального, побутового, соціально-культурного обслуговування, охорони здоров’я та освіти, як це, власне, передбачено Законом України «Про державні соціальні стандарти та державні соціальні гарантії»5. У 2016 р., наприклад, фактичний розмір
1 Кізима, Т.О. (2011). Фінанси домогосподарств: концептуальні засади теорії і практики. Автореф. Дис…. доктора економічних наук: спеціальність: 08.00.08. <http://library.tneu.edu.ua/images/stories/praci_vukladachiv/Факултет%20Фінансів/Каф%20фінансів/Кізима%20Т/дисертація/11KTOTIP.pdf> (2017, січень, 10). 2 Кізима, Т.О. (2011). Фінанси домогосподарств: концептуальні засади теорії і практики. Автореф. Дис…. доктора економічних наук: спеціальність: 08.00.08. <http://library.tneu.edu.ua/images/stories/praci_vukladachiv/Факултет%20Фінансів/Каф%20фінансів/Кізима%20Т/дисертація/11KTOTIP.pdf> (2017, січень, 10). 3 Закон про державні соціальні стандарти та державні соціальні гарантії 2000 (Верховна Рада України). Офіційний сайт Верховної Ради України. <http://zakon0.rada.gov.ua/rada/show/2017-14> (2017, січень, 14). 4 Закон про прожитковий мінімум 1999 (Верховна Рада України). Офіційний сайт Верховної Ради України. <http://zakon0.rada.gov.ua/rada/show/966-14> (2017, січень, 14). 5 Закон про державні соціальні стандарти та державні соціальні гарантії 2000 (Верховна Рада України). Офіційний сайт Верховної Ради України. <http://zakon0.rada.gov.ua/rada/show/2017-14> (2017, січень, 14).

EUROPEAN JOURNAL OF ECONOMICS AND MANAGEMENT • Volume 3 Issue 1 2017
65
прожиткового мінімуму (тобто реальна вартість мінімального споживчого кошика товарів і послуг без податків), розрахований Міністерством соціальної політики України, складав 2810 грн. на одну особу1, що удвічі більше за середньозважений показник прожиткового мінімуму, встановлений на цей рік Законом України «Про Державний бюджет України на 2016 рік» (1388 грн.)2.
Одночасно слід зауважити, що і фактичний розмір прожиткового мінімуму, який розраховується Міністерством соціальної політики України відповідно до вимог законодавства, не відповідає величині реального прожиткового мінімуму. Такий висновок виникає, зокрема, з розрахунків, які проводяться Федерацією професійних спілок України. Наприклад, якщо розрахований Міністерством соціальної політики України відповідно до Закону України «Про прожитковий мінімум» фактичний розмір прожиткового мінімуму у цінах липня 2016 року у розрахунку на місяць на одну особу становив 2709 грн. (з урахуванням суми податку на доходи фізичних осіб – 2929 грн.), для працездатних осіб – 2780 грн. (з урахуванням суми податку на доходи фізичних осіб – 3156 грн.), то «згідно з розрахунками профспілок, фактичний розмір прожиткового мінімуму для працездатних осіб у цінах липня 2016 року, скоригований на суму обов’язкових платежів відповідно до рішення Конституційного Суду України від 22.05.2008 № 10-рп, мав становити 3454 грн. (на 2004 грн. більше, ніж офіційно встановлено Державним бюджетом України на 2016 рік)», у зв’язку із чим «офіційна величина прожиткового мінімуму в середньому на одну особу, встановлена на липень 2016 року статтею 7 Закону України «Про державний бюджет України на 2016 рік», занижена порівняно з фактичним розміром прожиткового мінімуму на одну особу на 1310 грн. або на 93,6 %, а для працездатної особи на 1706 грн. або 117,7 %»3.
Ще один висновок, який об’єктивно випливає з наведеного, полягає в коректності кваліфікації прожиткового мінімуму, який затверджується законом про Державний бюджет України на відповідний рік, саме в якості прожиткового мінімуму в розумінні цього поняття, визначеного у законах України «Про державні соціальні стандарти та державні соціальні гарантії» та «Про прожитковий мінімум». Суттєва відмінність в розмірах усіх наведених показників – «прожитковий мінімум, встановлений законом України про Державний бюджет України на відповідний рік», «фактичний прожитковий мінімум» та «реальний прожитковий мінімум» – дозволяє говорити про прожитковий мінімум, який затверджується щорічними законами про Державний бюджет України, як про рівень забезпечення, власне, прожиткового мінімуму. Принагідно зауважимо, що таке поняття вже введене в національне законодавство Законом України «Про державну соціальну допомогу малозабезпеченим сім’ям», в якому, зокрема, зазначено, що «до стабілізації економічного становища в Україні розмір державної соціальної допомоги визначається з урахуванням рівня забезпечення прожиткового мінімуму. Рівень забезпечення прожиткового мінімуму встановлюється виходячи з реальних можливостей видаткової частини Державного бюджету України і затверджується одночасно з прийняттям закону про Державний бюджет України на відповідний рік»4.
Наведене дає підстави для висновку про наявність значної проблеми при визначенні
1 Фактичний розмір прожиткового мінімуму у 2015-2016 роках. Офіційний сайт Міністерства соціальної політики України. <http://www.msp.gov.ua/news/12286.html> (2017, січень, 16). 2 Закон про Державний бюджет України на 2016 рік 2015 (Верховна Рада України). Офіційний сайт Верховної Ради України. <http://zakon0.rada.gov.ua/rada/show/928-19/print> (2017, січень, 14). 3 Прожитковий мінімум в цінах липня 2016 року. Офіційний сайт Федерації профспілок України, <http://www.fpsu.org.ua/napryamki-diyalnosti/sotsialnij-zakhist/10742-prozhitkovij-minimum-v-tsinakh-lipnya-2016-roku> (2017, січень, 17). 4 Закон про державну соціальну допомогу малозабезпеченим сім’ям 2000 (Верховна Рада України). Офіційний сайт Верховної Ради України. <http://zakon0.rada.gov.ua/rada/show/1768-14> (2017, січень, 16).
ISSN 2533‐4794 EVROPSKÝ ČASOPIS EKONOMIKY A MANAGEMENTU
66
показника прожиткового мінімуму, який дійсно слід вважати реальним прожитковим мінімумом і який, відповідно, можна було б використовувати в якості неоподатковуваного мінімуму при оподаткуванні доходів громадян.
Водночас, якщо тимчасові обмеження щодо застосування показника «реальний прожитковий мінімум», певною мірою можна з цим погодитися, у сфері визначення розміру різноманітних соціальних допомог зумовлені загальною обмеженістю бюджетного ресурсу та існуючою системою його формування, то у сфері оподаткування будь-які обмеження на використання саме такого показника видаються необґрунтованими та, зрештою, неприйнятними. У такому разі не йдеться про прямі бюджетні видатки, збільшення яких дійсно видається доволі проблематичним. Водночас запровадження у сферу оподаткування доходів громадян неоподатковуваного мінімуму у вигляді реального прожиткового мінімуму дозволить значною мірою за рахунок упорядкування податкових інструментів переорієнтувати особистий доход на дієвий важіль зростання рівня життя громадянина та членів його сім’ї, підвищення платоспроможності індивідуума у сферах поточного споживання, приватного інвестування та заощаджень.
3. З останнім безпосередньо пов’язана дієва система податкових преференцій, як індивідуальних, так і групових (наприклад, так званих «сімейних коефіцієнтів», які застосовуються при спільному оподаткуванні і які, як зазначає, наприклад, Т.О.Кізима, «враховують економічні та соціальні умови, сімейний стан і вік платника»1). Узагальнений аналіз існуючих в Україні податкових преференцій при оподаткуванні доходів громадян, визначених чинним законодавством України, дозволяє зробити висновок про загалом досить обмежений їх асортимент та загалом низьку дієвість з точки зору стимулюючого ефекту (на чому наголошують й окремі дослідники, наприклад, Л.Задорожня2). Формування дієвої системи податкових преференцій в частині оподаткування особистих доходів має здійснюватися, на нашу думку, в кількох напрямах:
удосконалення діючих преференцій, зокрема, тих, що спрямовані на: підвищення рівня доступу громадян до системи освіти (тут мають усуватися обмеження щодо: контингенту користувачів встановленими законодавством пільгами при оплаті їх навчання у вітчизняних вищих та професійно-технічних закладах коштом господарюючого суб’єкта, незалежно від характеру подальших стосунків такого користувача із зазначеним суб’єктом; розміру суми коштів на оплату навчання, яка не включається до сукупного оподатковуваного доходу особи, яка навчається, в тому числі в залежності від виду навчання тощо), іпотечного кредитування (шляхом, наприклад, застосування при включенні до податкової знижки у зменшення оподатковуваного доходу платника податку за наслідками звітного податкового року частини суми процентів, сплачених таким платником податку за користування іпотечним житловим кредитом, корегуючих (у бік збільшення) коефіцієнтів до коефіцієнта, що враховує мінімальну площу житла для визначення податкової знижки, в залежності від складу сім’ї платника податку), збільшення інвестиційних можливостей платника податку в частині індивідуального житлового будівництва (шляхом, наприклад, виключення частини відповідних витрат з оподатковуваного доходу за умови, зокрема, що сукупний оподатковуваний доход відповідних домогосподарств в розрахунку на одного члена такого домогосподарства не перевищує певну суму), підвищення стимулюючої ролі податку на доходи громадян в частині здійснення останніми заощаджень, в тому числі шляхом інвестування в різноманітні
1 Кізима, Т.О. (2011). Фінанси домогосподарств: концептуальні засади теорії і практики. Автореф. Дис…. доктора економічних наук: спеціальність: 08.00.08. <http://library.tneu.edu.ua/images/stories/praci_vukladachiv/Факултет%20Фінансів/Каф%20фінансів/Кізима%20Т/дисертація/11KTOTIP.pdf> (2017, січень, 10) 2 Задорожня, Л. (2015). Оцінка ефективності пільг з податку на доходи фізичних осіб в Україні. Економіст, 9, 29-33. <http://ua-ekonomist.com/archive/2015/9/Zadorognia.pdf> (2017, січень, 12).

EUROPEAN JOURNAL OF ECONOMICS AND MANAGEMENT • Volume 3 Issue 1 2017
67
фінансові інструменти, розміщення коштів у вигляді депозитних вкладів у фінансових корпораціях (шляхом, наприклад, повернення до оподаткування пасивних доходів за заниженою ставкою (наприклад, 5%)) тощо;
розширення асортиментної структури податкових преференцій за рахунок запровадження нових (йдеться, передусім, про: податкові преференції так званого енергетичного спрямування, де вбачається доцільним вести мову про зняття обмежень щодо кола суб’єктів, при наданні відповідної фінансової допомоги з боку яких на реалізацію проектів з енергозбереження сума такої допомоги може бути віднесена до доходів, які не включаються до розрахунку загального місячного (річного) оподатковуваного доходу, віднесення до таких витрат суми процентів при користуванні кредитом фінансової установи, наданого на реалізацію такого проекту, застосування диференційованих понижуючих коефіцієнтів в залежності від типу проекту енергозбереження, який реалізує платник податку, включення до податкової знижки витрат також витрат на придбання автомобіля (чи іншого транспортного засобу) з електричним двигуном; податкові преференції так званого інфраструктурного типу, де перспективними і загалом новими напрямами підвищення стимулюючої ролі податку на доходи фізичних осіб можна вважати розширення переліку витрат, на суму яких може зменшуватися оподатковуваний доход, та/або застосування понижуючих коефіцієнтів до основної ставки податку у разі здійснення платником податку таких витрат, як оплата послуг за приєднання до систем енергопостачання (електро-, газо-, водопостачання), фінансування капіталомістких інфраструктурних проектів, таких, як асфальтування вулиць, прокладання центральних мереж електро-, газо-, водопостачання та водовідведення (при застосуванні відповідної податкової преференції вбачається доцільним, з огляду на розмір понесених витрат, також проведення взаємозаліку між понесеними платником податку відповідними витратами та нарахованою йому сумою податку на нерухоме майно, відмінне від земельної ділянки (при суттєвому перевищенні суми відповідних витрат над сумою майнового податку, яку неможливо покрити протягом окремого бюджетного року, такий взаємозалік має бути пролонгований на період до моменту повного покриття таких витрат майновим податком). Якщо ж проведення зазначеного взаємозаліку неможливе з причини, зокрема, невстановлення у відповідному населеному пункті податку на нерухоме майно, відмінне від земельної ділянки, доцільно передбачати пряму компенсацію такому платнику податку понесених ним відповідних витрат за рахунок бюджетних коштів) тощо).
4. Із запровадженням в Україні податку на майно, відмінне від земельної ділянки, як на нашу думку, актуалізується проблема оцінки сукупного податкового навантаження на доходи громадян при запровадженні податків, джерелом сплати яких виступають не доходи, отримані від використання об’єктів, з яких сплачуються такі нові податки, а поточні доходи громадян. Йдеться, насамперед, про податок на нерухоме майно, відмінне від земельної ділянки, в частині нерухомості, яка використовується в якості основного місця проживання платника податку та членів його сім’ї. Річ у тому, що зазначений податок поширюється на нерухомість, яка не приносить доходу (більш того, збудована чи придбана на кошти, з яких вже сплачений податок). Отже джерелом сплати відповідного майнового податку виступає виключно поточний доход, а у випадку недостатності такого – доход, сформований у попередні періоди, або ж кредитні ресурси. Відтак, недостатність коштів на сплату відповідного майнового податку містить значний ризик втрати житла (що, до речі, передбачено чинним податковим законодавством). Варіант зміни об’єкта оподаткування, що є власністю платника податку, часто передається з покоління в покоління, збудований власноруч таким платником податку тощо, нами апріорі вважається неприйнятним, оскільки алогічно позбавляти громадянина житла (власності) лише на підставі запровадження нових податків, які жодним чином не прив’язані до доходу такого громадянина та покликані сплачуватися з об’єкта, який забезпечує реалізацію конституційного права громадянина на житло, збудоване чи придбане в законний спосіб,

ISSN 2533‐4794 EVROPSKÝ ČASOPIS EKONOMIKY A MANAGEMENTU
68
причому на доходи, з яких вже сплачений податок. При запровадженні ж подібного податку на відповідний об’єкт нерухомості вбачається доцільним, по-перше, здійснення його значної диференціації в залежності від типу нерухомості (такої, що використовується в якості основного місця проживання, а всередині такої – з диференціацією податкових ставок в розрізі житлової та нежитлової площі, господарських будівель; іншої житлової нерухомості, що є у власності платника податку та теоретично може приносити доход від здачі її в оренду тощо, комерційної нерухомості), по-друге, запровадження так званої «лінії відсікання», за якої сукупне фіскальне навантаження на платника податку в частині стягнення з отриманого протягом звітного періоду (року) доходу не перевищувало б певну величину (виключно у випадку оподаткування домоволодіння, яке використовується платником податку в якості основного місця проживання), або ж залишок доходу (в середньомісячному обчисленні) після сукупного оподаткування був не меншим за величину, кратну певній кількості реальних прожиткових мінімумів.
Висновки. В Україні на порядку денному стоїть питання оновлення податкової системи загалом, а в її складі системи оподаткування доходів фізичних осіб. Йдеться про комплекс якісних трансформаційних змін, спрямованих на побудову нової моделі оподаткування особистих доходів. Основна мета таких змін – через посилення стимулюючої та соціальної функцій податків на доходи підвищити індивідуальну платоспроможність в сегментах поточного споживання, інвестицій та заощаджень, зменшити контингент суспільства, залежного від бюджетного ресурсу у вигляді різноманітних соціальних допомог, житлових субсидій тощо. У даному випадку вбачається слушною позиція І.Лютого, Д.Осецької, за якою «для соціального розвитку суспільства досить важливим є стабільність і підтримання на безпечному рівні необхідних для існування соціуму суттєвих параметрів, що відображені у системі соціальних стандартів рівня та якості життя населення»1. Відповідно, законодавчі ініціативи у цьому напрямі мають забезпечити якісний перехід до моделі, яка забезпечувала б: застосування як індивідуального, так і спільного (виходячи із сукупного доходу сім’ї, домогосподарства) оподаткування; запровадження, незалежно від того, в який спосіб оподатковуватимуться доходи громадян – індивідуально, чи сукупно, виходячи з доходу сім’ї чи домогосподарства, неоподатковуваного мінімуму на рівні реального прожиткового мінімуму (у випадку оподаткування сукупного доходу сім’ї чи домогосподарства, тобто при спільному оподаткуванні, розмір такого неоподатковуваного мінімуму має становити суму прожиткових мінімумів, встановлених для відповідних соціальних і демографічних груп населення, з розрахунку на кожного члена таких сім’ї чи домогосподарства); створення дієвої системи податкових преференцій, як індивідуальних, так і групових, шляхом як удосконалення діючих преференцій, зокрема, тих, що спрямовані на підвищення рівня доступу громадян до системи освіти, іпотечного кредитування, збільшення інвестиційних можливостей платника податку в частині індивідуального житлового будівництва, підвищення стимулюючої ролі податку на доходи громадян в частині здійснення останніми заощаджень, в тому числі шляхом інвестування в різноманітні фінансові інструменти, розміщення коштів у вигляді депозитних вкладів у фінансових корпораціях, так і розширення асортиментної структури податкових преференцій за рахунок запровадження нових (енергетичного спрямування, інфраструктурного типу, тощо); запровадження інтегрованого оподаткування шляхом оцінки сукупного податкового навантаження на доходи громадян при запровадженні податків, джерелом сплати яких виступають не доходи, отримані від використання об’єктів, з яких сплачуються такі нові податки, а поточні доходи громадян (в Україні на сьогодні таким є, насамперед, податок на нерухоме
1 Лютий, І., Осецька, Д. (2014). Соціальні пріоритети фіскальної політики в посткризовий період. Вісник Київського національного університету імені Тараса Шевченка, 1 (154), 28-33. <http://bulletin-econom.univ.kiev.ua/wp-content/uploads/2016/04/154.pdf> (2017, січень, 10).

EUROPEAN JOURNAL OF ECONOMICS AND MANAGEMENT • Volume 3 Issue 1 2017
69
майно, відмінне від земельної ділянки, в частині нерухомості, яка використовується в якості основного місця проживання платника податку та членів його сім’ї).
References: 1. Zadorozhnya, L. (2015). Otsinka efektyvnosti pilh z podatku na dokhody fizychnykh osib v Ukrayini [Evaluating the effectiveness of tax exemptions on personal income in Ukraine]. Ekonomist [Eсonomist], 9, 29-33. <http://ua-ekonomist.com/archive/2015/9/Zadorognia.pdf> (2017, January, 12). [in Ukrainian]. 2. Zakon pro Derzhavnyy byudzhet Ukrayiny na 2016 rik [Law on the State Budget of Ukraine for 2016] 2015 (Verkhovna Rada Ukrayiny). Ofitsiinyi sait Verkhovnoi Rady Ukrainy [The official website of the Verkhovna Rada of Ukraine]. <http://zakon0.rada.gov.ua/rada/show/928-19/print> (2017, January, 14). [in Ukrainian]. 3. Zakon pro derzhavni sotsial'ni standarty ta derzhavni sotsial'ni harantiyi [The law on state social standards and state social guarantees] 2000 (Verkhovna Rada Ukrayiny). Ofitsiinyi sait Verkhovnoi Rady Ukrainy [The official website of the Verkhovna Rada of Ukraine]. <http://zakon0.rada.gov.ua/rada/show/2017-14> (2017, January, 14). [in Ukrainian]. 4. Zakon pro derzhavnu sotsial'nu dopomohu malozabezpechenym simyam [The law on state social assistance to low-income families] 2000 (Verkhovna Rada Ukrayiny). Ofitsiinyi sait Verkhovnoi Rady Ukrainy [The official website of the Verkhovna Rada of Ukraine]. <http://zakon0.rada.gov.ua/rada/show/1768-14> (2017, January, 16). [in Ukrainian]. 5. Zakon pro prozhytkovyy minimum [The law on the subsistence minimum] 1999 (Verkhovna Rada Ukrayiny). Ofitsiinyi sait Verkhovnoi Rady Ukrainy [The official website of the Verkhovna Rada of Ukraine]. <http://zakon0.rada.gov.ua/rada/show/966-14> (2017, January, 14). [in Ukrainian]. 6. Kizyma, T.O. (2011). Finansy domohospodarstv: kontseptual'ni zasady teoriyi i praktyky [Personal finance: conceptual bases of theory and practice]. Avtoreferat dysertatsiyi na zdobuttya naukovoho stupenya doktora ekonomichnykh nauk: spetsial'nist' 08.00.08 – hroshi, finansy i kredyt [Thesis for the degree of doctor of economic sciences, specialty 08.00.08 - Money, Finance and Credit]. <http://library.tneu.edu.ua/images/stories/praci_vukladachiv/Факултет%20Фінансів/Каф%20фінансів/Кізима%20Т/дисертація/11KTOTIP.pdf> (2017, January, 10). [in Ukrainian]. 7. Lyutyy, I., Osetska, D. (2014). Sotsialni priorytety fiskalnoyi polityky v postkryzovyy period [Social priorities of fiscal policy in the post-crisis period]. Visnyk Kyyivskoho natsionalnoho universytetu imeni Tarasa Shevchenka [Bulletin of Kyiv National Taras Shevchenko University], 1 (154), 28-33. <http://bulletin-econom.univ.kiev.ua/wp-content/uploads/2016/04/154.pdf> [in Ukrainian]. 8. Podatkovyy kodeks Ukrayiny [The Tax Code of Ukraine] 2010 (Verkhovna Rada Ukrayiny). Ofitsiinyi sait Verkhovnoi Rady Ukrainy [The official website of the Verkhovna Rada of Ukraine]. <http://zakon0.rada.gov.ua/rada/show/2755-17> (2017, January, 18). [in Ukrainian]. 9. Prozhytkovyy minimum v tsinakh lypnya 2016 roku [Living costs in prices in July 2016]. Ofitsiynyy sayt Federatsiyi profspilok Ukrayiny [The official website of the Federation of Trade Unions of Ukraine]. <http://www.fpsu.org.ua/napryamki-diyalnosti/sotsialnij-zakhist/10742-prozhitkovij-minimum-v-tsinakh-lipnya-2016-roku> (2017, January, 17). [in Ukrainian]. 10. Faktychnyy rozmir prozhytkovoho minimumu u 2015-2016 rokakh [The actual cost of living in the years 2015-2016]. Ofitsiynyy sayt Ministerstva sotsial'noyi polityky Ukrayiny [The official website of the Ministry of Social Policy of Ukraine]. <http://www.msp.gov.ua/news/12286.html> (2017, January, 16). [in Ukrainian].
ISSN 2533‐4794 EVROPSKÝ ČASOPIS EKONOMIKY A MANAGEMENTU
70
Віра Хомутенко, к. е. н. Одеський науково‐дослідний експертно‐криміналістичний центр МВС України Алла Хомутенко, к. е. н. Одеський національний економічний університет, Україна
ФРАГМЕНТАРНИЙ АНАЛІЗ МЕХАНІЗМУ ДІЇ РЕГУЛЮЮЧОЇ ФУНКЦІЇ ПОДАТКУ НА ПРИБУТОК ПІДПРИЄМСТВ В УКРАЇНІ Vira Khomutenko, PhD in Economics Odesa Research Forensic Center of the Ministry of Internal Affairs of Ukraine
Аlla Khomutenko, PhD in Economics Odesa National Economic University, Ukraine
FRAGMENTARY ANALYSIS OF THE MECHANISM OF REGULATORY FUNCTION OF CORPORATE INCOME TAX IN UKRAINE
The mechanism of taxation of corporate profits in Ukraine is investigated in the article. It analyzed statistical data describing the basic elements of corporate income tax namely: object, taxpayer, tax rate, tax incentives, calculation of tax. The evaluation of the quantity of taxpayers on profits of enterprises and results of their operations allowed asserting deterioration of economic activity in the country in the 2014‐2015 biennium. It is negative display the tax revenues to the state budget. Research of benefits provided by corporate income tax showed that in recent years their list was significantly reduced; as a result budget losses occurred. It is discovered that regulatory capacity of corporate income tax was not fully used in Ukraine. Systemic weaknesses of taxation mechanism for enterprises profit formed the need to address them. Key words: enterprise, income tax, regulatory function, tax revenues, tax credits
У сучасних економічних умовах України досить гостро постає питання оптимізації державних фінансових ресурсів, у тому числі за рахунок удосконалення механізму формування дохідної бази бюджету. Як відомо, основним джерелом доходів бюджету виступають податкові надходження, серед яких одним з головних бюджетоутворюючих податків є податок на прибуток підприємств.
Складні політичні та економічні умови, нестабільність та складність вітчизняного законодавства, значний податковий тягар на бізнес обумовлюють необхідність проведення податкового реформування в Україні взагалі та механізму прибуткового оподаткування зокрема. Це питання в нинішніх умовах господарювання постає надзвичайно гостро, адже застосування ефективного механізму оподаткування прибутку підприємств перетворює податок на прибуток на дієвий інструмент збалансованого динамічного економічного зростання на засадах інноваційно-інвестиційного розвитку.
Одним з основних елементів механізму оподаткування прибутку підприємств є об’єкт оподаткування, законодавче уявлення про який за період незалежності України змінювалось декілька разів. Спочатку об’єктом був валовий дохід (1992 р., ІІ-IV квартал 1993 р., 1994 р.), потім – виручка від реалізації (1995-1996 рр.), а І квартал 1993 р. та з 1997

EUROPEAN JOURNAL OF ECONOMICS AND MANAGEMENT • Volume 3 Issue 1 2017
71
р. по теперішній час – прибуток1. Зауважимо, що порядок визначення такого об’єкту оподаткування переглядався вдвічі частіше, зокрема, в останнє – у 2015 р., коли було здійснено спробу максимального наближення порядку визначення прибутку, що підлягає оподаткуванню, до бухгалтерського обліку. Водночас, через діючий механізм визначення податкової амортизації дані про величину прибутку у податковому та бухгалтерському обліку залишатимуться різними. Таким чином, з одного боку, впроваджені реформи прибуткового оподаткування спрямовані на підвищення ефективності дії механізму оподаткування прибутку, а з іншого – вони негативно впливають на платників податків, яким із року в рік доводиться пристосовуватися до нових правил. З метою вирішення цієї проблеми необхідно ввести мораторій на внесення змін у податкове законодавство принаймні на два роки.
Оскільки об’єктом оподаткування податком на прибуток підприємств сьогодні виступає прибуток із джерелом походження з України та за її межами проаналізуємо динаміку цього показника. Проведений аналіз за період з 2008 по 2015 рр. засвідчив збільшення обсягу прибутку українських підприємств приблизно у 2 рази, що не відіграло суттєвої ролі у порівнянні зі збільшенням збитку в 5 разів (рис. 1). Темпи росту збитку за досліджуваний період суттєво випереджали темпи росту прибутку підприємств, що негативно позначилось на надходженнях податку на прибуток до державного бюджету України, приріст яких був від’ємним у 2015 р. у порівнянні з 2014 р. – 12,9%, а у порівнянні з 2011 р. – 36,5%. До основних причин таких тенденцій можна віднести економічну й політичну нестабільність в країні, а також тимчасову окупацію Автономної республіки Крим та Донецької й Луганської областей.
Рис. 1. Динаміка обсягів прибутку та збитку підприємств України за 2011-2015 рр.2
Показниками, які характеризують економічний розвиток країни та можуть
здійснювати суттєвий вплив на обсяги надходжень податку на прибуток до бюджету є розміри та кількість платників цього податку. Зазначимо, що у 2011-2013 рр. відбувалось поступове зростання, а вже у 2014 р. різке зменшення кількості платників податку на прибуток (на 16 тис. осіб), що свідчить про погіршення у цей період ділової активності в країні (табл. 1). Натомість, у 2015 р. ситуація покращилась: кількість платників податку на прибуток зросла на 19 тис. осіб, що пояснюється збільшенням кількості новостворених
1 Молодецька, О.М., Буркова Л.А., Семеняка Т.В. (2016). Трансформація податкової системи України. Бухгалтерський облік, аналіз та аудит, Вип. 2, 710-714. <http://www.economyandsociety.in.ua/journal/2_ukr/126.pdf>. 2 Cкладено автором за даними Державної служби статистики України. <http://www.ukrstat.gov.ua/>.
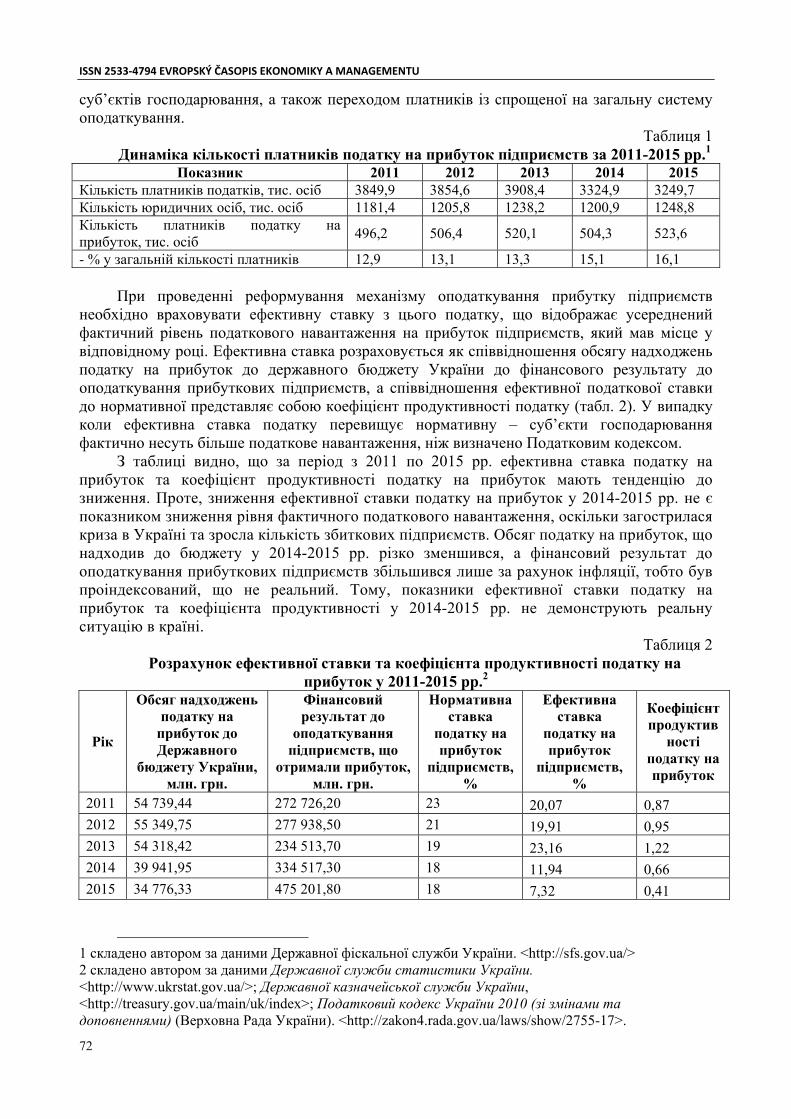
ISSN 2533‐4794 EVROPSKÝ ČASOPIS EKONOMIKY A MANAGEMENTU
72
суб’єктів господарювання, а також переходом платників із спрощеної на загальну систему оподаткування.
Таблиця 1 Динаміка кількості платників податку на прибуток підприємств за 2011-2015 рр.1
Показник 2011 2012 2013 2014 2015 Кількість платників податків, тис. осіб 3849,9 3854,6 3908,4 3324,9 3249,7 Кількість юридичних осіб, тис. осіб 1181,4 1205,8 1238,2 1200,9 1248,8 Кількість платників податку на прибуток, тис. осіб
496,2 506,4 520,1 504,3 523,6
- % у загальній кількості платників 12,9 13,1 13,3 15,1 16,1 При проведенні реформування механізму оподаткування прибутку підприємств
необхідно враховувати ефективну ставку з цього податку, що відображає усереднений фактичний рівень податкового навантаження на прибуток підприємств, який мав місце у відповідному році. Ефективна ставка розраховується як співвідношення обсягу надходжень податку на прибуток до державного бюджету України до фінансового результату до оподаткування прибуткових підприємств, а співвідношення ефективної податкової ставки до нормативної представляє собою коефіцієнт продуктивності податку (табл. 2). У випадку коли ефективна ставка податку перевищує нормативну – суб’єкти господарювання фактично несуть більше податкове навантаження, ніж визначено Податковим кодексом.
З таблиці видно, що за період з 2011 по 2015 рр. ефективна ставка податку на прибуток та коефіцієнт продуктивності податку на прибуток мають тенденцію до зниження. Проте, зниження ефективної ставки податку на прибуток у 2014-2015 рр. не є показником зниження рівня фактичного податкового навантаження, оскільки загострилася криза в Україні та зросла кількість збиткових підприємств. Обсяг податку на прибуток, що надходив до бюджету у 2014-2015 рр. різко зменшився, а фінансовий результат до оподаткування прибуткових підприємств збільшився лише за рахунок інфляції, тобто був проіндексований, що не реальний. Тому, показники ефективної ставки податку на прибуток та коефіцієнта продуктивності у 2014-2015 рр. не демонструють реальну ситуацію в країні.
Таблиця 2 Розрахунок ефективної ставки та коефіцієнта продуктивності податку на
прибуток у 2011-2015 рр.2
Рік
Обсяг надходжень податку на
прибуток до Державного
бюджету України, млн. грн.
Фінансовий результат до
оподаткування підприємств, що
отримали прибуток, млн. грн.
Нормативна ставка
податку на прибуток
підприємств, %
Ефективна ставка
податку на прибуток
підприємств, %
Коефіцієнт продуктив
ності податку на прибуток
2011 54 739,44 272 726,20 23 20,07 0,87 2012 55 349,75 277 938,50 21 19,91 0,95 2013 54 318,42 234 513,70 19 23,16 1,22 2014 39 941,95 334 517,30 18 11,94 0,66 2015 34 776,33 475 201,80 18 7,32 0,41
1 складено автором за даними Державної фіскальної служби України. <http://sfs.gov.ua/> 2 складено автором за даними Державної служби статистики України. <http://www.ukrstat.gov.ua/>; Державної казначейської служби України, <http://treasury.gov.ua/main/uk/index>; Податковий кодекс України 2010 (зі змінами та доповненнями) (Верховна Рада України). <http://zakon4.rada.gov.ua/laws/show/2755-17>.

EUROPEAN JOURNAL OF ECONOMICS AND MANAGEMENT • Volume 3 Issue 1 2017
73
За рахунок використання податкових інструментів держава має можливість впливати на інвестиційну активність підприємств. Саме тому в умовах зношеності основних фондів, наявності застарілих технології виробництва, аварійності будівель та споруд актуалізується необхідність використання значного регулюючого потенціалу податку на прибуток, який сприятиме збільшенню капітальних інвестицій. Як свідчать офіційні дані, зі зростанням обсягу капітальних інвестицій зменшується ступінь зносу основних засобів. Так, ступінь зносу основних засобів по Україні за період з 2011 по 2015 рр. був найбільшим у 2014 р. – 83,5%, при найменшому обсязі капітальних інвестицій – 219419,9 млн. грн., а найменшим у 2015 р. – 60,1%, при величині капітальних інвестицій 273116,4 млн. грн.1 Таким чином, вирішити проблему модернізації матеріально-технічної бази національного господарства можливо за рахунок збільшення обсягу капітальних інвестицій, у т. ч. й іноземних, суттєвий вплив на які має рівень податкового навантаження.
З рис. 2 видно, що між рівнем податкового навантаження та обсягом прямих іноземних інвестицій в Україну існує прямий зв’язок (рис. 2). Тобто, зменшення рівня загального податкового навантаження на підприємства дозволить збільшити частку прямих іноземних інвестицій, яка у 2015 р. склала лише 3% усіх капітальних інвестицій, тоді як власні кошти підприємств становили 67,5%2.
Рис. 2. Динаміка обсягу прямих іноземних інвестицій в Україну та рівня загального податкового навантаження на підприємства у 2011-2015 рр.3
Позитивний вплив на обсяги капітальних інвестицій, зокрема, та на розвиток
підприємницької діяльності взагалі мають такі податкові інструменти як пільги. Водночас, податкові пільги негативно позначаються на обсягах надходжень податку на прибуток до бюджету. За період з 2011 по 2015 рр. в Україні спостерігається тенденція до скорочення кількості пільговиків та, в результаті, – суми отриманих пільг. Скорочення переліку пільг з податку на прибуток вплинуло на значне зменшення питомої ваги втрат доходів бюджету від надання пільг з податку на прибуток з 25,97% у 2011 р. до 0,43% у 2015 р., зменшення питомої ваги інших податкових пільг з податку на прибуток з 18,23% у 2011 р. до 2,07% у 2014 р. та зменшення питомої ваги загальної суми отриманих податкових пільг з податку на прибуток з 20,40% у 2011 р. до 4,53 у 2014 р., що є позитивною характеристикою з
1 Державна служба статистики України. <http://www.ukrstat.gov.ua/>. 2 Державна служба статистики України. <http://www.ukrstat.gov.ua/> 3 складено автором за даними Державної служби статистики України <http://www.ukrstat.gov.ua/>; Державної фіскальної служби України <http://sfs.gov.ua/>.

ISSN 2533‐4794 EVROPSKÝ ČASOPIS EKONOMIKY A MANAGEMENTU
74
фіскальної точки зору. Водночас, вже у 2015 р. відбулось встановлення нових податкових пільг з податку на прибуток, що призвело до зростання питомої ваги інших податкових пільг до 18,36% та зростання питомої ваги загальної суми отриманих податкових пільг з податку на прибуток підприємств до 13,52% (табл. 3).
Таблиця 3 Обсяги пільг з податку на прибуток підприємств за 2011-2015 рр.1
Кількість пільговиків Сума отриманих пільг, тис. грн. Роки Пільги, що є втратами
доходів бюджету Інші податкові
пільги Пільги, що є втратами
доходів бюджету Інші податкові
пільги
2011 5469 8178 15366764,09 27622044,57
2012 4334 4342 15108778,38 5200281,78
2013 2748 555 5533229,68 3252441,32
2014 1991 466 4622997,32 2624006,47
2015 391 1132 236990,63 27470035,87 Пільги з податку на прибуток класифікують як ті, що призводять до втрат бюджету та
інші податкові пільги. До першої групи відносять пільги, які мають безпосередній зв’язок з особливістю формування доходів та витрат платника, а також прибутку нерезидентів з урахуванням положень міжнародних договорів України. Під іншими податковими пільгами розуміються суми звільнень від оподаткування прибутку, у т. ч. звільнення від оподаткування доходу неприбуткових установ та організацій. Якщо розглядати частку пільг з податку на прибуток у надходженнях даного податку до державного бюджету України, то можемо бачимо, що частка втрат доходів бюджету за період 2011-2015 рр. значно зменшилась – з 28,07% до 0,68%, що є позитивною тенденцією. Частка інших податкових пільг з податку на прибуток підприємств також зменшилась з 50,46% у 2011 р. до 6,57% у 2014 р.2 Водночас, у 2015 р. відбулось суттєве збільшення суми інших пільг з податку на прибуток за рахунок впровадження нових пільг, зокрема було звільнено від оподаткування кошти спільного інвестування, витрати на недержавне пенсійне забезпечення, певні, визначені нормативно-правовими актами, результати від операцій з продажу або іншого відчуження цінних паперів та ін.3
У сучасних економічних умовах в Україні доцільно було б реформувати систему пільгового оподаткування, зокрема, у напрямку надання податкових пільг з податку на прибуток тим підприємствам, які провадять свою діяльність у галузях, що належать до пріоритетних, встановивши при цьому чіткі критерії надання пільг, за якими вивільнені кошти будуть спрямовуватися на інвестування, модернізацію, а не виводитися за кордон.
На відміну від України, в країнах Європейського Союзу пільги4 з податку на прибуток спрямовані на розвиток підприємництва шляхом стимулювання інноваційно-інвестиційної діяльності (табл. 4). Інвестиційні пільги, що застосовуються в усіх країнах Європейського Союзу схожі – це неоподатковувані резерви інвестиційного призначення, прискорена амортизація, інвестиційна податкова знижка, інвестиційний податковий кредит та податкові канікули5. Такі пільги сприяють збільшенню прибутку підприємств після сплати податку, тобто збільшенню чистого прибутку. Відмінності між вказаними пільгами полягають не
1 складено автором за даними Державної фіскальної служби України. <http://sfs.gov.ua/>. 2 складено автором за даними Державної фіскальної служби України <http://sfs.gov.ua/>. 3 Довідник пільг № 73/2. <http://www.visnuk.com.ua/ua/attentions/id/313>. 4 Хомутенко, А.В., Бзова, Ю.І. (2016). Адаптація зарубіжного досвіду оподаткування прибутку підприємств до вітчизняної практики. Науковий вісник ОНЕУ, 7 (239), 15-21. 5 Жидяк, О.Р. Вдосконалення системи оподаткування підприємницьких структур аграрної сфери. <http://www.economy.nayka.com.ua/?op=1&z=2092>

EUROPEAN JOURNAL OF ECONOMICS AND MANAGEMENT • Volume 3 Issue 1 2017
75
тільки у часі розподілу економії податків для підприємства, яке їх використовує, а й у механізмі їх впливу на потенціал такого суб’єкта господарювання.
Таблиця 4 Пільги з податку на прибуток підприємств, що застосовуються в країнах
Європейського Союзу та в Україні1 Пільга
Країна
Неоподатковувані резерви
Прискорена амортизація
Інвестиційна податкова
знижка
Інвестиційний податковий
кредит
Податкові канікули
Австрія + + - - -
Бельгія + + + - -
Великобританія + + + - -
Греція + + - - -
Данія + + + - -
Ірландія + + - + -
Італія + + + - +
Іспанія + + + + -
Люксембург + + - + -
Нідерланди + + + - -
Німеччина + + - - -
Португалія + + + + +
Україна - + - - +
Фінляндія + + - - -
Франція + + - + +
Швеція + + - - - Обрання того чи іншого виду пільги залежить від завдань податкової політики.
Наприклад, підвищенню ефективності інноваційної діяльності сприяють податкові канікули, які передбачають звільнення від оподаткування на певний час суб’єкта господарювання (як правило до п’яти років або на термін відшкодування підприємством витрат на капітальні інвестиції). Саме на необхідності застосування такого інструменту в Україні й наголошують урядові реформатори. Більш того, Україна вже має досвід застосування податкових канікул. Так, Податковим кодексом передбачалось, що до підприємств, утвореним після 1.04.2011 р., та тим, які відповідатимуть певним, нормативно-визначеним критеріям, застосовуватиметься 0% ставка з податку на прибуток до 1.01.2016 р.2 Аналогічну норму застосовуватимуть і до підприємств, зареєстрованим після 1.01.2017 р. Таким чином, стимулюючи утворення нових підприємств держава впливає на покращення ділової активності в країні, збільшення зайнятості населення та на зростання обсягу податкових надходжень в результаті цього. Водночас, цей інструмент не використовується в Україні з метою покращення інноваційно-інвестиційної діяльності вже існуючих підприємств.
З прийняттям Податкового кодексу в Україні дозволено використовувати метод прискореної амортизації, яка передбачає списання у перші роки експлуатації об’єкта амортизації більшої частини його вартості, при цьому, як наслідок – зменшується база оподаткування у більшій мірі, ніж при використанні звичайних методів амортизації3. Так, з
1 складено автором за даними: Литвиненко, Я.В., Якушик, І.Д. (2004). Податкові системи зарубіжних країн. Київ. 2 Державна фіскальна служба України. <http://sfs.gov.ua/>. 3 Податковий кодекс України 2010 (зі змінами та доповненнями) (Верховна Рада України). <http://zakon4.rada.gov.ua/laws/show/2755-17>.

ISSN 2533‐4794 EVROPSKÝ ČASOPIS EKONOMIKY A MANAGEMENTU
76
2011 р. українські підприємства мають можливість пришвидшеного списання транспортних засобів, машин та обладнання. Такі заходи, на нашу думку, сприятимуть оновленню виробничих потужностей підприємств, що дозволить підвищити рівень їх конкурентоспроможності.
Таким чином, дослідження показало, що в Україні не повною мірою використовують інструментарій податкового регулювання інвестиційно-інноваційної діяльності зокрема та підприємницької взагалі. До недоліків механізму оподаткування прибутку підприємств можна віднести: 1) складність розрахунку об’єкта оподаткування податком на прибуток, що проявляється у неповному зближенні бухгалтерського та податкового обліків, наявності механізму визначення податкової амортизації тощо; 2) низька ефективність ставки податку на прибуток, яка є тягарем для суб’єктів господарювання і майже не сприяє підвищенню економічного потенціалу підприємств, а змушує їх відходити у «тінь»; 3) нераціональна побудова системи податкових пільг, яка практично не стимулює інноваційно-інвестиційну діяльність та ін. З метою усунення зазначених системних недоліків механізму оподаткування прибутку підприємств України необхідно вжити заходи, які б сприяли зниженню податкового тягаря на підприємства, збільшенню потоку іноземних інвестицій у економіку, модернізації матеріально-технічної бази виробництва, підвищенню конкурентоспроможності українських підприємств, що дозволить вивести економіку на якісно новий рівень.
References: 1. Molodeczka, O.M., Burkova, L.A., Semenyaka, T.V. (2016). Transformaciya podatkovoyi systemy Ukrayiny [Transformation of tax system of Ukraine]. Buxgalterskyj oblik, analiz ta audyt [Accounting, Analysis and Audit], 2, 710-714. <http://www.economyandsociety.in.ua/journal/2_ukr/126.pdf> (2017, January, 29) [in Ukrainian]. 2. Derzhavna sluzhba statystyky Ukrayiny [The official website of the State Statistics Service of Ukraine]. <http://www.ukrstat.gov.ua/> (2017, January, 29) [in Ukrainian]. 3. Derzhavna fiskalna sluzhba Ukrayiny [The official website of the State Fiscal Service of Ukraine]. <http://sfs.gov.ua/> (2017, February, 5) [in Ukrainian]. 4. Derzhavna kaznachejska sluzhba Ukrayiny [The official website of the State Treasury Service of Ukraine]. <http://treasury.gov.ua/main/uk/index> (2017, February, 5) [in Ukrainian]. 5. Podatkovyj kodeks Ukrayiny [The Tax Code of Ukraine] (2010) [The official website of the Verkhovna Rada of Ukraine]. <http://zakon4.rada.gov.ua/laws/show/2755-17> (2017, February, 5) [in Ukrainian]. 6. Dovidnyk pilg [Handbook of benefits] (2015). <http://www.visnuk.com.ua/ua/attentions/id/313> (2017, February, 5) [in Ukrainian]. 7. Xomutenko, A.V., Bzova, Yu.I. Adaptaciya zarubizhnogo dosvidu opodatkuvannya prybutku pidpryyemstv do vitchyznyanoyi praktyky [Adaptation of the foreign experience of corporate income taxation to domestic practice], Naukovyj visnyk ONEU [Scientific Journal of Odesa National Economic University], 7 (239), 15-21. [in Ukrainian]. 8. Zhydyak, O.R. (2013) Vdoskonalennya systemy opodatkuvannya pidpryyemnyczkyx struktur agrarnoyi sfery [Perfection of taxation system of enterprise structures in agrarian sphere], 6. <http://www.economy.nayka.com.ua/?op=1&z=2092> (February 5, 2017). [in Ukrainian]. 9. Lytvynenko, Ya.V., Yakushyk, I.D. (2004). Podatkovi systemy zarubizhnyx krayin: Navch. posib. dlya stud. vuziv [Tax systems of foreign countries: Teach. guidances for students of universities]. Mizhregion. akad. upr. Personalom, 205. [in Ukrainian].

EUROPEAN JOURNAL OF ECONOMICS AND MANAGEMENT • Volume 3 Issue 1 2017
77
Larysa Prodanova, ScD in Economics Cherkasy State Technological University, Ukraine Karyna Sherstyukova Donetsk National University of Economics and Trade named after Mykhayilo Tuhan‐Baranovskyi, Kryvyi Rih, Ukraine
DISTRIBUTION AND REDISTRIBUTION OF NATURAL RESOURCE RENT: OPPORTUNITIES OF NATIONAL RENTAL FUND
The article substantiates the necessity of national rental fund creating and the possibility of its use as an instrument of distribution and redistribution of natural resource rent in the national economy has been studied. The concepts of redistribution of natural resource rent with the use of special storage and redistribution (national rent) funds tools have been determined. It is stressed that the general methodology and system of levers and distribution and redistribution tools of natural resource rent in the national economy is not coherent and does not provide the improvement of living standards and efficient use of essential component of national wealth − natural resources. Noted, that it is expedient to adhere to the established principles of the Fund organization and its management, to ensure implementation of socially important functions of the fund in the process of national rental fund creating. Key words: distribution and redistribution of income, natural resource rent, national rental fund.
Formulation of the problem. One of the most important unsolved problems of modern Ukrainian society remains low living standards and deepening the differentiation of its incomes. The sharp social stratification of society and poverty of its large part are caused by several factors, including unfair appropriation of profit from use of natural resources by a limited group of persons. According to the World Bank, share of natural capital (land, minerals, biological resources) in the structure of the national wealth of Ukraine is 23.5%1. In the world's leading economies an important role in the distribution and redistribution of derived income from the use of natural resources (natural resource rents) national rental funds play. Unfortunately, the general methodology and system of levers and distribution and redistribution tools of natural resource rent in Ukraine is not coherent and does not provide the improvement of living standards and efficient use of essential component of national wealth − natural resources. Therefore, it is necessary to find effective mechanisms of distribution and redistribution of natural resource rent, providing not only economic but social development too.
Analysis of recent research and publications. There are several concepts of redistribution of natural resource rent using a special storage and redistribution (national rent) funds tools. First of all should be noted the concept of national property and social dividend of D. Lvov2 and the concept of civil property and civil dividend of Yu. Razovskii3. According to the concept of D. Lvov: natural resources is an important part of national public property; source of income from the use of property - rent payments; every citizen has property rights and is entitled to income from the use of national assets; distribution and subsequent use of income (rent) are provided through social
1 The Changing Wealth of Nations: Measuring Sustainable Development in the New Millennium (2011). The World Bank. Washington, DC. <http://siteresources.worldbank.org/ENVIRONMENT/Resources/ChangingWealthNations.pdf.> (2016, December, 18). 2 Львов, Д.С. (2004). Вернуть народу ренту. Москва: Издательство Эксмо, Издательство Алгоритм. 3 Разовский, Ю.В., Макаркин, Ю.Н., Горенкова, Е.Ю. (2013). Минерально-сырьевой капитал. Москва: ИПО У Никитских ворот.

ISSN 2533‐4794 EVROPSKÝ ČASOPIS EKONOMIKY A MANAGEMENTU
78
security fund. The central element of national property system is the concept of a social dividend, which is based on the orientation of mechanism of natural rent spending on institutions that provide social guarantee of the minimum living standards and quality of life defined by objective possibilities, through which the mobilization of appropriate resources for address key challenges provides with the long term perspective. Social dividend is the sum of rental income generated after payment for services of all other factors of production. This is the net income of society, which goes to fund social security and can be distributed in equal shares among all its members.
According to the concept of Yu. Razovskii, providing every citizen with income from natural rent in the form of civil dividends (Civil rent) is possible on the basis of civil ownership of natural resources, which has a number of distinctive features1: public ownership (resources belong to all citizens equally in right of birth or citizenship); paid use (rent paid by all companies and organizations that exploit natural resources, both private corporations and governmental); government or other public order (licensing of natural resources, assessment of projects, monitoring for natural resources, determining the rent, its concentration and guidance to civil rental fund are provided by public or community organizations); private appropriation of rent (legislative equitable distribution of resources of all kinds rent in equal shares who are the owners of natural resources). Natural rent can be shared among citizens in natural form within the rules of free use2. Within this concept of natural rent (benefits, created by nature and used by man) in terms of money takes the form of civil dividends (Civil rent). Civic dividend is share of every citizen in the form of all absolute and part of differential rent. The resources obtained from the use of natural rent in the form of proceeds from the sale of rights (licenses) for Nature, income from the sale of stocks and rent for the use of natural resources, that exceeds the norm of free use, should be directed to civil dividends fund. Personal payments (equal size individual payments only on the basis of citizenship − civil dividends) from the fund must provide a guarantee of a distinct biological preservation and continuation of life to each citizen3.
The issue of national social / civil dividends fund creation on the basis of the mentioned concepts was explored by A. Sukhina, B. Matiukha, M. Movchan. The problem of rent in aspect of the state activity on creation of conditions for the welfare of all the people was analyzed by G. Zadorozhnyi and A. Katsuba. In their opinion, the system (fund) of national property (which allows to use effectively national wealth, especially basic resources, on which livelihoods of people in the country and its social formations are based) should become the real basis for revival of the Ukrainian nation4.
The purpose of the article is to substantiate the necessity of creation and studying of use of national rental fund as a tool of distribution and redistribution of natural resource rent in the national economy.
Results. Unlike Ukraine, Russia and Kazakhstan have repeatedly discussed the proposal to start the legal practice of distribution of natural rent as dividends.
In 2001, Russian scientists have formulated the concept of the Federal Law "On procedure of regulation of income generated in the use of natural resources"5. The purpose of the bill was to establish order in which every citizen of the Russian Federation was able to control the receipt and use of rents from industrial, commercial or other use of natural resources, using the right of choice
1 Разовский, Ю.В. (2013). Управление сверхприбылью от использования минерально-сырьевого капитала. Вестник Московского гуманитарного университета, 2, 170-176. 2 Разовский, Ю.В. (2011). Рента. Москва: Мирознание. <http://www.razovskiy.com/node/193.> (2016, October, 20). 3 Разовский, Ю.В., Матюха, В.В., Сухина, Е.Н., Мовчан, Н.Т. (2011). Развитие институтов недропользования России и Украины. Известия вузов. Горный журнал, 2, 44-50. 4 Задорожный, Г.В., Кацуба, А.В. (2013) Глобализирующееся знаниемное хозяйство: проблемы ренты и квазиренты. Монография. Харьков: Точка, 200. 5 Разовский, Ю., Макаркин, Ю. (2011, ноябрь). О порядке регулирования природной ренты. Бурение и Нефть журнал про газ и нефть. <http://burneft.ru/archive/issues/201111/12> (2016, November, 10).

EUROPEAN JOURNAL OF ECONOMICS AND MANAGEMENT • Volume 3 Issue 1 2017
79
and powers of deputies of representative bodies of Russia. Despite the positive feedback from deputies, scientists and experts, the bill was not considered because of resistance of uninterested structures. In 2003, for consideration by the State Duma was introduced Draft Law1, which included the establishment of state extra-budgetary fund for certain rights. It was planned that the fund will accumulate 80% of the rent of natural resources and through registered personal accounts will regularly distribute them according to the principle of equality between all citizens of Russia and in the future − invest some of that money directly into the economy. The source of fund formation at the beginning must become rent as a profit from the exploitation of mineral resources (hydrocarbons, ferrous and non-ferrous metals, precious metals), and later - and other natural resources (forest fund, water and biological resources, and others.). It was noted that the part of funds allocated to investment may not exceed 30% of the total fund. Investment sources considered first as increasing bank credit (due to constant fund of funds in credit institutions), and in the future − in the form of transfer of the fund directly in asset management to investment companies. Removing rent was planned through quality restructuring of the tax system by making appropriate changes to tax legislation. It was not just about rent payments. The authors of the bill stated: income distribution of natural resources among the population will actually reduce the tax burden on manufacturing industries, VAT, social payments. However, at the conclusion of the project noted that taxes and other charges for the use of natural resources is one of the main sources of budget incomes, funds are allocated for the funding of the tasks and functions of the state, including social character (pensions, benefits, wages of public sector employees, public investment in life-support systems and public healthcare). It is noted that the adoption of such a law would reduce opportunities to send additional state incomes from natural resources, the realization of socio-economic development and social support to low-income citizens. Thus, the proposal of solution the same issues, but by isolating and reducing and eventually elimination of corrupt component in the form of rent payments from the state budget distributive system was rejected.
Similar reasons for rejection of the sharing of oil rent among citizens were sounded and in Kazakhstan: first, possible growth of inflation and strengthening the national currency will result in reduction of competitiveness of domestic producers expect a reorientation of demand for imported products and the sharp rise in prices for domestic goods, especially housing, utilities, health care; secondly, the possible lack of funds and inadequate social obligations the state where a sharp decline in oil prices. The presence of the National Fund (undistributed among citizens) promotes fiscal stability of Kazakhstan2.
It should be noted that today in Kazakhstan and Russia funds for savings that are linked to natural resource rents still exist: "National Fund" (Kazakhstan, established in 2001) and "National Welfare Fund" ( Russia, established in 2008). But for the redistribution of natural rent among citizens these funds are not used.
One of the latest attempts to introduce natural rent redistribution among population is considered an entering of another bill to the State Duma in September 2016. The project, which gives citizens the right to get a part of federal incomes from mining, has been dubbed the "thirteenth salary"3. Initial annual payments will have same similarity. This legislative initiative
1 Проект Федерального закона о правах граждан России на доходы от использования природных ресурсов Российской Федерации. <http://www.consultant.ru/cons/cgi/online.cgi?req=doc&base=PRJ&n=19697#0> (2016, October, 15). 2 Указ о Концепции формирования и использования средств Национального фонда Республики Казахстан на среднесрочную перспективу 2005 (Президент Республики Казахстан). <https://tengrinews.kz/zakon/prezident_respubliki_kazahstan/finansyi/id-U050001641_/#z70> (2016, September, 22). 3 В Государственную Думу внесли проект о праве россиян на доходы от добычи полезных ископаемых. <https://ria.ru/economy/20160914/1476887439.html> (2016, сентябрь, 22).

ISSN 2533‐4794 EVROPSKÝ ČASOPIS EKONOMIKY A MANAGEMENTU
80
can also be called "labor" because the right to get their share of income will have not all Russian citizens, but only those who: have a work experience of at least nine months of the fiscal year and did not get unemployment benefits in this time; were registered in the employment service, but received no help; retirees who have at least five years of seniority. According to the authors, the bill, firstly, helps to avoid strengthening of such negative social phenomena as parasitism, and secondly, to encourage citizens to registration of labor relations in accordance with the law and helps to reduce the shadow economy. The project provides that the amount that is distributed will vary by year, the first financial year − 20% of income from natural resources in the country, and each next year − two per cent more than in the previous year. Shares of persons which are not used are not accumulated, not allocated to others, and must be transferred to the federal budget. Transfer of funds is planned to the personal accounts in the Sberbank of the Russian Federation. Despite some disadvantages, the approval of the project for the first time in legislative practice of Russia would regulate relations on creating of system of direct public access to income from natural resources.
It is predictable that if Russia and Kazakhstan − countries that are world exporters of mineral resources, refuse to accept the dividend program and redistribution of natural rent in favor of the country population, arguing their actions by lack of funds in the budget, Ukraine as energy-dependent state that imports a large volume of hydrocarbons, and certainly is not able to create any national rental fund.
However, according to the State Service of Geology and mineral resources, Ukraine is among the countries that have rich and diverse minerals. In the depths of Ukraine found nearly 20 thousand fields of natural resources and 117 deposits of minerals, including 8172 deposits which have 94 kinds of minerals and have commercial value and accounted by State reserves balance1.
Ukraine ranks first in the world in proven reserves of manganese ores; is among the leading countries of the world in resources and reserves of zirconium, titanium (monopoly producer in the CIS of titanium concentrates), uranium (in the top ten countries in the world and top in Europe, it is now opened and explored 21 deposits of uranium)2.
The first position in the European space Ukraine takes on proven reserves of coal, iron ore, kaolin, graphite, potassium sulphate and sodium salts, facing and decorative stones. Among the CIS states Ukraine occupies the first place in reserves of manganese ore and germanium, the second − coal, in reserves of iron ore, a number of rare metals. According to the metal assessment of resource base of rare metals, Ukraine ranks second in the CIS. One of the first places in Europe and the CIS is provided to Ukraine by large reserves, high diversity and medical properties of mineral water.
In the depths of Ukraine were revealed deposits and displays of almost all kinds of metallic and non-metallic minerals (Tabl. 1). To the industrial development is attracted from 40 to 100 percent of proven mineral reserves, on the basis of which is more than two thousand mining and processing enterprises work3.
1 Стан мінерально-сировинної бази України. Офіційний сайт Державної служби геології та надр України. <http://www.geo.gov.ua/storinka/stan-mineralno-syrovynnoyi-bazy-ukrayiny> (2017, January, 10). 2 Василенко, А.П. (2014). Мінерально-сировинна база України. Стаття 2. Стан мінерально-сировинної бази металічних корисних копалин України та основні напрями геологорозвідувальних робіт. Мінеральні ресурси України, 3, 3-7. 3 Стан мінерально-сировинної бази України. Офіційний сайт Державної служби геології та надр України. <http://www.geo.gov.ua/storinka/stan-mineralno-syrovynnoyi-bazy-ukrayiny> (2017, January, 10).

EUROPEAN JOURNAL OF ECONOMICS AND MANAGEMENT • Volume 3 Issue 1 2017
81
Table 1 Types of raw materials according to the industrial and economic importance of mineral
resources of Ukraine України1 Category A. Types of mineral raw materials which are mined intensively, characterized by significant proven reserves of minerals and components and are exported or can be considered as such with the purpose of providing in a short term of foreign exchange earnings and revenue to the state budget
1. Fuel and energy resources: gas, oil, condensate, coal, uranium 2. Metal Minerals 2.1 Ferrous metals: iron ore, manganese ore 2.2 Nonferrous and alloying: titanium
Category B. Types of mineral raw materials produced in limited quantities
3. Non-metallic minerals 3.1 Nonmetallic raw materials for metallurgy: − 3.2 Raw materials for mining and chemical complex and agriculture: native sulfur, potassium salt 3.3 Other non-metallic minerals, primary kaolin and gaize, limestone for sugar industry, rock debris materials
Category B. Types of minerals deposits of which are available, proven reserves, but the raw materials are produced in limited quantities or not produced at all
1. Fuel and energy resources: methane of coal deposits 2. Metal minerals. 2.1 Ferrous metals: − 2.2 Nonferrous and alloying: aluminum, nickel and cobalt 2.3 Rare and rare earth metals: lithium, rare earth and yttrium 2.4 Precious metals and diamonds: gold and silver 3. Non-metallic minerals 3.1 nonmetallic raw materials for metallurgy: flux limestone and dolomite, bentonite clay 3.2 Raw materials for mining and chemical complex and agriculture: - 3.3 Other non-metallic minerals, barite, graphite
Category D. Types of minerals deposits of which currently in Ukraine are not developed and not well studied, but may in the future become important for the economy of the state, taking into account the needs of other industries
1. Fuel and energy resources: high clayed raw materials, shale gas 2. Metal minerals. 2.1 Ferrous metals: chromium ores 2.2 Nonferrous and alloying: copper, lead, zinc, tin, tungsten, molybdenum 2.3 Rare and rare-earth metals, tantalum and niobium, zirconium and hafnium, scandium, trace elements - rhenium 2.4. Precious metals and diamonds, platinum, diamonds 3. Non-metallic minerals 3.1 Nonmetallic raw materials for metallurgy: fluorspar, bentonite clay, heat-resistant raw materials, magnesite, high clayed raw materials 3.2 Raw materials for the mining and chemical complex and agriculture: apatite, phosphates 3.3 Other non-metallic minerals, semiprecious raw materials, gluconate, quartzite and quartz sand for metallurgy and glass production, feldspar, manmade materials
However, consumption of significant amounts of oil and natural gas (fifth in the world in
terms of gas consumption after the USA, Russia, Germany and the UK) and insufficient domestic
1 Закон про затвердження Загальнодержавної програми розвитку мінерально-сировинної бази України на період до 2030 року 2011 (Верховна Рада України). Офіційний сайт Верховної Ради України. <http://zakon3.rada.gov.ua/laws/show/3268-17> (2016, грудень, 15).

ISSN 2533‐4794 EVROPSKÝ ČASOPIS EKONOMIKY A MANAGEMENTU
82
production that covers domestic oil consumption by 10-12% and gas − to 20-25%, forcing Ukraine to import these raw materials in large volumes (on the import of gas state ranks third in the world after the USA and Germany), which negatively affects the socio-economic development of the country1.
The only fossil hydrocarbon feedstock is coal (in the fuel-energy balance it is a leader), whose reserves can provide the needs of industry and energy of Ukraine in the next 200-500 years. If the structure of world fossil hydrocarbon feedstock coal is 67%, oil − 18% and gas − 15%, in Ukraine respectively 94.5%, 2% and 3.6%. Resources of coal in Ukraine to a depth of 1500 meters up 117.2 billion tons, of which 45.8 billion tons are explored balance reserves, among which 32.1 billion tons – power coal and 13.7 billion tons – coke coal2.
Specialists of the Institute of Environmental Economics and Sustainable Development of the National Academy of Sciences of Ukraine, the total value of the natural wealth of Ukraine is determined in the amount of 1.06 trillion UAH. In resource structure land capital is 44.7% of the total value of natural wealth, mineral - respectively 24.8%, timber − 7.9%, water − 6.4%3. That is the main resource is land capital, mineral resource takes a leading role in forming the productive capacity of the state, water and forests − have a significant structure forming and secondary importance for the national economy.
However, not all natural resources are wealth. It is essential that resources be ready for immediate use in commercial circulation and capitalized, that was the object of applying human activity and create added value. Ukraine is among the countries with middle level of natural resources (natural wealth of the world is about 44.6 trillion dollars USA), but with relatively reduced rates of natural wealth due to low level of capitalization of natural resources. Their incomplete capitalization is the main reason for the existence of poor countries with large quantity of natural and human resources. Indicators of natural wealth per capita in 2012 were 2,922 dollars USA (exchange rate 8.0 UAH / USD USA), which is 2.17 times less than the world. However, the natural wealth of Ukraine in terms of value equal to one tenth of the gold reserves of the world in general. The whole world gold reserves in 2014, according to US researchers, estimated at 30 thousand tons. Then 1.06 trillion UAH worth more than 3.0 thousand tons of gold at market prices (1 ton of gold is about 33 million dollars USA)4.
Thus, the natural wealth is enormous potential of direct use in production and the formation, distribution and redistribution of rental income in the system of national economy to their final use by the country's population. The limited land and natural reserves of raw materials is one of the conditions of rent, acquires a new meaning in terms of new objects for rental tax. We know that in today's world, number of natural factors and resources are increasing, bringing rents. Scientific and technical progress contributes to the opening of new fields, the emergence of technological capabilities for developing of resources that have not previously been used, to the using of mineral
1 Стан мінерально-сировинної бази України. Офіційний сайт Державної служби геології та надр України. <http://www.geo.gov.ua/storinka/stan-mineralno-syrovynnoyi-bazy-ukrayiny> (2017, January, 10). 2 Калько, А.Д. (2011). Про мінерально-сировинну безпеку як складову національної безпеки. Наукові записки, 1. <http://www.nbuv.gov.ua/old_jrn/Soc_Gum/NZTNPU/geogr/2011_1/6/003Kalko.pdf.> (2016, November, 20). 3 Хвесик, М., Бистряков, І., Клиновий, Д. (2016). Природне багатство України: загальнопорівняльна характеристика. Український журнал Економіст. <http://uaekonom.merkel.org.ua/12920prirodnebagatstvoukrayinizagalnoporvnyalnaharakteristika. Html> (2016, September, 11). 4 Хвесик, М., Бистряков, І., Клиновий, Д. (2016). Природне багатство України: загальнопорівняльна характеристика. Український журнал Економіст. <http://uaekonom.merkel.org.ua/12920prirodnebagatstvoukrayinizagalnoporvnyalnaharakteristika. Html> (2016, September, 11).
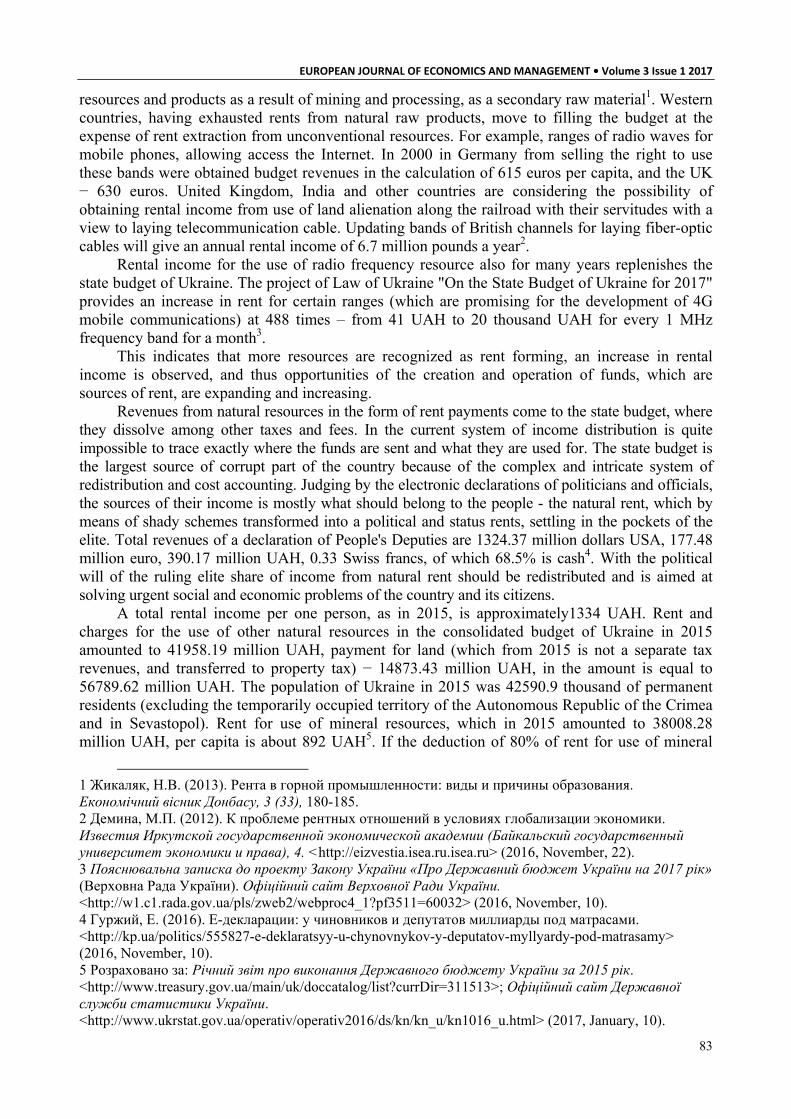
EUROPEAN JOURNAL OF ECONOMICS AND MANAGEMENT • Volume 3 Issue 1 2017
83
resources and products as a result of mining and processing, as a secondary raw material1. Western countries, having exhausted rents from natural raw products, move to filling the budget at the expense of rent extraction from unconventional resources. For example, ranges of radio waves for mobile phones, allowing access the Internet. In 2000 in Germany from selling the right to use these bands were obtained budget revenues in the calculation of 615 euros per capita, and the UK − 630 euros. United Kingdom, India and other countries are considering the possibility of obtaining rental income from use of land alienation along the railroad with their servitudes with a view to laying telecommunication cable. Updating bands of British channels for laying fiber-optic cables will give an annual rental income of 6.7 million pounds a year2.
Rental income for the use of radio frequency resource also for many years replenishes the state budget of Ukraine. The project of Law of Ukraine "On the State Budget of Ukraine for 2017" provides an increase in rent for certain ranges (which are promising for the development of 4G mobile communications) at 488 times – from 41 UAH to 20 thousand UAH for every 1 MHz frequency band for a month3.
This indicates that more resources are recognized as rent forming, an increase in rental income is observed, and thus opportunities of the creation and operation of funds, which are sources of rent, are expanding and increasing.
Revenues from natural resources in the form of rent payments come to the state budget, where they dissolve among other taxes and fees. In the current system of income distribution is quite impossible to trace exactly where the funds are sent and what they are used for. The state budget is the largest source of corrupt part of the country because of the complex and intricate system of redistribution and cost accounting. Judging by the electronic declarations of politicians and officials, the sources of their income is mostly what should belong to the people - the natural rent, which by means of shady schemes transformed into a political and status rents, settling in the pockets of the elite. Total revenues of a declaration of People's Deputies are 1324.37 million dollars USA, 177.48 million euro, 390.17 million UAH, 0.33 Swiss francs, of which 68.5% is cash4. With the political will of the ruling elite share of income from natural rent should be redistributed and is aimed at solving urgent social and economic problems of the country and its citizens.
A total rental income per one person, as in 2015, is approximately1334 UAH. Rent and charges for the use of other natural resources in the consolidated budget of Ukraine in 2015 amounted to 41958.19 million UAH, payment for land (which from 2015 is not a separate tax revenues, and transferred to property tax) − 14873.43 million UAH, in the amount is equal to 56789.62 million UAH. The population of Ukraine in 2015 was 42590.9 thousand of permanent residents (excluding the temporarily occupied territory of the Autonomous Republic of the Crimea and in Sevastopol). Rent for use of mineral resources, which in 2015 amounted to 38008.28 million UAH, per capita is about 892 UAH5. If the deduction of 80% of rent for use of mineral
1 Жикаляк, Н.В. (2013). Рента в горной промышленности: виды и причины образования. Економічний вісник Донбасу, 3 (33), 180-185. 2 Демина, М.П. (2012). К проблеме рентных отношений в условиях глобализации экономики. Известия Иркутской государственной экономической академии (Байкальский государственный университет экономики и права), 4. <http://eizvestia.isea.ru.isea.ru> (2016, November, 22). 3 Пояснювальна записка до проекту Закону України «Про Державний бюджет України на 2017 рік» (Верховна Рада України). Офіційний сайт Верховної Ради України. <http://w1.c1.rada.gov.ua/pls/zweb2/webproc4_1?pf3511=60032> (2016, November, 10). 4 Гуржий, Е. (2016). Е-декларации: у чиновников и депутатов миллиарды под матрасами. <http://kp.ua/politics/555827-e-deklaratsyy-u-chynovnykov-y-deputatov-myllyardy-pod-matrasamy> (2016, November, 10). 5 Розраховано за: Річний звіт про виконання Державного бюджету України за 2015 рік. <http://www.treasury.gov.ua/main/uk/doccatalog/list?currDir=311513>; Офіційний сайт Державної служби статистики України. <http://www.ukrstat.gov.ua/operativ/operativ2016/ds/kn/kn_u/kn1016_u.html> (2017, January, 10).
ISSN 2533‐4794 EVROPSKÝ ČASOPIS EKONOMIKY A MANAGEMENTU
84
resources to the national ret fund and rental redistribution to every citizen of the country, to nominal personal account can be sent to about 714 UAH annually. Projected revenues amount of rent and payment for the use of other natural resources to the state budget in 2017 is 52113.9 million UAH, and rent for use of mineral resources, such as mining minerals of national importance – 44303.3 million UAH1. That is rental income in terms of 1 capita (citizen of the country) will increase.
Of course, given sum of money has insignificant size and many might say that we should not disperse the funds among the multimillion population. But these funds can be directed at solving problems in health, education, science and others. For example, the government allocated to health just 2.7% of GDP in the EU and WHO recommendations − at least 5%. Expenditures for the Ministry of Health of Ukraine in the State Budget of Ukraine for 2017 are provided in the amount of 62019.68 million UAH (when needed 140-160 billion UAH) 1461 UAH − per person. Including the funds provided for: leadership and management in the health sector (58.18 million UAH); research, scientific and scientific-technical development, training and retraining of scientific personnel in health care field and so on (108.8 million UAH); training and retraining of medical and pharmaceutical, scientific and teaching staff by universities of all levels of accreditation in health care field (3947.62 million UAH); functioning of the National Scientific Medical Library, preservation and promotion of the history of medicine (24.56 million UAH) and others that are not directly related to the treatment process2. Therefore, the amount of funds allocated for the provision of medical care to population will be only 210 UAH (state tariff, which is provided for annual maintenance per patient). According to new approaches to the use of budget money of Concept reform financing of health care system of Ukraine 2016, they should be directed to specific services for a particular patient. However, these costs are too little. The citizens of society who need medical care will further use the funds that are formed as a national dividend. The principle of health reform "money follows the patient"3 corresponds to the first phase of the concept of national dividends.
Natural rent that is withdrawn and directed to the state budget in the form of rent, may be the sum of an order of magnitude greater, provide transparency of these processes and eliminate shady schemes. For example, during 9 months of 2016 "Naftogaz" received a net profit of 25.5 billion UAH, which at 78% was achieved by profit from gas transit4. Compared to the same period of last year, the profit of "Naftogaz" has grown more than 100 times, that starting from 2016 made the company a donor of state budget, not the budget recipient of aid. We remind that the value of the rental income associated with the overall production costs and normal profit that leaves the company in its disposal. Thus, the increase in wages of employees in 2016 almost doubled − 505.65 million UAH against 283.5 million UAH in 2015 with the same number of persons − 645 cannot be considered objective and one that significantly reduces the rent payments. Average monthly costs per employee of NAC, which in 2016 rose to 61.24 thousand UAH against 36.63 thousand UAH last year, not consistent with the average wage in the field and the country. Members of the Board of "Naftogaz" (4 persons) for the year will receive an additional sum of 46.6 million UAH. By such tenfold increase "Naftogaz" explains the need to bring labor costs of
1 Пояснювальна записка до проекту Закону України «Про Державний бюджет України на 2017 рік» (Верховна Рада України). Офіційний сайт Верховної Ради України. <http://w1.c1.rada.gov.ua/pls/zweb2/webproc4_1?pf3511=60032> (2016, November, 10). 2 Пояснювальна записка до проекту Закону України «Про Державний бюджет України на 2017 рік» (Верховна Рада України). Офіційний сайт Верховної Ради України. <http://w1.c1.rada.gov.ua/pls/zweb2/webproc4_1?pf3511=60032> (2016, November, 10). 3 Концепція реформи фінансування системи охорони здоров’я України, підготовлена робочою групою з питань реформи фінансування охорони здоров’я при МОЗ України. <http://moz.gov.ua/docfiles/pre_20160205_0_dod.pdf>. 4 Прибыль Нафтогаза выросла более чем в 100 раз. <http://biz.liga.net/ekonomika/tek/novosti/3565671-naftogaz-v-2016-godu-poluchil-25-5-mlrd-grn-chistoy-pribyli.htm.> (2017, January, 10).

EUROPEAN JOURNAL OF ECONOMICS AND MANAGEMENT • Volume 3 Issue 1 2017
85
the board of virtually its average wage management of similar companies in other countries, including Austria, Poland, Romania, Russia and Hungary. But it does not take into account the effectiveness of employees at all levels of "Naftogaz Ukraine" and the fact that that the average wage in these countries are several times higher than in Ukraine1.
Conclusions. As the developing of economy and improving the mechanisms of distribution and redistribution of natural rent, payment of national dividends will invariably grow. Expansion of dividend program is possible by expanding the sources of filling of national rental fund - from rent payments for subsoil use to pay for the use of other natural resources, and in the future it can be also engage quasi-rent income.
Establishing of a national rental fund − is the way of society unity by giving it the status of economic rights corresponding to the realities of today. In the process of creating targeted off-budget extra-national rental Fund of Ukraine can be used advanced world experience of formation and development of such funds, in particular the principles of operation and management performed by them socially important functions (investment, savings, anti-inflation, social) order of formation and use of funds.
References: 1. The Changing Wealth of Nations: Measuring Sustainable Development in the New Millennium. (2011). The World Bank. Washington, DC. <http://siteresources.worldbank.org/ENVIRONMENT/Resources/ ChangingWealthNations.pdf.> (2016, December, 18). [in English]. 2. Lvov, D.S. (2004). Vernut narodu rentu [Return rent to the people]. Moscow: Izdatelstvo Eksmo, Izdatelstvo Algoritm. [in Russian]. 3. Razovskii, Yu.V., Makarkin, Yu.N., Horenkova, E.Yu. (2013). Mineralno-syrevoy capital [Mineral resources capital]. Moscow: IPO U Nikitskih Vorot. [in Russian]. 4. Razovskii, Yu.V. (2013). Upravlenie sverhpribylyu ot mineralno-syrevogo capitala [Management by super profit from the mineral resource capital]. Vestnik Moskovskogo gumanitarnogo Universiteta [Bulletin of the Moscow Humanitarian University], 2, 170-176. [in Russian]. 5. Razovskii, Yu.V. (2011). Renta [Rent]. Moscow: Miroznanie. <http://www.razovskiy.com/node/193.> (2016, October, 20). [in Russian]. 6. Razovskii, Yu.V., Matyukha, V.V., Sukhina, E.N., Movchan, N.T. (2011). Razvitie institutov nedropolzovaniya Rossii i Ukrainy [The development of institutions of subsoil use in Russia and Ukraine]. Izvestiya vuzov. Gornyi zhyrnal [Proceedings of the universities. Mining journal]. 2, 44-50. [in Russian]. 7. Zadorozhnyi, G.V., Katsuba, A.V. (2013). Globaliziruyushcheesya znaniemnoe khozyaistvo: problemy renty i kvazirenty [Globalizing economy: problems of rents and quasi-rents]. Monographiya. Kharkiv: Tochka. 200. 8. Proekt Federalnogo zakona № 372560-3 O pravah grazhdan Rossii na dohody ot ispolzovaniya prirodnyh resyrsov Rossiiskoi Federacii [The draft federal law on the rights of Russian citizens on income from the use of natural resources of Russian Federation]. <http://www.consultant.ru/ cons/cgi/online.cgi?req=doc&base=PRJ&n=19697#0> (2016, October, 15). [in Russian]. 9. Kontseptsyya formirovaniya i ispolzovaniya sredstv Natsyonalnogo fonda Respubliki Kazakhstan na srednesrochnuyu perspektivu [Decree on the Concept of formation and use of funds of the National Fund of the Republic of Kazakhstan for the medium term 2005]. Ukaz Presidenta Respubliki Kazakhstan № 1641 ot 1 sentyabrya 2005 goda. <https://tengrinews.kz/zakon/prezident_respubliki_kazahstan/finansyi/id-U050001641_/#z70> (2016, September, 22). [in Russian]. 10. V Gosydarstvenuyu Dumy vnesli proekt o prave rossiyan na dohody ot dobychi poleznyh iskopaemyh [In the State Duma introduced a draft on the law of Russians on income from mining operations]. (2016, September, 14). <https://ria.ru/economy/20160914/1476887439.html> (2016, September, 22). [in Russian].
1 Оголений король: скільки і на чому заробляє «Нафтогаз» відповідно до фінплану - 2016. <http://forbes.net.ua/ua/nation/1425237-ogolenij-korol-skilki-i-na-chomu-zaroblyae-naftogaz-vidpovidno-do-finplanu-2016.> (2017, January, 10).

ISSN 2533‐4794 EVROPSKÝ ČASOPIS EKONOMIKY A MANAGEMENTU
86
11. Stan mineralno-syrovynoi bazy [State of mineral base]. Ofitsiinyi sait Derzhavnoi sluzhby geoloii ta nadr Ukrainy [Official site of the State Service of Geology and Mineral Resources of Ukraine] <http://www.geo.gov.ua/storinka/stan-mineralno-syrovynnoyi-bazy-ukrayiny> (2017, January, 10). [in Ukrainian]. 12. Vasylenko, A.P. (2014). Mineralno-syrovynna baza Ukrainy. Stattia 2. Stan mineralno-syrovynoi bazy metalichnyh korysnyh kopalyn Ukrainy i osnovni napriamy geologorozviduval’nyh robit [State mineral resources of Ukraine metallic minerals and basic directions of exploration.]. Mineralny resursy Ukrainy [Mineral resources of Ukraine], 3, 3-7. [in Ukrainian]. 13. Zakon pro zatverdzhnnia Zagalnoderzhavnoi programy rozvytku mineralno-syrovynoi bazy Ukrainy na period do 2030 roku [Law approving the State Program of development of mineral resources of Ukraine for the period till 2030] (Verkhovna Rada Ukrainy). Ofitsiinyi sait Verkhovnoi Rady Ukrainy [Official site of the Verkhovna Rada of Ukraine]. <http://zakon3.rada.gov.ua/laws/show/3268-17> (2016, December, 15). [in Ukrainian]. 14. Kalko, A.D. (2011). Pro mineralno-syrovynu bezpeku iak skladovu natsionainoi bezpeky [On the mineral raw material security as part of national security]. Naukovi zapysky, 1. <http://www.nbuv. gov.ua/old_jrn/Soc_Gum/NZTNPU/geogr/2011_1/6/003Kalko.pdf.> (2016, November, 20). [in Ukrainian]. 15. Khvesyk, M., Bystryakov, I., Klynovyi, D. (2016, cherven 14). Pryrodne bagatstvo Ukrainy: zahalnoporivnyalna kharakterystyka [The natural wealth of Ukraine: general characteristics]. Ukrainskyi zhurnal Economist [Ukrainian Economist magazine]. <http://uaekonom.merkel.org.ua/12920prirodne bagatstvoukrayinizagalnoporvnyalnaharakteristika. Html> (2016, September, 11). [in Ukrainian]. 16. Zhykalyak, N.V. (2013). Renta v gornoi promyshlennosti: vidy i prichiny obrazovaniya [The rent in the mining industry: the types and causes of fortmation]. Ekonomichnyi visnyk Donbasy [Economic Bulletin of Donbas], 3 (33), 180-185. [in Russian]. 17. Demina, M.P. (2012). K probleme rentnyh otnoshenii v usloviyakh globalizatsii ekonomiki [On the problem of rent relations in a globalized economy]. Izvestiya Irkutskoy gosudarstvennoy ekonomicheskoy Akademii [News of Irkutsk State Economic Academy] (Baikalskii gosydarstvennyi universitet ekonomiki i prava), 4. <http://eizvestia.isea.ru.isea.ru> (2016, November, 22). [in Russian]. 18. Poiasniuvalna zapyska do proekty Zakonu Ukrainy pro Derzhavnyi biudzhet Ukrainy na 2017 rik [Note to the project Law of Ukraine on State Budget of Ukraine for 2017] (Verkhovna Rada Ukrainy). Ofitsiinyi sait Verkhovnoi Rady Ukrainy [Official site of the Verkhovna Rada of Ukraine]. (2016, November, 10) [in Ukrainian]. 19. Gurzhii, E. (2016, October, 31). E-deklaratsii: u chinovnikov i depytatov milliardy pod matrasami. 31 oktyabrya 2016 [E-declaration: Deputies and officials have billions under the mattress]. <http://kp.ua/ politics/555827-e-deklaratsyy-u-chynovnykov-y-deputatov-myllyardy-pod-matrasamy.> (2016, November, 10). [in Russian]. 20. Richnyi zvit pro vykonannia Derzhavnogo biudzhety Ukrainy za 2015 rik [Annual Report on the State Budget of Ukraine for 2015]. <http://www.treasury.gov.ua/main/uk/doccatalog/list?currDir=311513> (2017, January, 10). [in Ukrainian]. 21. Kontseptsia reformy finansuvannia systemy ohorony zdorovia Ukrainy, pidgotovlena robochoiu grupoiu z pytan reformy finansuvannia ohorony zdorovia pry MOZ Ukrainy [The concept of reform of health care financing Ukraine, prepared by the working group on reform of health care financing at the Ministry of Health of Ukraine.]. (2016, February). <http://moz.gov.ua/docfiles/pre_20160205_0_dod.pdf.> [in Ukrainian]. 22. Pribyl Naftogaza vyrosla bolee chem v 100 raz [Naftogaz's profit increased by more than 100 times]. (2017, Decamber 20). <http://biz.liga.net/ekonomika/tek/novosti/3565671-naftogaz-v-2016-godu-poluchil-25-5-mlrd-grn-chistoy-pribyli.htm.> (2017, January, 10). [in Russian]. 23. Ogolenyi korol: skilky i na chomu zarobliaie «Naftogaz» vidpovidno do finplanu – 2016 [Naked King: how much and what earns "Naftogaz" according to the financial plans - 2016]. (2016, December, 8). <http://forbes.net.ua/ua/nation/1425237-ogolenij-korol-skilki-i-na-chomu-zaroblyae-naftogaz-vidpovidno-do-finplanu-2016.> (2017, January, 10). [in Ukrainian].

EUROPEAN JOURNAL OF ECONOMICS AND MANAGEMENT • Volume 3 Issue 1 2017
87
Oksana Senyshyn, PhD in Economics Ivan Franko National University of Lviv, Ukraine
APPLICATION OF SWOT-ANALYSIS METHOD IN FORMING THE STRATEGY OF ORGANIC FARMING DEVELOPMENT IN UKRAINE
This article deals with the problems of development of organic farming in Ukraine and presents substantiation of the main problems of its functioning in Ukraine. It also presents SWOT‐analysis of the process of organic farming that identifies principal opportunities and threats, strong and weak points of its functioning and development, chooses the strategy for development of domestic organic farming, which will provide the opportunity to pursue it in the future with the aid of the following strategic means: introduction of certification procedures for organic production in accordance with the EU standards; formation of a legal framework that would regulate functioning of the system of organic farming; development of cooperation of households in rural areas through the system of collaboration of agricultural service cooperatives, etc. Key words: organic farming, organic products, production of organic food products, organic standards, SWOT‐analysis, strategy of development.
Problem statement. At present day stage of development of the globalization processes organic farming is one of the important priorities in developing the food producing complex in general. This kind of farming is a necessity that is dictated and predetermined in the global context.
Analysis of recent studies and publications. An important contribution to the development of the concept of organic farming was made by the Japanese philosopher Mokishi Okada, the German scientist Rudolf Steiner, the French scientist-economist Lemaire Boucher, Ukrainian scientists Ivan Ovsinskyi and Alex Podolinskyi, V. Artysh, O. Dudar, T. Zaychuk, V. Ktysil, L. Sokol, T. Stefanovska, V. Shlapak, I. Shuvar and others engaged in resolving similar problems in state economic science.
Presentation of basic material. Analyzing the system of organic farming, we shall note, that according to the studies of the US Department of Agriculture (USDA) organic farming is a system of production of agricultural products that prohibits or considerably restricts the use of synthetic composite fertilizers, pesticides, growth regulators and food additives in fodder for fattening animals. Such a system is based as much as possible on crop rotation, use of plant residues, manure and compost, legumes and plant manure, organic product waste, mineral materials, mechanical soil cultivation and biological means of pest management in order to increase fertility and improve soil structure, to ensure full power plants and controlling weeds and various pests1.
We believe that if development of organic farming and organic food production does not become a strategic objective of Ukraine in the next few years, import and shadow domestic production of genetically processed food can destroy the gene pool of the Ukrainian people. Therefore, in this paper we want to emphasize the urgent need for activation of the production of organic products in Ukraine, taking into account experience of the European countries in the production of such products in. Proceeding from the analysis of experience in the functioning of organic production in the European countries we believe that in order to activate similar activities in Ukraine it is first of all necessary to create the legal framework that would regulate functioning
1 Report and recommendation for the organic farming 2007 (US Department of Agriculture). Official site of the US Department of Agriculture. <http://www.nal.usda.gov/afsic/pubs/USDAOrgFarmRpt.pdf> (2016, June, 18).
ISSN 2533‐4794 EVROPSKÝ ČASOPIS EKONOMIKY A MANAGEMENTU
88
of the system of organic farming since absence in Ukraine’s of legislative environment renders it impossible to organize a system of accreditation and standardization of functioning of the certification bodies and prevents positioning of Ukraine as an exporter of organic products in the international market1.
Ukraine has already taken certain steps to create the required legislative environment for organic farming, having adopted on September 3, 2013 the Law of Ukraine “On the production and turnover of organic agricultural products and raw materials”, that outlines the legal and economic principles for the production and circulation of organic agricultural products and raw materials, measures for control and supervision of such activities and aims at ensuring a fair competition and an appropriate functioning of the market of organic products and raw materials, improving key indicators of the population’s health, preservation of the natural environment, rational use of soil, ensuring rational use and renewal of natural resources and guaranteeing the consumers’ confidence in the products and raw materials labeled as organic2.
Another unresolved issue of legislative nature is the absence of legislative acts that pertain to undergoing organic production certification procedures by the domestic producers of organic products. We shall note, that the Law of Ukraine of September 3, 2013 “On the production and turnover of organic agricultural products and raw materials” indicates only, that the use of the state logotype and marking organic products (raw materials) for labeling organic products is mandatory, though it does not define a precise procedure for marking and certification. That is why domestic producers undergo the process of organic certification under existing international standards, most often under the effective standards of the European Union.
In the absence of national legislative environment for the certification and labeling organic production certification of organic producers and their products in Ukraine is made in accordance with international standards. In particular, the Ukrainian certification company “Organic Standard” certifies the Ukrainian producers as prescribed by the “Standard for organic production and processing for the third countries", that is equal to the European Union standard.
The state target rural development program for the period till 2015 plans to attain the share of organic products in total volume of gross output of agriculture up to 10 %, envisages incentives for organic agriculture, standardization of organic farming and the establishment of its certification – though as of today these provisions have not been accomplished.
Another document that focuses on the organic sector is the Strategy of development of agricultural sector of economy for the period till 2020, approved by the decree of the Cabinet of Ministers of Ukraine3. Among the top-priority goals in achieving the strategic objectives the strategy indicates also the ensuring of food security of the state through the promotion of organic farming, especially in private farm households and in medium-sized farms.
Thus, Ukraine has a potential comparative advantage in the production of organic products among other European countries. Development of organic farming provides great opportunities for farmers and commodity producers in the sales of organic products in foreign markets. Export of domestic organic products to the European countries can bring quite reasonable profits to the Ukrainian farmers, and those, in their turn, will get resources for the development of agricultural production of both, organic and traditional products, thus increasing supply of domestic goods in the internal market.
1 Щодо напрямів розвитку органічного виробництва сільськогосподарської продукції в Україні. Національний інститут стратегічних досліджень. <http://www.niss.gov.ua/articles/1292/>. 2 Закон про виробництво та обіг органічної сільськогосподарської продукції та сировини 2013 (Верховна Рада України). Офіційний сайт Верховної Ради України. <http://zakon4.rada.gov.ua/laws/show/425-18> (2016, June, 18). 3 Розпорядження про схвалення Стратегії розвитку аграрного сектору економіки на період до 2020 року 2013 (Кабінет Міністрів України). Офіційний сайт Верховної Ради України. <http://zakon4.rada.gov.ua/laws/show/806-2013-%D1%80> (2016, June, 18).

EUROPEAN JOURNAL OF ECONOMICS AND MANAGEMENT • Volume 3 Issue 1 2017
89
The study of the peculiarities of development of organic farming in Ukraine provided the opportunity based on SWOT-analysis to determine the strong and the weak points, as well as the opportunities and threats to its functioning, as shown in Fig. 1. We shall note that carrying out the SWOT-analysis in this case is important not only for its analytical value, but for its preventive value as well, because identification of the opportunities and threats to the development of organic farming in Ukraine must ensure further transformation of the opportunities into strengths and prevent the threats by way of taking appropriate measures for their prevention.
Strong points Weak points
- considerable territory of uncultivated agricultural land; - Low rents; - Favorable weather-climatic conditions for organic farming; - Satisfactory state of ecology of the environment for organic farming; - presence of a considerable number of unemployed village residents which means formation of cheap labor; - knowledge of rural residents in the sphere of farming, which is a prerequisite for ensuring quality of labor; - existing experience in organic farming (domestic and foreign); - Existing demand for ecological products
- Poor financial standing of agricultural enterprises as potential subjects of organic farming development; - poor development of cooperation in rural areas as a potential field of organic farming development; - low level of productivity of rural residents; - low level of motivational factors development; - low investment attractiveness of rural areas and the branch of economy; - low credit rating of the food sector; - underdeveloped system of business planning in agriculture; - presence of close financially powerful foreign entities that reduce competitiveness of domestic products; - underdeveloped management and marketing systems in farming domain; - low level of state support for agricultural development; - low level of development of production and social infrastructure of villages
Opportunities Threats
- Diversification of production in agriculture; - state support of the development of organic agriculture (subsidies); - reducing the tax burden on producers of ecologically clean products; - change in consumers’ expectations of the Ukrainian consumers by giving preference to domestic food products; - increase of investment attractiveness of the food complex of the economy; - access to new foreign food markets; - introduction of new production technologies and management practices; - development of tourism in the region that will increase demand for the food products; - development of cooperation of the households in rural areas
- Intensification of agricultural production, rapid growth of low production cost enterprises (non-organic farming); - insufficient awareness of population of ecological products, that causes its underestimation and low demand for such products; - difference in priorities of organic farming in governmental bodies, business circles and population, that can assure achievement of common ultimate goal; - existence of strong competition from western neighboring countries; - inability of farming enterprises to make capital investments to carry on organic farming; - insolvency of population due to the high prices of certified organic food products
Fig. 1. Matrix of SWOT-analysis of the process of development of organic farming in Ukraine [elaborated by the author]
To assess the effect of strategic factors of the environment on the development of organic
farming it is necessary to identify factors of the external environment and determine the possibility of their influence on its functioning and classify them by their positive or negative effect. The

ISSN 2533‐4794 EVROPSKÝ ČASOPIS EKONOMIKY A MANAGEMENTU
90
matrix of favorable opportunities for the functioning and development of the processes of organic farming in Ukraine (Fig. 2) was constructed on the basis of such assessment.
Fig. 2. Matrix of favorable opportunities for development of organic farming in
Ukraine Thus, in the result of construction of the matrix of opportunities for development of organic
farming in Ukraine the most favorable will be those shown in the upper right corner of the matrix (Fig. 2), namely, opportunities numbered 3, 5, 6, 7 and 9. These are to be included in the summary table of SWOT-analysis and the main thing is to consider them as feasible directions of the chosen strategy of development of domestic organic farming. Based on the complete analysis of possible threats the matrix of possible threats to domestic organic farming functioning has been constructed (Fig. 3).
Fig. 3. Matrix of possible threats to the development of domestic organic farming

EUROPEAN JOURNAL OF ECONOMICS AND MANAGEMENT • Volume 3 Issue 1 2017
91
We believe that all the potential threats shown above in the matrix, such as items: 1-6, should be included in the summary table of SWOT-analysis and considered them as a possible threats to the functioning of organic farming.
To complete strategic analysis of the perspectives of organic farming development in Ukraine it is expedient to show the relationship between the external factors (opportunities and threats) and the potential of the sphere of organic farming (strong and weak points). That is, next step is to draw up the table of SWOT-analysis with SO, ST, WO and WT-strategies, which is shown in Fig. 4.
Opportunities of external environment
Threats of external environment
A. Reducing the tax burden on producers of ecologically clean products
a) Intensification of agricultural production, rapid growth of low production cost enterprises (non-organic farming)
B. Increase of investment attractiveness of the food complex of the economy
b) Insufficient awareness of population of ecological products, that causes its underestimation and low demand for such products;
C. Access to new foreign food markets
c) Difference in priorities of organic farming in governmental bodies, business circles and population, that can assure achievement of common ultimate goal
D. Introduction of new production technologies and management practices
d) Existence of strong competition from western neighboring countries
e) Inability of farming enterprises to make capital investments to carry on organic farming;
SWOT-analysis components
E. Development of cooperation of the households in rural areas
f) Insolvency of population due to the high prices of certified organic food products
Strong points SO-strategies ST-strategies 1. Considerable territory of uncultivated agricultural land
Development of cooperation of the households in rural areas (E)
Rapid growth of low production cost enterprises (non-organic farming) (a)
2. Low rents Increase of investment attractiveness of the food complex of economy (B) Development of cooperation of the households in rural areas (E)
Increased competition from western neighboring countries (d)
3. Favourable weather-climatic conditions for organic farming;
Increase of investment attractiveness of the food complex of the economy (B)
Facilitation of non-organic farming development (a)
4. Satisfactory state of ecology of the environment for organic farming
Reducing the tax burden on producers of ecologically clean products (A)
Introduction of strict state norms for emissions into the environment (c)
5. Presence of a considerable number of unemployed village residents which means formation of cheap labor
Development of cooperation of the households in rural areas (E)
Difference in priorities of organic farming in governmental bodies, business circles and population, that can assure achievement of common ultimate goal (c)
6. Knowledge of rural residents in the sphere of farming, which is a prerequisite for ensuring quality of labor
Introduction of new production technologies and management practices (D) Development of cooperation of the households in rural areas (E)
Existence of strong competition from western neighboring countries for qualified labor from Ukraine (d)

ISSN 2533‐4794 EVROPSKÝ ČASOPIS EKONOMIKY A MANAGEMENTU
92
7. Existing experience in organic farming (domestic and foreign);
Access to new foreign food markets (B)
Difference in priorities of organic farming in governmental bodies, business circles and population, that can assure achievement of common ultimate goal (c)
8. Existing demand for ecological products
Introduction of new production technologies and management practices (D)
Considerable cost of certified organic food products that will reduce demand for such products (f)
Weak points WO-strategies WT-strategies 1. Poor financial standing of agricultural enterprises as potential subjects of organic farming development
Introduction of new production technologies and management practices (D)
Existence of strong competition from western neighboring countries (d) Inability of farming enterprises to make capital investments to carry on organic farming (e)
2. Poor development of cooperation in rural areas as a potential field of organic farming development
Introduction of new production technologies and management practices (D) Development of cooperation of the households in rural areas (E)
Rapid growth of non-organic farming (a)
3. Low level of productivity of rural residents
Insufficient awareness of population of ecological products, that causes its underestimation and low demand for such products (b)
4. Low level of motivational factors development
Introduction of new production technologies and management practices, especially methods of workers’ motivation (D)
Insolvency of population due to the high prices of certified organic food products (f)
5. Low investment attractiveness of rural areas and the branch of economy
Increase of investment attractiveness of food complex of the economy (B) Development of tourism in the region (B)
Informing population on ecological products (b) Overcoming difference in priorities of organic farming in governmental bodies, farming enterprises and population (c)
6. Low credit rating of the food sector
Attraction of foreign crediting establishments and banks (B)
Shortcomings of legislation in the sphere of organic farming (c)
7. Underdeveloped system of business planning in agriculture
Introduction of new production technologies and management practices with the use of strategic analysis methods (D)
Increased competition from western neighboring countries (d)
8. Presence of close financially powerful foreign entities that reduce competitiveness of domestic products
Facilitation of the development of cooperation of the households in rural areas, use of foreign experience in organic farming (E)
Increase of competition from western neighboring countries, drop in production of organic products (d), (f)
9. Underdeveloped management and marketing systems in farming area
Introduction of new production technologies and management practices (D)
10. Low level of state support for agricultural development;
Reducing the tax burden on producers of ecologically clean products, subsidizing and agro-crediting the sphere of organic farming (A)
Rapid growth of non-organic farming (a)
11. Low level of development of production and social infrastructure of villages
Development of infrastructure by way of the state support and support of foreign investors (A), (B), (c)
Fig. 4. Matrix of SWOT-analysis showing relationship of external environment with the strong and weak points of organic farming development
Conclusions. Having analyzed in detail the matrix of SWOT-analysis that shows
relationship of external environment with the strong and weak points of organic agriculture, that is,
EUROPEAN JOURNAL OF ECONOMICS AND MANAGEMENT • Volume 3 Issue 1 2017
93
SO, ST, WO, WT-strategic directions, we consider it to be expedient to choose not the strategy of growth but the strategy of development of domestic organic farming that will permit put it into effect in the future by way of the following directions:
1. Introduction of the procedure of organic products certification in conformity with the EU standards, because there is no such procedure in Ukraine, though the Ukrainian certification company “Organic Standard” certifies the Ukrainian producers as prescribed by the “Standard for organic production and processing for the third countries", that is equal to the European Union standard.
2. Formation of the legislative environment that regulates the system of organic farming as the absence of appropriate legislative environment in Ukraine makes it impossible to organize the system of accreditation and standardization of functioning of the certification bodies and prevents positioning of Ukraine as an exporter of organic products in the international market.
3. Development of cooperation of the household farms in rural areas through the system of collaboration of agricultural service cooperatives (ASC) with the higher educational establishments, research and development institutes, leading agricultural firms, international organizations and other enterprises and institutions that have technologies an the domain of agricultural science. Informing the public in a simple and popular form about the opportunities, benefits and mechanism of establishing and functioning of the ASC under the new conditions.
4. Development of the concept of sales promotion (of organic products) that will envisage raising the consumers’ awareness of the harmful effects on health of livestock and crop products produced with the use of the “traditional” technologies, promotion of healthy lifestyles, developing effective ties with traditional distribution channels of product sales, creating new channels for the sales of organic products.
References: 1. Zakon pro vyrobnytstvo i obih orhanichnoi silskohospodarskoi produktsii ta syrovyny 2013 (Verkhovna Rada Ukrainy) [The law on production and turnover of organic agricultural products and raw materials, 2013 (the Verkhovna Rada of Ukraine)]. Ofitsiinyi sait Verkhovnoi Rady Ukrainy [Official site of the Verkhovna Rada of Ukraine]. < http://zakon4.rada.gov.ua/laws/show/425-18> (2016, June, 18). [in Ukrainian]. 2. Rozporiadzhennia pro skhvalennia Stratehii rozvytku ahrarnoho sektoru ekonomiky na period do 2020 roku 2013 (Kabinet Ministriv Ukrainy) [Resolution on approval of the Strategy of the agricultural sector for the period 2013 to 2020 (Cabinet of Ministers of Ukraine)]. Ofitsiinyi sait Verkhovnoi Rady Ukrainy [Official site of the Verkhovna Rada of Ukraine]. <http://zakon4.rada.gov.ua/laws/show/806-2013-%D1%80> (2016, June, 18). [in Ukrainian]. 3. Shchodo napriamiv rozvytku orhanichnoho vyrobnytstva silskohospodarskoi produktsii v Ukraini [As for the areas of organic agricultural production in Ukraine]. Natsionalnyi instytut stratehichnykh doslidzhen [National Institute for Strategic Studies]. <http://www.niss.gov.ua/articles/1292/>. [in Ukrainian]. 4. Report and recommendation for the organic farming 2007 (US Department of Agriculture). Official site of the US Department of Agriculture. <http://www. nal. usda. gov/ afsic/ pubs/ USDAOrgFarmRpt.pdf> (2016, June, 18). [in English].
ISSN 2533‐4794 EVROPSKÝ ČASOPIS EKONOMIKY A MANAGEMENTU
94
Максим Горіховський Подільський державний аграрно‐технічний університет, Україна
ФОРМУВАННЯ КОНКУРЕНТОСПРОМОЖНОСТІ ФЕРМЕРСЬКИХ ГОСПОДАРСТВ ХМЕЛЬНИЦЬКОЇ ОБЛАСТІ НА ОСНОВІ ФОРСАЙТ-ТЕХНОЛОГІЙ Maksym Gorikhovskyi Podillia State Agrarian and Engineering University, Kamianets‐Podilskyi, Ukraine
FORMATION OF COMPETITIVENESS OF FARMS IN KHMELNYTSKYI REGION BASED ON FORESIGHT TECHNOLOGIES
This article discusses one of many approaches to ensure competitiveness of farms in Khmelnytskyi region, which is based on foresight technology. We understand that on rare examples of effective farm management is not possible in general to ensure the competitiveness of such layer as farmers, so it is necessary to develop a comprehensive development strategy for the whole farming in Khmelnytskyi region. Currently farming is an important area of current agricultural policy, which is able to provide the rural population with work, and in a decentralized help in solving many issues combined local communities. For successful development and implementation in action of foresight‐project at Khmelnytskyi region, we need to analyze and learn from the experience of foresight‐projects of sectoral, national and international level. Key words: competitiveness of farms, foresight, development and strategic management.
Постановка проблеми. Важливим питанням сьогодення для українських фермерів є проблема підвищення конкурентоспроможності, при цьому слід розглядати прості методи, як зменшення собівартості продукції та розширення ринків збуду на коротку перспективу, так і розвиток й провадження інновацій. Наразі технологія Форсайту в Україні з кожним днем не тільки в наукових колах знаходить своє застосування, а також в управлінні державою, галуззю чи регіоном. У зв’язку з цим розвиток територіального Форсайту, є одним із ключових факторів забезпечення розвитку та конкурентоспроможності регіону.
Аналіз останніх досліджень і публікацій. У наукових колах все більше робіт присвячуються дослідженню теоретичних і практичних аспектів застосування Форсайт – технології. Серед вітчизняних і зарубіжних вчених: Верхотурова Е.В., Вишневский К.О., Мильшина Ю.В. Калюжнова Н.Я., Лапчинський В.В., Осипов В.М., Парасюк І.Л., Ворожейкін О.О., Gertler M.S., Wolfe D.A., Koschatzky K.
Постановка завдання. Основним завданням даної публікації є створення моделі стратегії розвитку фермерських господарств за допомогою Форсайт – технологій, та аналіз особливостей використання даної технології на регіональному рівні.
Метою даного дослідження являється аналіз публікацій які висвітлюють проблематику та успішне використання Форсайт – технологій на регіональному рівні й створення моделі стратегії розвитку фермерських господарств в даному регіоні, та аналізу основних складові забезпечення впровадження даної моделі.
Матеріали і методи досліджень. Матеріалами даного дослідження виступили праці вітчизняних та зарубіжних вчених, які були опубліковані у фахових виданнях, а також стратегія регіонального розвитку Хмельницької області до 2020 р., а також власні спостереження і напрацювання. В написаній статті використовувалися такі методи дослідження, як: аналогія та моделювання, аналітичний, експерименту і спостереження.
Виклад основного матеріалу дослідження. В Хмельницькій області Форсайт

EUROPEAN JOURNAL OF ECONOMICS AND MANAGEMENT • Volume 3 Issue 1 2017
95
прогнозування знайшло відображення розробці Стратегій регіонального розвитку Хмельницької області до 2020р1., при цьому до розробки даної стратегії залучалися не тільки державні управлінці, а й науковці, бізнесмени, представники громадських організацій, представники громад. Важливу роль в досягненні цілей підвищення інноваційної активності регіону відіграє рівень розвитку громадянської самосвідомості або «громадянської культури». На деяких територіях «громадянська культура» формувалася не одне десятиліття, причому розвиток це було скоріше не цілеспрямованим і запланованим, а природним процесом формування середовища для підтримки і зростання інновацій. В інших регіонах чи країнах вона виникла в результаті свідомих зусиль, націлених на створення нової стратегії розвитку для даної місцевості або регіону. «Громадянська культура» сприяє зростанню соціального капіталу в регіоні, який в свою чергу є опорою для вдосконалення взаємодії зацікавлених сторін для розвитку інноваційної спрямованості регіону2. Довгострокові прогнози інноваційного розвитку дозволяють відповісти на основне питання, що стоїть перед особами, що приймають рішення на регіональному і місцевому рівні, - як створити необхідні, сприятливі умови для стимулювання зростання наукомістких форм економічної активності в контексті динамічно розвивається інноваційної системи3.
Деякі вчені особливо відзначають роль регіонального Форсайта в формуванні соціального капіталу на певній території, для якої створюється проект4. Відмінною рисою реалізації регіонального Форсайт-проекту є спільна робота самого різного роду стейкхолдерів: представників влади і бізнесу різних рівнів, фахівців з різних галузей, громадян, окремих соціальних груп. Результатами даної роботи стає збір думок, прогнозів, оцінок, різноманітних ідей з метою знаходження компромісу і вибору оптимального рішення. В процесі реалізації Форсайт – проектів на регіональному рівні розвивається потенціал мережевої взаємодії між ключовими акторами інноваційної системи регіону, відбувається інтеграція соціальних факторів в систему технологічних і ринкових чинників, що багато в чому сприяє посиленню регіонального соціального капіталу і розширює можливості його використання для активізації інноваційного та економічного розвитку. Сам по собі процес створення Форсайт – дослідження виступає в якості засобу поліпшення комунікацій і координації зусиль між зацікавленими особами, підвищення їх готовності до дії2.
Незважаючи на широкий спектр проведених досліджень і узагальнень, в більшості випадків Форсайт використовується для оцінювання розвитку конкретного науково-технічного напряму, перспективи сфери науки і технологій (розподіл ресурсів на проекти НДДКР), перспективи науково-технологічного розвитку в соціально-економічному контексті (прийняття стратегічних рішень як на макрорівні, так і на регіональному рівні), до теперішнього часу відсутні дослідження комплексних варіативних систем раціонального землекористування, які б враховували весь динамічний спектр різноманітних взаємопов’язаних соціальних, економічних і екологічних умов функціонування сучасних агроформувань на регіональному і місцевому рівні – з одного боку, і були затверджені відповідними органами місцевого самоврядування в якості стратегічного напрямку використання земельних ресурсів – з другого5.
1 Стратегія регіонального розвитку Хмельницької області до 2020 року (2011) (Хмельницька обласна Рада). Офіційний сайт Хмельницької обласної Ради. <http://adm.km.ua/doc/RD_Strategy_Khmelnytskyi_12052011_UA.pdf> (2017, січень, 10). 2 Вишневский, К.О., Мильшина, Ю.В. (2016). Региональный Форсайт: Европейский опыт и российская практика. Россия и запад: диалог культур, (10), 11. 3 Gertler, M.S., Wolfe, D.A. (2004). Local Social Knowledge Management. Futures, 36, 43-51. 4 Koschatzky, K. N. U. T. (2007). Social Capital and Cooperation within Innovation Systems. Europe-Reflections on Social Capital, Innovation and Regional Development: The Ostuni Consensus. Nowy S¹cz: National-Louis University, 134-142. 5 Лапчинський, В.В (2014). Геоінформаційна підтримка Форсайт досліджень моделей оптимізації сільськогосподарських землекористувань. Конференція Екологія і природокористування в системі оптимізації відносин природи і суспільства. червень 3. Тернопільська державна сільськогосподарська дослідна станція, 207-209.

ISSN 2533‐4794 EVROPSKÝ ČASOPIS EKONOMIKY A MANAGEMENTU
96
Ми розглядаємо Форсайт як певну соціогуманітарну організаційну технологію1, яка є цінним інструментом стратегічного розвитку, яка дозволяє сформувати узгоджене уявлення про напрямки розвитку, забезпечує взаємне діалогове навчання економічних агентів, що стимулює розвиток інновацій, і містить потенціал самореалізації виробленого спільно уявлення про майбутнє. Прогресивність технології Форсайту полягає в тому, що вона відповідає характеру економіки, заснованої на знаннях, де все більш важливими стають процеси вивчення (learning) - не в аспекті освіту, а в аспекті залучення різних економічних структур в процеси взаємного вивчення і отримання знань. Цей аспект діалогового співпраці є новим елементом суспільства, заснованого на знаннях, а здатність організовувати взаємодію для отримання нових знань стає сама по собі важливим ресурсом про що було написано ще в 2004 році2.
Рис.1. Зображення моделі створення стратегії розвитку фермерських господарств
за допомогою Форсайт – технологій [розроблено автором]
1 Калюжнова, Н.Я. (2008). Роль форсайта в повышении конкурентоспособности региона в «новой экономике». Наука. Инновации. Образование, (5), 271-279. 2 Калюжнова, Н.Я. (2004). Конкурентоспособность в новой экономике. Иркутск: Иркут. ун-т.

EUROPEAN JOURNAL OF ECONOMICS AND MANAGEMENT • Volume 3 Issue 1 2017
97
Складність проекту Форсайту полягає в тому, що необхідно визначити і організувати різні сфери діяльності, а не тільки провести сам процес передбачення і зафіксувати його результати в звітах і сценаріях (тобто здійснити технологію передбачення).
Крім того, реалізація потенціалу Форсайту, як інструменту стратегічного управління залежить від авторитетності і впливовості його учасників. Авторитетні учасники самі є провідниками розробленого передбачення в життя, що дозволяє не тільки прогнозувати, але і сприяє реалізації розробленого бачення майбутнього. Однак це вимагає ретельного управління процесом створення передбачення для реалізації закладеного в технології Форсайта потенціалу. Для управління процесами з високим ступенем невизначеності і новизни розроблена методологія управління проектами, в якій є системний підхід до управління. До проекту Форсайта можливо і слід застосовувати такі елементи управління проектами: життєвий циклу проекту, фази проекту, розробка процесів проекту, створення системи управління проектом Форсайта, визначення та реалізація1.
Для успішного впровадження стратегії розвитку фермерських господарств, яка буде розроблена за допомогою моделі 1, необхідно ще дотримуватися деяких умов та особливостей, які наведені в табл.1.
Таблиця 1 Складові забезпечення впровадження та розробки Форсайт – технології розвитку
фермерських господарств.
У теперішній економічній ситуації в Україні та з процесами децентралізації й створенню територіальних громад, ефективно себе може проявити застосування регіонального Форсайту.
В нашій ситуації можливе використання Форсайту в таких напрямках: 1) Об'єднання в Форсайт – проекти на основі галузевої кооперації підприємств даного
регіону, або громад, які є конкурентами по виробництву продукту на внутрішньому ринку, але не можуть в повній мірі вийти на зовнішній ринок збути продукції.
2) Створення обласного Форсайт – центр, для забезпечення сталого розвитку регіону по передових галузях виробництва, включаючи специфіку регіону.
Такий обласний Форсайт – центр фактично буде інтелектуально-креативним ядром
1 Верхотурова, Е.В. (2013). Использование методологии управления проектами в Форсайт-проектах. Современные проблемы науки и образования, 7, 111-119.
Технологічно-наукова складова
Законодавча складова
Керівництво місцевих територіальних громад
Робота з статистичними даними Вміння опрацювання інформації Вибір правильних Форсайт – технологій Впровадження маловідходних стратегій та концепції Застосування у виробництві хай-тек та іноваційних технологій Вивчення закордонного досвіду побудови та впровадження стратегій
Розуміння законодавчої бази України Знання про закони та можливі зміни Навички у роботі з бюрократичними процесами
Знання регіонального потенціал Розуміння місцевих потреб Зв'язок між фермерами та владою Почуття солідарності з і відповідальність за громаду
ISSN 2533‐4794 EVROPSKÝ ČASOPIS EKONOMIKY A MANAGEMENTU
98
соціально-економічного життя регіону, який з часом повністю буде забезпечений інтелектуальними людськими ресурсами, розробить та освоїть методологічне та програмне забезпечення й бази знань.
Основу методології даного Форсайт – центру повинні складати аналітичний підхід, вміння прогнозувати майбутні тенденції та коньюктуру ринків, імітаційне моделювання майбутнього та управління ризиками, використання сучасних комп'ютерних технологій та мобільних технологій, обробка інформації в текстовій, цифровий і візуальній формах. За умови створення подібних Форсайт – центрів у кожному обласному центрі, а в деяких випадках і районних центрах України, забезпечить можливість динамічного розвитку регіону зважаючи на його географічні, людські та економічні особливості.
Досягнення стратегічних цілей у сфері розвитку форм господарювання та інтеграції виробництва передбачається здійснити шляхом формування виробничих структур, які за своєю організаційною формою і розміром відповідають аналогам світового ведення сільського господарства: сільськогосподарські підприємства – американській та колишній радянській, фермерські господарства – європейській, особисті селянські господарства, господарства населення – японській та китайській організаційним формам1.
Їх пропорції й розміри формуватимуться залежно від спеціалізації регіонів і місцевих умов, наявності трудових ресурсів, кваліфікованих кадрів, місцевих традицій тощо на основі створення рівних економічних умов розвитку для усіх форм господарювання, забезпечення прибуткового ведення сільського господарства, спроможного розвиватися на принципах розширеного відтворення1.
Розвиток фермерських господарств, визначених Законом України «Про фермерське господарство»2, відбуватиметься на основі дотримання виробничих стандартів ведення сільськогосподарського виробництва. Фермерські господарства будуть формуватися переважно на сімейній основі, у напрямі забезпечення раціональних їх розмірів – 350-400 га, за обов’язкового розвитку тваринництва, крім вузькоспеціалізованих1.
Для успішного створення та впровадження Форсайту на регіональному рівні можна відштовхуватися від Форсайт проектів галузевого, або національного рівня. В свою чергу регіональний Форсайт базується на співпраці багатьох експертів з різних галузей, погляд із різних сторін, та включаючи всеохопний аналіз даного питання «передбачення» допомагає побудувати грамотну і реальну картину розвитку регіону. В оптимальному варіанті для розробки Форсайт аналізу розвитку фермерських господарств хмельницької області, необхідно залучити науковців аграрних вузів, фермерів, асоціацію фермерів Хмельницької області, обласну держадміністрацію, головне управління статистики в Хмельницькій області, регіональний центр з надання безоплатної вторинної правової допомоги у хмельницькій області, перший національний аграрний кооператив, представників об’єднаних громад, активістів та інших зацікавлених осіб в розвитку фермерського руху на Хмельниччині. Суть регіонального Форсайту полягає у вивченні та аналізі таких факторів: політичних, соціальних, географічних, демографічних та економічних.
Інститутом проблем ринку та економіко-екологічних досліджень у рамках бюджетної науково-дослідницької роботи, зважаючи на те, що регіони України мають неоднорідний характер розвитку територій встановлено, що найбільш доцільним є формування точок інноваційного розвитку на субрегіональному рівні. Найчастіше місцеві органи самоврядування та районна влада не в змозі самостійно вирішити проблеми, що виходять за рамки адміністративних районів, у той час для обласної влади такі проекти не є пріоритетними. Це ж стосується і приміських територій, які знаходяться поза межами міст,
1 Лупенко, Ю.О., Месель-Веселяк, В.Я. (2012). Стратегічні напрями розвитку сільського господарства України на період до 2020 року. Київ: ННЦ «ІАЕ. 2 Закон про фермерське господарство 2003 (Верховна Рада України). Відомості Верховної Ради України, (45), 363.

EUROPEAN JOURNAL OF ECONOMICS AND MANAGEMENT • Volume 3 Issue 1 2017
99
тобто поза юрисдикцією міської влади, а районні органи влади часто не бажають або не можуть через обмеженість ресурсів вирішувати проблеми великих міст1.
Висновки: З кожним днем технології, все більшу роль відіграють в житті людини і стають невід’ємною частиною існування та функціонування людства, в свою чергу підприємство та влада теж є організмом, але в свою відмінність від людей вони не спішать впроваджувати технології в свої життєві процеси. На відмінну від партнерів з ЄС, де Форсайт – процеси давно знайшли своє відображення не тільки на національному, а й на регіональному рівні, на нашу думку не слід фермерам на оптимальні умови чи допомогу від законодавчої влади, а самим спільно із місцевими органами влади та науковцями створювати оптимальні умови для функціонування та розвитку.
References: 1. Gertler, M.S., Wolfe, D.A. (2004). Local Social Knowledge Management. Futures, 36, 43-51. [in English]. 2. Kaljuzhnova, N.Ja. (2004). Konkurentosposobnost v novoj jekonomike [The competitiveness in the new economy]. Irkutsk: Irkut. un-t., 165 [in Russian]. 3. Kaljuzhnova, N.Ja. (2008). Rol' forsajta v povyshenii konkurentosposobnosti regiona v «novoj jekonomike» [The role of foresight in improving the region's competitiveness in the "new economy"]. Nauka. Innovacii. Obrazovanie [The science. Innovation. Education], (5), 271-279 [in Russian]. 4. Koschatzky, K.N.U.T. (2007). Social Capital and Cooperation within Innovation Systems. Europe-Reflections on Social Capital, Innovation and Regional Development: The Ostuni Consensus. Nowy S¹cz: National-Louis University, 134-142 [in English]. 5. Lapchynskyy V.V (2014). Heoinformatsiyna pidtrymka Forsayt doslidzhen modeley optymizatsiyi sil's'kohospodarskykh zemlekorystuvan [Geoinformation support research models Forsyth optimization of agricultural land use.]. Konferentsiya Ekolohiya i pryrodokorystuvannya v systemi optymizatsiyi vidnosyn pryrody i suspilstva [The Conference of Ecology and Environmental system optimization relationship of nature and society], 207-209. [in Ukrainian]. 6. Lupenko, Yu. O., Mesel-Veselyak, V.Ya. (2012). Stratehichni napryamy rozvytku silskoho hospodarstva Ukrayiny na period do 2020 roku [The strategic directions of development of agriculture of Ukraine till 2020]. Kyiv: NNTs «IAE., 182 [in Ukrainian]. 7. Osypov, V.M., Parasyuk, I.L., Vorozheykin, O.O. (2012). Rol forsayta v upravlinni subrehionom [Forsyth role in managing the S subregion]. Ekonomichni innovatsiyi [Economic innovation], vol. 47, 197-205. [in Ukrainian] 8. Stratehiya rehionalnoho rozvytku Khmelnytskoyi oblasti do 2020 roku [Strategy for Regional Development Khmelnitsky region by 2020] (2011) (Khmelnytska oblasna Rada). Ofitsiynyy sayt Khmel'nytskoyi oblasnoyi Rady [Official website of Khmelnytsky Regional Council] <http://adm.km.ua/doc/RD_Strategy_Khmelnytskyi_12052011_UA.pdf> (2017, January, 10) [in Ukrainian]. 9. Verhoturova, E.V. (2013). Ispolzovanie metodologii upravlenija proektami v Forsajt-proektah [Using the project management methodology in Foresight projects]. Sovremennye problemy nauki i obrazovanija [Modern problems of science and education], 7, 111-119. [in Russian]. 10. Vishnevskij, K.O., Milshina, Ju.V. (2016). Regionalnyj Forsajt: Evropejskij opyt i rossijskaja praktika [Regional Foresight: European experience and Russian practice]. Rossija i zapad: dialog kultur [Russia and the West: the dialogue of cultures], no. 10, 11. [in Russian]. 11. Zacon pro fermerske hospodarstvo 2003. [The law on farming]. Vidomosti Verkhovnoyi Rady Ukrayiny [Bulletin of the Verkhovna Rada of Ukraine], (45), 363. [in Ukrainian].
1Осипов, В.М., Парасюк, І.Л., Ворожейкін, О.О. (2012). Роль форсайта в управлінні субрегіоном. Економічні інновації, вип. 47, 197-205.
ISSN 2533‐4794 EVROPSKÝ ČASOPIS EKONOMIKY A MANAGEMENTU
100
Larysa Lazorenko, PhD in Economics State University of Telecommunications, Kyiv, Ukraine
ROLE OF CORPORATE SOCIAL RESPONSIBILITY IN THE BUSINESS DEVELOPMENT
In the article it is exposed essence of concept of corporate social responsibility and history of its development. Description of features of realization of corporate social responsibility for the different countries, at different enterprises at different terms of activity and in different economic conditions are given. The basic approach to understanding of corporate social responsibility are considered. The basic factors of influence at corporate social responsibility of business in Ukraine are certain. Principles of social responsibility, of Global Agreement of UNO and main positions of standard of ISO 26000 are exposed. The estimation of influence of corporate social responsibility at the achievement of strategic economic and social purposes of development of business in Ukraine are made Key word: corporate social responsibility, purpose, development, business, European Union, Ukraine, standards, activity, enterprise
Corporate social responsibility is a philosophical concept, that determines position of company in relation among the country, society, employees and environment. A modern company understands the responsibility and tries to become a company with a "humane face".
A concept “Corporate social responsibility” began to be used from 1970. In international practice it is used for determination of the voluntarily obligations, undertaken by a company for increasing of level of life and work not only their employees, and also society and environment1.
This concept does not replace a concept "charity" and "public relation", that help companies to deserve the trust of employees and clients. Corporate social responsibility is a more concept. Today some western businessmen for determination of voluntarily obligations use expression - "steady development". Only paying attention to the corporate responsibility, it is possible to provide the reliable and stable conditions for development of business.
A company as an individual members of society must be a socially responsible and assists strengthening of moral principles of society.
In 1960 of ХХ century in society there was a new look at the problem of relations between business and society, in reports and advertisement more often a word "ecology" has been begun. Except that an activity of companies has been estimated also from the point of view of ethicness of their behavior in relation of employees, clients, investors and suppliers. Politics of companies was radically changed: the brought over of business to the decision of social and ecological problems became more effective2.
Opinions of specialists are different regarding the concept, however Adam Smit asserted that "this sphere of activity is, undoubtedly, morally loaded" and its purpose is to create welfare, but not erect welfare exceptionally to gap-fillingness of expense part of any budget.
In the west corporate social responsibility is not perceived only as eleemosynary activity. World practice shows that corporate social responsibility helps to companies to increase business reputation, set the balanced and confidence relationships both of the state and society3.
Passing of Ukraine to steady economic development, its integration to the European and world concord require to input of modern practices of cooperation of the state and business, and
1 Wartick, S.L., Cochran, P.L. (1985). The evolution of the corporate social performance model. Academy of Management Review, 10 (4), 758 2 Swanson, D.L. (1995). Addressing a theoretical problem by reorienting the corporate social performance model. Academy of Management Review, 20(1), 43-64. 3 Wood, D. (1991). Corporate social performance revisited. Academy of Management Review, 16 (4), 713.

EUROPEAN JOURNAL OF ECONOMICS AND MANAGEMENT • Volume 3 Issue 1 2017
101
also business and societies, that would allow to strengthen mutual responsibility of all participants of public life, create conditions for further stable development of society, the best circle of interests.
For today the phenomenon of "social responsibility of business", that understands as responsibility of organization, company for influence of decisions and operating at society environment by transparent and ethic behavior that assists steady development, to the health and welfare of society got distribution in the most economically developed countries of the world; considers for expectation of stakeholders; answers a current legislation and international codes of conduct; integrated in activity of organization and practiced in its relations1.
Thus, social responsibility of business is the voluntarily activity of companies of private and state sectors, sent to the observance of high standards of operating and productive activity, social standards and quality of work with a personnel, minimization of harmful influence at an environment and others like that, for the smoothing of present economic and social disproportions; creation of trustful mutual relations among business, society and state; an improvement of effectiveness of business and indexes of profitability in a long-term period.
In the modern world socially responsible activity of business is the generally accepted rule that is kept of large, middle and even small companies all the world. Taking into account an emergency public and economic benefit, that contains social responsibility of business, question of its development belong to the sphere of the special attention of public of many countries of all the world and leading international organizations. The display of this attention is development of standards of social responsibility of business and events for stimulation of business to socially responsible activity.
In most countries of European Union the government programs of support and stimulation of social responsibility of business are worked out and function in a different form. By these programs the state determines desirable behavior for business, attaches the companies of private and state sectors to general implementation of socially important tasks, materially stimulates business for socially responsible activity and so on.
Basic descriptions of social responsibility of business are voluntarily; integrating into the business strategy of organization, company; system; benefit for all stakeholders: employees, consumers, shareholders, citizens and others like that, and also for an enterprise; payment into the process of steady development. Social responsibility is not limited by charity2.
Social responsibility of business contains procedures and practices of companies of seven aspects of activity3:
1) organizational management; 2) human rights; 3) labour relations; 4) ethic operating activity; 5) defence of environment; 6) protection of consumers; 7) development of local communities and collaboration with them. Social responsibility of business in Ukraine is in the stage of becoming. The most active in
the field are offices of foreign companies, that carry on Ukrainian soil modern world practices, principles and standards, and also big and small domestic enterprises and organizations that during
1 Баюра, Д.М. (2009). Корпоративна соціальна відповідальність у системі корпоративного управління. Україна: аспекти праці, 1, 21. 2 Aras, G., Aybars, A., Kutlu, O. (2010). Managing corporate performance: Investigating the relationship between corporate social responsibility and financial performance in emerging markets. International Journal of Productivity and Performance Management, Vol. 59, 3, 229–254. 3 Благов, Ю.Е. (2011). Корпоративная социальная ответственность: еволюция концепции. Cанкт-Петербург.
ISSN 2533‐4794 EVROPSKÝ ČASOPIS EKONOMIKY A MANAGEMENTU
102
the last 15 years perfect the activity at the principles of conceptions of the General quality management. However, this process needs certain coordination and stimulation and influence of state that must define social responsibility of business as desirable behavior for business and work out the complex of corresponding stimuls.
At the same time it is necessary to realize that social responsibility of business is directly related by the level of business perfection of enterprises, organizations and establishments. So, if they are not perfect, then it will be impossible to satisfy the necessities of all stakeholders. It is important to pay attention in Ukraine, where the level of business perfection of the most of organizations is substantially below than such level in the developed countries.
For this reason in Ukraine support of the state is needed for underlining of importance of ethic and socially responsible behavior of companies, advancement of the best practices of domestic companies of social responsibility in Ukraine and abroad and for the increase of prestige of perfect organizations and processes of continuous system perfection. It will allow for the most companies to strengthen a long-term competitiveness and reputation through practices of responsible attitude toward the employees, consumers and other stakeholders.
Now it is more actual by modern globalization and integration processes, because governments of the foreign countries give big value for the processes of work of the companies on markets that develop, and inhibition by the standards in relation of providing of human, labour relations, guard of environment.
It is important to create the complex of norms, rules, separate organizational mechanisms and favourable conditions for integration of social responsibility of business in activity of companies for the steady development of Ukraine, increase of public welfare and decision of questions certain in national position papers.
For development of social responsibility of business in modern time it is necessary to provide a Strategy of social responsibility of business.1
Basic tasks of the Strategy are: development of social responsibility of business as a factor of modernisation of economy,
increase of its competitiveness with the aim of confession of Ukrainian business at the world as socially responsible, its facilitated integration in international markets, increases of public welfare and decisions of questions certain in national position papers;
to input only one understanding of social responsibility of business in Ukraine by all groups of the stakeholders;
development of the system of the unfinancial accounting for the given more information for society about different aspects of social responsibility of business;
improvement of existing and development of new forms of state-private partnership for the economic, social and ecological development of communities;
forming of the effective system of social and public dialogue; creation of pre-conditions for the guarantees of providing of human, ethic education and
education of members of society rights; development of the programs of given of resources and energy efficiency, "planting" of
greenery of business and economy of country; development of processes of business improvement of enterprises, organizations and
establishments. Also, social responsibility of business can be presented as a system of values, events and
processes, that purpose is distributions of positive influence of activity of company in economic, ecological, social spheres into organization and at an environment. Realization of socially responsible strategies must be oriented not only for reduction and prevention of negative
1 Abagail McWilliams. (2005). Corporate Social Responsibility: Strategic Implications. Department of Economics, Rensselaer Polytechnic Institute, 0506.

EUROPEAN JOURNAL OF ECONOMICS AND MANAGEMENT • Volume 3 Issue 1 2017
103
consequences of activity but also on the achievement of economic, ecological and social effects, that can be as basis of increase of competitiveness of separate companies and national economy.
By determination of European Commission corporate social responsibility is "conception according by that companies integrate social and ecological questions in the commercial activity and cooperating with stakeholders at the voluntarily basis"1.
Social responsibility of business is known among the European countries. In some countries it is integrated in public politics (Denmark, France, Finland, Sweden), in other - socially responsible practices are exceptionally the prerogatives of companies (Greece, Ireland, Netherlands, Slovenia). In European Union the basic role of social responsibility of business consists in support of steady development of companies, as a result is improvement of situation at the market of labour, and also quality of products and services that is provided by companies2.
Social responsibility of business context can be defined as such, that operates at three basic levels3:
1. Observance of legal duty before the state and society (tax payment, health protection and safety of labour, ecological norms) and industry standards.
2. Minimization or removal of negative influence of business for society and management risks (for example, violation of human rights or contamination of environment).
3. Strengthening of positive influence of business for society and creation of values through innovations, investments and partnership, directed to social and ecological welfare (for example, creation of workplaces, social and economic development, decision of conflicts).
Necessity of development of social responsibility of business in Ukraine predefined by the factors :
1. Low level of corporate culture and, as a result, financial and economic weakness of considerable part of companies in Ukraine is one of the most widespread obstacles. Activity of economically weak subjects oriented to the survival, and society and state often occupy opposition to business position. Such general situation at a background the permanent shortage of facilities does not assist distribution of ideas and principles of social responsibility at national level.
2. Legal nihilizm and deformation of legal consciousness - in Ukraine the culture of respect is only formed to the laws. Now many companies try to go round a law, but not keep it. Unfortunately, business as the most active and creative subject of public life is not an exception. Partly it is explained by quality of laws that is accepted in Ukraine, their instability and selectivity of application.
3. Low level of realization of business role society - through relatively of short duration modern history of home business and more short practice of realization to them of own social responsibility in Ukrainian society are not almost formed correct understanding of business efforts in this direction.
4. Terminological vagueness - the late including of home enterprise circles to the association of socially responsible business in Ukraine is observed elementary not understanding by both business and other members of society of basic tasks and mechanisms of realization of strategies of social responsibility.
5. Closed of the Ukrainian companies for public - for the most companies the detailed information about its activity is data for the especially internal using. Only 25 % of enterprises have the ratified codes of behavior (mission, code of ethic rules, proclaimed values and so on).
6. Defect in realization of politics of social responsibility by the Ukrainian companies. Social responsibility of the Ukrainian companies and organizations is directed, first of all, on
1 Зелена книга Європейського Союзу. <http://www.rsppenergy.ru/main/static.asp?art_id=1552> 2 Frederick, W.C. (1994). From CSR-1 to CSR-2: the maturing of business-and-society thought. Business and Society, Vol. 33(2), 150-164. 3 Schwartz, M., Carroll, A. (2003). Corporate social responsibility: a three-domain approach. Business Ethics Quarterly, Vol. 13(4), 503.

ISSN 2533‐4794 EVROPSKÝ ČASOPIS EKONOMIKY A MANAGEMENTU
104
labour practices and events for health protection and safety of consumers. Less widespread there are events about protection of natural resources and co-operating with society: only one third of companies carries out social investments in society, the half of enterprises does not accept measures for the guard of environment
Actuality of development of social responsibility of business in Ukraine is explained by its influence to getting of economic and social purposes1.
Economic purposes: 1. Providing of competitiveness of national economy through the improvement of
principles of transparency and accountability of activity of companies in Ukraine; an increase of investments into the education of workers, their continuous studies and employment;
2. Stable and predictable internal market development and increase of efficiency of its functioning;
3. Forming of attractive national innovative infrastructure through aspiration of investments in the newest technologies;
4. Grant of modern tool for government control: clear signals from the state in relation to importance of social responsibility of business, stimulations without strengthening of administrative pressure, assistance and encouragement to social responsibility of business of all participants of market, including of principles of social responsibility;
5. Development of culture of consumption and increase of level of awareness of consumers. Social responsibility of business induces consumers interested at the ecological, economic and social aspects of products and services, and also reputation of producer, that becomes the rendering-engine of development of social responsibility of business among companies;
6. Distribution in Ukraine of control system by quality of organization of production (ISO 9000). Domestic companies that inculcate control system by quality of management and that are leaders in introduction of business perfection present an example for other enterprises, including from European countries.
7. Increase of business-culture in a country: the level of awareness and degree of understanding of social responsibility of business among proprietors, leaders of companies, business-partners, workers, suppliers, representatives of mass, state and non-state organizations and other groups medias determine the degree of development of business-culture in a country, that it is especially important for the investment attractiveness of market.
Social purposes: 1. Correct perception of business as phenomena for the populations. In Ukrainian society
there is opinion about success one company due unsuccess other. Because of activity of companies, that has signs of social responsibility, is often perceived by society as a due. Traditionally meaningful for Ukraine are charity;
2. Higher level of integration to the labour-market and social attracted: aspiration of enterprises to attract more representatives of the vulnerable groups of population and continuous studies of workers diminishes social stratification and assists overcoming of poverty and respect to the human rights;
3. Development of innovations in the field of social: conditioning, that will assist innovative activity of labour.
Development of the strategy of social responsibility of business is also assisted the external factors:
Necessity of positioning of Ukraine for an international environment - practice of activity of world leaders of business for 20 last years proves that social responsibility left off to carry selective character, be the "whim" of successful companies. Opposite, social responsibility of
1 Концепція Національної стратегії соціальної відповідальності бізнесу в Україні. <http//www.uspp.org.ua/media/%20КСВ+.doc>

EUROPEAN JOURNAL OF ECONOMICS AND MANAGEMENT • Volume 3 Issue 1 2017
105
business today is a substantial and inalienable constituent to the business process, supported by not only companies in the different regions of planet but also international organizations.
It is also impossible to ignore certain standardization of different aspects of activity of organizations that belong to social responsibility, including operating activity, ecological management, labour relations
European Commission considers social responsibility of business as a part of payment in steady development and Strategy of the European economic increasing and employment, because social responsibility of business assists the achievement of different aims, in particular, public solidarity, economic competitiveness and more rational using of natural resources1.
In EU social responsibility of business is included to politics of employment and social businesses, politics of enterprise, protection of environment and consumer, politics of the public purchasing and external relationships. The priorities of EU are also in relationships with partners, countries programs of neighbourhood and East partnership, that Ukraine belongs.
From November, 2007, Ukraine joined to the international group of development project of international standard ISO 26000 "Management of social responsibility". During three years the Ukrainian experts worked at the project of the marked international standard. In 2010 Ukraine accepted international standard ISO 26 000 " Management of social responsibility"2.
From 2005 the national network of companies and organizations that declared the devotion to principles of the Global agreement functions in Ukraine. Basis of the Global agreement are 10 principles in the spheres of human, labour relations, environment and counteractions of corruption, that is the original code of ethic corporate behavior and an observance of that in the activity is obligatory for participants. A requirement for companies there is annual reports about realization of principles of the Global agreement in everyday activity3.
During last 10 years 8000 companies and other organizations from more than 130 countries joined to the Global agreement. In Ukraine the single-site network of the Global agreement exists from 2006 and unites over 160 participants - from big international and Ukrainian companies to the middle and small enterprises, and also ungovernmental organizations, academic establishments, business-associations so on
For today Global agreement is the best platform for development of corporate social responsibility in Ukraine.
A presence of demand from the investors and financial institutes and introduction organization, a practical stimulates the company for development own politics of social responsibility. Paying attention on criteria of social responsibility in the estimation of business by investors at the organized financial markets, the funds of the direct investing and investment bankers assists distribution and introduction of social responsibility of business especially among companies with the mainly Ukrainian capital. Stimulation of long duration investments from foreign countries provides stability and predictability of internal market development.
In the process of realization of strategy of social responsibility of business in Ukraine the institutional mechanisms of distribution of social responsibility of business must be created among the Ukrainian organizations. The marked mechanisms must lean international experience for development of competitiveness of economy and increasing of life of citizens.
1 Нова стратегія Європейської комісії з корпоративної соціальної відповідальності (КСВ) 2011–2014. <http://www.csr-ukraine.org/ ctrategiya_evropeyskoi_komisii_.htm> 2 Стандарт ISO 26000 «Настанова по соціальній відповідальності». <http://istoryk.at.ua/forum/15-660-1> 3 Глобальний договір ООН. <http://www.globalcompact.org.ua/ua/about/what>
ISSN 2533‐4794 EVROPSKÝ ČASOPIS EKONOMIKY A MANAGEMENTU
106
References: 1. Abagail, McWilliams. (2005). Corporate Social Responsibility: Strategic Implications. Department of Economics, Rensselaer Polytechnic Institute, 0506. [in English]. 2. Aras, G., Aybars, A., Kutlu, O. (2010). Managing corporate performance: Investigating the relationship between corporate social responsibility and financial performance in emerging markets. International Journal of Productivity and Performance Management, Vol. 59, 3, 229–254. [in English]. 3. Baura, D.M. (2009). Korporatyvna socialna vigpovigalnist v systemi korporatyvnogo upravlinnya [Corporative social responsibility in system of corporative management]. Ukraina: aspekty praci [Ukraine: aspects of work], 1, 21. [in Ukrainian]. 4. Blagov, U.E. (2011). Korporativnaya socialnaya otvetstvennoct: evolucia koncepcii [Corporative social responsibility: evolution of concept]. Sankt-Petersburg. [in Russian]. 5. Frederick, W.C. (1994). From CSR-1 to CSR-2: the maturing of business-and-society thought. Business and Society, Vol. 33(2), 150–164. [in English]. 6. Globalnyi Dogovir OON. [Global Agreement of OUN]. <http://www.globalcompact.org.ua/ua/about/what>. [in Ukrainian]. 7. Koncepciya Nacionalnoyi strategii socia’lnoi’ vigpovidal’nosti biznesu v Ukraini [Concept of National Strategy of social responsibility of business in Ukraine]. <http//www.uspp.org.ua/media/%20КСВ+.doc>. [in Ukrainian]. 8. Nova strategiya Jevropejskoi komisii z korporatyvnoi socialnoi vidpovidalnosti (KSV) 2011–2014 [New strategy of European Commission of corporate social responsibility (CSR) 2011-2014]. <http://www.csr-ukraine.org/ ctrategiya_evropeyskoi_komisii_.html>. [in Ukrainian]. 9. Schwartz, M. (2003). Corporate social responsibility: a three-domain approach. Business Ethics Quarterly, Vol. 13(4), 503. [in English]. 10. Standart ISO 26000 Nastanova po socialni vidpovidalnosti [Guidance on social responsibility]. <http://istoryk.at.ua/forum/15-660-1>. [in Ukrainian]. 11. Swanson, D.L. (1995). Addressing a theoretical problem by reorienting the corporate social performance model. Academy of Management Review, 20(1), 43–64. [in English]. 12. Wartick, S.L., Cochran, P.L. (1985). The evolution of the corporate social performance model. Academy of Management Review, 10 (4), 758. [in English]. 13. Wood, D. (1991). Corporate social performance revisited. Academy of Management Review, 16 (4), 713. [in English]. 14. Zelena knyga Jevropeyskogo Souzu [Green book of European Union]. http://www.rsppenergy.ru/main/static.asp?art_id=1552. [in Ukrainian].

EUROPEAN JOURNAL OF ECONOMICS AND MANAGEMENT • Volume 3 Issue 1 2017
107
Запрошуємо до участі в журналі
«ЄВРОПЕЙСЬКИЙ ЖУРНАЛ ЕКОНОМІКИ ТА МЕНЕДЖМЕНТУ» Журнал індексується в міжнародній науковометричній базі даних International Scientific Indexing
Журнал виходить 6 разів на рік.
Статті для публікації в першому номері журналу приймаються до 1 лютого і виходять друком
до 28 лютого.
Статті для публікації в другому номері журналу приймаються до 1 квітня і виходять друком
до 30 квітня.
Статті для публікації в третьому номері журналу приймаються до 1 червня і виходять друком
до 30 червня.
Статті для публікації в четвертому номері журналу приймаються до 1 серпня і виходять друком
до 31 серпня.
Статті для публікації в п’ятому номері журналу приймаються до 1 жовтня і виходять друком
до 31 жовтня.
Статті для публікації в шостому номері журналу приймаються до 1 грудня і виходять друком
до 31 грудня.
Вимоги до рукописів: Обсяг статей: 10 – 30 сторінок (для розрахунку сторінок використовується шрифт Times New Roman,
кегль 14, міжрядковий інтервал – полуторний).
Статті приймаються українською, чеською, польською, англійською, німецькою, французькою мовами.
В статті, яка подається для публікації в журналі, обов’язково мають бути враховані наступні вимоги:
– прізвище та ім’я автора, назва статті, анотація (обсягом 700-900 знаків) та ключові слова подаються
двома мовами: мовою статті та англійською мовою;
– повні відомості про автора: звання, ступені, посада, місце роботи також подаються мовою статті та
англійською мовою;
– посилання на джерела та літературу робляться посторінково та подаються мовою оригіналів, тобто не
перекладаються та не транслітеруються;
– звичайний список літератури наприкінці статті не подається, але водночас
– наприкінці статті додатково розміщується список цитованої та використаної у статті літератури в
«латинізованому» вигляді: в ньому всі кириличні літери транслітеруються латиницею.
Бібліографічні описи джерел і літератури у посиланнях та списку літератури мають бути оформлені
згідно з угодами APA (American Psychological Association). Нижче наведено зразки оформлення
бібліографічних джерел.
Ілюстрації до статей (графіка і малюнки) подаються у форматі TIFF або JPEG (кожен малюнок в
окремому файлі).
При підготовці ілюстрацій слід мати на увазі, що в журналі не використовується кольоровий друк.
Рукописи, які не відповідають цим технічним вимогам, редакція не реєструє і не розглядає з метою
публікації.
Адреси для листування:
E-mail: [email protected]
Офіційний сайт: http://eujem.cz
Поштова адреса:
Головний офіс: BEROSTAV DRUŽSTVO, Vlastislavova 562/15, 140 00, Praha 4 – Nusle
EVROPSKÝ ČASOPIS EKONOMIKY A MANAGEMENTU
108
Зразки оформлення бібліографічного опису джерел і літератури згідно з угодами APA (American
Psychological Association) порівняно з ДСТУ ГОСТ 7.1:2006:
Загальні правила: посторінкові посилання на джерела та літературу подаються мовою оригіналів, тобто не
перекладаються та не транслітеруються.
Місяць перегляду web-сторінки подається мовою статті.
Цитати також подаються мовою статті.
Приклад оформлення
посилання згідно вимог ДСТУ
(для порівняння)
Приклад оформлення посилання
згідно вимог АРА, які прийняті
в журналі
При посиланні на книгу цілком:
Noland M. Industrial Policies and Growth: Lessons from
International Experience / M. NoIand, H. Pack. –
Santiago : Central Bank of Chile, 2002. – 85 p.
NoIand, M., Pack, H. (2002). Industrial Policies and
Growth: Lessons from International Experience. Santiago:
Central Bank of Chile.
При посиланні на окремі сторінки книжкових та періодичних видань:
Noland M. Industrial Policies and Growth: Lessons from
International Experience / M. NoIand, H. Pack. –
Santiago : Central Bank of Chile, 2002. – P. 51.
NoIand, M., Pack, H. (2002). Industrial Policies and
Growth: Lessons from International Experience. Santiago:
Central Bank of Chile, 51.
Brada J.C. Industrial Policy in Hungary: Lessons for
America / J.C. Brada // Cato Journal. – 1984. –Vol. 4. –
№2. – P. 485-487.
Brada, J.C. (1984). Industrial Policy in Hungary: Lessons
for America. Cato Journal, Vol. 4, 2, 485-487.
Rodrik D. Development Strategies for the Next Century /
D. Rodrik // Annual Bank Conference on Development
Economics / Preprint – 2000. – April 18-20. –
Washington, D.C.
Rodrik, D. (2000). Development Strategies for the Next
Century. Annual Bank Conference on Development
Economics. Preprint. April 18-20. – Washington, D.C.
Dash M. Granger Causality and the Capital Asset Pricing
Model / M. Dash // Journal of Applied Management and
Investments. – 2014. – Vol. 3. – No. 2. – P. 68-73.
Dash, M. (2014). Granger Causality and the Capital Asset
Pricing Model. Journal of Applied Management and
Investments, Vol. 3, 2, 68-73.
Shah R. GDP Nos. Dance in Tune With FII Play /
R. Shaf // The Economic Times. – 2012, May 7. – P. 1.
Shah, R. (2012, May 7). GDP Nos. Dance in Tune With FII
Play. The Economic Times, 1.
Allegret J. P. Current accounts and oil price fluctuations
in oil-exporting countries: The role of financial
development / J. P. Allegret, Couharde C., D. Coulibaly,
V. Mignon // Journal of International Money and
Finance. – 2013. – Vol. 47. – P. 185-201.
Allegret, J.P., Couharde, C., Coulibaly, D., Mignon, V.
(2013). Current accounts and oil price fluctuations in oil-
exporting countries: The role of financial development.
Journal of International Money and Finance, Vol. 47, 185-
201.
Sulphey M. M. Orientation towards Finances: Testing of
ORTOFIN Scale in the Indian Context / M. M. Sulphey,
S. Nisa // Journal of Applied Management and
Investments. – 2014. – Vol. 3. – No. 4. – P. 257-264.
Sulphey, M.M., and Nisa, S. (2014). Orientation towards
Finances: Testing of ORTOFIN Scale in the Indian Context.
Journal of Applied Management and Investments, Vol. 3, 4,
257-264.
Goncharuk A. G. About the Efficiency of Meat
Production in Ukraine / A. G. Goncharuk, O. V.
Pogorelova // Journal of Applied Management and
Investments. – 2012. – Vol. 1. – No. 2. – P. 202-204.
Goncharuk, A.G.,Pogorelova, O.V. (2012). About the
Efficiency of Meat Production in Ukraine. Journal of
Applied Management and Investments, Vol. 1, 2, 202-204.
При посиланні на web-ресурси
посилання включає ім’я автора сторінки, назву сторінки, назву сайту (набирається курсивом), адресу сайту
(URL), виділену знаками <>, та, за можливості, дату останнього перегляду сайту (в круглих дужках)
автором посилання:
Costello A. Best Practices in Exploratory Factor
Analysis: Four Recommendations for Getting the Most
From Your Analysis / A. Costello, J. Osborne // Practical
Assessment, Research and Evaluation. – 2005. – Vol. 10.
– No. 7. Available at: http://pareonline.net/pdf/v10n7.pdf
(accessed January 5 2015).
Costello, A. Osborne, J. (2005). Best Practices in
Exploratory Factor Analysis: Four Recommendations for
Getting the Most From Your Analysis. Practical
Assessment, Research and Evaluation, Vol. 10, 7.
<http://pareonline.net/pdf/v10n7.pdf> (2015, January, 5).
Akram M. Do crude oil price changes affect economic
growth of India Pakistan and Bangladesh? / M. Akram,
R. Mortazavi. Available at: http://www.diva-
Akram, M., Mortazavi, R. (2011). Do crude oil price
changes affect economic growth of India Pakistan and
Bangladesh? Digitala Venenskapliga Arkivet.
EUROPEAN JOURNAL OF ECONOMICS AND MANAGEMENT • Volume 3 Issue 1 2017
109
portal.org/smash/get/diva2:551295/FULLTEXT02
(accessed January 2 2015).
<http://www.diva-
portal.org/smash/get/diva2:551295/FULLTEXT02> (2015,
January, 2).
CACSS // Le plus petit cirque du monde. – Centre des
Arts du Cirque Sud-de-Seine, 2008. Available at:
http://www.lepluspetitcirquedumonde.fr/articles/categori
e/num/48/ (accessed July 1 2012)
CACSS (2008). Le plus petit cirque du monde. Centre des
Arts du Cirque Sud-de-Seine.
<http://www.lepluspetitcirquedumonde.fr/articles/categorie/
num/48/> (2012, July, 1).
Посилання на законодавчі акти та правові документи:
Угоди: International Covenant on Civil and Political Rights (adopted 16 December 1966, entered into force 23 March 1976)
999 UNTS 171 (ICCPR). <https://treaties.un.org/doc/Publication/UNTS/Volume%20999/volume-999-I-14668-
English.pdf> (2013, листопад, 21),
Международный пакт о гражданских и политических правах (принят 16 декабря 1966 года, вступил в силу 23
марта 1976 года) 999 Сборник договоров ООН (МПГПП).
<http://www.un.org/ru/documents/decl_conv/conventions/pactpol.shtml> (2013, листопад, 21)
При посиланні на статтю Конвенції: International Covenant on Civil and Political Rights (adopted 16 December 1966, entered into force 23 March 1976)
999 UNTS 171 (ICCPR) art 2. <https://treaties.un.org/doc/Publication/UNTS/Volume%20999/volume-999-I-14668-
English.pdf> (2013, ноябрь, 21)
Резолюція 2061 (ухвалена 25 липня 2012 року) РБ ООН. <http://zakon4.rada.gov.ua/laws/show/995_k87> (2013,
листопад, 21)
Двосторонні угоди: Угода між Кабінетом Міністрів України та Урядом Російської Федерації про співробітництво в галузі
авіаційного пошуку і рятування (Угоду затверджено Постановою КМ № 1094 від 28.11.2012) (прийнята 28
листопада 2012 року, набрала чинності для України 18 лютого 2013 року). Офіційний вісник України, 29, 130.
Agreement Concerning the Sojourn of Refugees within the Meaning of the Convention Relating to the Status of
Refugees (Geneva Convention of 28 July 1951 and Protocol Relating to the Status of Refugees of 31 January 1967)
(France – Austria) (adopted 21 October 1974, entered into force 24 July 1975) 985 UNTS 303.
Рекомендації СОП: МОТ Рекомендация № 195 (О развитии людских ресурсов: образование, подготовка кадров и непрерывное
обучение) (92 сессия Генеральной конференции МОТ, 17 июня 2004 года). Офіційний сайт Верховної Ради
України. <http://zakon4.rada.gov.ua/laws/show/993_532> (2013, листопад, 21).
Документи ООН Декларация о предоставлении независимости колониальным странам и народам, ГА ООН Резолюция 1514
(XV) (14 декабря 1960 года)
UNGA Res 51/210 (17 December 1996) UN Doc A/RES/51/210.
<http://www.un.org/documents/ga/res/51/a51r210.htm> (2013, листопад, 21)
Документи судів
Документи Міжнародного суду Land, Island and Maritime Frontier Case (El Salvador/Honduras, Nicaragua intervening) (Application for
Intervention) [1990] ICJ Rep 92 <http://www.icj-
cij.org/docket/index.php?sum=390&code=sh&p1=3&p2=3&case=75&k=0e&p3=5> (21 липня 2013).
Legal Consequences of the Construction of a Wall (Advisory Opinion) 2004 <http://www.icj-
cij.org/icjwww/idocket/imwp/imwpframe.htm> (21 липня 2013).
Case Concerning the Vienna Convention on Consular Relations (Germany v USA) (Request for the Indication of
Provisional Measures: Order) General List No 104 [1999] ICJ 1.
Закони та законодавчі акти тощо Закон про виконавче провадження 1999 (Верховна Рада України). Офіційний вісник України, 19, 194.
Закон про виконавче провадження 1999 (Верховна Рада України). Офіційний сайт Верховної Ради України.
<http://zakon1.rada.gov.ua/laws/show/606-14> (2013, листопад, 21).
Цивільний кодекс 2003 (Верховна Рада України). Офіційний сайт Верховної Ради України.
<http://zakon2.rada.gov.ua/laws/show/435-15/page5> (2013, листопад, 21).

EVROPSKÝ ČASOPIS EKONOMIKY A MANAGEMENTU
110
Розпорядження про схвалення Концепції сприяння органами виконавчої влади розвитку громадянського
суспільства 2007 (Кабінет Міністрів України). Офіційний вісник України, 89, 89.
Посилання на статтю кодексу, закону, конституції тощо Цивільний кодекс, ст. 56, гл. 6 (2003) (Верховна Рада України). Офіційний сайт Верховної Ради України.
<http://zakon2.rada.gov.ua/laws/show/435-15/page5> (2013, листопад, 21)

EUROPEAN JOURNAL OF ECONOMICS AND MANAGEMENT • Volume 3 Issue 1 2017
111
Zveme vás k účasti v časopise!
EVROPSKÝ ČASOPIS EKONOMIKY A MANAGEMENTU
Časopis vychází šestkrát ročně.
Články pro zveřejnění v prvním dílu časopisu jsou přijímány do dne 01. února a musí byt publikováné do dne
28. února.
Články pro zveřejnění v druhém dílu časopisu jsou přijímány do dne 01. dubna a musí byt publikováné do dne
30. dubna.
Články pro zveřejnění v třetím dílu časopisu jsou přijímány do dne 01. června a musí byt publikováné do dne
30. června.
Články pro zveřejnění v čtvrtém dílu časopisu jsou přijímány do dne 01. srpna a musí byt publikováné do dne
31. srpna.
Články pro zveřejnění v pátém dílu časopisu jsou přijímány do dne 01. října a musí byt publikováné do dne
31. října.
Články pro zveřejnění ve šestém dílu časopisu jsou přijímány do dne 01. prosince a musí byt publikováné do
dne 31. prosince.
Požadávky k rukopisům: Objem - 10 - 30 stranek.
Jazyk članků – česky, ukrajinský, angličtina, francouzština, němčina.
U článků podávaných v libovolném jazyce, nezbytně v angličtině musí být uvedeno :
Anotace objemem 700-900 znaků, název članku a úplná informace o autorovi: jméno a příjmení, titul,
akademický titul, prácovní funkce, postavení, zaměstnání.
Poznámky pod čarou – na každé stránce.
Odkazy na zdroje na konci článku - volitelný.
Bibliografické popisy zdrojů a odkazy by měly být poskytováné na základě norem APA (American
Psychological Association).
Ilustrace k článkům (grafické a výkresy) musí byt uvedený ve formátu
TIFF nebo JPEG (každá postava v samostatném souboru/dokumentu).
Všimněte si, prosíme, při zpracování ilustraci že v časopisu není použit barevný tisk.
Rukopisy které nesplňují tyto technické požadavky redakční kolégie neregistruje a nebude probírat s účelem
tisku a zveřejnění.
Adresa pro korespondenci:
E-mail: [email protected]
Web: http://eujem.cz
Adresa:
BEROSTAV DRUŽSTVO, Vlastislavova 562/15, 140 00, Praha 4 – Nusle

EVROPSKÝ ČASOPIS EKONOMIKY A MANAGEMENTU
112
Vzorec bibliografického popisu zdrojů a literatury v rámci dohod APA (American Psychological Association) ve srovnání s ДСТУ ГОСТ 7.1:2006 (Státní Rada ze standartizace a metrologie
Ukrajiny):
Všeobecné pravidlo: odkazy na originálné zdroje a literaturu jsou předložené v původním jazyce, t.je. není
přeložený a ne přepsaný.
Měsíc přečtění web-stránky je uvedén v jazyce sepsání článku.
Citaty z jazykových verzí zahraničních, pokud jsou k dispozici, obsahuje také jazykově původní článek.
1. Když se odkazuje na celé knihu jako celek:
Kelsen, H. (2009). General Theory of Law and State. Harvard: Harvard University Press.
[Podle ДСТУ to bude mít další podobu: Kelsen, H. General Theory of Law and State / H. Kelsen. – Harvard :
Harvard University Press, 2009. – 516 p.]
Když se odkazuje na stránku 17:
Kelsen, H. (2009). General Theory of Law and State. Harvard: Harvard University Press, 17.
2. Když se odkazuje na celé knihu jako celek:
Алмонд, Г., Пауэлл Дж., Стром К, Далтон Р. (2002). Сравнительная политология сегодня. Москва: Аспект
Пресс.
Když se odkazuje na stránky 13-15:
Алмонд, Г., Пауэлл Дж., Стром К, Далтон Р. (2002). Сравнительная политология сегодня. Москва: Аспект
Пресс, 13–15.
[Podle ДСТУ to bude mít další podobu: Алмонд Г. Сравнительная политология сегодня / Г. Алмонд, Дж.
Пауэлл, К. Стром и др.; сокр. пер. с англ. А. С. Богдановского, Л. А. Галкиной; под ред. М. В. Ильина, А. Ю.
Мельвиля. – М. : Аспект Пресс, 2002. – 537 с.]
3. Giumelli, F. (2013). How EU sanctions work: a new narrative. Chaillot Papers, 129.
[Podle ДСТУ to bude mít další podobu: Giumelli, F. How EU sanctions work: a new narrative / F. Giumelli //
Chaillot Papers. – 2013. – P.129.]
4. Манхейм, К. (1994). Диагноз нашего времени. Москва: Юрист. [Podle ДСТУ to bude mít další podobu::
Манхейм К. Диагноз нашего времени: пер. с нем. и англ. / К. Манхейм. – М. : Юрист, 1994. – 700 с.]
5. Nigro, F., Nigro, L. (1970). Modern Public Administration. New York: Harper and Row. [Podle ДСТУ to bude
mít další podobu: Nigro F. Modern Public Administration / F. Nigro, L. Nigro. – New York : Harper and Row, 1970. –
490 p.]
6. Rosenau, J. N. (2004). Governance. In T. J. Sinclair (Ed.), Global Governance. Critical Concepts in Political
Science, 1, (p. 405). London, New York. [Podle ДСТУ to bude mít další podobu: Rosenau J. N. Governance / J. N.
Rosenau // Global Governance. Critical Concepts in Political Science ; ed. by T. J. Sinclair. – London : New York,
2004. – Vol. 1. – P. 405.]
7. Když se uvádí odkazy na webové stránky, položka musí obsahovat jméno autora té stránky, titulní stranku
(anebo její název), název webu (uvedený kurzívou), webovou adresu (URL) zvýrazněnou znaky <>, a také, pokud
je to možné, datum, kdy naposledy byla webová stránka aktualizjvaná (v závorkách) autorem odkazu:
EU Creating Court for Kosovo War Crimes. EPOCH Times. <http://www.theepochtimes.com/n3/601421-eu-
creating-court-for-kosovo-war-crimes/>
Монтескье Ш. Избранные произведения. О духе законов. Электронная библиотека bookZ.ru.
<http://bookz.ru/authors/montesk_e-6arl_-lui/montes01/1-montes01.html> (21. listopadu 2013).
8. Odkazy na právní předpisy a právní dokumenty:
Dohody:
International Covenant on Civil and Political Rights (adopted 16 December 1966, entered into force 23 March
1976) 999 UNTS 171 (ICCPR). <https://treaties.un.org/doc/Publication/UNTS/Volume%20999/volume-999-I-14668-
English.pdf> (21. listopadu 2013);
EUROPEAN JOURNAL OF ECONOMICS AND MANAGEMENT • Volume 3 Issue 1 2017
113
Международный пакт о гражданских и политических правах (принят 16 декабря 1966 года, вступил в силу
23 марта 1976 года) 999 Сборник договоров ООН (МПГПП).
<http://www.un.org/ru/documents/decl_conv/conventions/pactpol.shtml> (21. listopadu 2013).
Když se odkazuje na článek Úmluvy (Konvence):
International Covenant on Civil and Political Rights (adopted 16 December 1966, entered into force 23 March
1976) 999 UNTS 171 (ICCPR) art 2. <https://treaties.un.org/doc/Publication/UNTS/Volume%20999/volume-999-I-
14668-English.pdf> (21. listopadu 2013).
Резолюція 2061 (ухвалена 25 липня 2012 року) РБ ООН. <http://zakon4.rada.gov.ua/laws/show/995_k87> (21.
listopadu 2013).
Dvoustranné dohody:
(Dohoda mezi Vládou Ukrajiny a Vládou Ruské federace o spolupráci v oblasti hledání v letectví a záchránění.
(Dohoda je schválená usnesením Kabinerz Ministrů Ukrajiny № 1094 ode dne 28.11.2012) (je přijaté dne 28.
listopadu 2012, vstoupila v platnost pro Ukrajinu 18-ho února 2013). Офіційний вісник України, 29, 130. )
Agreement Concerning the Sojourn of Refugees within the Meaning of the Convention Relating to the Status of
Refugees (Geneva Convention of 28 July 1951 and Protocol Relating to the Status of Refugees of 31 January 1967)
(France – Austria) (adopted 21 October 1974, entered into force 24 July 1975) 985 UNTS 303.
Doporučení СОП (Služba uspořádání dopravy):
МОТ Рекомендация № 195 (О развитии людских ресурсов: образование, подготовка кадров и непрерывное
обучение) (92 сессия Генеральной конференции МОТ, 17 июня 2004 года). Офіційний сайт Верховної Ради
України. <http://zakon4.rada.gov.ua/laws/show/993_532> (2013, листопад, 21).
МОТ Рекомендация № 195 (О развитии людских ресурсов: образование, подготовка кадров и непрерывное
обучение) (92 сессия Генеральной конференции МОТ, 17 июня 2004 года). Oficiální webová stránka Nejvyšší
rady Ukrajiny <http://zakon4.rada.gov.ua/laws/show/993_532> (21. listopadu 2013).
Dokumenty OSN:
Декларация о предоставлении независимости колониальным странам и народам, ГА ООН Резолюция 1514
(XV) (14 декабря 1960 года)
UNGA Res 51/210 (17 December 1996) UN Doc A/RES/51/210.
<http://www.un.org/documents/ga/res/51/a51r210.htm> (21. listopadu 2013)
Dokumenty soudů
Dokumenty Mezinárodního soudu:
Land, Island and Maritime Frontier Case (El Salvador/Honduras, Nicaragua intervening) (Application for
Intervention) [1990] ICJ Rep 92 <http://www.icj-
cij.org/docket/index.php?sum=390&code=sh&p1=3&p2=3&case=75&k=0e&p3=5> (13. července 2013).
Legal Consequences of the Construction of a Wall (Advisory Opinion) 2004 <http://www.icj-
cij.org/icjwww/idocket/imwp/imwpframe.htm> (13. července 2013).
Case Concerning the Vienna Convention on Consular Relations (Germany v USA) (Request for the Indication of
Provisional Measures: Order) General List No 104 [1999] ICJ 1.
Soudní usnesení jednotlivých zemí:
Справа за конституційним поданням Верховного Суду України щодо відповідності Конституції України
(конституційності) статей 103, 109, 131, 132, 135, 136, 137, підпункту 1 пункту 2 розділу XII «Прикінцеві
положення», абзацу четвертого пункту 3, абзацу четвертого пункту 5 розділу XIII «Перехідні положення»
Закону України «Про судоустрій і статус суддів», № 1-1/2013, КСУ 2013.
Zákony a jiné právní úkony etc.
Закон про виконавче провадження 1999 (Верховна Рада України). Офіційний вісник України, 19, 194.
Закон про виконавче провадження 1999 (Верховна Рада України). Офіційний сайт Верховної Ради України.
<http://zakon1.rada.gov.ua/laws/show/606-14> (21. listopadu 2013).
Цивільний кодекс 2003 (Верховна Рада України). Офіційний сайт Верховної Ради України.
<http://zakon2.rada.gov.ua/laws/show/435-15/page5> (21. listopadu 2013).
Розпорядження про схвалення Концепції сприяння органами виконавчої влади розвитку громадянського
суспільства 2007 (Кабінет Міністрів України). Офіційний вісник України, 89, 89.
Odkaz na článek zákoníku, zákona, Konstituce, atd.
Цивільний кодекс, ст. 56, гл. 6 (2003) (Верховна Рада України). Офіційний сайт Верховної Ради України. <
http://zakon2.rada.gov.ua/laws/show/435-15/page5> (21. listopadu 2013).

EVROPSKÝ ČASOPIS EKONOMIKY A MANAGEMENTU
114
Become a Contributor for the Journal
EUROPEAN JOURNAL OF ECONOMICS AND MANAGEMENT
The Journal is issued 6 times per year.
Articles for publication in the first issue of the journal are accepted until February, 1 and will be published
until February, 28.
Articles for publication in the second issue of the journal are accepted until April, 1 and will be published
until April, 30.
Articles for publication in the third issue of the journal are accepted until June, 1 and will be published
until June, 30.
Articles for publication in the fourth issue of the journal are accepted until August, 1 and will be published
until August, 31.
Articles for publication in the fifth issue of the journal are accepted until October, 1 and will be published
until October, 31.
Articles for publication in the sixth issue of the journal are accepted until December, 1 and will be published
until December, 31.
Requirements to manuscripts Page Limit is 10 – 30 pages.
The language of articles is Czech, Ukrainian, English, Polish, French and German.
For an article in any language, the following is required in English:
an abstract (700-900 characters), a title of the article and complete data
of an author – full first and last name, academic title,
academic degree, position, and place of employment.
Footnotes are allowed, no endnotes.
Bibliography after the article is optional.
Bibliography should be arranged in accordance with the agreements of the American Psychological Association
(APA).
Illustrations to articles (graphics and images) should be submitted in the TIFF or JPEG format (each image in a
separate file). While preparing illustrations authors should take into account that colour printing is not available in the
Journal.
The editorial board do not register and do not review for publication manuscripts that do not comply with the
aforementioned requirements.
Address for service:
E-mail: [email protected]
Web: http://eujem.cz
Mailing Address:
BEROSTAV DRUŽSTVO, Vlastislavova 562/15, 140 00, Praha 4 – Nusle
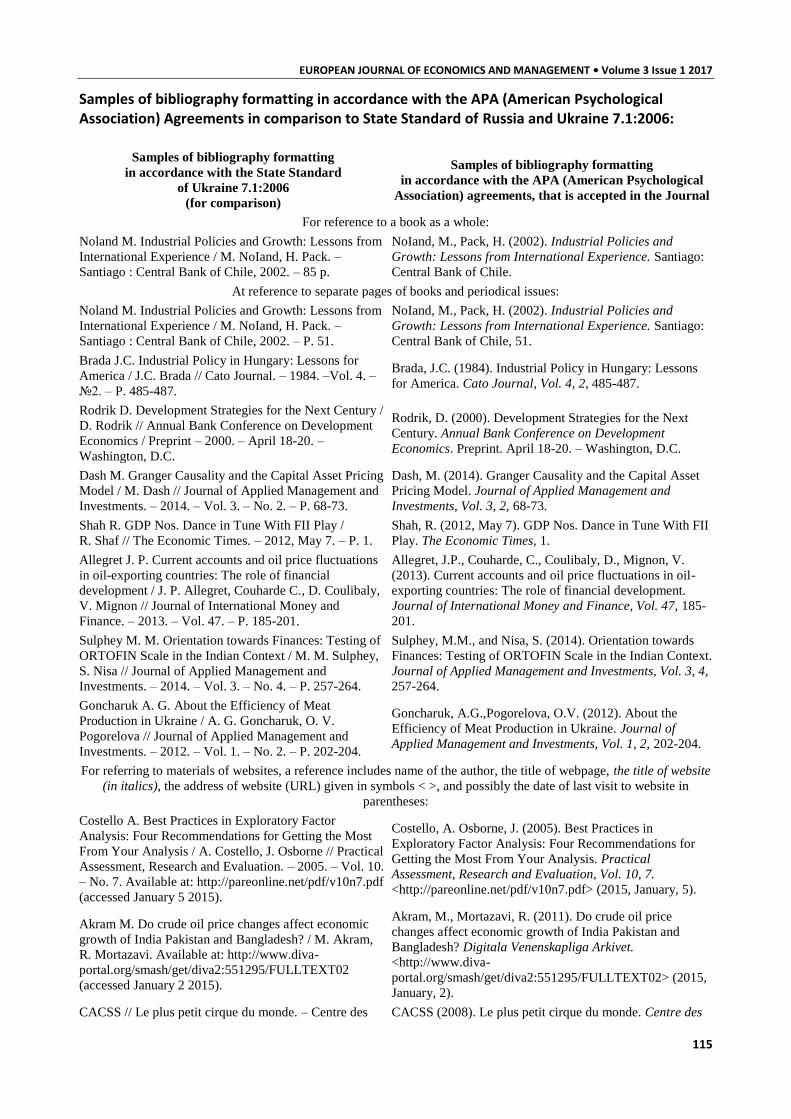
EUROPEAN JOURNAL OF ECONOMICS AND MANAGEMENT • Volume 3 Issue 1 2017
115
Samples of bibliography formatting in accordance with the APA (American Psychological Association) Agreements in comparison to State Standard of Russia and Ukraine 7.1:2006:
Samples of bibliography formatting
in accordance with the State Standard
of Ukraine 7.1:2006
(for comparison)
Samples of bibliography formatting
in accordance with the APA (American Psychological
Association) agreements, that is accepted in the Journal
For reference to a book as a whole:
Noland M. Industrial Policies and Growth: Lessons from
International Experience / M. NoIand, H. Pack. –
Santiago : Central Bank of Chile, 2002. – 85 p.
NoIand, M., Pack, H. (2002). Industrial Policies and
Growth: Lessons from International Experience. Santiago:
Central Bank of Chile.
At reference to separate pages of books and periodical issues:
Noland M. Industrial Policies and Growth: Lessons from
International Experience / M. NoIand, H. Pack. –
Santiago : Central Bank of Chile, 2002. – P. 51.
NoIand, M., Pack, H. (2002). Industrial Policies and
Growth: Lessons from International Experience. Santiago:
Central Bank of Chile, 51.
Brada J.C. Industrial Policy in Hungary: Lessons for
America / J.C. Brada // Cato Journal. – 1984. –Vol. 4. –
№2. – P. 485-487.
Brada, J.C. (1984). Industrial Policy in Hungary: Lessons
for America. Cato Journal, Vol. 4, 2, 485-487.
Rodrik D. Development Strategies for the Next Century /
D. Rodrik // Annual Bank Conference on Development
Economics / Preprint – 2000. – April 18-20. –
Washington, D.C.
Rodrik, D. (2000). Development Strategies for the Next
Century. Annual Bank Conference on Development
Economics. Preprint. April 18-20. – Washington, D.C.
Dash M. Granger Causality and the Capital Asset Pricing
Model / M. Dash // Journal of Applied Management and
Investments. – 2014. – Vol. 3. – No. 2. – P. 68-73.
Dash, M. (2014). Granger Causality and the Capital Asset
Pricing Model. Journal of Applied Management and
Investments, Vol. 3, 2, 68-73.
Shah R. GDP Nos. Dance in Tune With FII Play /
R. Shaf // The Economic Times. – 2012, May 7. – P. 1.
Shah, R. (2012, May 7). GDP Nos. Dance in Tune With FII
Play. The Economic Times, 1.
Allegret J. P. Current accounts and oil price fluctuations
in oil-exporting countries: The role of financial
development / J. P. Allegret, Couharde C., D. Coulibaly,
V. Mignon // Journal of International Money and
Finance. – 2013. – Vol. 47. – P. 185-201.
Allegret, J.P., Couharde, C., Coulibaly, D., Mignon, V.
(2013). Current accounts and oil price fluctuations in oil-
exporting countries: The role of financial development.
Journal of International Money and Finance, Vol. 47, 185-
201.
Sulphey M. M. Orientation towards Finances: Testing of
ORTOFIN Scale in the Indian Context / M. M. Sulphey,
S. Nisa // Journal of Applied Management and
Investments. – 2014. – Vol. 3. – No. 4. – P. 257-264.
Sulphey, M.M., and Nisa, S. (2014). Orientation towards
Finances: Testing of ORTOFIN Scale in the Indian Context.
Journal of Applied Management and Investments, Vol. 3, 4,
257-264.
Goncharuk A. G. About the Efficiency of Meat
Production in Ukraine / A. G. Goncharuk, O. V.
Pogorelova // Journal of Applied Management and
Investments. – 2012. – Vol. 1. – No. 2. – P. 202-204.
Goncharuk, A.G.,Pogorelova, O.V. (2012). About the
Efficiency of Meat Production in Ukraine. Journal of
Applied Management and Investments, Vol. 1, 2, 202-204.
For referring to materials of websites, a reference includes name of the author, the title of webpage, the title of website
(in italics), the address of website (URL) given in symbols < >, and possibly the date of last visit to website in
parentheses:
Costello A. Best Practices in Exploratory Factor
Analysis: Four Recommendations for Getting the Most
From Your Analysis / A. Costello, J. Osborne // Practical
Assessment, Research and Evaluation. – 2005. – Vol. 10.
– No. 7. Available at: http://pareonline.net/pdf/v10n7.pdf
(accessed January 5 2015).
Costello, A. Osborne, J. (2005). Best Practices in
Exploratory Factor Analysis: Four Recommendations for
Getting the Most From Your Analysis. Practical
Assessment, Research and Evaluation, Vol. 10, 7.
<http://pareonline.net/pdf/v10n7.pdf> (2015, January, 5).
Akram M. Do crude oil price changes affect economic
growth of India Pakistan and Bangladesh? / M. Akram,
R. Mortazavi. Available at: http://www.diva-
portal.org/smash/get/diva2:551295/FULLTEXT02
(accessed January 2 2015).
Akram, M., Mortazavi, R. (2011). Do crude oil price
changes affect economic growth of India Pakistan and
Bangladesh? Digitala Venenskapliga Arkivet.
<http://www.diva-
portal.org/smash/get/diva2:551295/FULLTEXT02> (2015,
January, 2).
CACSS // Le plus petit cirque du monde. – Centre des CACSS (2008). Le plus petit cirque du monde. Centre des

EVROPSKÝ ČASOPIS EKONOMIKY A MANAGEMENTU
116
Arts du Cirque Sud-de-Seine, 2008. Available at:
http://www.lepluspetitcirquedumonde.fr/articles/categori
e/num/48/ (accessed July 1 2012)
Arts du Cirque Sud-de-Seine.
<http://www.lepluspetitcirquedumonde.fr/articles/categorie/
num/48/> (2012, July, 1).
References to legislative acts and legal documents:
Treaties International Covenant on Civil and Political Rights (adopted 16 December 1966, entered into force 23 March 1976)
999 UNTS 171 (ICCPR). <https://treaties.un.org/doc/Publication/UNTS/Volume%20999/volume-999-I-14668-
English.pdf> (2013, November 21),
Международный пакт о гражданских и политических правах (принят 16 декабря 1966 года, вступил в силу 23
марта 1976 года) 999 Сборник договоров ООН (МПГПП).
<http://www.un.org/ru/documents/decl_conv/conventions/pactpol.shtml> (2013, 21)
For reference to an article in a Convention: International Covenant on Civil and Political Rights (adopted 16 December 1966, entered into force 23 March 1976)
999 UNTS 171 (ICCPR) art 2. <https://treaties.un.org/doc/Publication/UNTS/Volume%20999/volume-999-I-14668-
English.pdf> (2013, ноябрь, 21)
Резолюція 2061 (ухвалена 25 липня 2012 року) РБ ООН. <http://zakon4.rada.gov.ua/laws/show/995_k87> (2013,
ноябрь, 21)
Bilateral Treaties: Угода між Кабінетом Міністрів України та Урядом Російської Федерації про співробітництво в галузі
авіаційного пошуку і рятування (Угоду затверджено Постановою КМ № 1094 від 28.11.2012) (прийнята 28
листопада 2012 року, набрала чинності для України 18 лютого 2013 року). Офіційний вісник України, 29, 130.
Agreement Concerning the Sojourn of Refugees within the Meaning of the Convention Relating to the Status of
Refugees (Geneva Convention of 28 July 1951 and Protocol Relating to the Status of Refugees of 31 January 1967)
(France – Austria) (adopted 21 October 1974, entered into force 24 July 1975) 985 UNTS 303.
ILO Recommendations: МОТ Рекомендация № 195 (О развитии людских ресурсов: образование, подготовка кадров и непрерывное
обучение) (92 сессия Генеральной конференции МОТ, 17 июня 2004 года). Офіційний сайт Верховної Ради
України. <http://zakon4.rada.gov.ua/laws/show/993_532> (2013, ноябрь, 21).
UN Documents
Декларация о предоставлении независимости колониальным странам и народам, ГА ООН Резолюция 1514
(XV) (14 декабря 1960 года)
UNGA Res 51/210 (17 December 1996) UN Doc A/RES/51/210.
<http://www.un.org/documents/ga/res/51/a51r210.htm> (2013, ноябрь, 21)
Laws and so forth Закон про виконавче провадження 1999 (Верховна Рада України). Офіційний вісник України, 19, 194.
Закон про виконавче провадження 1999 (Верховна Рада України). Офіційний сайт Верховної Ради України.
<http://zakon1.rada.gov.ua/laws/show/606-14> (2013, ноябрь, 21).
Цивільний кодекс 2003 (Верховна Рада України). Офіційний сайт Верховної Ради України.
<http://zakon2.rada.gov.ua/laws/show/435-15/page5> (2013, ноябрь, 21).
Розпорядження про схвалення Концепції сприяння органами виконавчої влади розвитку громадянського
суспільства 2007 (Кабінет Міністрів України). Офіційний вісник України, 89, 89.
Reference to an article in a Code, Law, Constitution, etc.: Цивільний кодекс, ст. 56, гл. 6 (2003) (Верховна Рада України). Офіційний сайт Верховної Ради України.
<http://zakon2.rada.gov.ua/laws/show/435-15/page5> (2013, ноябрь, 21)