evolving fuzzy detectives: an investigation into the evolution of
TRANSCRIPT
Evolving Fuzzy Detectives:
An Investigation into the Evolution of Fuzzy Rules
Peter J. Bentley
Department of Computer Science, University College London,Gower Street, London WC1E 6BT, [email protected]
Abstract: This paper explores the use of genetic programming to evolve fuzzy rules for thepurpose of fraud detection. The fuzzy rule evolver designed during this research is described indetail. Four key system evaluation criteria are identified: intelligibility, speed, handling noisy data,and accuracy. Three sets of experiments are then performed in order to assess the performance ofdifferent components of the system, in terms of these criteria. The paper concludes: 1. that manyfactors affect accuracy of classification, 2. intelligibility and processing speed mainly seem to beaffected by the fuzzy membership functions and 3. noise can cause loss of accuracy proportionateto the square of noise.
1 Introduction
It is easy to spot a thief if he wears a black mask and carries a bag over his shoulder withthe word ‘swag’ written boldly across it. Most crimes are perhaps not as obvious as thisamusing movie cliché, but there will be, more often than not, physical evidence leftbehind which will incriminate the wrongdoer. However, there is a type of crime farsubtler in its implementation. This clandestine activity relies upon deception,concealment and mendacity. It is known as fraud, and it impacts on every aspect of ourfinancial world - from insurance to social security benefits to pensions. Its exposurerequires a different type of detection. There are no fingerprints left to be found byforensics - but in the computer databases there are other types of fingerprints storedunknowingly by the fraudsters. These fingerprints are small patterns of data, hiddenamongst vast archives of information.
Until recently, often the only way to identify such fraud was for experts to studyeach data item and mentally apply a set of learned rules. For example, if the homeinsurance claim is for a large amount and if there have been many such claims from thataddress in a short space of time, then perhaps the claim is fraudulent. Identifying such‘fingerprints’ in data is a laborious and slow task, and is dependent on the fingerprint

characterising a true fraudulent activity. However, with the advent of data mining andmachine learning techniques, such detection can now be performed by computer.
This paper explores the use of evolutionary computation and fuzzy logic incombination to perform machine learning or pattern classification, with an emphasis onthe capabilities required for the detection of fraud. The next section briefly describes thebackground to this area. Section 3 gives details of the fuzzy rule evolver and its differentcomponents. Section 4 outlines the evaluation requirements identified after consultationwith our collaborating company. The fifth section describes and analyses three sets ofexperiments that were performed on the system and section 6 concludes.
2 Background
Machine Learning, pattern classification and data mining are huge fields in ComputerScience, with countless different techniques in use or under investigation. This paperconcentrates on a single approach: the use of fuzzy logic with genetic programming toclassify data.
Fuzzy sets were introduced by Lofti Zadeh in 1965 [15]. Designed to allow therepresentation of ‘vagueness’ and uncertainty that conventional set theory disallowed, thesets and their manipulation by logical operators led to the development of the field knownas Fuzzy Logic [3]. Despite the name, fuzzy techniques are actually capable of greaterprecision compared to classical approaches [6]. Fuzzy controllers have been used withconsiderable success: examples include controllers for elevators, subway trains, and evenfuzzy autofocus systems for cameras [11].
Another appeal of fuzzy logic is its intelligibility. Fuzzy rules use linguisticidentifiers such as ‘high’, ‘short’ and ‘inexpensive’. Because all humans tend to think insuch vague terms, the specification and understandability of such rules becomes simple,even to someone unaware of the mechanisms behind this technique [6]. The combinationof representation of uncertainty, precision, and intelligibility has motivated the use offuzzy logic in pattern classification [3], and indeed, forms the motivation for its use inthis research.
Fuzzy logic can be combined or hybridized with many other techniques,including evolutionary algorithms. Some have developed fuzzy-evolutionary systems[12] where fuzzy logic is used to tune parameters of an evolutionary algorithm. Othersuse evolutionary-fuzzy approaches, where evolution is employed to generate or affectfuzzy rules [9,10]. This paper describes the latter approach, and makes use of GeneticProgramming (GP).
John Koza developed GP for the purposes of automatic programming [7](making computers program themselves). GP differs from other EAs in three mainrespects: solutions are represented by tree-structures, crossover normally generatesoffspring by concatenating random subtrees from the parents, and solutions are evaluatedby executing them and assessing their function.
Like all evolutionary algorithms (EAs), GP maintains populations of solutions.These are evaluated, the best are selected and ‘offspring’ that inherit features from their‘parents’ are created using crossover and mutation operators. The new solutions are then
evaluated, the best are selected, and so on, until a good solution has evolved, or a specificnumber of generations have passed.
EAs are often used for pattern classification problems [8], but although theaccuracy can be impressive, it is often difficult to understand the evolved method ofclassification. By evolving fuzzy rules it is possible to get the best of both worlds -accurate and intelligible classification [9].
3 The Fuzzy Rule Evolver
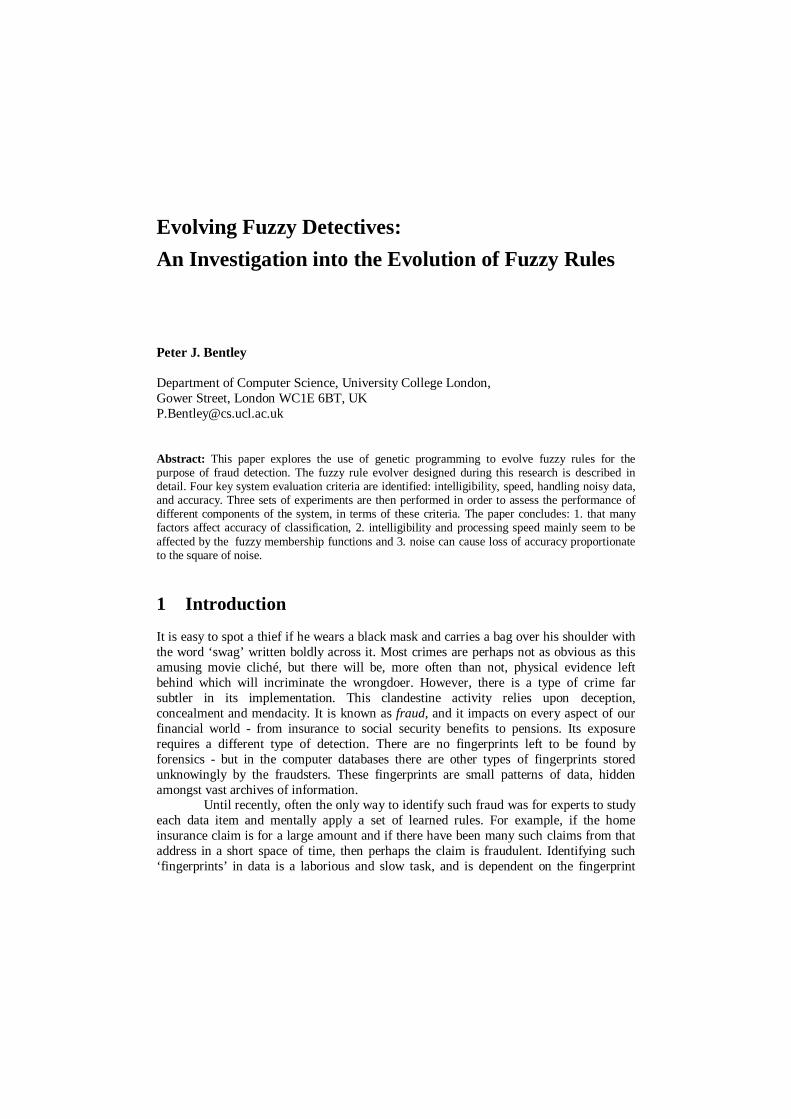
The system developed during this research comprises two main elements: a GeneticProgramming (GP) search algorithm and a fuzzy expert system. Figure 1 provides anoverview of the system.
Data is provided to the system in the form of two comma-separated-variable(CSV) files: training data and test data. In each file the first row contains the labels foreach column (e.g. “Length, Width, Height, Cost”). These labels are used by the system inthe rules that it evolves. The next Sn rows (or data items) are known to be of the‘suspicious’ class, the remaining data comprises one or more other classes. There may beup to 256 values in each data item, as long as the training and test data sets are consistent(normally training and test data files are constructed by splitting a single data file intotwo). The system assumes that the data is numerical and that there are no missing values(a data pre-processing program has been developed to assign numbers for alphanumericentries and to fill missing values with random values). All training takes place on thetraining data set; testing of evolved rules takes place on both training and test data sets.
GP system
Data
NOT (IS_LOW Fred OR NOTIS_HIGH Harry)
NOT (IS_LOW Susan)
(IS_MEDIUM Fred OR NOTIS_HIGH Harry)
Random ruleinitialisation
Evolved rules
Modalinformation
Membershipfunctions
Fuzzifier
1D clusterer
genotypes(coded rules)
phenotypes(rules)
fitness functionsselection,
reproduction
Fuzzy system
Rule Parser
Fuzzified Data
Figure 1 Block diagram of the Evolutionary-fuzzy system.
3.1 Clustering
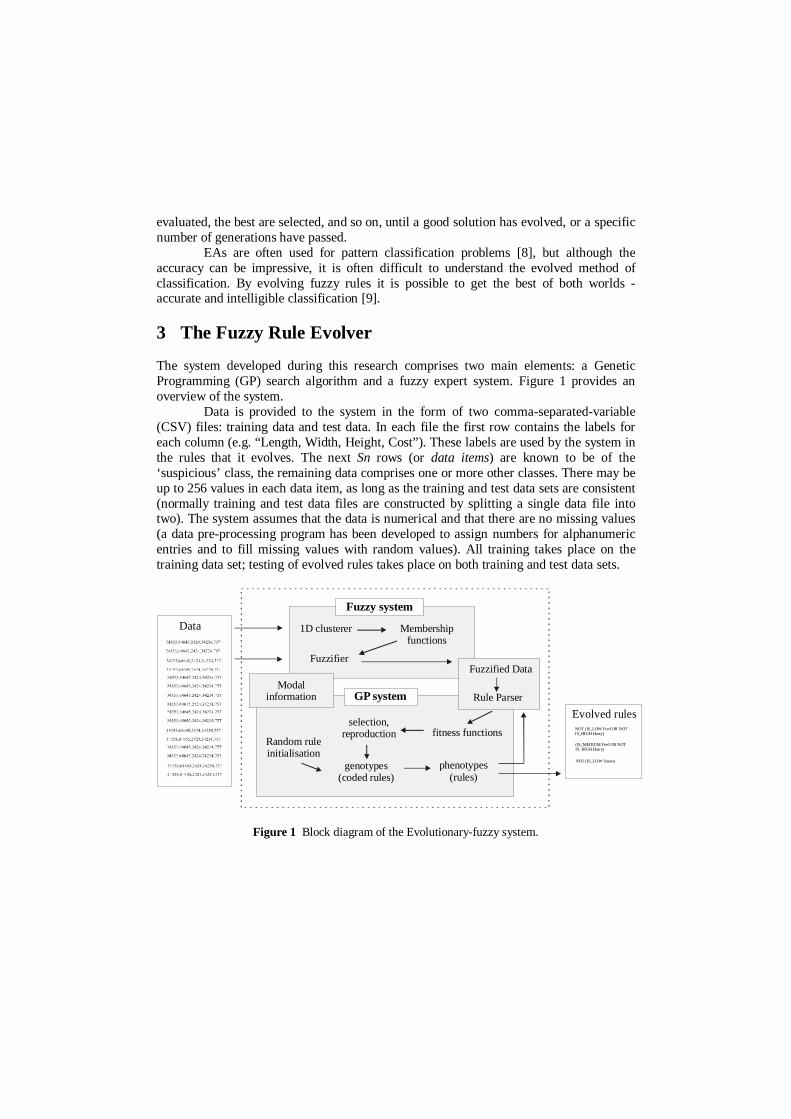
When started, the system first clusters each column of the training data into three groupsusing a one-dimensional clustering algorithm. A number of clusterers are implemented inthe system, including C-Link, S-Link, K-means [5] and a simple numerical method (inwhich the data is sorted, then simply divided into three groups with the same number ofitems in each group). This paper investigates the last two of these methods in the system.Once selected by the user, the same clusterer is used for all learning and testing of thedata.
Data
cluster
A AA
LOW: 34..34 MED: 35..36 HIGH: 38..39
B BB
LOW: 3..3 MED: 5..5 HIGH: 8..9
CC C
LOW: 63..64 MED: 84..85 HIGH: 94..96
Figure 2: Data is clustered column by column to find the fuzzy membership function ranges.
After every column of the data has been successfully clustered into three, theminimum and maximum values in each cluster are found, see fig. 2. These values arethen used to define the domains of the membership functions of the fuzzy expert system.
3.2 Fuzzy Membership Functions
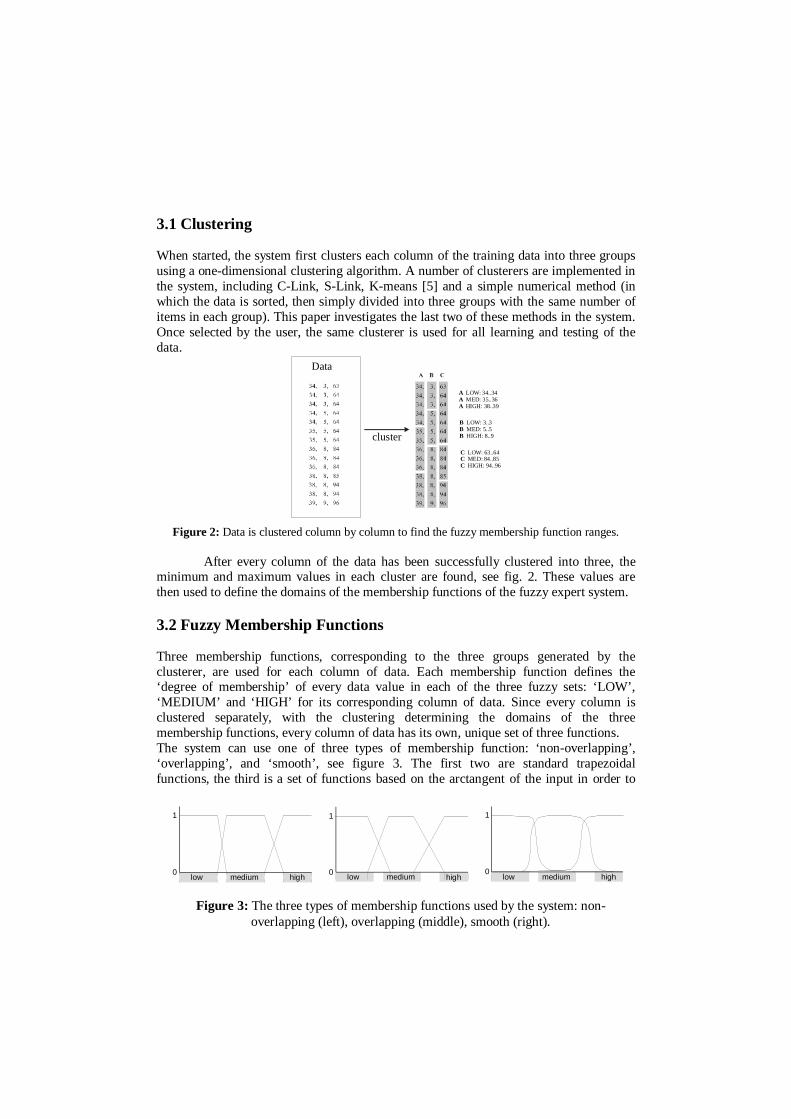
Three membership functions, corresponding to the three groups generated by theclusterer, are used for each column of data. Each membership function defines the‘degree of membership’ of every data value in each of the three fuzzy sets: ‘LOW’,‘MEDIUM’ and ‘HIGH’ for its corresponding column of data. Since every column isclustered separately, with the clustering determining the domains of the threemembership functions, every column of data has its own, unique set of three functions.The system can use one of three types of membership function: ‘non-overlapping’,‘overlapping’, and ‘smooth’, see figure 3. The first two are standard trapezoidalfunctions, the third is a set of functions based on the arctangent of the input in order to
low0
1
medium high0
1
low medium high0
1
low medium high
Figure 3: The three types of membership functions used by the system: non-overlapping (left), overlapping (middle), smooth (right).
provide a smoother, more gradual set of ‘degree of memberships’.Each type of membership function uses the results from the clusterer in a
different way to determine the domains of the functions. The ‘non-overlapping’ functionsgive a membership of 1.0 for the fuzzy set corresponding to the cluster that the value fallsin, and 0.0 for all other fuzzy sets. For example, a value that falls in the lowest clusterwould be fuzzified into (1.0, 0.0, 0.0) for the low, medium and high fuzzy sets,respectively. Since, for this application, it is normal for all values to fall within one of thethree clusters, it is extremely rare for values to be between two clusters. Hence, the ‘non-overlapping’ functions almost never allow a value to be a member of more than onefuzzy set at a time (i.e. the fuzzy sets are, to all intents and purposes, non-overlapping). Incontrast, the ‘overlapping’ functions place the ‘knees’ and ‘feet’ of each function at threequarters of the values provided by the clusterer, see figure 3 (middle). This has the effectof ensuring that the three fuzzy sets overlap - a value towards the outer extent of the lowfuzzy set might thus be fuzzified into (0.8, 0.2, 0.0) for low, medium and high fuzzy setsrespectively. Finally, the ‘smooth’ functions increase the level of overlap still further. Forexample, a value in the centre of the low fuzzy set might be fuzzified into (0.98 0.02,0.0), while a value towards the outer extent of the low fuzzy set might be fuzzified as(0.96, 0.4, 0.0).
Whichever set of membership functions are selected, they are then shapedaccording to the clusterer and used to fuzzify all input values, resulting in a new databaseof fuzzy values. The GP engine is then seeded with random genotypes (coded rules) andevolution is initiated.
3.3 Evolving Rules
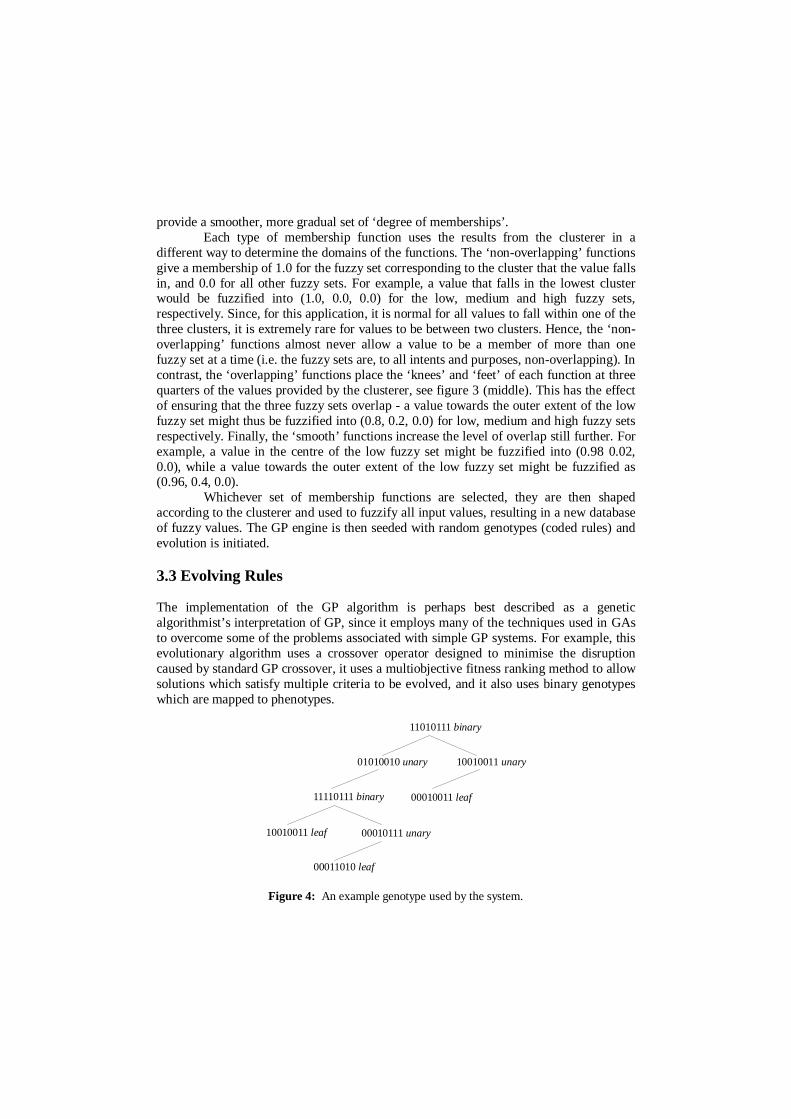
The implementation of the GP algorithm is perhaps best described as a geneticalgorithmist’s interpretation of GP, since it employs many of the techniques used in GAsto overcome some of the problems associated with simple GP systems. For example, thisevolutionary algorithm uses a crossover operator designed to minimise the disruptioncaused by standard GP crossover, it uses a multiobjective fitness ranking method to allowsolutions which satisfy multiple criteria to be evolved, and it also uses binary genotypeswhich are mapped to phenotypes.
11010111 binary
10010011 unary01010010 unary
11110111 binary
10010011 leaf 00010111 unary
00010011 leaf
00011010 leaf
Figure 4: An example genotype used by the system.

Genotypes and PhenotypesGenotypes consist of variable sized trees, where each node consists of a binary numberand a flag defining whether the node is binary, unary or a leaf, see figure 4. At the start ofevolution, random genotypes are created (usually containing no more than 3 binary and 4unary nodes). Genotypes are mapped onto phenotypes to obtain fuzzy rules, e.g. thegenotype shown in fig. 4 maps onto the phenotype:�������������� ����������� ��������������� ����
Currently the system uses two binary functions: ‘OR’ and ‘AND’, four unaryfunctions: ‘NOT’, ‘IS_LOW’, ‘IS_MEDIUM’, ‘IS_HIGH’, and up to 256 leaves (columnlabels such as “Length”, “Width”, “Height”, “Cost”). Depending on the type of eachnode, the corresponding binary value is mapped to one of these identifiers and added tothe phenotype.
Rule EvaluationEvery evolved phenotype (or fuzzy rule) is evaluated by using the fuzzy expert system toapply it to the fuzzified training data, resulting in a defuzzified score between 0 and 1 forevery fuzzified data item. (Section 3.4 describes this in full.) This list of scores is thenassessed by four fitness functions which provide separate fitness values for thephenotype, designed to:
i. minimise the number of misclassified items (where a misclassified item is a‘normal’ data item with a score > 0.5).
ii. maximise the difference between the average scores for correctly classified‘suspicious’ items and the average scores for ‘normal’ items (where a correctlyclassified suspicious item is a data item in the first Sn of the training set with score> 0.5).
iii. maximise the sum of scores for ‘suspicious’ data items. iv. penalise the length of any rules that contain more than four identifiers (binary,
unary, or leaf nodes).
The first function ensures as few misclassifications as possible. The second forcesevolution to distinguish between ‘suspicious’ and ‘normal’ classes of data, while the thirddemands that ‘suspicious’ items are given higher scores than ‘normal’ ones. The finalfunction ensures that all evolved rules are short - serving the dual purpose of preventingbloat and increasing the readability of the final output.
Rule GenerationUsing these four fitness values for each rule, the GP system then employs the SWGRmultiobjective optimisation ranking method [2] to determine how many offspring eachpair of rules should have. (Fitnesses are scaled using the effective ranges of eachfunction, multiplied by importance values and aggregated. Rules with higher overallfitnesses are given higher ranking values, and hence have an increased probability ofproducing offspring.) Child rules are generated using one of two forms of crossover. Thefirst type of crossover emulates the single-point crossover of genetic algorithms byfinding two random points in the parent genotypes that resemble each other, and splicingthe genotypes at that point. By ensuring that the same type of nodes, in approximately the
same places, are crossed over, and that the binary numbers within the nodes are alsocrossed, an effective exploration of the search space is provided without excessivedisruption [1]. The second type of crossover generates child rules by combining twoparent rules together using a binary operator (an ‘AND’ or ‘OR’). This more unusualmethod of generating offspring (applied approximately one time out of every ten insteadof the other crossover operator) permits two parents that detect different types of‘suspicious’ data to be combined into a single, fitter individual. Mutation is alsooccasionally applied, to modify randomly the binary numbers in each node by a singlebit.
The GP system employs population overlapping, where the worst Pn% of thepopulation are replaced by the new offspring generated from the best Pm%. Typicallyvalues of Pn = 80 and Pm = 40 seem to provide good results. The population size wasnormally 100 individuals.
Modal EvolutionEach evolutionary run of the GP system (usually only 15 generations) results in a short,readable rule which detects some, but not all, of the ‘suspicious’ data items in the trainingdata set. Such a rule can be considered to define one mode of a multimodal problem. Allitems that are correctly classified by this rule (recorded in the modal database, see figure1) are removed and the system automatically restarts, evolving a new rule to classify theremaining items. This process of modal evolution continues until every ‘suspicious’ dataitem has been described by a rule. However, any rules that misclassify more items thanthey correctly classify are removed from the final rule set by the system.
3.4 Assessment of Final Rule Set
Once modal evolution has finished generating a rule set, the complete set of rules (joinedinto one by disjunction, i.e., ‘OR’ed together) is automatically applied to the training dataand test data, in turn. Information about the system settings, number of claims correctlyand incorrectly classified for each data set, total processing time in seconds, and the ruleset are stored to disk.
3.5 Applying Rules to Fuzzy Data
The path of evolution through the multimodal and multicriteria search space is guided byfitness functions. These functions use the results obtained by the Rule Parser - a fuzzyexpert system that takes one or more rules and interprets their meaning when they areapplied to each of the previously fuzzified data items in turn.This system is capable of two different types of fuzzy logic rule interpretation: traditionalfuzzy logic, and membership-preserving fuzzy logic, an approach designed during thisresearch. Depending on which method of interpretation has been selected by the user, themeaning of the operators within rules and the method of defuzzification is different.

Traditional Fuzzy Logic Rule ParserTraditional fuzzy logic involves finding ‘degrees of membership’ in the fuzzy sets foreach value in the current data item, then using operators to select which membershipvalue should be selected and used in combination. So, given a data item comprising twofuzzified values:A(0.0, 0.2, 0.8)B(0.1, 0.9, 0.0)and a fuzzy rule:(IS_LOW A AND IS_MEDIUM B)the traditional fuzzy rule parser takes the degree of membership of A for fuzzy set LOWand the degree of membership of B for the fuzzy set MEDIUM, and calculates which ofthe two is smaller. So in this case, the result of applying the rule is 0.0. Table 1 describesthe behaviour and syntax of each of the fuzzy operators.
Table 1: Traditional fuzzy operators.
Operator ResultIS_LOW <a, b, c> AIS_MEDIUM <a, b, c> BIS_HIGH <a, b, c> CNOT a 1-a(a AND b) min(a,b)(a OR b) max(a,b)
This fuzzy grammar imposes certain constraints upon allowable solutions. Forexample, the argument to ‘IS_LOW’, ‘IS_MEDIUM’ or ‘IS_HIGH’ must always consistof a fuzzy vector: <Lowmembership, Mediummembership, Highmembership>. The arguments to‘AND’, ‘OR’ and ‘NOT’ functions must always be single-valued results obtained fromthe application of one or more of the functions.
As is clear from the example phenotype given in section 3.3.1, evolved rules donot always satisfy the constraints imposed by fuzzy grammars. However, rather thanimpose these damaging constraints on evolution, such grammatically incorrect rules arecorrected by the rule parser. (Work performed during this research showed that usingmapping to satisfy constraints in a GP system is one of the more effective approaches[14].)
Table 2: Mapping performed by the Rule Parser.
Operator Result<a, b, c> IS_HIGH <a, b, c>IS_LOW a aIS_MEDIUM a aIS_HIGH a A

Functions requiring a fuzzy vector, but receiving a single value do nothing.Functions requiring a single value, but receiving a fuzzy vector, apply ‘IS_HIGH’ bydefault in order to generate the single value. Table 2 describes this behaviour in full.Consequently, when interpreted by the fuzzy rule parser, the rule in section 3.3.1 equatesto:���������� ����������� ��������������� ����
Defuzzification of the final output value is unnecessary (although it is possibleto impose a scaling, or non-linear function to transform the output in some way). It wasdecided simply to use a one-to-one function for defuzzification (i.e., return the output ofthe fuzzy rule as the defuzzified value).
Membership-Preserving Fuzzy Logic Rule ParserThe alternative behaviour of the rule parser preserves the three membership values withindata items, even after the application of operators such as ‘IS_LOW’. This is done in anattempt to permit rules to use all the information found by the clusterer, and thushopefully to reduce the number of rules needed to classify data. In addition, the operatorsare designed to be more conducive to evolution by allowing multiple operators to havecombined effects without constraints on syntax. For example:IS_HIGH IS_HIGH vis now equivalent toIS_VERY_HIGH v
It should be noted, however, that the English descriptors for these operators doesnot always fully encompass their behaviour in a rule. Table 3 shows the new behavioursof the operators.
Table 3: Membership-preserving fuzzy operators.
Operator Result<a, b, c> <a, b, c>IS_LOW <a, b, c> Conc. <c, b, a>IS_MEDIUM <a, b, c> Conc. <0, max(a,c), b>IS_HIGH <a, b, c> Conc. <a, b, c>NOT <a, b, c> <c, b, a>(<a, b, c> AND <d, e, f>) min(<a, b, c>,<d, e, f>)(<a, b, c> OR <d, e, f>) max(<a, b, c>,<d, e, f>)
Where Conc. concentrates the vector (making thelargest value larger and the other two values smaller).
Because this novel approach preserves all three membership values during theapplication of all operators (although the values may be intensified or reduced), the finalresult is also a vector comprising three values. To obtain a single, defuzzified value, threedefuzzification functions are applied, using the vector to define three trapezoidal shapes,see figure 5. The shapes are then ‘piled up on top of each other’ and the centre of masscalculated (using overlapping shapes results in a loss of information). A centre of massfalling in the centre results in an output of 0.5, falling to the right gives a score between
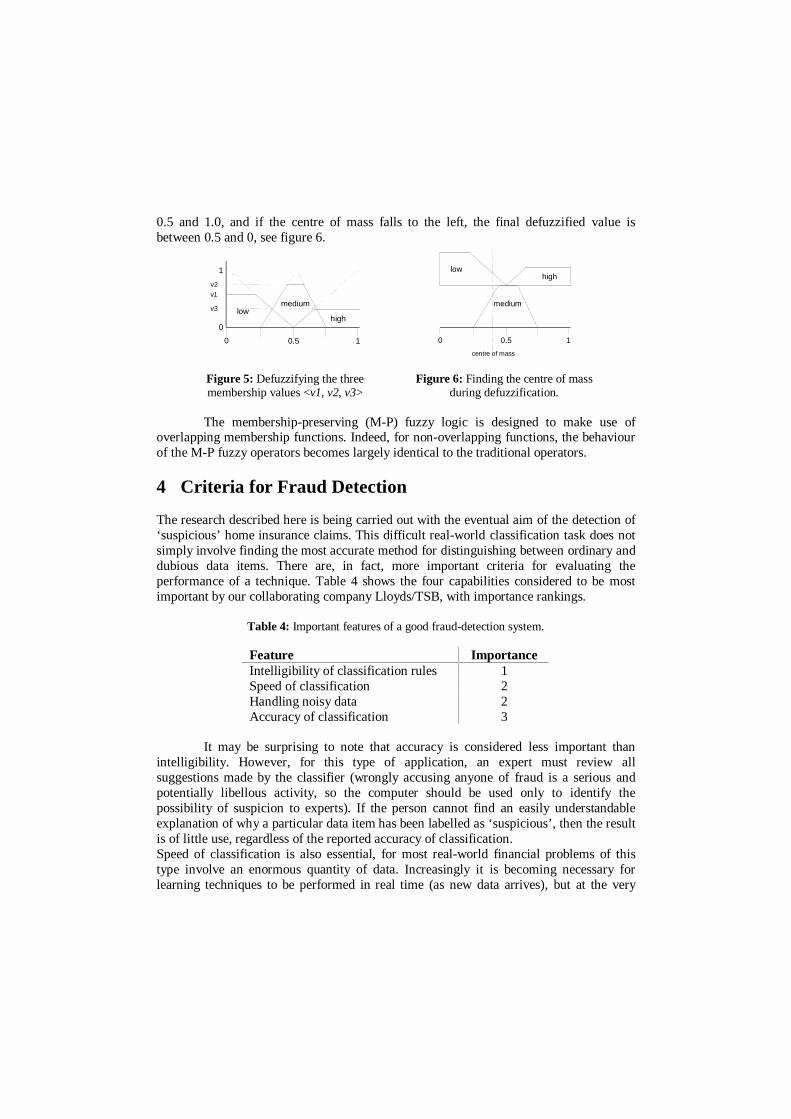
0.5 and 1.0, and if the centre of mass falls to the left, the final defuzzified value isbetween 0.5 and 0, see figure 6.
0
v3
v1
v2
1
low
0.5 10
medium
high
low
0.5 10
medium
centre of mass
high
Figure 5: Defuzzifying the threemembership values <v1, v2, v3>
Figure 6: Finding the centre of massduring defuzzification.
The membership-preserving (M-P) fuzzy logic is designed to make use ofoverlapping membership functions. Indeed, for non-overlapping functions, the behaviourof the M-P fuzzy operators becomes largely identical to the traditional operators.
4 Criteria for Fraud Detection
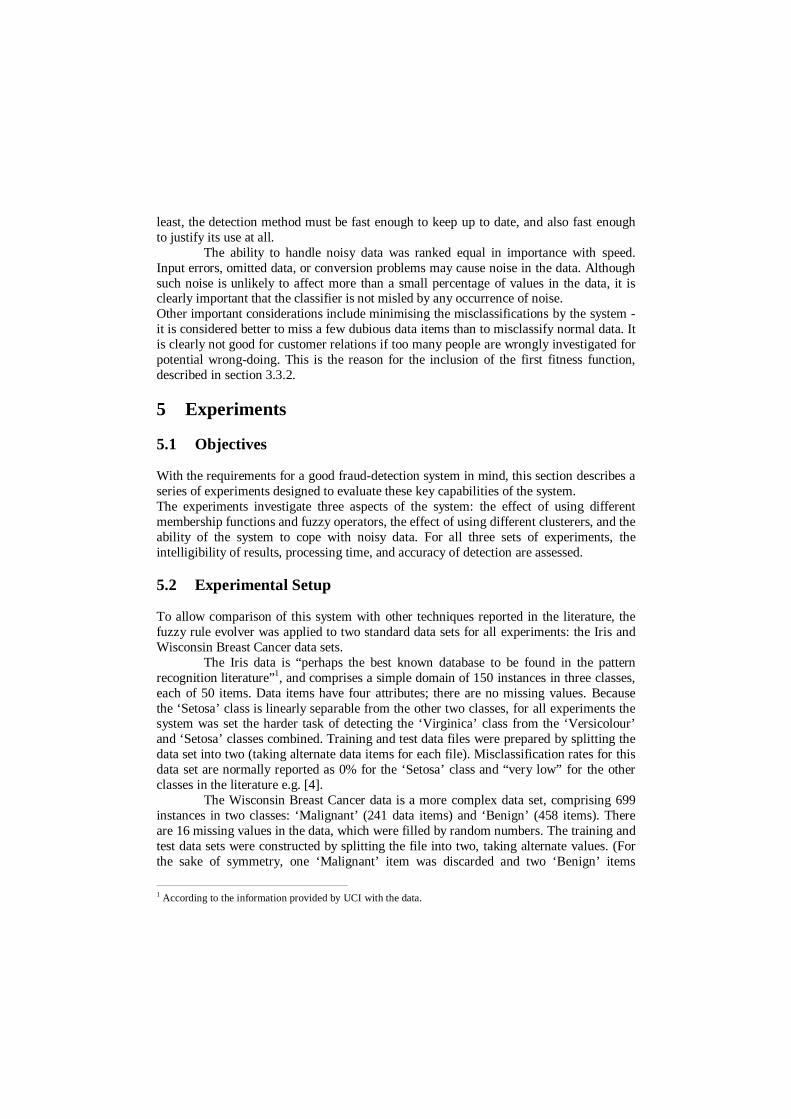
The research described here is being carried out with the eventual aim of the detection of‘suspicious’ home insurance claims. This difficult real-world classification task does notsimply involve finding the most accurate method for distinguishing between ordinary anddubious data items. There are, in fact, more important criteria for evaluating theperformance of a technique. Table 4 shows the four capabilities considered to be mostimportant by our collaborating company Lloyds/TSB, with importance rankings.
Table 4: Important features of a good fraud-detection system.
Feature ImportanceIntelligibility of classification rules 1Speed of classification 2Handling noisy data 2Accuracy of classification 3
It may be surprising to note that accuracy is considered less important thanintelligibility. However, for this type of application, an expert must review allsuggestions made by the classifier (wrongly accusing anyone of fraud is a serious andpotentially libellous activity, so the computer should be used only to identify thepossibility of suspicion to experts). If the person cannot find an easily understandableexplanation of why a particular data item has been labelled as ‘suspicious’, then the resultis of little use, regardless of the reported accuracy of classification.Speed of classification is also essential, for most real-world financial problems of thistype involve an enormous quantity of data. Increasingly it is becoming necessary forlearning techniques to be performed in real time (as new data arrives), but at the very
least, the detection method must be fast enough to keep up to date, and also fast enoughto justify its use at all.
The ability to handle noisy data was ranked equal in importance with speed.Input errors, omitted data, or conversion problems may cause noise in the data. Althoughsuch noise is unlikely to affect more than a small percentage of values in the data, it isclearly important that the classifier is not misled by any occurrence of noise.Other important considerations include minimising the misclassifications by the system -it is considered better to miss a few dubious data items than to misclassify normal data. Itis clearly not good for customer relations if too many people are wrongly investigated forpotential wrong-doing. This is the reason for the inclusion of the first fitness function,described in section 3.3.2.
5 Experiments
5.1 Objectives
With the requirements for a good fraud-detection system in mind, this section describes aseries of experiments designed to evaluate these key capabilities of the system.The experiments investigate three aspects of the system: the effect of using differentmembership functions and fuzzy operators, the effect of using different clusterers, and theability of the system to cope with noisy data. For all three sets of experiments, theintelligibility of results, processing time, and accuracy of detection are assessed.
5.2 Experimental Setup
To allow comparison of this system with other techniques reported in the literature, thefuzzy rule evolver was applied to two standard data sets for all experiments: the Iris andWisconsin Breast Cancer data sets.
The Iris data is “perhaps the best known database to be found in the patternrecognition literature”1, and comprises a simple domain of 150 instances in three classes,each of 50 items. Data items have four attributes; there are no missing values. Becausethe ‘Setosa’ class is linearly separable from the other two classes, for all experiments thesystem was set the harder task of detecting the ‘Virginica’ class from the ‘Versicolour’and ‘Setosa’ classes combined. Training and test data files were prepared by splitting thedata set into two (taking alternate data items for each file). Misclassification rates for thisdata set are normally reported as 0% for the ‘Setosa’ class and “very low” for the otherclasses in the literature e.g. [4].
The Wisconsin Breast Cancer data is a more complex data set, comprising 699instances in two classes: ‘Malignant’ (241 data items) and ‘Benign’ (458 items). Thereare 16 missing values in the data, which were filled by random numbers. The training andtest data sets were constructed by splitting the file into two, taking alternate values. (Forthe sake of symmetry, one ‘Malignant’ item was discarded and two ‘Benign’ items
1 According to the information provided by UCI with the data.

duplicated, resulting in two sets of 350 data items, each with 120 ‘Malignant’.) Resultsreported in the literature include accuracies of 93.5%, 95.9% [13], and 92.2% [16].
50 trials were run for each experiment, with the average and best accuraciesreported here. Percentage accuracy of detection was found by calculating:
TotalItems
editemsUnclassifiiedItemsMisclassif )(100100
+−
Intelligibility was measured in terms of the average number of rules evolved -the fewer the rules, the more intelligible the result. Average processing speed wasmeasured in seconds (and includes the negligible time taken to apply the completed ruleset to both data sets).
The fitness functions reported in section 3.3.2 were used without change for allexperiments. Importance rankings [2] were set as 0.5, 2.0, 1.0 and 0.5 for fitnessfunctions one to four, respectively. Mutation of a single bit occurred with a probability of0.001 in each genotype. Population sizes of 100 were used, and each modal evolutionaryrun was for exactly 15 generations. The K-Means clusterer was used in the system(unless otherwise stated). Experiments were run on a PC with a 233Mhz AMD K6processor.
5.3 Experiment 1: Investigating the Effect of Membership Functions
The objective of the first set of experiments was to examine the effects of differentmembership functions (and different ways of using the information contained in themembership functions) on the ability of the system to detect data items with goodintelligibility, speed, and accuracy. Four different system set-ups were investigated:traditional fuzzy logic with non-overlapping and overlapping membership functions, andM-P fuzzy logic with overlapping and smooth membership functions. (Traditional fuzzylogic does not work well with the level of overlap provided by the smooth functions, andthe M-P fuzzy logic with non-overlapping functions behaves in the same way astraditional fuzzy logic, so these set-ups are not investigated here.) Table 5 shows theresults obtained from 50 runs of each system set-up for each data set.
As shown in Table 5, for both data sets the average accuracy appears to fall asthe level of overlap of membership functions is enlarged. However, there is clearly aquite dramatic increase in intelligibility (a reduced number of rules) as the overlapincreases. This is illustrated by two example solutions evolved by the system for theWisconsin Breast Cancer data set. Figure 7 shows a typical 12-rule set evolved whenusing traditional fuzzy logic and non-overlapping membership functions. Figure 8 showsa typical single rule evolved when using M-P fuzzy logic with smooth membershipfunctions. It should be apparent that the latter is substantially more intelligible than theformer. Not only that, but by reducing the number of rules, far more effective feature-selection takes place (i.e., instead of using all ten fields in the data, the single rule showsthat only two are required).
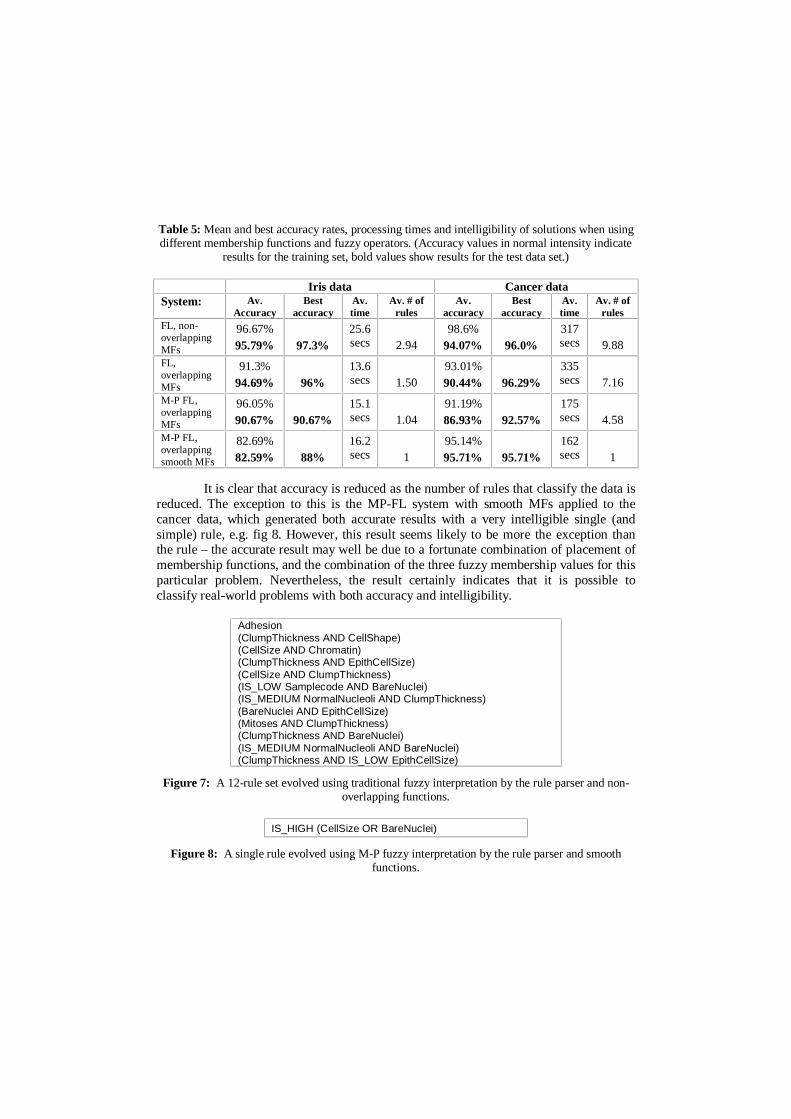
Table 5: Mean and best accuracy rates, processing times and intelligibility of solutions when usingdifferent membership functions and fuzzy operators. (Accuracy values in normal intensity indicate
results for the training set, bold values show results for the test data set.)
Iris data Cancer dataSystem: Av.
AccuracyBest
accuracyAv.time
Av. # ofrules
Av.accuracy
Bestaccuracy
Av.time
Av. # ofrules
FL, non-overlappingMFs
96.67%95.79% 97.3%
25.6secs 2.94
98.6%94.07% 96.0%
317secs 9.88
FL,overlappingMFs
91.3%94.69% 96%
13.6secs 1.50
93.01%90.44% 96.29%
335secs 7.16
M-P FL,overlappingMFs
96.05%90.67% 90.67%
15.1secs 1.04
91.19%86.93% 92.57%
175secs 4.58
M-P FL,overlappingsmooth MFs
82.69%82.59% 88%
16.2secs 1
95.14%95.71% 95.71%
162secs 1
It is clear that accuracy is reduced as the number of rules that classify the data isreduced. The exception to this is the MP-FL system with smooth MFs applied to thecancer data, which generated both accurate results with a very intelligible single (andsimple) rule, e.g. fig 8. However, this result seems likely to be more the exception thanthe rule – the accurate result may well be due to a fortunate combination of placement ofmembership functions, and the combination of the three fuzzy membership values for thisparticular problem. Nevertheless, the result certainly indicates that it is possible toclassify real-world problems with both accuracy and intelligibility.
Adhesion(ClumpThickness AND CellShape)(CellSize AND Chromatin)(ClumpThickness AND EpithCellSize)(CellSize AND ClumpThickness)(IS_LOW Samplecode AND BareNuclei)(IS_MEDIUM NormalNucleoli AND ClumpThickness)(BareNuclei AND EpithCellSize)(Mitoses AND ClumpThickness)(ClumpThickness AND BareNuclei)(IS_MEDIUM NormalNucleoli AND BareNuclei)(ClumpThickness AND IS_LOW EpithCellSize)
Figure 7: A 12-rule set evolved using traditional fuzzy interpretation by the rule parser and non-overlapping functions.
IS_HIGH (CellSize OR BareNuclei)
Figure 8: A single rule evolved using M-P fuzzy interpretation by the rule parser and smoothfunctions.

As Table 5 shows, processing times fell as the level of overlap of membershipfunctions was increased. This speedup is readily explainable: as the overlap of MFs wasincreased, the number of rules evolved by the system fell, and since each rule is the resultof one modal evolutionary run of 15 generations, system speed is proportionate to thenumber of rules evolved during classification. The longest learning time for the 7000-value Cancer set took around five and half minutes in these experiments. However, oncelearned, the time taken to apply the rules to the data is less than one second.
5.4 Experiment 2: Investigating the Effects of Clusterers
The objective of this second set of experiments was to determine the impact of usingdifferent clusterers in terms of the three performance measures of intelligibility, speedand accuracy. Two extremes of clusterer were employed: the basic method (described insection 3.1) and the substantially more advanced K-Means approach. For these tests, thesystem used traditional fuzzy logic and non-overlapping membership functions.
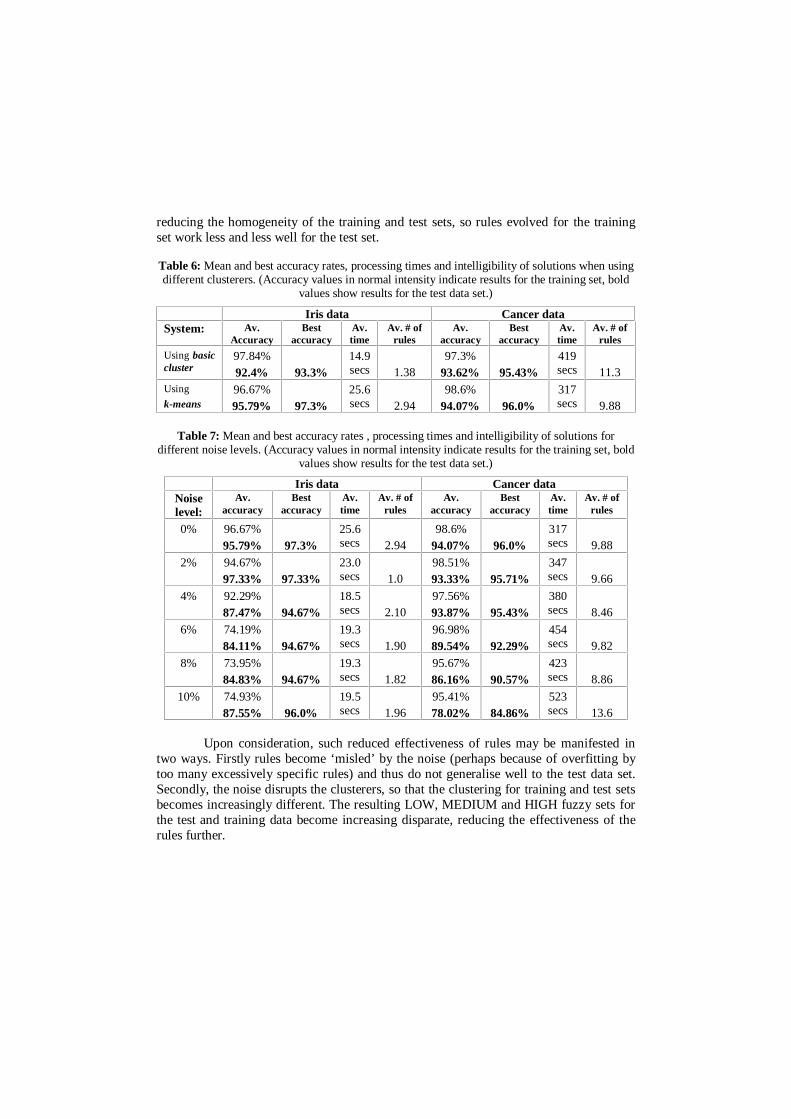
Tables 6 shows the results obtained from 50 runs of each system set-up for eachdata set. As can be seen from the average and best accuracy percentages, the basicclustering does result in slightly reduced performance of classification. The performanceloss is perhaps surprisingly low, though, when it is recalled how simple the basicclustering method is, compared to the K-Means approach. Different rules and differentnumbers of rules were evolved when using each type of clusterer, as shown by the otherresults in Table 6. There does not seem to be any clear correlation between intelligibilityor processing speed and the type of clusterer used.
5.5 Experiment 3: Investigating the Effects of Noise on the System
The objective of this final set of experiments was to evaluate the change of performanceof the system as levels of noise in the data sets was increased. Noise was cumulativelyadded to both data sets (and both the training and test files of each) in steps of 2%. Thiswas achieved by scaling one randomly chosen value in every fifty by a random value.The experiments investigate levels of noise up to 10% (i.e. one in ten values is wrong).Observed levels of noise in the data sets for which this system is designed are around 1%.These experiments were performed with the system using traditional fuzzy logic and non-overlapping membership functions.
Table 7 shows the results obtained from 50 runs of the system for both data sets,at six different levels of noise. Generally, the results show a gradual decrease in accuracyfor both data sets. At ten percent noise the accuracy for the Iris data does increase, butthis is likely to be chance and the fact that the number of values in the set is insufficientfor a 2% noise differential to affect a significant number of data items. However, theaccuracy falloff for the larger, Wisconsin Breast Cancer data set is particularly revealing.
Figure 9 shows the rate at which accuracy falls for classification of items in thetraining and test data sets as noise levels increase. Note the way accuracy falls linearly forthe training data, but appears to fall proportionate to the square of the percentage of noisein the test data. This large decrease in performance is likely to be caused by the noise
reducing the homogeneity of the training and test sets, so rules evolved for the trainingset work less and less well for the test set.
Table 6: Mean and best accuracy rates, processing times and intelligibility of solutions when usingdifferent clusterers. (Accuracy values in normal intensity indicate results for the training set, bold
values show results for the test data set.)
Iris data Cancer dataSystem: Av.
AccuracyBest
accuracyAv.time
Av. # ofrules
Av.accuracy
Bestaccuracy
Av.time
Av. # ofrules
Using basiccluster
97.84%92.4% 93.3%
14.9secs 1.38
97.3%93.62% 95.43%
419secs 11.3
Using
k-means96.67%95.79% 97.3%
25.6secs 2.94
98.6%94.07% 96.0%
317secs 9.88
Table 7: Mean and best accuracy rates , processing times and intelligibility of solutions fordifferent noise levels. (Accuracy values in normal intensity indicate results for the training set, bold
values show results for the test data set.)
Iris data Cancer dataNoiselevel:
Av.accuracy
Bestaccuracy
Av.time
Av. # ofrules
Av.accuracy
Bestaccuracy
Av.time
Av. # ofrules
0% 96.67%95.79% 97.3%
25.6secs 2.94
98.6%94.07% 96.0%
317secs 9.88
2% 94.67%97.33% 97.33%
23.0secs 1.0
98.51%93.33% 95.71%
347secs 9.66
4% 92.29%87.47% 94.67%
18.5secs 2.10
97.56%93.87% 95.43%
380secs 8.46
6% 74.19%84.11% 94.67%
19.3secs 1.90
96.98%89.54% 92.29%
454secs 9.82
8% 73.95%84.83% 94.67%
19.3secs 1.82
95.67%86.16% 90.57%
423secs 8.86
10% 74.93%87.55% 96.0%
19.5secs 1.96
95.41%78.02% 84.86%
523secs 13.6
Upon consideration, such reduced effectiveness of rules may be manifested intwo ways. Firstly rules become ‘misled’ by the noise (perhaps because of overfitting bytoo many excessively specific rules) and thus do not generalise well to the test data set.Secondly, the noise disrupts the clusterers, so that the clustering for training and test setsbecomes increasingly different. The resulting LOW, MEDIUM and HIGH fuzzy sets forthe test and training data become increasing disparate, reducing the effectiveness of therules further.

50.00%
55.00%
60.00%
65.00%
70.00%
75.00%
80.00%
85.00%
90.00%
95.00%
100.00%
0 2 4 6 8 10
training test
Figure 9: Average accuracy for increasing levels of noise in training and test cancer data.These effects are not so obvious for the Iris data where only a linear decrease in accuracy is
evident, perhaps because of the small number of data points in this set or because few rules wereused, helping rules to generalise without being misled by noise.
Table 7 also shows the number of rules and processing times for different levels ofnoise. From these results, there does not appear to be any clear correlation between levelsof noise in the data and intelligibility or speed.
6 Conclusions
This paper has investigated the use of a genetic programming system to evolve fuzzyrules for the purpose of detecting ‘suspicious’ data amongst ‘normal’ data. The systemcontains many novel elements, including a crossover operator designed to minimisedisruption, binary genotypes, and a new method for interpreting fuzzy rules designed topreserve all fuzzy set membership values.
Consultation with our collaborating company, Lloyds/TSB resulted in a set ofevaluation criteria for the system: intelligibility, speed, handling noise and accuracy.With these aspects in mind, three sets of experiments were performed on the system,using two standard data sets to permit comparison with the literature. The first testinvestigated the effect of membership functions on the system. By increasing the overlapbetween fuzzy membership functions and by preserving the information held in themembership values, the results showed that the number of rules needed to classify datacould be reduced. This reduction often led to a decrease in accuracy of classification, butthis was offset by the dramatically increased intelligibility of output, faster processingtime, and better feature selection. The second test investigated the effects of usingdifferent clusterers in the system. It was found that a basic clusterer slightly reduced theaccuracy of the system, compared to the more complex K-Means approach. The choice ofclusterer did not seem to have any consistent effect on intelligibility of output or

processing speed. The final test investigated the ability of the system to cope withincreasing levels of noise in the data. As one would expect, accuracy of classification wasdetrimentally affected as noise increased. Interestingly, the intelligibility and processingspeed showed no clear trend for increasing levels of noise.
Together, these experiments show:• many factors affect accuracy of classification• intelligibility and processing speed only seem to be affected by the type and use of
membership functions - noise and the choice of clusterer seems unimportant.• noisy data causes at best a linear drop in accuracy, and at worst, a fall proportionate
to the square of input noise.As with most real-world problems, there is no clearly defined ‘best solution’ to
the problem of detecting fraud by computers. This paper has examined one approach, andhas shown that, with the appropriate system components enabled, the use of GP to evolvefuzzy rules can provide intelligible, accurate classification quickly, even for noisy data.
Future Work
The system will be applied to a set of home insurance data provided by Lloyds/TSB inorder to assess its abilities to detect ‘suspicious’ claims. Since the experiments reportedhere indicate that different settings of the system provide useful classifications fordifferent data sets, an obvious solution is the use of decision aggregation using acommittee approach, allowing the best solution generated by the different modelsemployed by the system to be provided automatically.
Acknowledgments
Thanks to Hugh Mallinson for his implementation of the clustering algorithms and someof the fitness functions used in the system. Data was provided by the Data Set Repositoryat the Information and Computer Science Dept., University of California, Irvine. Thebreast cancer database originated from University of Wisconsin Hospitals, Madison,assembled by Dr. William H. Wolberg:ftp://ftp.ics.uci.edu/pub/machine-learning-databases/breast-cancer-wisconsin/breast-cancer-wisconsin.namesInsurance data has been kindly provided by Lloyds/TSB. This project is being performedin collaboration with Searchspace Ltd and Lloyds/TSB, and is funded by the EPSRC, ref:GR/L3/708.
References[1] Bentley, P. J. & Wakefield, J. P., 1996, Hierarchical Crossover in GeneticAlgorithms. In Proceedings of the 1st On-line Workshop on Soft Computing (WSC1),(pp. 37-42), Nagoya University, Japan.[2] Bentley, P. J. & Wakefield, J. P., 1997, Finding Acceptable Solutions in the Pareto-Optimal Range using Multiobjective Genetic Algorithms. Chawdhry, P.K.,Roy, R., &
Pant, R.K. (eds) Soft Computing in Engineering Design and Manufacturing. SpringerVerlag London Limited, Part 5, 231-240.[3] Bezdek, J. C. and Pal, S. K. (Ed.s), 1992, Fuzzy Models for Pattern Recognition.IEEE Press, New York.[4] Dasarathy, B.V., 1980, Nosing Around the Neighborhood: A New System Structureand Classification Rule for Recognition in Partially Exposed Environments. IEEETransactions on Pattern Analysis and Machine Intelligence, Vol. PAMI-2, No. 1, 67-71.[5] Hartigan, J. A, 1975, Clustering algorithms. Wiley, NY.[6] Kosco, B., 1994, Fuzzy Thinking, the new science of fuzzy logic. Flamingo. HarperCollins Pub., London.[7] Koza, J., 1992, Genetic Programming: On the Programming of Computers by Meansof Natural Selection. MIT Press.[8] Koza, J. et al., 1998, Genetic Programming ‘98: Proceedings of the Third AnnualGenetic Programming Conference. Morgan Kaufman Pub., CA.[9] Mallinson, H. and Bentley, P.J., 1999, Evolving Fuzzy Rules for PatternClassification. In Proc. of the Int. Conf. on Computational Intelligence for Modelling,Control and Automation - CIMCA’99.[10] Marmelstein, R. E. and Lamont, G. B., 1998, Evolving Compact Decision Rule Sets.In Koza, John R. (ed.). Late Breaking Papers at the Genetic Programming 1997Conference, Omni Press, pp. 144-150.[11] Mc. Neill, D. and Freiberger, P., 1993, Fuzzy Logic. Touch Stone Pub.[12] Pedrycz, W. (Ed.), 1997, Fuzzy Evolutionary Computation. Kluwer AcademicPublishers, MA.[13] Wolberg, W. H., and Mangasarian, O. L., 1990, Multisurface method of patternseparation for medical diagnosis applied to breast cytology. In Proceedings of theNational Academy of Sciences, 87,9193--9196.[14] Yu, T. and Bentley, P., 1998, Methods to Evolve Legal Phenotypes. In Proceedingsof the Fifth Int. Conf. on Parallel Problem Solving From Nature. Amsterdam, Sept 27-30,1998, pp. 280-282.[15] Zadeh, L. A., 1965, Fuzzy Sets. Journal of Information and Control, v8, 338-353.[16] Zhang, J. (1992). Selecting typical instances in instance-based learning. InProceedings of the Ninth International Machine Learning Conference, pp. 470--479.Aberdeen, Scotland: Morgan Kaufmann.