evolutionary relationships of the old world fruit bats
TRANSCRIPT

RESEARCH ARTICLE Open Access
Evolutionary relationships of the old world fruitbats (Chiroptera, Pteropodidae): Another starphylogeny?Francisca C Almeida1,2,3*, Norberto P Giannini1,4, Rob DeSalle2 and Nancy B Simmons1
Abstract
Background: The family Pteropodidae comprises bats commonly known as megabats or Old World fruit bats.Molecular phylogenetic studies of pteropodids have provided considerable insight into intrafamilial relationships,but these studies have included only a fraction of the extant diversity (a maximum of 26 out of the 46 currentlyrecognized genera) and have failed to resolve deep relationships among internal clades. Here we readdress thesystematics of pteropodids by applying a strategy to try to resolve ancient relationships within Pteropodidae, whileproviding further insight into subgroup membership, by 1) increasing the taxonomic sample to 42 genera; 2)increasing the number of characters (to >8,000 bp) and nuclear genomic representation; 3) minimizing missingdata; 4) controlling for sequence bias; and 5) using appropriate data partitioning and models of sequenceevolution.
Results: Our analyses recovered six principal clades and one additional independent lineage (consisting of a singlegenus) within Pteropodidae. Reciprocal monophyly of these groups was highly supported and generally congruentamong the different methods and datasets used. Likewise, most relationships within these principal clades werewell resolved and statistically supported. Relationships among the 7 principal groups, however, were poorlysupported in all analyses. This result could not be explained by any detectable systematic bias in the data orincongruence among loci. The SOWH test confirmed that basal branches’ lengths were not different from zero,which points to closely-spaced cladogenesis as the most likely explanation for the poor resolution of the deeppteropodid relationships. Simulations suggest that an increase in the amount of sequence data is likely to solvethis problem.
Conclusions: The phylogenetic hypothesis generated here provides a robust framework for a revised cladisticclassification of Pteropodidae into subfamilies and tribes and will greatly contribute to the understanding ofcharacter evolution and biogeography of pteropodids. The inability of our data to resolve the deepest relationshipsof the major pteropodid lineages suggests an explosive diversification soon after origin of the crown pteropodids.Several characteristics of pteropodids are consistent with this conclusion, including high species diversity, greatmorphological diversity, and presence of key innovations in relation to their sister group.
BackgroundThe family Pteropodidae comprises 186 currently recog-nized species commonly known as Old World fruit batsor megabats, and as such constitutes one of the largestfamilies of the order Chiroptera (Mammalia) [1]. The
name “megabats” is an abbreviation for Megachiroptera,and was coined in recognition of the large body size ofsome pteropodid species, which can reach over 1 kilo-gram in weight and have a wingspan of over 1.5 meters[2]. Pteropodids are almost exclusively phytophagous,feeding mostly on fruits, although some species are spe-cialized for nectar feeding. As a group, pteropodids areprimary dispersers of pollen and seeds in the Old Worldtropics [2]. They have a widespread distribution inAfrica, the tropics of Asia, and Australia as well as
* Correspondence: [email protected] Museum of Natural History, Division of Vertebrate Zoology,Department of Mammalogy, Central Park West at 79th Street, New York, NY10024, USAFull list of author information is available at the end of the article
Almeida et al. BMC Evolutionary Biology 2011, 11:281http://www.biomedcentral.com/1471-2148/11/281
© 2011 Almeida et al; licensee BioMed Central Ltd. This is an Open Access article distributed under the terms of the Creative CommonsAttribution License (http://creativecommons.org/licenses/by/2.0), which permits unrestricted use, distribution, and reproduction inany medium, provided the original work is properly cited.

occurring on many islands from the Indian Ocean to theWestern Pacific Ocean, where some species are highlyendangered and in risk of extinction [1,3]. Unlike otherbat families, members of Pteropodidae do not use laryn-geal echolocation, instead relying primarily on visionand olfaction to avoid obstacles and locate food sources.Phylogenetic relationships of Pteropodidae have been
the source of considerable debate. In the 1990s a con-troversy developed over whether or not Chiroptera wasmonophyletic or instead composed of two different evo-lutionary lineages (Megachiroptera and Microchiroptera)that achieved powered flight independently from originswithin different parts of the mammalian family tree (see[4], and references cited therein). Comprehensive ana-lyses of morphological and molecular data refuted thishypothesis and confirmed bat monophyly [5-8] but ana-lyses of DNA sequence data revealed a surprise - some“microbats” were in fact more closely related to Ptero-podidae than to the remaining Microchiroptera families[9,10]. This led to a revision of higher-level bat taxon-omy that saw Megachiroptera and Microchiroptera dis-carded and two new groups recognized,Yinpterochiroptera (for Pteropodidae and its close rela-tives, echolocating bats of the superfamily Rhinolophoi-dea) and Yangochiroptera (for the remainingecholocating bats) [11].All of these higher-level studies confirmed monophyly
of Pteropodidae, but considerable confusion hasremained concerning relationships within this clade.Contra traditional classifications (e.g., [12]), early mole-cular phylogenies of the group discovered that nectar-feeding megabats did not constitute a single monophy-letic group, but instead various nectar-feeding generawere related to different fruit-feeding lineages (e.g.,[8,13]). These relationships were formally recognized inthe classification of Bergmans [14], who divided thegroup into six extant subfamilies and several tribes
(Table 1). Subsequent phylogenetic studies of pteropo-dids have further questioned or strongly refuted com-monly recognized groupings (subfamilies, tribes), andidentified new, novel groupings of taxa [13,15-21]. Themost comprehensive studies to date based on molecularsequence data included 26 genera and were basedmostly on mitochondrial genes including 12S rRNA, 16SrRNA and the Cytochrome b gene plus a small sample ofnuclear data (~400 bp of the oncogene cmos) [18,19].Giannini and Simmons [19] confirmed the monophylyof Pteropodidae and of many higher-level taxa definedby Bergmans [14] (e.g., Pteropodini, Macroglossini, Dob-soniini, Epomophorinae, Epomophorini, Myonycterini,Cynopterinae). Nevertheless, support values for somenodes were low and resolution was poor in several partsof the tree. The weakest part of the phylogeny was oneof the most critical parts – the backbone, which ideallyshould show how the various higher-level groups arerelated to one another [19]. Basal relationships amongsubfamilies and tribes were discordant among differentdata treatments and generally received low statisticalsupport. For this reason, questions still remain regardingrelationships within and between major pteropodidclades.Lack of resolution along the backbone of a phyloge-
netic tree can result from sampling bias (or stochasticbias), systematic bias, or a combination of both [22].Sampling bias occurs when a data set does not containenough information to allow full resolution of taxonrelationships, either due to inadequate taxonomic sam-pling or lack of phylogenetic signal in the sampled loci[23-26]. Both factors could have influenced previousphylogenetic analyses of megabats, which were basedmostly on mitochondrial loci that may be saturated withsubstitutions at the tribal/subfamily level [27]. Incomple-teness of taxonomic sampling, which may contribute topoor phylogenetic results particularly at higher
Table 1 Bergmans (1997) classification of Family Pteropodidae
Subfamily Tribe Genera
Pteropodidae Pteropodini Pteropus, Acerodon, Pteralopex, Styloctenium, Neopteryx
Macroglossini Macroglossus, Syconycteris
Notopterini Notopteris, Melonycteris
Nyctimeninae Nyctimene, Paranyctimene
Harpyionyterinae Harpyionycteris
Rousettinae Rousettini Rousettus, Eonycteris, Eidolon
Dobsoniini Dobsonia, Aproteles
Epomophorinae Epomophorini Epomophorus, Micropteropus, Hypsignathus, Epomops, Nanonycteris
Myonycterini Myonycteris, Lissonycteris, Megaloglossus
Scotonycterini Scotonycteris, Casinycteris
Plerotini Plerotes
Cynopterinae Cynopterus, Ptenochirus, Megaerops, Dyacopterus, Balionycteris, Chironax, Thoopterus, Sphaerias, Aethalops, Penthetor,Latidens, Alionycteris, Otopteropus, Haplonycteris
Almeida et al. BMC Evolutionary Biology 2011, 11:281http://www.biomedcentral.com/1471-2148/11/281
Page 2 of 17

taxonomic levels, clearly could have played a role inpteropodid analyses, as only 26 out of the 46 pteropodidgenera currently recognized (57%) were represented inthe largest, previous molecular studies. Another type ofbias, known as systematic bias, is caused by non-phylo-genetic noise in the sequences such as differences inbase composition (causing unrelated taxa with similarbase composition to erroneously cluster together) and/or substitution rate (causing long-branch attraction) (e.g. [28,29]). Because these types of variation violate theassumptions of most reconstruction methods, they arealso potential causes for inaccuracy and poor resolutionin phylogenetic trees [22,30,31]. Moreover, samplingbias and systematic bias may synergistically interact,compounding their effects on the outcome of phyloge-netic inference [26]. None of these potential sources ofsystematic bias have been addressed in previous phylo-genetic studies on megabats.An alternative explanation for low resolution of rela-
tionships on a phylogenetic tree is that, instead of beinga consequence of bias or methodological artifacts, itreflects the true evolutionary history of the group. Rapiddiversification of a clade over a short period of timemay cause such a phylogenetic pattern, as has beenclaimed for the origin of the mammalian [32,33] andavian orders [34,35]. If diversification took place quicklyand long time ago, there may be little phylogenetic sig-nal because slowly-evolving genes may not have accruedmany changes (due to the short time span) while faster-evolving genes may have initially picked up changes, butthese were then overwritten by subsequent sequenceevolution. Also, short time interval between cladogeneticevents may hinder complete lineage sorting, confound-ing relationships within that time frame [36]. Such trees,with very short internal branches connected to the root,are also known as star phylogenies (e.g. [37,38]).Here we present a comprehensive study of the phylo-
genetic relationships among megabat genera based on alarge DNA-sequence dataset. Our focus was on resol-ving tribal membership and relationships among subfa-milies. We attempted to address potential sources ofbias in the phylogenetic reconstruction of this group,including low number of informative characters, missingdata, poor taxonomic sampling, and sequence bias. Thiswas accomplished by obtaining new sequences for fournuclear loci, thus significantly increasing taxonomicsampling, and by filling in gaps in sequence data frommitochondrial loci that had been previously sequencedin megabats by collecting new data from the additionaltaxa available to us. The inclusion of additional taxa notonly adds important information on variation but canalso help break up long branches, thus improving phylo-genetic accuracy and helping resolve clades that mayremain ambiguous with smaller taxon samples
[23,39-41]. The simultaneous analysis of several geneshas the obvious advantage of increasing the number ofphylogenetically informative characters and balancingstochastic errors [42-48], but can also reduce the effectsof systematic bias that may affect individual gene parti-tions, especially when locus-specific substitution modelsare employed in a probabilistic framework [31,49-51].To minimize the effects of various potential sources of
error in our analyses, detailed phylogenetic analyseswere conducted using tests for systematic sequence bias,different reconstruction methods, optimal data partition-ing in maximum likelihood analyses, and topology com-parisons based on data simulations. Our results defined7 well-supported groups for a new, cladistic classifica-tion of pteropodids, in several points different from thelast formal classification by Bergmans [14]. The mostbasal relationships within Pteropodidae, however, couldnot be fully resolved despite the increase in the amountof data and the use of careful phylogenetic analyses.This result could not be explained by any source ofmeasurable sequence bias, pointing to a biological causefor the observed pattern.
ResultsSequence data statisticsTo minimize the effects of missing data on tree resolu-tion [52], we first focused on a dataset that included 51pteropodid species for which at least four of the sixsequence fragments (RAG1, RAG2, vWF, BRCA1, Cytb,and 12S16S) used in this study were available (dataset1). The combined alignment of dataset 1 was 8181bplong, yielding 2504 parsimony informative sites. Detailsof sequence statistics of dataset 1 in the combined andper loci matrices are shown in Table 2. A saturationplot of the combined dataset (ingroup only, without taxawith missing one or more loci) did not show signs ofsubstitution saturation (Additional file 1), which wasconfirmed by a statistical test for saturation (Iss = 0.645,Iss.cSym = 0.844, p < 0.0001) [53].Despite differences among genes and codon positions,
we found relative homogeneity in GC content amongpteropodid taxa (Additional file 2). The c2 test failed to
Table 2 Sequence statistics and maximum parsimonyscores per gene and in the combined dataset 1
locus RAG1 RAG2 VWF BRCA1 Cytb 12S16S dataset1
alignment(bp)
1084 760 1231 1352 1140 2566 8181
invariable 851 567 811 848 592 1487 4648
pars. infor. 154 115 256 296 502 864 2504
CI MPa 0.536 0.582 0.516 0.748 0.210 0.287 0.334
RC MPb 0.357 0.410 0.322 0.605 0.077 0.138 0.165a Consistency Index. b Rescaled Consistency Index
Almeida et al. BMC Evolutionary Biology 2011, 11:281http://www.biomedcentral.com/1471-2148/11/281
Page 3 of 17
detect significant differences in either entire genes orindividual codon positions. We also checked for simila-rities and differences in GC content among the principalclades of Pteropodidae that could bias the resolution ofthe relationships among them (Additional file 2). Exceptfor the 3rd codon position of the Cytb locus, GC contentshowed little among clade variation. Rates of nucleotidesubstitution were also relatively homogeneous, with only7 pairwise taxa comparisons showing significant differ-ences. All these comparisons involved an outgrouptaxon compared with an ingroup taxon; no significantrate differences could be detected within the ingroup(Pteropodidae). Borderline p values were found in somecomparisons involving Balionycteris maculata, but notin other pairwise comparisons. This result suggests thelong-branch attraction is not likely to have a majoreffect in our phylogenetic results.
Phylogenetic analyses of individual genesMP and ML analyses were run for each locus separately(ML trees are available in the Additional file 3). Mosttopological differences among resulting trees were seenin basal relationships, but none was supported by > 60%bootstrap, which suggests absence of incongruent phylo-genetic signal among genes [54]. In a parsimony frame-work, the pairwise ILD tests did not detect significantpairwise incongruence. The same result was obtainedwith the likelihood based hierarchical test [55].
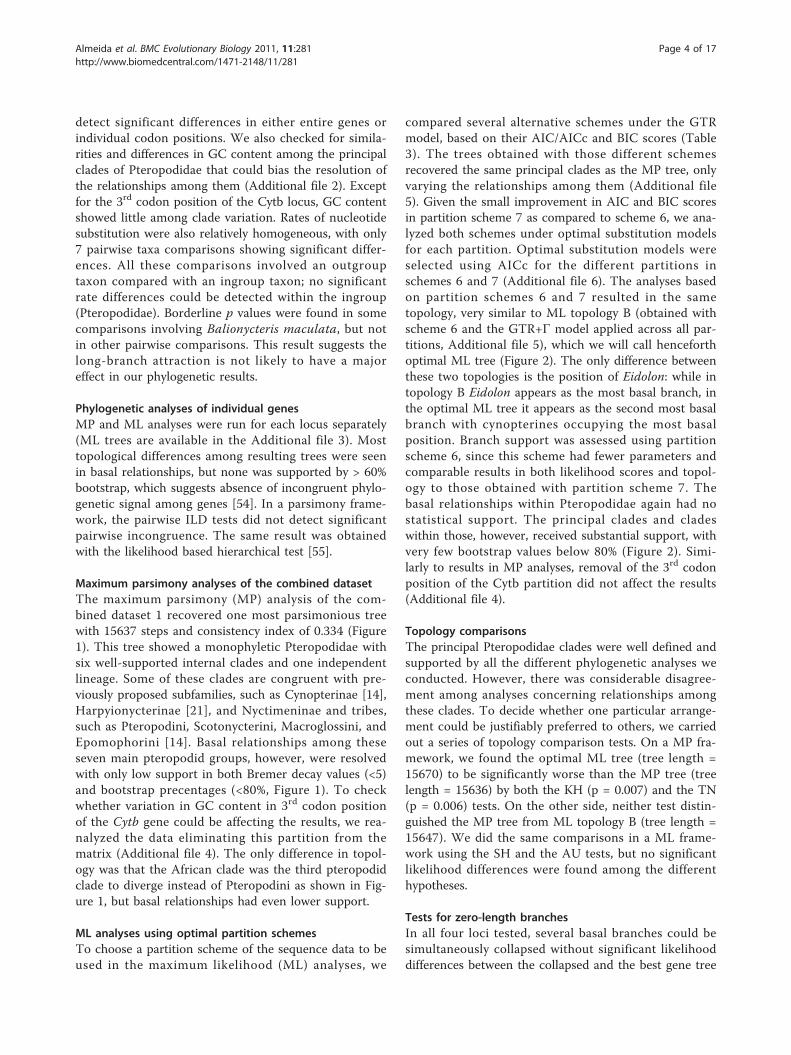
Maximum parsimony analyses of the combined datasetThe maximum parsimony (MP) analysis of the com-bined dataset 1 recovered one most parsimonious treewith 15637 steps and consistency index of 0.334 (Figure1). This tree showed a monophyletic Pteropodidae withsix well-supported internal clades and one independentlineage. Some of these clades are congruent with pre-viously proposed subfamilies, such as Cynopterinae [14],Harpyionycterinae [21], and Nyctimeninae and tribes,such as Pteropodini, Scotonycterini, Macroglossini, andEpomophorini [14]. Basal relationships among theseseven main pteropodid groups, however, were resolvedwith only low support in both Bremer decay values (<5)and bootstrap precentages (<80%, Figure 1). To checkwhether variation in GC content in 3rd codon positionof the Cytb gene could be affecting the results, we rea-nalyzed the data eliminating this partition from thematrix (Additional file 4). The only difference in topol-ogy was that the African clade was the third pteropodidclade to diverge instead of Pteropodini as shown in Fig-ure 1, but basal relationships had even lower support.
ML analyses using optimal partition schemesTo choose a partition scheme of the sequence data to beused in the maximum likelihood (ML) analyses, we
compared several alternative schemes under the GTRmodel, based on their AIC/AICc and BIC scores (Table3). The trees obtained with those different schemesrecovered the same principal clades as the MP tree, onlyvarying the relationships among them (Additional file5). Given the small improvement in AIC and BIC scoresin partition scheme 7 as compared to scheme 6, we ana-lyzed both schemes under optimal substitution modelsfor each partition. Optimal substitution models wereselected using AICc for the different partitions inschemes 6 and 7 (Additional file 6). The analyses basedon partition schemes 6 and 7 resulted in the sametopology, very similar to ML topology B (obtained withscheme 6 and the GTR+Γ model applied across all par-titions, Additional file 5), which we will call henceforthoptimal ML tree (Figure 2). The only difference betweenthese two topologies is the position of Eidolon: while intopology B Eidolon appears as the most basal branch, inthe optimal ML tree it appears as the second most basalbranch with cynopterines occupying the most basalposition. Branch support was assessed using partitionscheme 6, since this scheme had fewer parameters andcomparable results in both likelihood scores and topol-ogy to those obtained with partition scheme 7. Thebasal relationships within Pteropodidae again had nostatistical support. The principal clades and cladeswithin those, however, received substantial support, withvery few bootstrap values below 80% (Figure 2). Simi-larly to results in MP analyses, removal of the 3rd codonposition of the Cytb partition did not affect the results(Additional file 4).
Topology comparisonsThe principal Pteropodidae clades were well defined andsupported by all the different phylogenetic analyses weconducted. However, there was considerable disagree-ment among analyses concerning relationships amongthese clades. To decide whether one particular arrange-ment could be justifiably preferred to others, we carriedout a series of topology comparison tests. On a MP fra-mework, we found the optimal ML tree (tree length =15670) to be significantly worse than the MP tree (treelength = 15636) by both the KH (p = 0.007) and the TN(p = 0.006) tests. On the other side, neither test distin-guished the MP tree from ML topology B (tree length =15647). We did the same comparisons in a ML frame-work using the SH and the AU tests, but no significantlikelihood differences were found among the differenthypotheses.
Tests for zero-length branchesIn all four loci tested, several basal branches could besimultaneously collapsed without significant likelihooddifferences between the collapsed and the best gene tree
Almeida et al. BMC Evolutionary Biology 2011, 11:281http://www.biomedcentral.com/1471-2148/11/281
Page 4 of 17

as compared to the null distribution obtained withsimulations: four branches for RAG1, five for vWF, sixfor BRCA1, and five for 12S16S (Table 4). Analyzing thecombined matrix, five basal branches could be separately
collapsed without significantly changing tree likelihoodaccording to the SH and the AU tests (at 1% signifi-cance level; Additional file 7). Nevertheless, only threeof them could be simultaneously collapsed with the
Desmalopex leucopterus
Haplonycteris fischeri
Macroglossus sobrinus
Boneia bidens
Dobsonia praedatrix
Nyctimene robinsoni
Melonycteris fardoulisi
Balionycteris maculata
Rhinopoma hardwickii
Pteropus giganteus
Dobsonia inermis
Aethalops alecto
Alionycteris paucidentata
Macroglossus minimus
Eidolon helvum
Syconycteris australis
Nanonycteris veldkampii
Chironax melanocephalusPenthetor lucasi
Stenonycteris lanosus
Nyctimene vizcaccia
Acerodon celebensis
Megaerops kusnotoi
Megaderma lyra
Sphaerias blanfordi
Myonycteris torquata
Otopteropus cartilagonodus
Dyacopterus spadiceus
Rousettus amplexicaudatus
Pteropus tonganus
Micropteropus pusillus
Casinycteris argynnis
Rousettus leschenaultii
Hipposideros commersoni
Styloctenium mindorensis
Rhinolophus creaghi
Epomophorus wahlbergi
Harpyionycteris whiteheadi
Eonycteris robusta
Nyctimene cephalotes
Melonycteris melanops
Dobsonia moluccensis
Rousettus madasgacariensis
Harpyionycteris celebensis
Pteropus vampyrus
Dobsonia minor
Eonycteris spelaea
Megaerops ecaudatus
Epomops franqueti
Scotonycteris zenkeri
Ptenochirus jagori
Artibeus jamaicensis
Megaloglossus woermanni
Cynopterus brachyotis
Hypsignathus monstrosusLissonycteris angolensis
63
8
37
11
24
16
11
3
109
66
124
11
53
33
30
29
2
4
117
11
7
4
54
144
22
4
5
62
4
36
2
19
15
22
17
66
20
7
3
138
5
10
34
52
17
64
1814
137
115
100
100
59
100
71
100
100
100100
100
10093
65
100
61
100
70
93
100
96
64
74
95
88
83
68
9985
100
57
100100
100
100
100100
10089
57100
85
100100
100
100
Figure 1 Single most parsimonious tree recovered with dataset 1. Tree scores are shown in Table 2. Numbers above branches are Bremerdecay values and below branches are bootstrap percentages (when above 50%) obtained with 1000 replicates.
Almeida et al. BMC Evolutionary Biology 2011, 11:281http://www.biomedcentral.com/1471-2148/11/281
Page 5 of 17

same result (only two nodes at 5% significance; Table 4).These results are in agreement with the idea that a sub-stantial increase in the amount of data allows resolvingsplits that happen in a very short period of time. Todetermine how much sequence data would be necessaryto resolve each of the basal nodes we simulated datasetsof 10 kb, 12 kb, and 14 kb based on the best tree, usingthe same sequence parameters of the original combineddataset. The best trees obtained for the simulated data-sets were then compared with trees derived from thebest tree but with each of the basal nodes collapsedseparately. Significant resolution of basal nodes as mea-sured by pSH < 0.01 would be obtained with 10 kb fornode D, 12 kb for nodes C and E, and 14 kb for nodesA and B (Figure 3, Figure 2).
The position of additional generaCombined dataset 2 included five additional genera forwhich data were available for only one or two mitochon-drial loci; the dataset thus includes 56 ingroup taxa andfive outgroup taxa. The MP analysis of dataset 2 resultedin six equally parsimonious trees with 16389 steps. Theconsensus tree has again Eidolon as the most basal ptero-podid and a polytomy including all other principal cladesas recovered in our analyses of dataset 1 (Figure 4). Mostof the extra genera included in dataset 2 fell in cladesaccording to expectations based on the most currentclassification of Pteropodidae [14,21], with the exceptionof Notopteris. Most of the relationships involving theadditional taxa, however, had low or no statistical
support. To analyze dataset 2 using ML methods, weused partition scheme 6 and the same optimal models asin our analysis of dataset 1. The resulting tree showedvery similar relationships for the additional taxa as com-pared to the MP tree (Figure 5). The main difference wasin the close relationships of Pteralopex, although theprincipal clade in which it fell was the same.
Biogeographic analysisThe objective of our biogeographic analyses was to inferancestral areas for the main pteropodid clades thatappeared consistently across analyses. Because of miss-ing taxa, a thorough analysis of the biogeographic his-tory of pteropodids would not be accurate. Thus, weused DIVA [56] to infer ancestral areas for the cladecontaining all the pteropodids plus the six principalclades. These results were plotted on the ML treeobtained for dataset 2 (Figure 5). New Guinea and Mel-anesia Islands (area H) appear as a possible ancestralarea for most internal clades, with the only exceptionbeing cynopterines. The results for the Cynopterinaesubfamily agree with our previous analyses, indicatingthat this clade had its origins most likely in the Sundaicregion [27]. Another interesting result is the origin ofthe clade formed by African genera, Rousettus, andEonycteris. Although different area combinations havesimilar probabilities of being the ancestral area of thatgroup, the African continent does appear as one ofthem, while all other alternatives are area combinationsthat include Africa.
Table 3 Partition schemes used in ML analyses of combined dataset 1
scheme #a partitionsb ln L AIC/AICc BIC parameters topologyc
1 1 no partition -94660.30 189554.6 190374.7 117 A
2 4 codon_1, codon_2,codon_3, 12S16S
-90704.00 181696 182705.4 144 A
3 5 nuclear_12,nuclear_3, Cytb_12,Cytb_3, 12S16S
-86566.50 173439 174511.4 153 B
4 6 RAG1, RAG2, vWF,BRCA1, Cytb,
12S16S
-90465.01 181254 182389.6 162 C
5 7 nuclear_1,nuclear_2,
nuclear_3, Cytb_1,Cytb_2, Cytb_3,
12S16S
-86362.20 173066.3 174264.9 171 D
6 11 RAG1_12, RAG1_3,RAG2_12, RAG2_3,vWF_12, vWF_3,
BRCA1_12,BRCA1_3, Cytb_12,Cytb_3, 12S16S
-85935.75 172296.3 173736.5 207 B
7 16 each codon positionfor each codinggene, 12S16S
-85683.00 171887.5 173637.8 252 E
a Number of partitions. b Numbers after underscore represent codon position. c Topologies are illustrated in the Additional file 5.
Almeida et al. BMC Evolutionary Biology 2011, 11:281http://www.biomedcentral.com/1471-2148/11/281
Page 6 of 17

DiscussionPhylogenetic relationships and systematics ofpteropodidsHere we present the most complete ever analysis of theevolutionary relationships of pteropodid bats using anumber of reconstruction and statistical approaches.The phylogenetic trees presented here, independently of
the reconstruction method employed or the partitionanalyzed (from individual genes to combined data),almost unanimously recovered six principal clades andone independent lineage (Eidolon), variously joined byversions of a poorly supported backbone. By contrast,relationships of genera within each of those principalclades were generally consistent and in agreement across
M. lyra
R. creaghi
R. hardwickiiH. commersoni
A. jamaicensis
100
10058
Ptenochirus jagoriCynopterus brachyotis
Megaerops kusnotoiMegaerops ecaudatus
78
100
100
100
100
100
100
100
88
100
97
98
Otopteropus cartilagonodusHaplonycteris fischeri
Alionycteris paucidentata
Aethalops alectoSphaerias blanfordi
Dyacopterus spadiceus
Chironax melanocephalusBalionycteris maculata
Penthetor lucasi
88
100
100100
100
100
100
100
Nyctimene vizcacciaNyctimene cephalotesNyctimene robinsoni
Desmalopex leucopterusMelonycteris fardoulisi
Melonycteris melanops
Acerodon celebensisStyloctenium mindorensis
Pteropus vampyrusPteropus giganteus
Pteropus tonganus
Eidolon helvum
Macroglossus minimusMacroglossus sobrinus
Syconycteris australis
Dobsonia minorDobsonia moluccensis
Dobsonia praedatrixDobsonia inermis
100
98
100
100
100
100
100
100
73
Hypsignathus monstrosus
Nanonycteris veldkampiiEpomops franqueti
Epomophorus wahlbergiMicropteropus pusillus
100
100
100
100
10091
100
65Stenonycteris lanosus
Myonycteris torquata
Megaloglossus woermanniLissonycteris angolensis
Casinycteris argynnisScotonycteris zenkeri
Eonycteris robustaEonycteris spelaea
Rousettus amplexicaudatus
Rousettus madagascariensisRousettus leschenaultii
99
100100
100
100
100
64
100
Boneia bidens
Harpyionycteris whiteheadiHarpyionycteris celebensis
71
51A
B
C
D
E
Figure 2 Maximum likelihood tree obtained with dataset 1 and partition scheme 6. Substitution models and parameters used are listed inthe Additional file 6. Bootstrap values above 50% are shown next to branches.
Almeida et al. BMC Evolutionary Biology 2011, 11:281http://www.biomedcentral.com/1471-2148/11/281
Page 7 of 17

the different analyses performed. Some of the principalpteropodid clades recovered in our trees are congruentwith previously proposed subfamilies, such as Cynopteri-nae [14], Harpyionycterinae [21], and Nyctimeninae [14].
The other three main clades, represented by Macroglos-sini, Epomophorinae + Rousettini, and Pteropodini +Melonycteris (all groups sensu Bergmans [14]), were indisagreement with previous classifications into subfami-lies. Some of these discrepancies had already beenobserved in previous studies, such as the clustering ofEpomophorinae + Rousettini [19].The phylogeny of the subfamily Cynopterinae was
recently addressed by Almeida et al. [27]. The twomajor cynopterine clades recovered in that study alsoappeared as supported groups in all topologies recov-ered in our analyses, suggesting that these groupings arestable to varying taxonomic sampling and character datarepresentation. Similarly, a recently recognized andexpanded group of megabats, Harpyionycterinae (see[20,21]), was also recovered in this study. This heteroge-neous group is formed by two clades, the dobsoniine or
Table 4 Results of tests for zero-length branches on genetrees
gene collapsed nodesa Dli simulationsb Dli mainc
BRCA1 A+B+C+D+E+1 0.197 - 12.408 3.238
RAG1 A+C+D+E 0.054 - 14.313 10.61
vWF A+B+C+D+E 0.893 - 13.801 5.479
12S16S A+B+C+E+1 0.773 - 9.641 6.007
combined A+B+C 0.043 - 5.656 4.496a Nodes are labeled on Figure 2 of the manuscript. b Range of the likelihooddifferences between collapsed tree and best tree obtained over 100simulations, representing the null distribution for the main likelihoodcomparison. c Likelihood difference between the collapsed tree and the actualbest tree.
Figure 3 P value of SH test versus length of simulated datasets. SH tests were done between ML best trees and derived trees with acollapsed node for the original dataset (8174 bp) and three simulated datasets (10 kb, 12 kb, and 14 kb). The simulated datasets were obtainedwith the same nucleotide frequency and substitution parameters found in the original dataset. Nodes A, B, C, D, and E are labeled in Figure 2.
Almeida et al. BMC Evolutionary Biology 2011, 11:281http://www.biomedcentral.com/1471-2148/11/281
Page 8 of 17

bare-backed bats (Dobsonia and Aproteles) and theharpy bats from the Philippines and Sulawesi. Boneiabidens, a bat formerly included as a subgenus of Rouset-tus (e.g., [1,14]) joined this clade as sister to
Harpyionycteris as previously reported [21]. The Ptero-podini and Macroglossini tribes were also recovered asmajor clades in our study, but not as sister taxa or closerelatives (Figure 4) in a monophyletic subfamily
103/100
19/99
6/51
64/100
5/-
11/-
8/78
1/-
1/-
21/100
46/100
1/-
4/65
5/76
1/-
21/99
26/100
70/100
3/66
53/100
61/100
5/89
97/100
51/100
33/100
6/67
121/100
2/68
4/63
110/100
35100
66/100
7/89
11/76
5/77
53/100
5/-
8/78
15/100
10/94
6/62
1/-
82/100
20/100
5/-
19/94
1/-
40/100
11/93
52/100
Rhinopoma hardwickiiMegaderma lyra
Hipposideros commersoniRhinolophus creaghi
Artibeus jamaicensis
Eidolon helvum
Boneia bidens
Dobsonia praedatrixDobsonia inermis
Harpyionycteris whiteheadi
Dobsonia moluccensis
Harpyionycteris celebensis
Dobsonia minor
Aproteles bulmerae
Megaerops kusnotoiMegaerops ecaudatus
Ptenochirus jagoriCynopterus brachyotis
Haplonycteris fischeri
Balionycteris maculataAethalops alectoAlionycteris paucidentata
Chironax melanocephalusPenthetor lucasi
Sphaerias blanfordi
Otopteropus cartilagonodus
Dyacopterus spadiceus
Thoopterus nigrescens
Latidens salimalii
Nanonycteris veldkampii
Stenonycteris lanosus
Myonycteris torquata
Rousettus amplexicaudatus
Micropteropus pusillus
Casinycteris argynnis
Rousettus leschenaultii
Epomophorus wahlbergi
Eonycteris robusta
Rousettus madagascariensis
Eonycteris spelaea
Epomops franqueti
Scotonycteris zenkeri
Megaloglossus woermanni
Hypsignathus monstrosusLissonycteris angolensis
Macroglossus sobrinusMacroglossus minimus
Syconycteris australis
Nyctimene robinsoni
Notopteris macdonaldiNyctimene vizcacciaNyctimene cephalotes
Desmalopex leucopterusMelonycteris fardoulisi
Pteropus giganteus
Acerodon celebensisPteropus tonganus
Styloctenium mindorensis
Melonycteris melanops
Pteropus vampyrus
Pteralopex atrata
Figure 4 Consensus of six most parsimonious trees obtained with dataset 2. Numbers shown above branches refer to Bremer decay values(left) and bootstrap percentages (right).
Almeida et al. BMC Evolutionary Biology 2011, 11:281http://www.biomedcentral.com/1471-2148/11/281
Page 9 of 17

Pteropodinae, as proposed by Bergmans [14]. In this study,Pteropodinae was recovered as a clade composed of onenectarivorous genus (Melonycteris) associated to flyingfoxes and related megabats (Acerodon, Desmalopex,
Mirimiri, Pteralopex, Pteropus, and Styloctenium). Theexclusion of two genera (Mirimiri and Neopteryx) and thelack of statistical support for some internal relationshipsclaim for a more detailed study of the pteropodines.
AC
B
D
E
F
GH
IK
J
Ptenochirus jagoriCynopterus brachyotis
Megaerops kusnotoiMegaerops ecaudatus
Sphaerias blanfordiDyacopterus spadiceus
Thoopterus nigrecensAethalops alecto
Balionycteris maculata
Otopteropus cartilagonodusHaplonycteris fischeri
Alionycteris paucidentata
Latidens salimaliiChironax melanocephalus
Penthetor lucasiEidolon helvum
Notopteris macdonaldiNyctimene vizcaccia
Nyctimene cephalotesNyctimene robinsoni
Desmalopex leucopterusPteralopex atrata
Melonycteris fardoulisiMelonycteris melanops
Acerodon celebensisStyloctenium mindorensis
Pteropus vampyrusPteropus giganteusPteropus tonganus
Macroglossus minimusMacroglossus sobrinus
Syconycteris australis
Boneia bidens
Harpyionycteris whiteheadiHarpyionycteris celebensis
Aproteles bulmeraeDobsonia minor
Dobsonia moluccensis
Dobsonia praedatrixDobsonia inermis
Casinycteris argynnisScotonycteris zenkeri
Eonycteris robustaEonycteris spelaea
Rousettus amplexicaudatus
Rousettus madasgacariensisRousettus leschenaultii
Stenonycteris lanosus
Myonycteris torquata
Megaloglossus woermanniLissonycteris angolensis
Hypsignathus monstrosus
Nanonycteris veldkampiiEpomops franqueti
Epomophorus wahlbergiMicropteropus pusillus
100
100
100
100
100
100
100 100
100
100
100
100
100
100
100100
100
100
100
100
100100
100
97
98
97
67
99
96
97
73
61
66
87
92
94
98
84
71
93
63
66
82
55
98
Outgroups
E-AE-EF EH-BE
F-FH-GH
EI-FI-EHFH-DH
F-H
A-AH-AD AF-AE-AG
G-H
E
Figure 5 ML tree obtained with dataset 2 and partition scheme 6. Terminals in bold letters were represented in the data matrix by onlytwo gene partitions. Bootstrap values greater than 50% are shown. Letters inside rectangles represent the inferred possible ancestral areas(labeled on the map insert and in the Additional file 9) for the referred clades.
Almeida et al. BMC Evolutionary Biology 2011, 11:281http://www.biomedcentral.com/1471-2148/11/281
Page 10 of 17

One major clade, including rousettines (excludingBoneia as discussed earlier) and all African megabats(excluding Eidolon as discussed earlier) was recoveredconsistently and with high support across all analyses inthis study. Versions of this clade, although differingsomewhat in taxonomic sampling, have been consis-tently recovered since Hollar and Springer [13] firstinvestigated pteropodid relationships using molecularmethods [16,18,19]. This clade was originally highly con-troversial because the molecular data joined taxa fromdisparate traditionally recognized taxonomic groupings:rousettines (Eonycteris, Rousettus, and Stenonycteris) andepomophorines (the remainder of the African, exceptfor Eidolon) sensu Bergmans [14]. Giannini and Sim-mons [19], however, demonstrated morphological sup-port for this now expanded “African clade”. It isnoteworthy that two other African genera, Scotonycterisand Casinycteris, included in the Epomophorinae sub-family by Bergmans [14] and here for the first timesampled in a molecular phylogenetic study, appeared assister to that clade in our analyses. This finding hasimportant biogeographic implications, pointing to anAfrican origin of this group as shown in the results ofthe biogeographic analysis.Eidolon is an unusual taxon that was the single mega-
bat genus not linked to any other genera in a majorclade. To some extent, this is a somewhat unsurprisingresult as affinities of Eidolon have always been conten-tious; however, it is remarkable that the observed place-ment of Eidolon does not seem to be an artifact fromprimary data since no significant codon bias nor differ-ences in evolutionary rates could explain this result.Morphology tends to support an association of Eidolonand other large megabats in the pteropodine clade [19].A clade formed by Eidolon + Pteropodini, however, wasnot represented in any of the trees obtained with thecombined dataset. This result suggests that the non-overlapping distribution of Eidolon versus pteropodinesin continental Africa may have ecological and biogeo-graphic rather than phylogenetic origin. Eidolon wasincluded in the Rousettinae subfamily by Bergmans [14],but our results strongly suggest it should be in a sepa-rate subfamily by itself. It is possible that the Melanesiangenus Notopteris represents another case of independentlineage, as suggested by the lack of statistical supportfor its relationship with other pteropodid genera. Asonly mitochondrial sequences were available for thisgenus, additional data will be required to resolve theaffinities of Notopteris.Despite general lack of agreement among partitions
and methods of analysis and statistical support for therelationships of the principal pteropodid clades, twogroupings seem to be slightly favored. These two group-ings received more than 50% bootstrap support in the
optimal ML tree and appeared in a few other recoveredtrees. One is the clustering of Macroglossini and Har-pyionycterinae as sister clades also obtained in MP treeand several of the suboptimal ML trees (Figure 4), withmaximum bootstrap support of 73%. The other is theclade formed by Nyctimeninae and Pteropodini, whichreceived 64% bootstrap support in the optimal ML treeand was also recovered in other ML trees (ML topolo-gies B, C, D - Additional file 5), but did not appear inthe MP tree.
Basal polytomyEvolutionary relationships that cannot be resolved in aphylogenetic analysis may represent a soft or a hardpolytomy. A soft polytomy is the result of analyticalbias, while a hard polytomy illustrates biological phe-nomena such as an explosive radiation. Hard polytomiesare so called because can only be broken with a largeamount of data and careful analyses. Before indentifyinga hard polytomy it is necessary first to eliminate possiblebias that could cause a soft polytomy.We were able to assemble a matrix with a wide genera
representation and relatively little missing data. Theconcatenated matrix of six loci showed no signs of sub-stitution saturation, and contained enough phylogeneticsignal to resolve a strongly supported monophyleticPteropodidae, the superfamily Rhinolophoidea sensuTeeling et al. [57], and most ingroup relationships (37out of 49) with bootstrap > 96% (43 with bootstrap >70%). Detailed characterization of the data did notuncover important systematic sequence bias that couldblur phylogenetic signal [58]– megabats were shown tobe relatively homogeneous in nucleotide composition atmost partitions and in evolutionary rates, and no signifi-cant conflicting phylogenetic signal was detected amongthe different loci used. Moreover, phylogenetic analysesunder the ML framework using specific substitutionmodels for different partitions of the data most likelyaccounted for any minor sequence bias that could haveaffected the analyses [31,50,51,54,59].Instead of having conflicting signal, the different loci
used in this study agreed in a general lack of resolutionat the base of the pteropodid tree. The results of theSOWH test support that at least some of the basal(inter subfamilies) relationships have zero-lengthbranches in one or more gene partitions, some of whichoccurring across all partitions. As expected, an increasein the amount of data (i.e. the combined dataset)decreased the number of basal branches that could besimultaneously collapsed without affecting likelihoodscores. Simulations of larger datasets suggest that theaddition of about 6 kb to the Pteropodidae combinedmatrix used here would probably allow to resolve allbasal relationships of the family. This result is similar to
Almeida et al. BMC Evolutionary Biology 2011, 11:281http://www.biomedcentral.com/1471-2148/11/281
Page 11 of 17

that obtained in the analyses of the relationships amongbird orders. After being shown to represent a hardpolytomy [34], the intraordinal relationships of Neoavescould finally be resolved with a 32 kb dataset [35].Because the radiation of Neoaves is much older thanthat of Pteropodidae, it is expected that that grouprequire more data for phylogenetic resolution. As pre-viously suggested, the older the radiation, the greaterthe effect of rapid diversification on phylogenetic resolu-tion [60].
Explosive radiation of megabats?Lack of phylogenetic resolution (hard polytomy) evenwhen a considerable amount of data is used has beeninterpreted as evidence of closely spaced cladogeneticevents [32,33,35,60,61]. Pteropodidae has apparentlybeen distinct from other bat lineages since at least theearly Eocene [10,62] but the crown group is believed tobe of more recent origin. Estimates for the beginning ofcrown group divergence range between 31 and 20 mil-lion years (My) [10,27]. Using an estimate of 26 My forthe pteropodid radiation and the substitution ratesobtained with our combined dataset, the first three cla-dogenetic events of Pteropodidae are estimated to haveoccurred within approximately 0.5 My.The results of our phylogenetic analysis, therefore,
suggest that pteropodids experienced an explosive radia-tion that generated all main lineages representing itsextant diversity. Although a more focused analysiswould be necessary to fully evaluate this hypothesis,some characteristics of the family Pteropodidae are con-sistent with the idea that it experienced an explosiveradiation. Explosive radiations are usually associatedwith high taxonomic diversity [63] and Pteropodidae isin fact one of the most diverse bat families. Among the20 bat families currently recognized, Pteropodidae rankssecond in both genus and species diversity with over 45genera and over 180 species [1,64].Explosive radiations can be caused by demographic
factors, intrinsic evolutionary rates, ecological adapta-tion, or a combination of any or all of these factors [65].When an explosive radiation is accompanied by ecologi-cal adaptation (adaptive radiation), it often involves theevolution of novel characters (key innovation)[63,65,66]. Pteropodidae exhibits numerous innovationswhen compared to their closest relatives (Rhinolophoi-dea and Yangochiroptera), including primary phyto-phagy and predominance of visual over acousticorientation (for an extensive list of differences betweenmegabats and microbats see [67]). Also in accordancewith ecological adaptation as a drive to diversification isthe marked morphological diversity of megabats, such asthe high variance in body size, as compared to the otherbat families [68] and the independent evolution of
nectarivorous habits and associated morphological adap-tations in several of the pteropodid clades. Among thedemographic causes of explosive radiations are smallpopulation sizes (favoring differentiation through geneticdrift) and/or the existence of isolated peripheral popula-tions. Given the flight power of megabats and their geo-graphic distribution on (often isolated) islands,colonization of underpopulated areas and the existenceisolated peripheral populations could both have contrib-uted for an explosive radiation of megabats.
ConclusionsOur phylogenetic analyses identified six principal cladesand one additional independent lineage within Pteropo-didae. This result points to the need for a new formalclassification of the family based on monophyletic units.The trees presented here are the most complete ever forthe family in terms of genera representation, and arerobust in terms of providing statistical support for pter-opodid relationships. They thus provide a sound phylo-genetic framework for the study of the morphologic,ecologic, and behavioral evolution within this highlydiverse and divergent bat family. In contrast with thehigh statistical support obtained for the major pteropo-did groups and subordinate clades, relationships amongthe seven principal clades were largely unresolved. Con-gruence in this aspect among different gene trees andthe results of simulations and the SOWH test suggestthat crown pteropodids experienced an explosive radia-tion soon after their origin. To further evaluate thehypothesis of an explosive radiation of megabats anddetermine the potential processes involved will require anumber of additional analyses including estimates ofdivergence times, estimates of diversification rates, andcomparisons with other mammalian families with simi-lar divergence times. A complete genus-level taxonomicsampling along with complete locus representation willbe important in these future analyses.
MethodsSamplingThe effect of missing data on phylogenetic estimation isstill a matter of controversy [52,69-72]. Our preliminaryanalyses using data partitions of the concatenated genematrix and maximum likelihood searches showed recon-struction problems when whole partitions were missingfor certain taxa. Accordingly, in order to minimize anypossible effects of missing data, we generated two differ-ent data matrices for phylogenetic analyses. In the firstmatrix (combined dataset 1), our goal was to minimizemissing data while including as much as possible of thegeneric diversity of Pteropodidae. This matrix included51 pteropodid species, representing 37 of the 46 ptero-podid genera (Additional file 8). Among these 51
Almeida et al. BMC Evolutionary Biology 2011, 11:281http://www.biomedcentral.com/1471-2148/11/281
Page 12 of 17

ingroup samples, 50 had all sequences determinedexperimentally by us from tissue samples donated byseveral institutions and individuals. Sequences of theremaining species were obtained from the Genbank(NCBI-NIH). In this first matrix, 44 of the ingroup taxawere represented by all eight genes used in the analyses,four taxa had one missing gene, and one taxon had twomissing genes. Some of the sequences obtained by ushave already been published [20,21,27,73].A second matrix (dataset 2) was built to include five
additional pteropodid genera for which only a fewsequences are available (Additional file 8). These generawere mostly represented by two mitochondrial genes,usually the ribosomal genes 12S and 16S. Most of thesesequences were obtained from the Genbank, except forthose of the genus Latidens, which we sequenced our-selves. Dataset 2 included all currently recognized ptero-podid genera except four taxa for which no DNAsequence is available (Paranyctimene, Mirimiri, Neop-teryx, and Plerotes) [1,74].As outgroups, we used sequences from Genbank of
five non-pteropodid bats. Four of these, Rhinopomahardwickii, Hipposideros commersoni, Megaderma lyra,and Rhinolophus creaghi, belong to the yinpterochirop-teran superfamily Rhinolophoidea, which is widelyaccepted as the sister group of Pteropodidae [9,10]. Thefifth outgroup species, Artibeus jamaicensis, representsthe other chiropteran suborder, Yangochiroptera.
Molecular methodsEight genes were sequenced for this study, includingboth nuclear and mitochondrial loci. The four nucleargene regions included the exon 28 of the von Willeb-rand Factor gene (vWF, 1230 bp), partial RecombinationActivating Gene 1 (RAG1, 1084 bp), partial Recombina-tion Activating Gene 2 (RAG2, 760 bp), and partialBreast Cancer 1 gene (BRCA1, about 1370 bp). Thesegenes have been used to reconstruct the phylogeny ofthe Chiroptera families and were able to resolve mostinterfamilial relationships [9]. Besides, these genes havebeen successfully used to resolve relationships at sub-family and genus levels in diverse groups of bats[21,27,73,75]. The four mitochondrial genes weresequenced in two fragments: one containing the com-plete sequence of the Cytochrome b gene (Cytb, 1140bp) and another including partial rRNA 12S gene (1069bp), the valine tRNA gene, and partial rRNA 16S gene(1330 bp), totaling about 2550 bp. The latter fragmenthas also proven highly informative at the familial levelin Chiroptera [9]. The combined sequence set encom-passed a total of 8181 bp of aligned nucleotides (includ-ing indels). Individual ingroup samples in dataset 1 hadconcatenated sequences ranging from 6011 bp to 8025bp in length.
Total DNA was obtained from preserved tissue sam-ples with the DNeasy tissue kit (QIAGEN). PCR amplifi-cation was carried out using previously publishedprimers (RAG1 and RAG2: [9]; vWF: [76]; Cytb: [77];12S: [78]; 16S: [16,78]). New primers were designed forthe 16S gene: 12l-f (AGAGGAGAYAAGTCGTAM-CAAG), 16u-f (AGCCAYCAATTRAGAAAGC), 16q-r(GTTTGCCGAGTTCCTTTTAC), and 16k-r (ATAGA-TAGAAACCGACCTGGA); and the BRCA1 gene:BRCA1-f2 (AACAGATGGGTTGAAACTAAGG),BRCA1-f3 (AGGYGATTATGTTCAGAAGAAG),BRCA1-r2 (GAAGGCTAGGATTGACAAACTC), andBRCA1-r4 (ATTTAATTCTAGTTCCAYATTGC).Additional sequencing primers were also used for vWF ,RAG1 [21] and 12S/valine-tRNA [27]. All sequenceswere obtained with an automated ABI 3730XL sequen-cer. Sequence editing and prealignment were done withthe Sequencher 4.2 software (Gene Codes). Genbankaccession numbers and voucher information for taxaincluded in this study are provided in the in the Addi-tional file 8.
Sequence statisticsAlignments were done using the program MAFFT [79]using the default costs for gaps (gap opening penalty =1.53; gap extension penalty = 0.123). Among the proteincoding genes, only BRCA1 had indels, all of which werein frame. Gap positioning was adjusted to match aminoacid codon positions with MacClade 4.08 [80]. The frag-ment containing 12S-valine-tRNA/16S also containedseveral indels. This last fragment was treated as a singlepartition in our dataset, which totaled six gene parti-tions: RAG1, RAG2, vWF, BRCA1, Cytb, and 12S/val-tRNA/16S (hereafter “12S16S”). Conflicting phylogeneticsignal among partitions was checked using the incon-gruence-length difference test (ILD) [81] as implemen-ted in PAUP* 4.10 b [82], running 500 searches withrandom stepwise addition and 10 replicates per search.The ILD test has been criticized for being sensitive toboth type I and type II errors [83,84]. As an alternativetest for incongruence, we used the script concartepillar.py which employs a hierarchical clustering method andlikelihood-ratio tests to identify pairs of loci that haveincongruent phylogenetic signal [55]. In these tests weexcluded taxa for which one or more loci were notavailable, so that each alignment had the same set oftaxa.Substitution saturation in the combined dataset was
checked by plotting number of transition and transver-sions as a function of GTR distances. Additionally, weused a saturation test [53] implemented in the programDAMBE [85]. Base composition bias among taxa wasanalyzed for each locus including all codon positionsand for each codon position separately using the c2 test
Almeida et al. BMC Evolutionary Biology 2011, 11:281http://www.biomedcentral.com/1471-2148/11/281
Page 13 of 17

implemented in PAUP* 4.10 b [82]. Pairwise relative ratetests were done using HyPhy [86]. In all multiple tests,significance was corrected for multiple testing using thesequential Bonferroni criterion.
Phylogenetic analysesPhylogenetic inferences were done using maximum par-simony (MP) and maximum likelihood (ML). The MPsearches were run on PAUP* 4.10 b [82], with 1000 ran-dom sequence additions followed by tree bisectionreconnection branch swapping (TBR). Gaps were treatedas missing data. Statistical support for clades wereobtained with non-parametric bootstrap using PAUP*4.10 b and Bremer decay values using TreeRot v.3 [87].ML analyses were carried out with the program Tree-
Finder [88]. For the combined dataset 1, we first triedseveral partitioning schemes and compared their out-comes to determine the optimal scheme. Seven differentpartition schemes based on gene and codon positionwere tested, from one that separates all genes andcodon positions, totaling 16 partitions, to non-partition-ing of the data (analyzing it as one single partition). Inthese analyses, the GTR model was generally applied,with partition-wide estimates of the rate parameters bymaximum likelihood optimization and empirical nucleo-tide frequency parameters. The performances of the dif-ferent partition schemes were evaluated by comparingthe likelihood, AIC (Akaike Information Criterion)[89,90], and BIC (Bayesian Information Criterion) [91]values of the resulting trees. AICc was used instead ofAIC in cases where the ratio of the number of para-meters to the number of bases was equal or less than40. AIC and BIC correct the likelihood of a model forthe number of the parameters, penalizing overparame-terization [92]. The partition schemes with better scores(lower AIC and BIC values) were then used in ML ana-lysis with optimal substitution models for each partition.Selection of partition-wide substitution models wasdone in Treefinder, using AIC. Statistical support ofbranches was obtained with 500 replicas of partition-wise bootstrap.Alternative topologies were compared in a ML frame-
work using the Shimodaira-Hasegawa (SH) [93] and theApproximately Unbiased (AU) [94] tests as implementedin TreeFinder. In the MP framework, we used the pro-gram PAUP* to run the Kishino-Hasegawa (KH) andthe Templeton non-parametric tests [95,96].
Zero-branch length simulationsTo test whether basal, non-supported branches hadlengths significantly different from zero in the individualgene and combined dataset trees, we compared the besttree found for that dataset with trees identical to thebest tree but with unsupported branches collapsed. For
that we employed the SH and the AU tests using Tree-Finder. To access whether multiple nodes were involvedin a polytomy at the base of the Pteropodidae tree, weused a similar approach to that proposed by Poe andChubb [34]. Briefly, for each best ML gene tree, basalbranches were collapsed one by one simultaneously (upto 6), and the likelihood of these collapsed trees werecompared with the likelihood of the best tree. Becausetypical likelihood comparison tests should not beemployed when multiple branches are collapsed at thesame time [97], we created null distributions for the teststatistic (the difference in likelihood between the bestand the collapsed tree) using simulated datasets as inthe SOWH test [98]. Sequences were simulated basedon trees with collapsed branches using the same evolu-tionary model and substitution parameters obtained forthe original dataset with the program evolver of PAMLv.4.4 [99,100]. For each of the 100 simulated matrices,we obtained the best tree over 10 independent runsusing RAxML v7.2.6 [101] and calculated the differencein likelihood of this tree to that of the collapsed tree(used to simulate the sequences) using baseml (PAMLv4.4). In this way we obtained a null distribution of 100likelihood differences between best and collapsed tree(the null hypothesis tree). In the analyses involvingsimulations, only ingroup species for which all geneswere sequenced (44 species) were kept in the matrixand the GTR+Γ model was generally employed. Theseanalyses were not done for RAG2, due the low resolu-tion of its gene tree (Additional file 3, Figure S4), andCytb, because of the large difference in substitutionrates between the 3rd codon position and the other posi-tions (Additional file 6).
Biogeographic analysisThe biogeographic history of the major pteropodidclades was analyzed using DIVA (Dispersal-VicarianceAnalysis) [56,102]. Geographic distribution of the ptero-podid genera were obtained in Simmons [1] and doublechecked with updated information from the http://gis.miiz.waw.pl/webapps/thebats/iucn/ website. All speciesof the same genera were assigned the same distributionarea, except for Roussetus. To remark that the mostbasal Rousettus in our tree (R. amplexicaudatus) inha-bits the Asian continent, we assigned only its own areato this species, while to the other two Rousettus species(R. leschenaultii and R. madagascariensis) we assignedall areas occupied by species of this genus. The areaunits and the geographic distributions of genera used inthe DIVA are listed in the Additional file 9 (Tables S5and S6). DIVA was based on the ML tree obtained fordataset 2 (all available pteropodid taxa), using alterna-tively maxarea=2 or 3. Results obtained with maxarea =3 option in general contained all the areas obtained with
Almeida et al. BMC Evolutionary Biology 2011, 11:281http://www.biomedcentral.com/1471-2148/11/281
Page 14 of 17

maxarea = 2 plus 3-area combinations of those areas.Hence, we show here only the results obtained withmaxarea = 2.
Additional material
Additional file 1: Saturation plot of the combined dataset 1. FigureS1 represents a saturation plot of the combined dataset 1 (with theexclusion of taxa missing one or more loci) based on GTR distances.
Additional file 2: GC content. Table S1 shows GC content statistics pergene and codon position, across all taxa and within main pteropodidclades.
Additional file 3: ML gene trees. The file contains Figures S2 throughS7 illustrating gene trees obtained by maximum likelihood with eachindividual gene partition analyzed here: RAG1, RAG2, vWF, BRCA1, 12S16Sand Cytb.
Additional file 4: Trees obtained with the exclusion of 3rd codonpositions of Cytbrd. Figure S8 illustrates the MP tree with Bremer decayvalues and Figure S9 illustrates the ML bootstrap tree.
Additional file 5: ML topologies obtained with different datapartition schemes. Figure S9 illustrating resumed ML trees obtainedwith dataset 1 under alternative partition schemes as described in Table4 (main text).
Additional file 6: Substitution models and parameters. Table S2listing optimal substitution models and parameters for each partitionunder scheme 6.
Additional file 7: P values of tests for zero-length branches. Table S3showing P values of the SH and the AU tests for zero-length branchesbased on the combined dataset 1 for each main pteropodid nodelabeled on Figure 2 (main text).
Additional file 8: Sequences used in this study. List of samples withGenbank accession numbers of sequences used in this study (Table S4).
Additional file 9: Areas and generic distributions used in thebiogeography analysis. Table S5 lists area units and Table S6 thegeneric distribution in those areas as used in the biogeography analysis.
AcknowledgementsWe are in debt with all the people and Institutions that provided us accessto tissue samples for this study: Lawrence Heaney (Field Museum of NaturalHistory, Chicago), Jim Patton and Carla Cicero (Museum of VertebrateZoology, Berkeley), John Wible and Suzanne McLaren (Carnegie Museum,Pittsburgh), Burton Lim and Judith Eger (Royal Ontario Museum, Toronto),Denis O’Meally (Australian Museum, Sydney), Linda Gordon, Jeremy Jacobs,Louise Emmons, and James Mead (National Museum of Natural History,Smithsonian Institution, Washington, D. C.), and Paul Bates and MalcolmPearch (The Harrison Institute, Sevenoaks). Thanks to Kara M. Kaminski andSimone Loss for their help in generating the DNA sequences. Liliana Dávalosand Gabriela Aguileta provided comments and suggestions on an earlierversion of the manuscript. Funding for this study was provided by theNational Science Foundation (research awards DEB-9873663 and EF-0629811to N. B. S.), a Vernay postdoctoral fellowship at the AMNH to F. C. A.. N. P. G.acknowledges support from Consejo Nacional de Investigaciones Científicasy Tecnológicas (CONICET), Argentina.
Author details1American Museum of Natural History, Division of Vertebrate Zoology,Department of Mammalogy, Central Park West at 79th Street, New York, NY10024, USA. 2American Museum of Natural History, Sackler Institute forComparative Genomics, Central Park West at 79th Street, New York, NY10024, USA. 3Universitat de Barcelona, Departament de Genètica, Diagonal645, Barcelona, 08028, Spain. 4CONICET, Programa de Investigaciones deBiodiversidad Argentina, Universidad Nacional de Tucumán, Facultad deCiencias Naturales e Instituto Miguel Lillo, Miguel Lillo 205, Tucumán, CP4000, Argentina.
Authors’ contributionsFCA did the laboratory work, analyzed the data, and drafted the paper. NPGand NBS obtained necessary tissue samples from institutions and individuals.All authors participated in the design of the study, contributed to thewriting of the paper, and approved its final version.
Received: 19 May 2011 Accepted: 30 September 2011Published: 30 September 2011
References1. Simmons NB: Order Chiroptera. In Mammal species of the world: a
taxonomic and geographic reference. Edited by: Wilson DE, Reeder DM.Baltimore, MD: Johns Hopkins University Press; 2005:312-529.
2. Nowak RM: Walker’s bats of the World. Baltimore and London: The JohnsHopkins University Press; 1994.
3. Mickleburgh SP, Hutson AM, Racey PA: Old World fruit bats: an actionplan for their conservation. Gland, Switzerland: IUCN; 1992.
4. Simmons NB: Bat relationships and the origin of flight. Symposium of theZoological Society of London 1995, 67:27-43.
5. Thewissen JG, Babcock SK: Distinctive cranial and cervical innervation ofwing muscles: new evidence for bat monophyly. Science 1991,251(4996):934-936.
6. Ammerman LK, Hillis DM: A molecular test of bat relationships:monophyly or diphyly? Syst Biol 1992, 41(2):222-232.
7. Stanhope MJ, Czelusniak J, Si JS, Nickerson J, Goodman M: A molecularperspective on mammalian evolution from the gene encodinginterphotoreceptor retinoid binding protein, with convincing evidencefor bat monophyly. Mol Phylogenet Evol 1992, 1(2):148-160.
8. Kirsch JAW, Flannery TF, Springer MS, Lapointe F-J: Phylogeny of thePteropodidae (Mammalia: Chiroptera) based on DNA hybridisation, withevidence for bat monophyly. Aust J Zool 1995, 43(4):395-428.
9. Teeling EC, Scally M, Kao DJ, Romagnoli ML, Springer MS, Stanhope MJ:Molecular evidence regarding the origin of echolocation and flight inbats. Nature 2000, 403(6766):188-192.
10. Teeling EC, Springer MS, Madsen O, Bates P, O’Brien SJ, Murphy WJ: Amolecular phylogeny for bats illuminates biogeography and the fossilrecord. Science 2005, 307(5709):580-584.
11. Springer MS, Teeling EC, Madsen O, Stanhope MJ, de Jong WW: Integratedfossil and molecular data reconstruct bat echolocation. Proc Natl Acad SciUSA 2001, 98(11):6241-6246.
12. Andersen K: Catalogue of the Chiroptera in the collection of the BritishMuseum. Catalogue of the Chiroptera in the collection of the British Museum2nd ed 1 , 2 1912, (ci +854).
13. Hollar LJ, Springer MS: Old World fruitbat phylogeny: evidence forconvergent evolution and an endemic African clade. Proc Natl Acad SciUSA 1997, 94(11):5716-5721.
14. Bergmans W: Taxonomy and biogeography of African fruit bats(Mammalia, Megachiroptera). 5. The genera Lissonycteris Andersen, 1912,Myonycteris Matschie, 1899 and Megaloglossus Pagenstecher, 1885;general remarks and conclusions; annex: key to all species. Beaufortia1997, 47(2):11-90.
15. Juste J, Alvarez Y, Tabares E, Garrido-Pertierra A, Ibanez C, Bautista JM:Phylogeography of African fruitbats (Megachiroptera). Mol PhylogenetEvol 1999, 13(3):596-604.
16. Romagnoli ML, Springer MS: Evolutionary relationships among Old Worldfruitbats (Megachiroptera: Pteropodidae) based on 12S rRNA, tRNAvaline, and 16S rRNA gene sequences. J Mamm Evol 2000, 7(4):259-284.
17. Colgan DJ, da Costa P: Megachiropteran evolution studied with 12SrDNA and c-mos DNA sequences. J Mamm Evol 2002, 9(1-2):3-22.
18. Giannini NP, Simmons NB: A phylogeny of megachiropteran bats(Mammalia: Chiroptera: Pteropodidae) based on direct optimizationanalysis of one nuclear and four mitochondrial genes. Cladistics 2003,19(6):496-511.
19. Giannini NP, Simmons NB: Conflict and congruence in a combined DNA-morphology analysis of megachiropteran bat relationships (Mammalia:Chiroptera: Pteropodidae). Cladistics 2005, 21(5):411-437.
20. Giannini NP, Cunha Almeida F, Simmons NB, DeSalle R: Phylogeneticrelationships of the enigmatic harpy fruit bat, Harpyionycteris(Mammalia: Chiroptera: Pteropodidae). American Museum Novitates 2006,3533:1-12.
Almeida et al. BMC Evolutionary Biology 2011, 11:281http://www.biomedcentral.com/1471-2148/11/281
Page 15 of 17

21. Giannini NP, Almeida FC, Simmons NB: Phylogenetic relationships ofhapyionycterine bats. In Systematic Mammalogy: contributions in honor ofGuy G Musser. Volume 331. Edited by: Voss R, Carleton M. New York: Bulletinof the American Museum of Natural History; 2009:83-201.
22. Delsuc F, Brinkmann H, Philippe H: Phylogenomics and the reconstructionof the tree of life. Nat Rev Genet 2005, 6(5):361-375.
23. Hillis DM: Inferring complex phylogenies. Nature 1996, 383(6596):130-131.24. Hillis DM, Pollock DD, McGuire JA, Zwickl DJ: Is sparse taxon sampling a
problem for phylogenetic inference? Syst Biol 2003, 52(1):124-126.25. Delsuc F, Scally M, Madsen O, Stanhope MJ, de Jong WW, Catzeflis FM,
Springer MS, Douzery EJ: Molecular phylogeny of living xenarthrans andthe impact of character and taxon sampling on the placental treerooting. Mol Biol Evol 2002, 19(10):1656-1671.
26. Davalos LM, Perkins SL: Saturation and base composition bias explainphylogenomic conflict in Plasmodium. Genomics 2008, 91(5):433-442.
27. Almeida FC, Giannini NP, DeSalle R, Simmons NB: The phylogeneticrelationships of cynopterine fruit bats (Chiroptera: Pteropodidae:Cynopterinae). Mol Phylogenet Evol 2009, 53(3):772-783.
28. Aguinaldo AM, Turbeville JM, Linford LS, Rivera MC, Garey JR, Raff RA,Lake JA: Evidence for a clade of nematodes, arthropods and othermoulting animals. Nature 1997, 387(6632):489-493.
29. Gruber KF, Voss RS, Jansa SA: Base-compositional heterogeneity in theRAG1 locus among didelphid marsupials: implications for phylogeneticinference and the evolution of GC content. Syst Biol 2007, 56(1):83-96.
30. Steel MA, Lockhart PJ, Penny D: Confidence in evolutionary trees frombiological sequence data. Nature 1993, 364(6436):440-442.
31. Felsenstein J: Inferring phylogenies. Sunderland, Massachusetts: Sinauer;2004.
32. Nikolaev S, Montoya-Burgos JI, Margulies EH, Rougemont J, Nyffeler B,Antonarakis SE: Early history of mammals is elucidated with the ENCODEmultiple species sequencing data. PLoS Genet 2007, 3(1):e2.
33. Hallstrom BM, Janke A: Resolution among major placental mammalinterordinal relationships with genome data imply that speciationinfluenced their earliest radiations. BMC Evol Biol 2008, 8:162.
34. Poe S, Chubb AL: Birds in a bush: five genes indicate explosive evolutionof avian orders. Evolution 2004, 58(2):404-415.
35. Hackett SJ, Kimball RT, Reddy S, Bowie RC, Braun EL, Braun MJ,Chojnowski JL, Cox WA, Han KL, Harshman J, et al: A phylogenomic studyof birds reveals their evolutionary history. Science 2008,320(5884):1763-1768.
36. Pamilo P, Nei M: Relationships between gene trees and species trees. MolBiol Evol 1988, 5(5):568-583.
37. Leite YL, Patton JL: Evolution of South American spiny rats (Rodentia,Echimyidae): the star-phylogeny hypothesis revisited. Mol Phylogenet Evol2002, 25(3):455-464.
38. Arndt PF: Reconstruction of ancestral nucleotide sequences andestimation of substitution frequencies in a star phylogeny. Gene 2007,390(1-2):75-83.
39. Pollock DD, Zwickl DJ, McGuire JA, Hillis DM: Increased taxon sampling isadvantageous for phylogenetic inference. Syst Biol 2002, 51(4):664-671.
40. Zwickl DJ, Hillis DM: Increased taxon sampling greatly reducesphylogenetic error. Syst Biol 2002, 51(4):588-598.
41. Baurain D, Brinkmann H, Philippe H: Lack of resolution in the animalphylogeny: closely spaced cladogeneses or undetected systematicerrors? Mol Biol Evol 2007, 24(1):6-9.
42. Kluge AG: A concern for evidence and a phylogenetic hypothesis ofrelationships among Epicrates (Boidae, Serpentes). Syst Biol 1989, 38:7-25.
43. Nixon KC, Carpenter JM: On simultaneous analysis. Cladistics 1996,12:221-241.
44. Rokas A, Williams BL, King N, Carroll SB: Genome-scale approaches toresolving incongruence in molecular phylogenies. Nature 2003,425(6960):798-804.
45. Driskell AC, Ane C, Burleigh JG, McMahon MM, O’Meara BC, Sanderson MJ:Prospects for building the tree of life from large sequence databases.Science 2004, 306(5699):1172-1174.
46. DeSalle R: Animal phylogenomics: multiple interspecific genomecomparisons. Methods Enzymol 2005, 395:104-133.
47. de la Torre J, Egan M, Katari M, Brenner E, Stevenson D, Coruzzi G,DeSalle R: ESTimating plant phylogeny: lessons from partitioning. BMCEvol Biol 2006, 6(1):48.
48. Lee MS, Camens AB: Strong morphological support for the molecularevolutionary tree of placental mammals. J Evol Biol 2009,22(11):2243-2257.
49. Cummings MP, Meyer A: Magic bullets and golden rules: data samplingin molecular phylogenetics. Zoology (Jena) 2005, 108(4):329-336.
50. Sullivan J: Combining Data with Different Distributions of Among-SiteRate Variation. Syst Biol 1996, 45(3):375-380.
51. Brown JM, Lemmon AR: The importance of data partitioning and theutility of Bayes factors in Bayesian phylogenetics. Syst Biol 2007,56(4):643-655.
52. Lemmon AR, Brown JM, Stanger-Hall K, Lemmon EM: The effect ofambiguous data on phylogenetic estimates obtained by MaximumLikelihood and Bayesian Inference. Syst Biol 2009, 58(1):130-145.
53. Xia X, Xie Z, Salemi M, Chen L, Wang Y: An index of substitutionsaturation and its application. Mol Phylogenet Evol 2003, 26(1-7).
54. Jeffroy O, Brinkmann H, Delsuc F, Philippe H: Phylogenomics: thebeginning of incongruence? Trends Genet 2006, 22(4):225-231.
55. Leigh JW, Susko E, Baumgartner M, Roger AJ: Testing congruence inphylogenomic analysis. Syst Biol 2008, 57(1):104-115.
56. Ronquist F: Dispersal-vicariance analysis: a new approach to thequantification of historical biogeography. Syst Biol 1997, 46(1):195-203.
57. Teeling EC, Madsen O, Van den Bussche RA, de Jong WW, Stanhope MJ,Springer MS: Microbat paraphyly and the convergent evolution of a keyinnovation in Old World rhinolophoid microbats. Proc Natl Acad Sci USA2002, 99(3):1431-1436.
58. Whitfield JB, Lockhart PJ: Deciphering ancient rapid radiations. Trends EcolEvol 2007, 22(5):258-265.
59. Kolaczkowski B, Thornton JW: Performance of maximum parsimony andlikelihood phylogenetics when evolution is heterogeneous. Nature 2004,431(7011):980-984.
60. Rokas A, Kruger D, Carroll SB: Animal evolution and the molecularsignature of radiations compressed in time. Science 2005,310(5756):1933-1938.
61. Takezaki N, Figueroa F, Zaleska-Rutczynska Z, Takahata N, Klein J: Thephylogenetic relationship of tetrapod, coelacanth, and lungfish revealedby the sequences of forty-four nuclear genes. Mol Biol Evol 2004,21(8):1512-1524.
62. Miller-Butterworth CM, Murphy WJ, O’Brien SJ, Jacobs DS, Springer MS,Teeling EC: A family matter: conclusive resolution of the taxonomicposition of the long-fingered bats, Miniopterus. Molecular Biology Evolution2007, 24(7):1553-1561.
63. Gavrilets S, Losos JB: Adaptive radiation: contrasting theory with data.Science 2009, 323(5915):732-737.
64. Lack JB, Roehrs ZP, Stanley CE, Ruedi M, Van den Bussche RA: Molecularphylognetics of Myotis indicate familial-level divergence for the genusCistugo (Chiroptera). J Mammal 2010, 91(4):976-992.
65. Givnish T: Adaptive radiation and molecular systematics: issues andapproaches. In Molecular evolution and adaptive radiation. Edited by:Givnish T, Sytsma K. Cambrige, UK: Cambridge University Press; 1997:1-54.
66. Yoder J, Clancey E, Roches SD, Eastman J, Gentry L, Godsoe W, Hagey T,Jochimsen D, Oswald B, Robertson J, et al: Ecological opportunity and theorigin of adaptive radiations. J Evol Biol 2010, 23(8):1581-1596.
67. Pettigrew JD, Jamieson BGM, Robson SK, Hall LS, McAnally KI, Cooper HM:Phylogenetic relations between microbats, megabats and primates(Mammalia: Chiroptera and Primates). Philos Trans R Soc Lond, Ser B: BiolSci 1989, 325(1229):489-559.
68. Hutcheon JM, Garland T: Are Megabats Big? J Mamm Evol 2004,11(3):257-277.
69. Platnick N, Griswold C, Coddington J: On missing entries in cladisticanalysis. Cladistics 1991, 7(4):337-343.
70. Wiens JJ: Missing data, incomplete taxa, and phylogenetic accuracy. SystBiol 2003, 52(4):528-538.
71. Wiens JJ: Incomplete taxa, incomplete characters, and phylogeneticaccuracy: is there a missing data problem? J Vert Paleontol 2003,22(2):297-310.
72. Wiens JJ: Missing data and the design of phylogenetic analyses. J BiomedInf 2006, 39(1):34-42.
73. Giannini NP, Almeida FC, Simmons NB, Helgen KM: The systematicposition of Pteropus leucopterus and its bearing on the monophyly andrelationships of Pteropus (Chiroptera: Pteropodidae). ActaChiropterologica 2008, 10(1):11-20.
Almeida et al. BMC Evolutionary Biology 2011, 11:281http://www.biomedcentral.com/1471-2148/11/281
Page 16 of 17

74. Helgen KM: Systematics of the Pacific monkey-faced bats (Chiroptera:Pteropodidea), with a new species of Pteralopex and a new Fijian genus.Syst Biodivers 2010, 3(4):433-453.
75. Datzmann T, von Helversen O, Mayer F: Evolution of nectarivory inphyllostomid bats (Phyllostomidae Gray, 1825, Chiroptera: Mammalia).BMC Evol Biol 2010, 10:165.
76. Porter CA, Goodman M, Stanhope MJ: Evidence on mammalianphylogeny from sequences of exon 28 of the von Willebrand Factorgene. Mol Phylogenet Evol 1996, 5(1):89-101.
77. Bastian ST Jr, Tanaka K, Anunciado RVP, Natural NG, Sumalde AC,Namikawa T: Evolutionary relationships of flying foxes (genus Pteropus)in the Philippines inferred from DNA sequences of cytochrome b gene.Biochem Genet 2002, 40(3-4):101-116.
78. Springer MS, Hollar LJ, Kirsch JAW: Phylogeny, molecules versusmorphology, and rates of character evolution among fruitbats(Chiroptera: Megachiroptera). Aust J Zool 1995, 43(6):557-582.
79. Katoh K, Misawa K, Toh H, Miyata T: MAFFT version 5: improvement inaccuracy of multiple sequence alignment. Nucleic Acids Res 2005,33:511-518.
80. Maddison D, Maddison W: MacClade 4: Analysis of phylogeny andcharacter evolution. Sunderland, Massachusetts: Sinauer Associates;, 4.02000.
81. Farris JS, Kallersjo M, Kluge AG, Bult C: Permutations. Cladistics 1994,10(1):65-76.
82. Swofford DL: PAUP*: Phylogenetic Analysis Using Parsimony (* and othermethods). Version 4. Sinauer Associates, Sunderland, Massachusetts.2002.
83. Barker FK, Lutzoni FM: The utility of the incongruence length differencetest. Syst Biol 2002, 51(4):625-637.
84. Darlu P, Lecointre G: When does the Incongruence Length Difference testfail? Mol Biol Evol 2002, 19(4):432-437.
85. Xia X, Lemey P: Assesing substitution saturation with DAMBE. In ThePhylogenetic Handbook. Edited by: Lemey P. Cambridge, UK: CambridgeUniversity Press; 2009:611-626.
86. Pond S, Muse S: HyPhy: Hypothesis Testing Using Phylogenies. StatisticalMethods in Molecular Evolution 2005, 125-181.
87. Sorenson MD, Franzosa EA: TreeRot, version 3. Boston, MA: BostonUniversity; 2007.
88. Jobb G, von Haeseler A, Strimmer K: TREEFINDER: A powerful graphicalanalysis environment for molecular phylogenetics. BMC Evol Biol 2004,4:18.
89. Akaike H: Information theory and an extension of the maximumlikelihood principle. In Second International Symposium on InformationTheory. Edited by: Petrov PN, Csaki F. Budapest: Akad. Kiado; 1973:267-281.
90. Posada D, Crandall KA: MODELTEST: testing the model of DNAsubstitution. Bioinformatics 1998, 14(9):817-818.
91. Schwarz G: Estimating the dimensions of a model. Annals of Statistics1978, 6(2):461-464.
92. Sullivan J, Joyce P: Model selection in phylogenetics. Annu Rev Ecol EvolSyst 2005, 36(1):445-466.
93. Shimodaira H, Hasegawa M: Multiple comparisons of log-likelihoods withapplications to phylogenetic inference. Mol Biol Evol 1999,16(8):1114-1116.
94. Shimodaira H: An approximately unbiased test of phylogenetic treeselection. Syst Biol 2002, 51(3):492-508.
95. Kishino H, Hasegawa M: Evaluation of the maximum likelihood estimateof the evolutionary tree topologies from DNA sequence data, and thebranching order in hominoidea. J Mol Evol 1989, 29(2):170-179.
96. Templeton A: Phylogenetic inference from restriction endonucleasecleavage site maps with particular reference to the evolution of humansand the apes. Evolution 1983, 37(2):221-244.
97. Goldman N, Whelan S: Statistical tests of gamma-distributed rateheterogeneity in models of sequence evolution in phylogenetics. MolBiol Evol 2000, 17:975-978.
98. Goldman N, Anderson JP, Rodrigo AG: Likelihood-based tests oftopologies in phylogenetics. Syst Biol 2000, 49:652-670.
99. Yang Z: PAML: a program package for phylogenetic analysis bymaximum likelihood. Computer Applications in BioSciences 1997,13(5):555-556.
100. Yang Z: PAML 4: phylogenetic analysis by maximum likelihood. Mol BiolEvol 2007, 24(8):1586-1591.
101. Stamatakis A: RAxML-VI-HPC: maximum likelihood-based phylogeneticanalyses with thousands of taxa and mixed models. Bioinformatics 2006,22(21):2688-2690.
102. Ronquist F: DIVA, ver1.1. Computer program avaialble by anonymousFTP from Uppsala University. Uppsala: Uppsala University; 1996.
doi:10.1186/1471-2148-11-281Cite this article as: Almeida et al.: Evolutionary relationships of the oldworld fruit bats (Chiroptera, Pteropodidae): Another star phylogeny?BMC Evolutionary Biology 2011 11:281.
Submit your next manuscript to BioMed Centraland take full advantage of:
• Convenient online submission
• Thorough peer review
• No space constraints or color figure charges
• Immediate publication on acceptance
• Inclusion in PubMed, CAS, Scopus and Google Scholar
• Research which is freely available for redistribution
Submit your manuscript at www.biomedcentral.com/submit
Almeida et al. BMC Evolutionary Biology 2011, 11:281http://www.biomedcentral.com/1471-2148/11/281
Page 17 of 17