evolutionary characteristics of total solar irradiance
TRANSCRIPT
ELSEVIER Chinese Astronomy and Astrophysics 38 (2014) 75–84
CHINESEASTRONOMYAND ASTROPHYSICS
Evolutionary Characteristics of Total SolarIrradiance † �
XIANG Nan-bin1,2�1Purple Mountain Observatory, Chinese Academy of Sciences, Nanjing 210008
2University of Chinese Academy of Sciences, Beijing 100049
Abstract The significant periods of total solar irradiance are 35 d and 26din the 23rd and 24th solar activity cycles, respectively. It is inferred that thesolar quasi-rotation periods are also 35 d and 26 d in the 23rd and 24th solaractivity cycles, respectively. The value of total solar irradiance around the 24thsolar activity minimum may be close to the value of Maunder minimum. On thetimescales from one solar rotation period to several months, sunspots are themain reason to cause the variation of total solar irradiance, but not the uniqueone, and the variation of total solar irradiance are not correlated with the Mg IIindex on the timescales from a few days to one solar rotation period.
Key words: sun: activity—sun: sunspots
1. INTRODUCTION
Total solar irradiance (TSI) indicates the total energy of solar radiation in the whole elec-tromagnetic wave spectrum that arrived at the unit area on the top of earth atmosphere atthe mean solar-terrestrial distance in unit time. TSI influences on the total energy enteringinto the earth system, and this total energy drives almost all the known natural laws inthe interior of the earth system, as well as the circulation in the terrestrial biosphere[1].Before the Hickey-Frieden cavity radiometer (HF) made the observation of TSI in Octo-ber 1978, because of the low precision of the ground-based observational equipment, peopleconsidered the TSI as a constant and called it the “solar constant”. Since the launch of
† Supported by National Natural Science FoundationReceived 2012–11–12; revised version 2012–12–05
� A translation of Acta Astron. Sin. Vol. 54, No. 3, pp. 219–228, 2013� [email protected]
0275-1062/01/$-see front matter c© 2013 Elsevier Science B. V. All rights reserved.PII:
0275-1062/14/$-see front matter © 2014 Elsevier B.V. All rights reserved.doi:10.1016/j.chinastron.2014.01.007
76 Xiang Nan-bin / Chinese Astronomy and Astrophysics 38 (2014) 75–84
HF , TSI has been continueously measured by several radiometers successively (generally,measured by 2∼4 radiometers outside the earth atmosphere simultaneously). Owing to thehigh precision of these space radiometers, people understood that TSI is variable on thedifferent timescales from several minutes to several ten years[2−5]. TSI yields the radiationenvironment of the earth, and influences on the earth temperature and atmosphere, even asmall durative variation of TSI will make a deep influence on the earth’s climate[1]. Hence,to make clear how the variation of TSI affects the earth’s climate is very important, andsofar there have been many discussions in this aspect[6−7]. The space measurement of TSIwas started late in 1978, only the observed data as short as 34 yr have been accumulated,to rebuild the long-timescale TSI is very important and necessary, and to understand thephysical mechanism of the variation of TSI is fundamental for rebuilding the long-timescaleTSI.
On the timescales from several minutes to several hours, the variations of TSI are causedby convection or convection-related granulation, mesogranulation, and supergranulation[8];on the timescales from several days to several weeks, the magnetic structure on the solarsurface is the main reason to cause the variations of TSI[8−9]; on the timescale of onesolar activity cycle, the variations of TSI are caused by the joint effect of the blockage ofsunspots and the brightening of faculae, plages, and netted structures[10−12]. Recently, Li etal.[5] suggested that TSI can be divided into three components. The first component is therotation signal, it occupies 42.31% of the total variation of TSI, and it is inferred to be causedby large magnetic structures (including sunspot groups); the second is the signal of annualvariation, it occupies 15.17% of the total variation of TSI, at present the reason for this kindof variation is not clear, probably caused by the revolution of the earth; the third componentis the variation signal between two solar cycles, it occupies 42.52% of the total variation ofTSI, and may be caused by the magnetic cells of the netted structures in the quiet region,in which the magnetic currents are in the scope of (4.27 ∼ 38.01) × 1018 Mx. Speakingfrom the other side, there are now a few models able to rebuild the long-timescale TSI,in which the most accurate one is the SATIRE-S model, it assumes that all the irradiancevariations longer than half a day are caused by the evolution of magnetic structures on thesolar surface[13−17], and this model divides the solar surface into four components: quiet-sunregion, sunspot umbras, sunspot penumbras, and faculae/netted structures[14−15]. Hence,according to the SATIRE-S model and current theories, the blockage of sunspots and thebrightening of faculae, plages, and netted structures are the main reason for the variationsof TSI, although not the total reason. It is difficult to measure the blockage of sunspots,and the brightening of faculae, plages, and netted structures directly. The best way isto select some replacements which are representative of the blockage of sunspots and thebrightening of faculae, plages, and netted structures, for example, using the spot number orspot area to represent the blockage of sunspots, using the Ca II or Mg II index to representthe brightening of faculae, plages, and netted structures[3,18−20]. Therefore, this study willfocuss on the evolutionary characteristics of TSI and the relations of TSI with the sunspotarea and Mg II characteristic index.
2. ANALYSIS OF EVOLUTIONARY CHARACTERISTICS OF TSI
The observations made by the Total Irradiance Monitor (TIM) on board of the Solar Radia-

Xiang Nan-bin / Chinese Astronomy and Astrophysics 38 (2014) 75–84 77
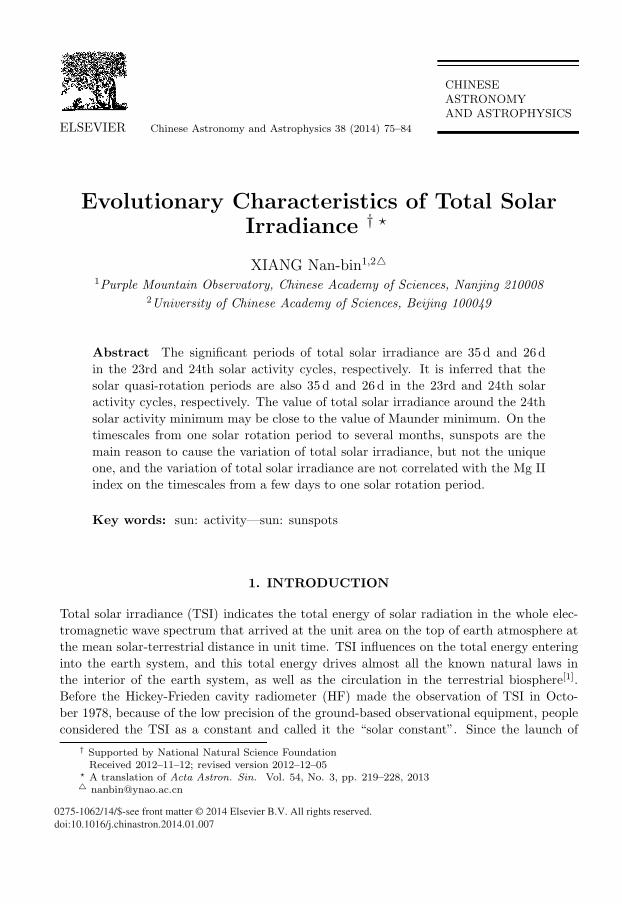
tion & Climate Experiment (SORCE) satellite of NASA of USA and a series new radiometersindicate that in the solar minimum year 2008, the most accurate value of TSI is (1360.8 ±0.5)W·m−2, it is 0.34% less than the traditional and classical value (1365.4 ± 1.3)W·m−2.In the radiometers of the last generation, the precise aperture for defining the measuredlight beam from the sun is positioned behind a rather large aperture with a limited fieldof view, the scattered light is the main reason to cause the higher traditional value ofTSI[4]. This paper adopts the precise data of TIM to study the evolutionary characteris-tics of TSI and the relations of TSI with the sunspot area and Mg II characteristic index,although similar studies have been made previously[5,21−23]. For example, using also theTSI data observed by the TIM, Gan et al.[22] made an in-depth study on the periodicity ofTSI, and obtained very meaningful conclusions. However, this study adopts not only theTSI data observed by the TIM in a longer period of time, but also a completely differentmethod of analysis. The TSI data observed by the TIM are downloaded from the websitehttp://lasp.colorado.edu/sorce/data/tsi.data.htm. Fig.1 shows the daily TSI data from 25thFeb. 2003 to 20th Apr. 2012.
2004 2006 2008 2010 20121357
1358
1359
1360
1361
1362
1363
Calendar Year
TSI
/(W
. m−
2 )
Fig. 1 Daily total solar irradiance from 25th Feb. 2003 to 20th Apr. 2012
From Fig.1 we can find that the observed data of TIM span the declining phase ofthe 23th solar cycle and the raising phase of the 24th solar cycle, and covers the especiallyspectacular “giant minimum” of the 24th cycle. On 29th Oct. 2003, the value of TSIsuddenly decreased, the proportion of decrease reaches 0.33% (much larger than the normalfluctuations of TSI), its reason is that an extremely large sunspot group appeared on thesolar disk[22].
2.1 Continuous Wavelet Analysis of TSIThe continuous wavelet transform extends a group of time series to the space of the
time and frequency domains, in which the periodicity of the time series can be displayedintuitively. When the wavelet analysis is used to extract the periods of time series, the
78 Xiang Nan-bin / Chinese Astronomy and Astrophysics 38 (2014) 75–84
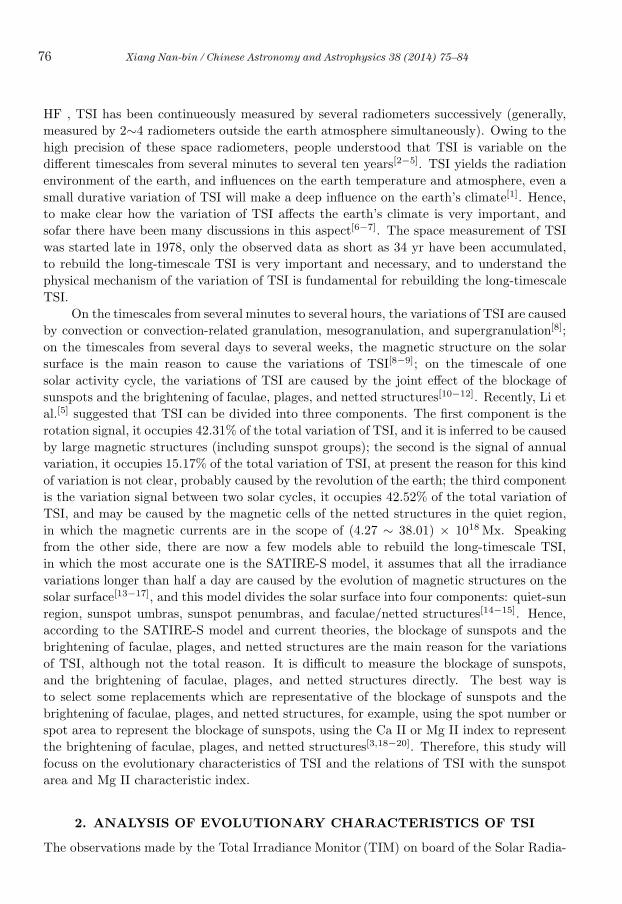
Morlet wavelet (with the dimensionless frequency ω0 = 6) is a good choice[23]. Hence, thispaper will make the periodicity analysis of TSI by means of continuous wavelet transform.The power spectrum of continuous wavelet transform of TSI is shown as Fig.2.
Calendar Year
Peri
od/d
2004 2006 2008 2010 2012
4
8
16
32
64
128
256
512
10241/64
1/32
1/16
1/8
1/4
1/2
1
2
4
8
16
32
64
Fig. 2 The continuous wavelet power spectrum of daily TSI from 25th Feb. 2003 to 20th Apr. 2012. The
black and thick solid contours indicate the 95% confidence level, and the black dashed line indicates the
cone of influence, where the edge effect may distort the picture. The vertical dot-dashed line shows the
time of sunspot minimum.
At the high-frequency band, the statistically significant periods of TSI are mainly con-centrated in 2003∼2006 and around 2012, the years of 2003∼2006 were at the decliningphase of the 23th solar activity cycle, and the year of 2012 was at the raising phase of the24th solar cycle, but these short periods differ in different solar cycles. As the observationaldata have only a short span of 9 yr, the power spectrum of TSI has not shown any prolongedperiodicity. In the duration from 2008 to 2010, TSI exhibited no periodicity, especially atthe end of 2008 (solar minimum year), its power was extremely low, indicating that in themean while TSI had almost no variations, and that the effects of solar activity (for example,the sunspots, bright structure modulations, etc.) were small, as same as that shown in Fig.1.Now many theoretical studies suggest: during the transition from the 23th solar cycle to the24th solar cycle, the number of sunspot-free days is the maximum of the past one hundredyears, and it is possible that the number of sunspot-free days in the 24th solar minimumyear is the maximum among the current sunspot cycles; the polar-region magnetic field atthe 24th solar minimum is minimal, since the observation has been made; at the 24th solarminimum, the 10 cm radio flux, total solar irradiance, solar wind velocity, solar wind pres-sure, photospheric open magnetic field are all the smallest since the observations have beenavailable. And it is predicted that the solar activity during the 24th solar minimum will bethe weakest since the observations have been made[24−27]. Therefore, combing Fig.1 withFig.2, we can infer that at the 24th solar minimum, the value of TSI may be close to thevalue of Maunder minimum.
Xiang Nan-bin / Chinese Astronomy and Astrophysics 38 (2014) 75–84 79
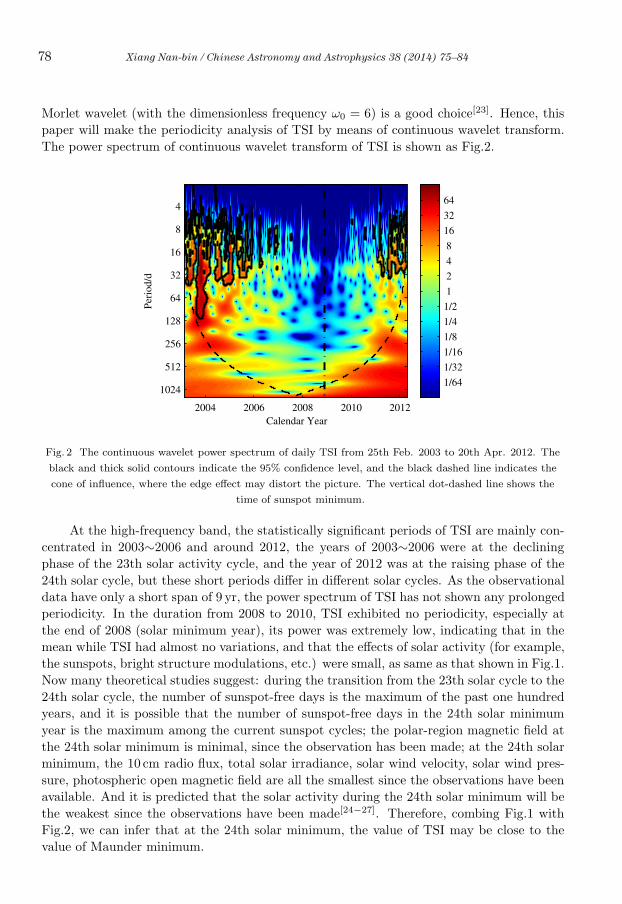
If the local “compositions” of the wavelet power spectrum are averaged on the wholetime axis, then the global power spectrum of the time series is obtained, as shown in Fig.3.The possible periods of TSI are 26 d, 35 d, 136 d, 276d, and 748 d, but only the periods of26 d and 35d are above the 95% confidence level, the other periods fail in the statistical tests.Because of the limited length of the time series of observed TSI data, prolonged periodicityhas not been exhibited.
The 26 d and 35 d periods of TSI (approximate to the solar rotation period) can beexplained as follows. According to the records of sunspot observations, in the solar activitymaximum year, there will exist a large number of long-life (longer than one solar rotationperiod) sunspots on the solar surface, these sunspots rotate together with the sun, and willexhibit the periodicity of the period equal to the solar rotation period. When these sunspotspass through the visible solar surface (facing the earth), due to the blockage of sunspots,TSI should decline or decrease abruptly; and when these sunspots rotate to the invisiblesolar surface (back to the earth), TSI should raise to its original value, thus because of theblockage of sunspots and the rotation of the sun, TSI will exhibit also the periodicity withthe period equal to the solar rotation period. Hence, the short periods of TSI can be usedas well to study the solar quasi-rotation periods.
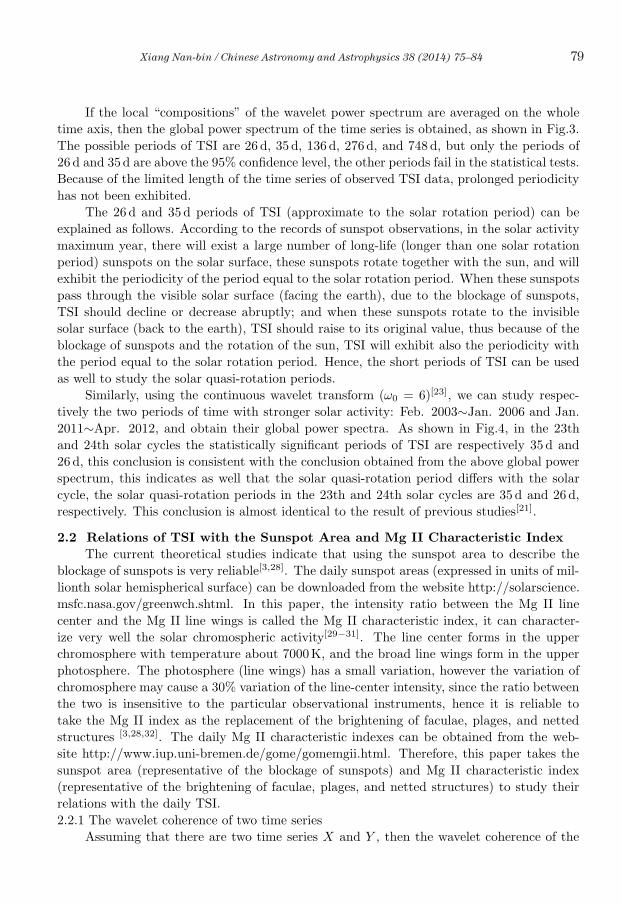
Similarly, using the continuous wavelet transform (ω0 = 6)[23], we can study respec-tively the two periods of time with stronger solar activity: Feb. 2003∼Jan. 2006 and Jan.2011∼Apr. 2012, and obtain their global power spectra. As shown in Fig.4, in the 23thand 24th solar cycles the statistically significant periods of TSI are respectively 35 d and26 d, this conclusion is consistent with the conclusion obtained from the above global powerspectrum, this indicates as well that the solar quasi-rotation period differs with the solarcycle, the solar quasi-rotation periods in the 23th and 24th solar cycles are 35 d and 26 d,respectively. This conclusion is almost identical to the result of previous studies[21].
2.2 Relations of TSI with the Sunspot Area and Mg II Characteristic IndexThe current theoretical studies indicate that using the sunspot area to describe the
blockage of sunspots is very reliable[3,28]. The daily sunspot areas (expressed in units of mil-lionth solar hemispherical surface) can be downloaded from the website http://solarscience.msfc.nasa.gov/greenwch.shtml. In this paper, the intensity ratio between the Mg II linecenter and the Mg II line wings is called the Mg II characteristic index, it can character-ize very well the solar chromospheric activity[29−31]. The line center forms in the upperchromosphere with temperature about 7000K, and the broad line wings form in the upperphotosphere. The photosphere (line wings) has a small variation, however the variation ofchromosphere may cause a 30% variation of the line-center intensity, since the ratio betweenthe two is insensitive to the particular observational instruments, hence it is reliable totake the Mg II index as the replacement of the brightening of faculae, plages, and nettedstructures [3,28,32]. The daily Mg II characteristic indexes can be obtained from the web-site http://www.iup.uni-bremen.de/gome/gomemgii.html. Therefore, this paper takes thesunspot area (representative of the blockage of sunspots) and Mg II characteristic index(representative of the brightening of faculae, plages, and netted structures) to study theirrelations with the daily TSI.2.2.1 The wavelet coherence of two time series
Assuming that there are two time series X and Y , then the wavelet coherence of the

80 Xiang Nan-bin / Chinese Astronomy and Astrophysics 38 (2014) 75–84
0 50 100−3
−2.5
−2
−1.5
−1
−0.5
0
0.5
1
1.5
Period/d
Log
arith
m o
f po
wer
200 4000
0.5
1
1.5
2
Period/d
Log
arith
m o
f po
wer
500 10000.5
1
1.5
2
2.5
Period/dL
ogar
ithm
of
pow
er
Fig. 3 The global power spectrum (solid line) of daily TSI. The dashed line indicates the 95% confidence
level. In order to show the power spectrum clearly, the global power spectrum is divided into three parts,
and displayed with a logarithmic scale.
0 50 100 150−3
−2.5
−2
−1.5
−1
−0.5
0
0.5
1
1.5
2
Period/d
Log
arith
m o
f po
wer
Fig. 4 The global power spectra of daily TSI around the times from Feb. 2003 to Jan. 2006 in Cycle
23 (thin solid line) and from Jan. 2011 to Apr. 2012 in Cycle 24 (thick solid line), respectively. The thin
dashed line and thick dashed line show their corresponding 95% confidence levels, respectively.
Xiang Nan-bin / Chinese Astronomy and Astrophysics 38 (2014) 75–84 81
two time series is defined as[23,33]
R2n(s) =
|S(s−1WXYn (s))|2
S(s−1|WXn (s)|2) · S(s−1|WY
n (s)|2) , (1)
in which W is the function for deriving the power of a time series by means of Morlet wavelet,S is a smoothing operator, the details of the theory can be found in References [23,24]. Thisdefinition resembles completely the traditional correlation coefficient, hence the waveletcoherence can be considered as the local correlation coefficient in the time-frequency space.The smoothing operator S can be written as
S(W ) = Sscale(Stime(Wn(s))) , (2)
here Sscale expresses the smoothing operation along the axis of wavelet scale, Stime expressesthe smoothing operation along the time axis. For the Morlet wavelet, the suitable smoothingoperator S can be written as the following expresions[23,33]:
Stime(W )|s = (Wn(s) × c−t2
2s21 )|s , (3)
Sscale(W )|n = (Wn(s) × c2
∏(0.6s))|n , (4)
in which, c1, c2 are the normalization constants,∏
is the rectangular function. For theMorlet wavelet, the factor 0.6 is determined empirically[23,33−34]. In practical calculations,the two convolutions are computed separately, so the normalization coefficients are determi-nate in values. Besides, the Monte-Carlo method is used for the statistical significance testof wavelet coherence[23,33].
From the calculating process of Wavelet coherence, we can find that even though thecoherent power of the two time series is very low, the wavelet coherence analysis can still findout their statistically significant coherence region, this coherence region can be consideredas the two time series being locally correlated in the time-frequency space[23]. Hereby, thispaper will analyze the local correlations of TSI with the sunspot area and Mg II characteristicindex by means of wavelet coherence.2.2.2 The wavelet coherence analysis on the relations of TSI with the sunspot area and Mg IIcharacteristic index
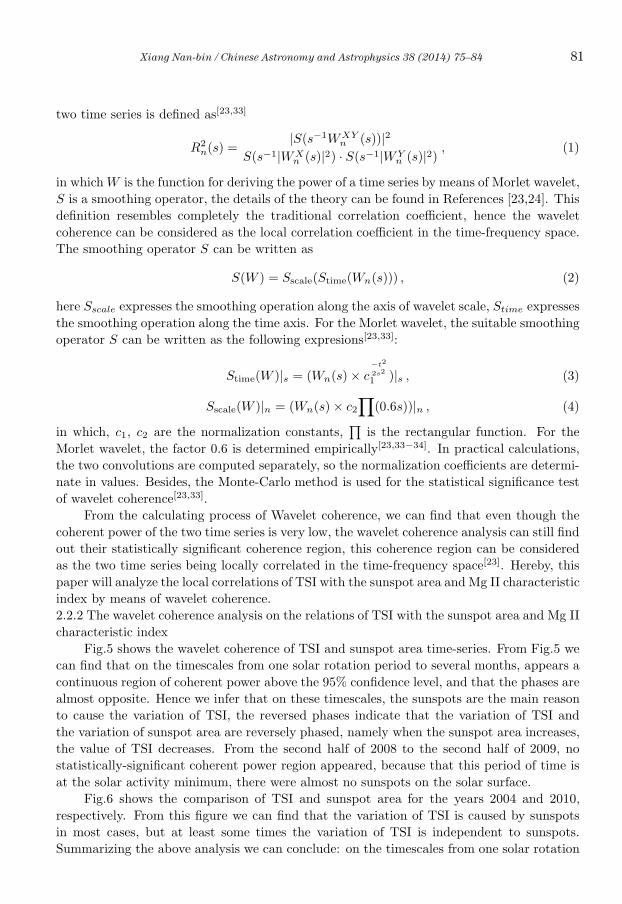
Fig.5 shows the wavelet coherence of TSI and sunspot area time-series. From Fig.5 wecan find that on the timescales from one solar rotation period to several months, appears acontinuous region of coherent power above the 95% confidence level, and that the phases arealmost opposite. Hence we infer that on these timescales, the sunspots are the main reasonto cause the variation of TSI, the reversed phases indicate that the variation of TSI andthe variation of sunspot area are reversely phased, namely when the sunspot area increases,the value of TSI decreases. From the second half of 2008 to the second half of 2009, nostatistically-significant coherent power region appeared, because that this period of time isat the solar activity minimum, there were almost no sunspots on the solar surface.
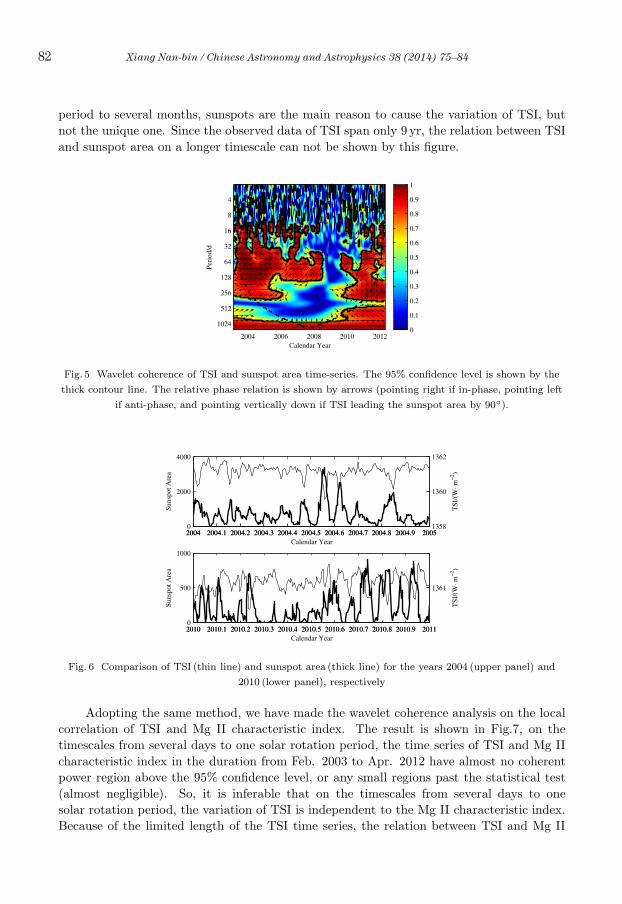
Fig.6 shows the comparison of TSI and sunspot area for the years 2004 and 2010,respectively. From this figure we can find that the variation of TSI is caused by sunspotsin most cases, but at least some times the variation of TSI is independent to sunspots.Summarizing the above analysis we can conclude: on the timescales from one solar rotation
82 Xiang Nan-bin / Chinese Astronomy and Astrophysics 38 (2014) 75–84
period to several months, sunspots are the main reason to cause the variation of TSI, butnot the unique one. Since the observed data of TSI span only 9 yr, the relation between TSIand sunspot area on a longer timescale can not be shown by this figure.
Calendar Year
Peri
od/d
2004 2006 2008 2010 2012
4
8
16
32
64
128
256
512
10240
0.1
0.2
0.3
0.4
0.5
0.6
0.7
0.8
0.9
1
Fig. 5 Wavelet coherence of TSI and sunspot area time-series. The 95% confidence level is shown by the
thick contour line. The relative phase relation is shown by arrows (pointing right if in-phase, pointing left
if anti-phase, and pointing vertically down if TSI leading the sunspot area by 90◦).
2004 2004.1 2004.2 2004.3 2004.4 2004.5 2004.6 2004.7 2004.8 2004.9 20050
2000
4000
Suns
pot A
rea
Calendar Year2004 2004.1 2004.2 2004.3 2004.4 2004.5 2004.6 2004.7 2004.8 2004.9 2005
1358
1360
1362T
SI/(
W⋅ m
−2 )
2010 2010.1 2010.2 2010.3 2010.4 2010.5 2010.6 2010.7 2010.8 2010.9 20110
500
1000
Suns
pot A
rea
Calendar Year2010 2010.1 2010.2 2010.3 2010.4 2010.5 2010.6 2010.7 2010.8 2010.9 2011
1361
TSI
/(W
⋅ m−
2 )
Fig. 6 Comparison of TSI (thin line) and sunspot area (thick line) for the years 2004 (upper panel) and
2010 (lower panel), respectively
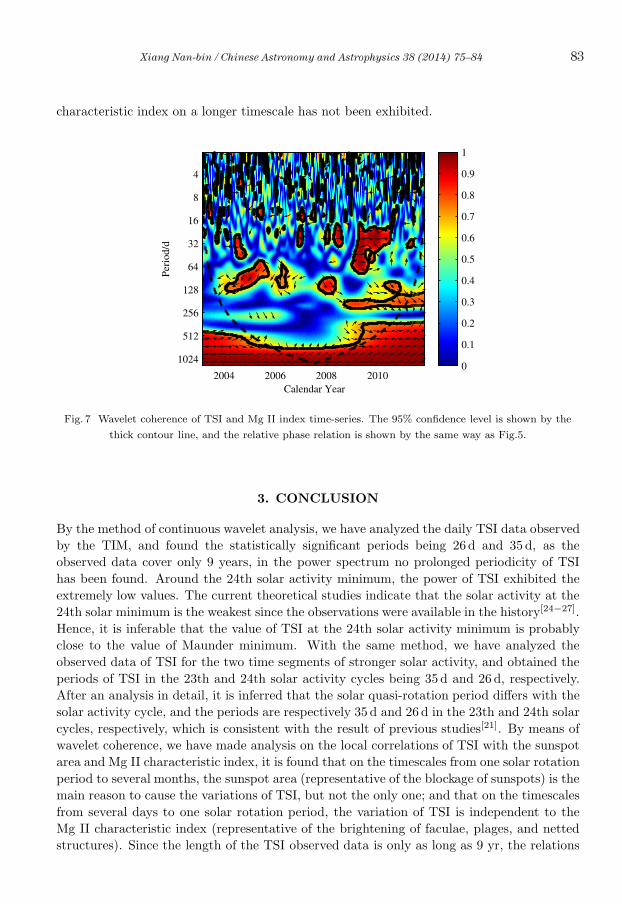
Adopting the same method, we have made the wavelet coherence analysis on the localcorrelation of TSI and Mg II characteristic index. The result is shown in Fig.7, on thetimescales from several days to one solar rotation period, the time series of TSI and Mg IIcharacteristic index in the duration from Feb. 2003 to Apr. 2012 have almost no coherentpower region above the 95% confidence level, or any small regions past the statistical test(almost negligible). So, it is inferable that on the timescales from several days to onesolar rotation period, the variation of TSI is independent to the Mg II characteristic index.Because of the limited length of the TSI time series, the relation between TSI and Mg II
Xiang Nan-bin / Chinese Astronomy and Astrophysics 38 (2014) 75–84 83
characteristic index on a longer timescale has not been exhibited.
Calendar Year
Peri
od/d
2004 2006 2008 2010
4
8
16
32
64
128
256
512
10240
0.1
0.2
0.3
0.4
0.5
0.6
0.7
0.8
0.9
1
Fig. 7 Wavelet coherence of TSI and Mg II index time-series. The 95% confidence level is shown by the
thick contour line, and the relative phase relation is shown by the same way as Fig.5.
3. CONCLUSION
By the method of continuous wavelet analysis, we have analyzed the daily TSI data observedby the TIM, and found the statistically significant periods being 26d and 35 d, as theobserved data cover only 9 years, in the power spectrum no prolonged periodicity of TSIhas been found. Around the 24th solar activity minimum, the power of TSI exhibited theextremely low values. The current theoretical studies indicate that the solar activity at the24th solar minimum is the weakest since the observations were available in the history[24−27].Hence, it is inferable that the value of TSI at the 24th solar activity minimum is probablyclose to the value of Maunder minimum. With the same method, we have analyzed theobserved data of TSI for the two time segments of stronger solar activity, and obtained theperiods of TSI in the 23th and 24th solar activity cycles being 35 d and 26 d, respectively.After an analysis in detail, it is inferred that the solar quasi-rotation period differs with thesolar activity cycle, and the periods are respectively 35 d and 26 d in the 23th and 24th solarcycles, respectively, which is consistent with the result of previous studies[21]. By means ofwavelet coherence, we have made analysis on the local correlations of TSI with the sunspotarea and Mg II characteristic index, it is found that on the timescales from one solar rotationperiod to several months, the sunspot area (representative of the blockage of sunspots) is themain reason to cause the variations of TSI, but not the only one; and that on the timescalesfrom several days to one solar rotation period, the variation of TSI is independent to theMg II characteristic index (representative of the brightening of faculae, plages, and nettedstructures). Since the length of the TSI observed data is only as long as 9 yr, the relations

84 Xiang Nan-bin / Chinese Astronomy and Astrophysics 38 (2014) 75–84
of TSI with the sunspot area and Mg II characteristic index on longer timescales have notbeen exhibited in wavelet coherence.
ACKNOWLEDGEMENT We thank the referee for the valuable opinion and suggestion.This study used the observed data of the Total Irradiance Monitor on the Solar Radiation &Climate Experiment of NASA of USA, and in the process of data processing, the programof wavelet analysis provided by Grinsted et al. was utilized.
References
1 Patra S. N., Bhattacharya G., Ghosh K., et al., AP&SS, 2009, 324: 47
2 Wenzler T., Solanki S. K., Krivova N. A., et al., A&A, 2006, 460: 583
3 Krivova N. A., Solanki S. K., JApA, 2008, 29: 151
4 Kopp G., Lean J. L., GeoRL, 2011, 38: L01706
5 Li K. J., Feng W., Xu J. C., et al., ApJ, 2012, 747: 135
6 Haigh J. D., Science, 2001, 294: 2109
7 Egorova T., Rozanov E., Zubov V., et al., AdSpR, 2005, 35: 451
8 Solanki S. K., Seleznyov A. D., Krivova N. A., ESASP, 2003, 535: 285
9 Withbroe G. L., SoPh, 2009, 257: 71
10 Pap J., Tobiska W. K., Bouwer S. D., SoPh, 1990, 129: 165
11 Lee R B III, Gibson M A, Wilson R. S., et al., JGR, 1995, 100: 1667
12 Fontenla J., White O. R., Fox P. A., et al., ApJ, 1999, 518: 480
13 Fligge M., Solanke S. K., Unruh Y. C., A&A, 2000, 353: 380
14 Krivova N. A., Solanki S. K., Fligge M., et al., A&A, 2003, 399: L1
15 Krivova N. A., Solanki S. K., Schmutz W., A&A, 2011, 529: A81
16 Solanki S. K., Krivova N. A., Wenzler T., AdSpR, 2005, 35: 376
17 Unruh Y. C., Krivova N. A., Solanki S. K., A&A, 2008, 486: 311
18 Frohlich C., Lean J., GeoRL, 1998, 25: 4377
19 Preminger D. G., Walton S. R., Chapman G. A., JGR, 2002, 107: A11
20 Jain K., Hasan S. S., A&A, 2004, 425: 301
21 Li K. J., Xu J. C., Liu X. H., et al., SoPh, 2010, 267: 295
22 Gan W. Q., Li Y. P., IAUS, 2010, 264: 84
23 Grinsted A., Moore J. C., Jevrejeva S., NPGeo, 2004, 11: 561
24 Fang C., Li K. J. Frontier Sciences and the Future (2009-2011), Beijing: Science Press, 2011: 201
25 Fang C., RAA, 2011, 11: 1377
26 Li K. J., Feng W, Liang H. F., SSPMA, 2010, 40: 1293
27 Li K. J., Feng W., Liang H. F., et al., AnGeo, 2011, 29: 341
28 Haberreiter M., IAUS, 2009, 264: 119
29 Viereck R. A., Puga L. C., JGR, 1999, 104: 9995
30 Viereck R. A., Puga L. C., McMullin D., et al., GeoRL, 2001, 28: 1343
31 Viereck R. A., Floyd L. E., Crane P. C., et al., SpWea, 2004, 2: S10005
32 Snow M., McClintock W. E., Woods T. N., et al., SoPh, 2005, 230: 325
33 Li K. J., Gao P. X., Zhan L. S., ApJ, 2009, 691: 537
34 Torrence C., Compo G. P., BAMS, 1998, 79: 61