evolution of polar order in ceramics
TRANSCRIPT

Solid State Communications 149 (2009) 1877–1880
Contents lists available at ScienceDirect
Solid State Communications
journal homepage: www.elsevier.com/locate/ssc
Evolution of polar order in Ba(Ti1−xSnx)O3 ceramicsLe Wang, Xiaoli Wang ∗, Bo Li 1MOE Key Laboratory for Nonequilibrium Synthesis and Modulation of Condensed Matter, School of Science, Xi’an Jiaotong University, Xi’an 710049, China
a r t i c l e i n f o
Article history:Received 22 July 2009Accepted 4 August 2009 by A.H. MacDonaldAvailable online 11 August 2009
PACS:77.22.Ej77.80.Dj77.84.Dy
Keywords:A. FerroelectricsD. Hysteresis loopD. Phase transition
a b s t r a c t
The ferroelectric hysteresis loops of Ba(Ti0.85Sn0.15)O3 and Ba(Ti0.75Sn0.25)O3 solid solution ceramicscovering the temperature Tm of a dielectric permittivity peak were investigated. At temperatures∼100 Klower than their respective Tm, the two compositions present clear ferroelectricity. Comparing with theparent ferroelectric BaTiO3, the tiny hysteresis loop of both Ba(Ti0.85Sn0.15)O3 and Ba(Ti0.75Sn0.25)O3ceramics at temperatures above Tm reveals the existence of polar order regions or microdomains. Thedielectric properties of the two solid solutions are different: the former shows the character of diffuseferroelectric phase transition, while the latter displays the feature of relaxor ferroelectrics. According totheir ferroelectric properties, however, Ba(Ti0.85Sn0.15)O3 and Ba(Ti0.75Sn0.25)O3 compositions exhibit thediffuse transition from low-temperature ferroelectric domains to polar nanoregions during the ε(T ) peakarea. A difference between the two compositions is that the diffuse transition of the former takes place ina much narrower temperature range than that of the latter.
© 2009 Elsevier Ltd. All rights reserved.
1. Introduction
BaTiO3 is one of the most studied ferroelectric materials. SomeBaTiO3-based solid solutions with isovalent substitution trans-form fromnormal ferroelectrics to ferroelectricswith diffuse phasetransition (DPT), then to relaxor ferroelectrics (relaxors) withincreasing content of substitutions [1–7]. Ba(Ti1−xSnx)O3 solidsolution system is one of the solid solution systems. Researchesfocusing on the crossover between ferroelectrics with DPT and re-laxors have been reported, and different presumptions were pro-posed according to the dielectric spectroscopy. Wei et al. believedthat DPT already correspond to the polar nanoregions, and thedistinction between frequency-independent DPT and frequency-dependent relaxors was due to the different sizes of the polarnanoregions with the consequence of different relaxation frequen-cies [8]. Mueller et al. attributed the DPT to a ferroelectric phasetransition based on the observation of domains in compositionswith Sn content less than 13 at.% [9]. Lei et al. showed a similaropinion about DPT as Mueller et al., and ascribed the crossoverfrom DPT to relaxors to the appearance of the additional dielec-tric contribution arising from the flipping of the local polariza-tion of the polar clusters [7]. Wang et al. suggested that defectdipoles trapped by random electric fields Er were the origins ofthe dielectric audio-frequency dispersion, and the temperatureTm of maximum permittivity εm becomes frequency-dependent
∗ Corresponding author.E-mail address: [email protected] (X. Wang).
1 Present address: Henan institute of metrology, Zhengzhou, China.
0038-1098/$ – see front matter© 2009 Elsevier Ltd. All rights reserved.doi:10.1016/j.ssc.2009.08.005
when the permittivity contributed by the defect dipoles was largeenough [10].The controversies illustrate that other types of experimental
data are necessary to approach the origin of relaxor behavior inBa(Ti1−xSnx)O3 solid solutions. A distinct domain structure ofBa(T0.85Sn0.15)O3 at 295 K was observed by piezoresponse forcemicroscopy, though its Tm ≈ 283 K [11]. It manifests thatBa(Ti1−xSnx)O3 ceramics with x below threshold xc (≈0.19)presents diffuse ferroelectric phase transition.In this article, we reported on investigations of the ferroelectric
properties of Ba(Ti0.85Sn0.15)O3 and Ba(Ti0.75Sn0.25)O3 in the tem-perature range covering their permittivity-temperature anomaly.Of the two compositions, Ba(Ti0.85Sn0.15)O3 is located at DPT side,and Ba(Ti0.75Sn0.25)O3 at relaxor side.
2. Experimental
Ceramics Ba(Ti0.85Sn0.15)O3 and Ba(Ti0.75Sn0.25)O3 were pre-pared usingmixed oxidemethod. For comparison, BaTiO3 ceramicswere synthesized too. Stoichiometric amounts of reagents BaCO3,TiO2 and SnO2 powders were wet mixed by ball milling and thenpresintered between temperatures of 1373 K and 1423 K for 2 h.The presintered powder was ball milled and dried. Pellets 12 mmin diameter and∼1 mm thick were pressed using 10% PVA binder.The pellets were fired between temperatures of 1573 K and 1623 Kfor 2 to 3 h.For dielectric measurements, ceramic samples were ground
and then painted with silver paste as electrodes on two flatsides after being fired at 823 K for 15 m. The dielectric per-mittivity were measured on an automated system, wherein a

1878 L. Wang et al. / Solid State Communications 149 (2009) 1877–1880
Fig. 1. Dielectric permittivity of BaTiO3 , Ba(Ti0.85Sn0.15)O3 and Ba(Ti0.75Sn0.25)O3as a function of temperature at different frequencies.
Fig. 2. Hysteresis loops of BaTiO3 ceramic at different temperatures.
temperature control sample chamber and an Agilent 4284Ainductance–capacitance–resistance (LCR) meter, which can covera frequency range from 20 Hz to 1 MHz, were controlled by a per-sonal computer. For ferroelectric hysteresis loop measurements, asinusoidal signal of 1 Hz, generated by a personal computer witha PCI6221 Data Acquisition (DAQ) card, was amplified through aTrek 610E high-voltage supply/amplifier/controller and applied tothe sample. Current through the sample was collected by the DAQcard, and converted to a digital signal wherein. The hysteresis loopwas obtained through charge integration.
3. Results
Fig. 1 shows dielectric permittivity ε from 0.1 kHz to 100 kHz asa function of temperature for ceramics of BaTiO3, Ba(Ti0.85Sn0.15)O3and Ba(Ti0.75Sn0.25)O3. The Tc of BaTiO3 is 403 K, and the tem-perature Tm of maximum permittivity εm of Ba(Ti0.85Sn0.15)O3and Ba(Ti0.75Sn0.25)O3 is 285 K and ∼190 K, respectively. Theε(T ) peak becomes broader with an increasing content of Sn4+ions. The full width at half εm for Ba(Ti0.75Sn0.25)O3 is morethan 80 K, which is much wider than that of Ba(Ti0.85Sn0.15)O3(∼40 K). For Ba(Ti0.85Sn0.15)O3, Tm is frequency-independent, butfor Ba(Ti0.75Sn0.25)O3, Tm is 187 K at 0.1 kHz and 192 K at 100 kHz.Hysteresis loops of BaTiO3 ceramic measured at different
temperatures are depicted in Fig. 2. BaTiO3 ceramic exhibits athorough paraelectric state at 417 K (14 K higher than Tc = 403 K)and above under the AC maximum field of 3.5 MV m−1. Uponcooling, a double-hysteresis loop was observed for BaTiO3 at 406 K
Fig. 3. Field dependences of current density J and polarization P for BaTiO3 ceramicat 406 K.
Fig. 4. Hysteresis loops of Ba(Ti0.85Sn0.15)O3 ceramic at different temperatures.
(3 K higher than Tc , see Fig. 3). There is a discharge peak on theopposite side of the charge peak in the loop of current density Jversus electric field E. It indicates that the double-hysteresis loopis caused by a field-induced phase transition between paraelectricand ferroelectric states. The induced ferroelectric states vanish asapplied electric field decreases to zero. At temperatures 393 K and288 K of the ferroelectric state, the remanent polarization Pr ofBaTiO3 is 0.043 C m−2 and 0.095 C m−2, respectively.Fig. 4 shows the hysteresis loops of Ba(Ti0.85Sn0.15)O3 ceramic.
At 333 K (48 K higher than Tm = 285 K) and above, the inducedpolarization by electric field is reversible, and there is no hysteresiseffect. The hysteresis behavior appears when the sample is cooledto∼313 K. Very small remnant polarization indicates the existenceof some microdomains in Ba(Ti0.85Sn0.15)O3 at 313 K. In addition,a special polarization behavior under high field is observed justabove Tm. Fig. 5 plots the field dependences of current density Jand polarization P for Ba(Ti0.85Sn0.15)O3 ceramic at 288 K underAC maximum fields of 2 MV m−1 and 3.6 MV m−1, respectively.The shape of the two loops of J versus E at different temperaturesis quite alike. The J(E) peaks are composed of discharge andcharge current density, and the peak points are located at theincreasing field side, which implies there are net charge parts.Nevertheless, the corresponding hysteresis loops exhibit distinctdifference. The hysteresis loop is normal under Em of 2 MV m−1.But when the AC maximum field increases to 3.6 MV m−1, thehysteresis loop displays a double-like shape. Since there is nocorresponding charge and discharge peaks in the J(E) loop, thedouble-like hysteresis loop should not stem from the field-inducedtransition between paraelectric and ferroelectric states. Anotherdifference from that of the parent ferroelectric BaTiO3, the double-like hysteresis loop of Ba(Ti0.85Sn0.15)O3 presents some remanent

L. Wang et al. / Solid State Communications 149 (2009) 1877–1880 1879
Fig. 5. Field dependences of current density J (a) and polarization P (b) forBa(Ti0.85Sn0.15)O3 ceramic at 288 K under different ac maximum fields.
polarization, which implies that there exist some microdomains.The remanent polarizations measured at the two AC maximumfields are same. The thin hysteresis loop exists in Ba(Ti0.85Sn0.15)O3ceramic above Tm until ∼333 K. Below Tm, the increase of Praccelerates obviously with decreasing temperature.The hysteresis loops of Ba(Ti0.75Sn0.25)O3 ceramic at different
temperatures are represented in Fig. 6. Tm of Ba(Ti0.75Sn0.25)O3 at100 Hz is 187 K, and tiny hysteresis loop can be measured till to∼290K. Comparingwith Ba(Ti0.85Sn0.15)O3, Pr of Ba(Ti0.75Sn0.25)O3becomes smaller and increases slowly on cooling at the corre-sponding temperature range. Unlike Ba(Ti0.85Sn0.15)O3, the hys-teresis loop of Ba(Ti0.75Sn0.25)O3 does not show a double-likeanomaly under a higher AC field at temperatures just above Tm (seeFig. 7). In addition, the remnant polarization also stays constantwhen the AC maximum field increases.For further understanding the evolution of polar order in
Ba(Ti1−xSnx)O3 ceramics, the hysteresis loopsmeasured at∼100 Klower than their respective Tm are shown in Fig. 8. The hysteresisloop of BaTiO3 at 288 K is also represented for comparison.At about 100 K lower than Tm, both Ba(Ti0.85Sn0.15)O3 andBa(Ti0.75Sn0.25)O3 display enhanced ferroelectricity with Pr is0.087 C m−2 and 0.045 C m−2, respectively. It demonstrates thatthe concentration and scales of the polar order regions in bothBa(Ti0.85Sn0.15)O3 and Ba(Ti0.75Sn0.25)O3 compositions increasewith further decreasing temperature. There are some ferroelectricstates in Ba(Ti0.85Sn0.15)O3 and Ba(Ti0.75Sn0.25)O3 ceramics at lowtemperatures beyond the ε(T ) peak area.
4. Discussion
In Ba(Ti1−xSnx)O3 solid solutions, Ti4+ ions are ferroelectricactive, but Sn4+ ions are not [12]. Since BaTiO3 does not showremanent polarization after undergoing a high AC electric fieldat temperatures just above Tc (see Fig. 3), it means that thefield-induced ferroelectric phase from the paraelectric state orpolar nanoregions of BaTiO3 cannot persist when the applied
Fig. 6. Hysteresis loops of Ba(Ti0.75Sn0.25)O3 ceramic at different temperatures.
Fig. 7. Hysteresis loops of Ba(Ti0.75Sn0.25)O3 ceramic at 193 K under different ACmaximum fields.
Fig. 8. Hysteresis loops of BaTiO3 at 288 K (A), Ba(Ti0.85Sn0.15)O3 at 153 K (B), andBa(Ti0.75Sn0.25)O3 at 83 K (C).
field decreases to zero. Accordingly, the thin hysteresis loopof either Ba(Ti0.85Sn0.15)O3 or Ba(Ti0.75Sn0.25)O3 at temperaturesabove Tm implies the existence of microdomains in the solidsolutions. The evolution of the polar order in Ba(Ti0.85Sn0.15)O3 andBa(Ti0.75Sn0.25)O3 with a decreasing temperature can be estimatedaccording to the relationship of remanent polarization Pr versusT − Tm (see Fig. 9). In the temperature range of 50 K above Tm, theremanent polarization of Ba(Ti0.85Sn0.15)O3 and Ba(Ti0.75Sn0.25)O3exhibits a similar variation, and Pr of the former is some lower thanthat of the latter. At the temperature about 50 K higher than Tm,Ba(Ti0.85Sn0.15)O3 does not show a hysteresis loop with Pr = 0,but Ba(Ti0.75Sn0.25)O3 still shows a very tiny hysteresis loop with
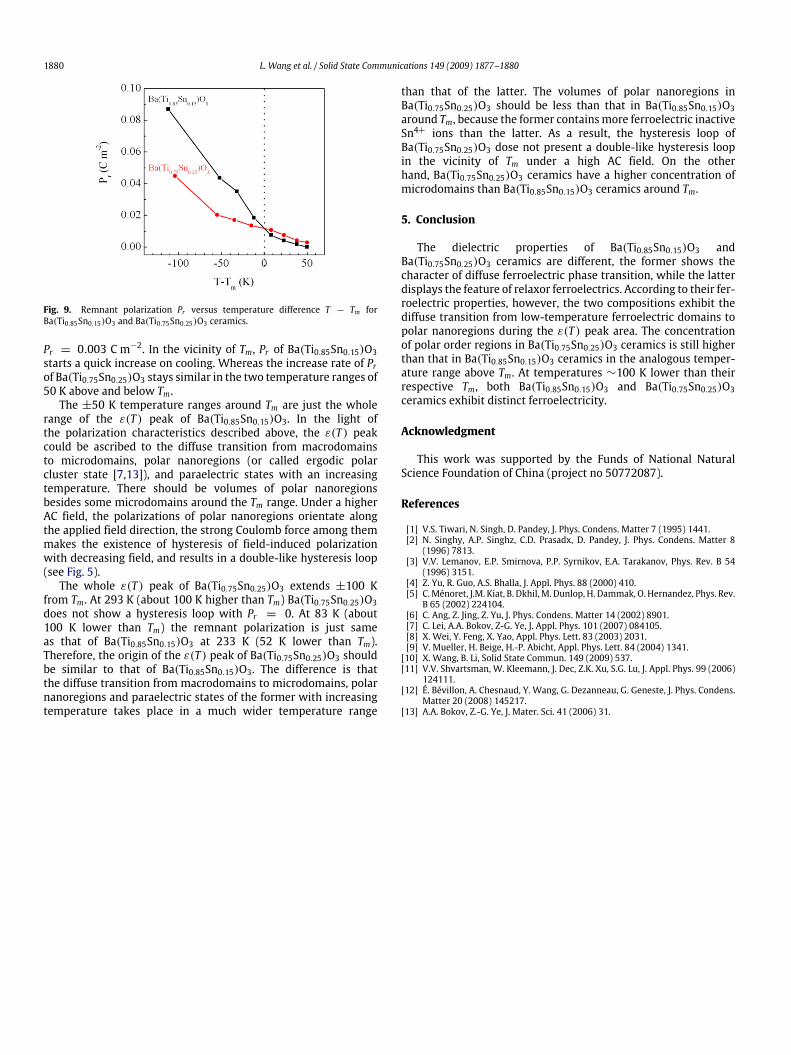
1880 L. Wang et al. / Solid State Communications 149 (2009) 1877–1880
Fig. 9. Remnant polarization Pr versus temperature difference T − Tm forBa(Ti0.85Sn0.15)O3 and Ba(Ti0.75Sn0.25)O3 ceramics.
Pr = 0.003 C m−2. In the vicinity of Tm, Pr of Ba(Ti0.85Sn0.15)O3starts a quick increase on cooling. Whereas the increase rate of Prof Ba(Ti0.75Sn0.25)O3 stays similar in the two temperature ranges of50 K above and below Tm.The ±50 K temperature ranges around Tm are just the whole
range of the ε(T ) peak of Ba(Ti0.85Sn0.15)O3. In the light ofthe polarization characteristics described above, the ε(T ) peakcould be ascribed to the diffuse transition from macrodomainsto microdomains, polar nanoregions (or called ergodic polarcluster state [7,13]), and paraelectric states with an increasingtemperature. There should be volumes of polar nanoregionsbesides some microdomains around the Tm range. Under a higherAC field, the polarizations of polar nanoregions orientate alongthe applied field direction, the strong Coulomb force among themmakes the existence of hysteresis of field-induced polarizationwith decreasing field, and results in a double-like hysteresis loop(see Fig. 5).The whole ε(T ) peak of Ba(Ti0.75Sn0.25)O3 extends ±100 K
from Tm. At 293 K (about 100 K higher than Tm) Ba(Ti0.75Sn0.25)O3does not show a hysteresis loop with Pr = 0. At 83 K (about100 K lower than Tm) the remnant polarization is just sameas that of Ba(Ti0.85Sn0.15)O3 at 233 K (52 K lower than Tm).Therefore, the origin of the ε(T ) peak of Ba(Ti0.75Sn0.25)O3 shouldbe similar to that of Ba(Ti0.85Sn0.15)O3. The difference is thatthe diffuse transition from macrodomains to microdomains, polarnanoregions and paraelectric states of the former with increasingtemperature takes place in a much wider temperature range
than that of the latter. The volumes of polar nanoregions inBa(Ti0.75Sn0.25)O3 should be less than that in Ba(Ti0.85Sn0.15)O3around Tm, because the former containsmore ferroelectric inactiveSn4+ ions than the latter. As a result, the hysteresis loop ofBa(Ti0.75Sn0.25)O3 dose not present a double-like hysteresis loopin the vicinity of Tm under a high AC field. On the otherhand, Ba(Ti0.75Sn0.25)O3 ceramics have a higher concentration ofmicrodomains than Ba(Ti0.85Sn0.15)O3 ceramics around Tm.
5. Conclusion
The dielectric properties of Ba(Ti0.85Sn0.15)O3 andBa(Ti0.75Sn0.25)O3 ceramics are different, the former shows thecharacter of diffuse ferroelectric phase transition, while the latterdisplays the feature of relaxor ferroelectrics. According to their fer-roelectric properties, however, the two compositions exhibit thediffuse transition from low-temperature ferroelectric domains topolar nanoregions during the ε(T ) peak area. The concentrationof polar order regions in Ba(Ti0.75Sn0.25)O3 ceramics is still higherthan that in Ba(Ti0.85Sn0.15)O3 ceramics in the analogous temper-ature range above Tm. At temperatures ∼100 K lower than theirrespective Tm, both Ba(Ti0.85Sn0.15)O3 and Ba(Ti0.75Sn0.25)O3ceramics exhibit distinct ferroelectricity.
Acknowledgment
This work was supported by the Funds of National NaturalScience Foundation of China (project no 50772087).
References
[1] V.S. Tiwari, N. Singh, D. Pandey, J. Phys. Condens. Matter 7 (1995) 1441.[2] N. Singhy, A.P. Singhz, C.D. Prasadx, D. Pandey, J. Phys. Condens. Matter 8(1996) 7813.
[3] V.V. Lemanov, E.P. Smirnova, P.P. Syrnikov, E.A. Tarakanov, Phys. Rev. B 54(1996) 3151.
[4] Z. Yu, R. Guo, A.S. Bhalla, J. Appl. Phys. 88 (2000) 410.[5] C.Ménoret, J.M. Kiat, B. Dkhil,M. Dunlop, H. Dammak, O. Hernandez, Phys. Rev.B 65 (2002) 224104.
[6] C. Ang, Z. Jing, Z. Yu, J. Phys. Condens. Matter 14 (2002) 8901.[7] C. Lei, A.A. Bokov, Z-G. Ye, J. Appl. Phys. 101 (2007) 084105.[8] X. Wei, Y. Feng, X. Yao, Appl. Phys. Lett. 83 (2003) 2031.[9] V. Mueller, H. Beige, H.-P. Abicht, Appl. Phys. Lett. 84 (2004) 1341.[10] X. Wang, B. Li, Solid State Commun. 149 (2009) 537.[11] V.V. Shvartsman, W. Kleemann, J. Dec, Z.K. Xu, S.G. Lu, J. Appl. Phys. 99 (2006)
124111.[12] É. Bévillon, A. Chesnaud, Y. Wang, G. Dezanneau, G. Geneste, J. Phys. Condens.
Matter 20 (2008) 145217.[13] A.A. Bokov, Z.-G. Ye, J. Mater. Sci. 41 (2006) 31.