evolution of late pleistocene and holocene climates in the circum-south pacific land areas
TRANSCRIPT

Climate Dynamics (1992)6:193-211 glimai¢
Dynamia © Springer-Verlag 1992
Evolution of late Pleistocene and Holocene climates in the circum-South Pacific land areas*
Vera Markgraf I , John R Dodson 2, A Peter Kershaw 3, Matt S McGlone 4, and Neville Nicholls 5
1 Institute of Arctic and Alpine Research, University of Colorado, Boulder, CO 80309-450, USA 2 School of Geography, University of New South Wales, Kensington, New South Wales, Australia 2033 3 Department of Geography and Environmental Science, Monash University, Clayton, Victoria, Australia 3168 4 D.S.I.R. Land Resources, Private Bag, Christchurch, New Zealand 5 Bureau of Meteorology, GPO Box 1289K, Melbourne, Victoria, Australia 3001
Received May 22, 1991/Accepted September 11, 1991
Abstract. Paleovegetation maps were reconstructed based on a network of pollen records from Australia, New Zealand, and southern South America for 18 000, 12000, 9000, 6000, and 3000 BP and interpreted in terms of paleoclimatic patterns. These patterns permit- ted us to speculate on past atmospheric circulation in the South Pacific and the underlying forcing missing line mechanisms. During full glacial times, with vastly extended Australasian land area and circum-Antarctic ice-shelves, arid and cold conditions characterized all circum-South Pacific land areas, except for a narrow band in southern South America (43 ° to 45°S) that might have been even wetter and moister than today. This implies that ridging at subtropical and mid-lati- tudes must have been greatly increased and that the storm tracks were located farther south than today. At 12000 BP when precipitation had increased in southern Australia, New Zealand, and the mid-latitudes of South America, ridging was probably still as strong as before but had shifted into the eastern Pacific, leading to weaker westerlies in the western Pacific and more southerly located westerlies in the eastern Pacific. At 9000 BP when, except for northernmost Australia, pre- cipitation reached near modern levels, the south Pacific ridges and the westerlies must have weakened. Because of the continuing land connection between New Gui- nea and Australia, and reduced seasonality, the mon- soon pattern had still not developed. By 6000 BP, mois- ture levels in Australia and New Zealand reached their maximum, indicating that the monsoon pattern had be- come established. Ridging in the South Pacific was probably weaker than today, and the seasonal shift of the westerlies was stronger than before. By 3000 BP es- sentially modern conditions had been achieved, charac- terized by patterns of high seasonal variability.
* Contribution to Clima Locarno - Past and Present Climate Dy- namics; Conference September 1990, Swiss Academy of Sciences - National Climate Program
Offprint requests to: V Markgraf
Introduction
To develop hemispheric and global paleoclimatic scen- arios for different periods in the past, the regional pal- eoenvironmental data need to be compared, not by curve or pattern matching, but by understanding the climatic mechanisms that link the regional systems to- day in this section and thus explain the past (Pittock 1983).
Comparison of independently developed regional paleoclimate and paleocirculation patterns for the last 18000 y BP (18 ka) for Australia (Harrison and Dod- son, 1991, in press), New Zealand (McGlone 1988), and South America (Markgraf 1989a, 1991a, b) revealed large-scale similarities. However, it became evident that climate mechanisms operating in the southern latitudes in South America (for instance, the influence of the Antarctic ice cover on the intensity and location of the westerly storm tracks) could not fully explain the paleo- climatic data set of Australia nor New Zealand. To un- derstand the intrahemispheric dynamics of paleocli- matic change of the circum-South Pacific land areas during the last 18 000 years, it is necessary to consider the general climate forcing processes within the south- ern hemisphere.
We use this approach for our present paleoclimate reconstruction of the circum-South Pacific for the last 18000 years. It differs from earlier circum-Antarctic paleoclimatic reconstructions (COHMAP 1988; Heusser 1989) in that it considers the interplay between tropical Australasia and Antarctica as the key to south- ern Pacific paleoclimate dynamics.
This paper first introduces the modern climate set- ting, followed by a discussion of the paleoecological and paleoclimatic data at 18, 12, 9, 6, and 3 k a y for each land area (Australia, New Zealand, and southern South America), the boundary conditions, and finally the cirum-South Pacific paleoclimate patterns and pal- eocirculation processes.
194 Markgraf et al.: Past atmospheric circulation in South Pacific
Modern and past climate forcing Paleoecology and paleoclimates
The principal determinants of southern hemisphere cli- mates are: the asymmetrical distribution of land and sea, the small amount of land, and the extremely cold polar region. The resulting steep pole-to-equator tem- perature gradient explains the extreme vigor of the gen- eral circulation systems, the circum-polar vortex with easterly flow, the southern westerlies, the subtropical high pressure ridge, and the tropical easterlies (Pittock et al. 1978; Webster and Streten 1978). From winter to summer, the high pressure ridges over Australia and South America and the southern westerlies shift pole- ward by about 10 ° latitude, from about 25 ° to 35 ° S and from 40 ° to 50 ° S, respectively, leading to seasonal shifts in the storm tracks and hence in precipitation. These seasonal shifts are related to the seasonally changing extent of Antarctic sea ice, on the one hand, and to the average intensity of the tropical disturbances in the near equatorial trough on the other. During times of abnormal latitudinal shifts of the circulation systems, abnormal shifts also occur in the precipitation patterns. One of these generally short-term anomalies is the Southern Oscillation, causing E1 Nifio/La Nifia pat- terns; another is the extreme poleward/equatorward la- titudinal position of the subtropical high pressure ridge, in turn linked to the strength of the Hadley cell.
In the late Quaternary some present climate-forcing parameters no longer operated in the same fashion be- cause of substantially different boundary conditions. Orbitally forced changes in the seasonal distribution of solar radiation (Milankovitch cycles) resulted in sub- stantial changes in the seasonal aspects of climate (Kutzbach and Guetter 1986). The lower sea level dur- ing full glacial times extended the land area in the Aus- tralasian region, the Sunda-Sahul land between the In- donesian islands, and Australia-New Guinea, respec- tively. This greatly expanded land mass must have al- tered the heat balance of the region, by blocking the westward-flowing warm ocean current through the Torres Strait, which in turn would allow the cold west Austalian current to be even more extensive toward the equator (Webster and Streten 1978). As a consequence, tropical disturbances and moisture sources would be reduced in size, and the subtropical high-pressure ridge over Australia would be maintained in its intensified winter mode. As a further consequence the E1 Nifio/ Southern Oscillation probably did not operate in its present-day fashion.
Another major boundary condition affecting the cli- mate of the circum-South Pacific land areas during the ice ages was the equatorward extension of Antarctic ice shelves and sea ice (CLIMAP 1981). The pole-equator temperature gradient therefore became steeper, inten- sifying the southern westerlies and compressing them towards the equator. As a result of these substantial Australasian and Antarctic changes in boundary condi- tions, the hemispheric long-wave pattern would have shifted to the east over the Indian and South Pacific oceans, determining the location of the storm tracks and hence precipitation (Webster and Streten 1978).
Australia and New Guinea
The natural vegetation of Australia broadly follows a structural continuum of decreasing height and cover from the coast inland under decreasing rainfall (Specht 1972). Local variations result form soil factors and fire regimes. Elevation on this continent of low relief is of little importance except along the east coast where the wetter highlands provide suitable conditions for a vari- ety of closed-canopied rain forest types. The rain forest patches decrease in structural and floristic complexity from tropical to temperate regions and are surrounded by open forests dominated by Eucalyptus with a grassy or heath undergrowth. Heathlands become important in wetter areas within those southern parts of the conti- nent subject to extremes such as low soil fertility and/ or seasonal drought, cold or waterlogging. Under re- duced rainfall, open forests generally give way to open savanna woodlands in the summer rainfall climate of northern Australia and eucalyptus woodlands and shrublands in the winter rainfall part in the southern continent. The arid center is dominated by Acacia and chenopodiaceous shrublands. Harrison and Dodson (1991, in press) have described in detail the major vege- tation and climate relationships and the relative sensi- tivity of vegetation systems of the region to climatic change. Their review of paleoecological evidence and earlier reviews by Kershaw (1981) and Walker and Singh (1981) provide a framework for understanding the general patterns of vegetation change over the last 18 ka.
Some 90 paleoecological sites have been examined across the region. The coverage is small, given the size of the land masses and vegetation variety, and vegeta- tion reconstruction can only be regarded as reliable for coastal southeastern Australia, the mountainous areas of Tasmania and New Guinea, and northeastern Queensland. In particular, the arid zone, the lowland summer-rainfall areas and a number of sensitive eco- logical boundaries are either underrepresented or unin- vestigated. Pollen analysis nevertheless provides the most detailed paleoclimatic information from the widest range of environments. The major genera Euca- lyptus and Acacia are relatively short-lived and can be expected to respond to climatic change within a few de- cades. The most sensitive indicators of changes in avail- able moisture appear to be the balance between rainfor- est and sclerophyll trees in moist environments and changes in the proportions of shrub, fern, and grass- land species in humid to semiarid environments.
In northeastern Australia, and in mountainous ar- eas, it has been possible to detect temperature changes using pollen analysis; elsewhere the record is domi- nated by changes in effective moisture.
During full glacial times, about 18 ka snowlines in New Guinea (Hope and Peterson 1975) and in Tas- mania (Colhoun and Fitzsimons 1990) were depressed by about 1000 m, suggesting a temperature depression of about 6 ° C. The period between 20 and 15 ka (Fig. 1)

Markgraf et al. : Past atmospheric circulation in South Pacific
-0 o 120 °
m Rainforest
i ~ Forest-Woodland
[ T ~ Shrubtand-Open Woodland
_ ~ Heath
~ - - [ Alpine
140 ° 150 °
CAPRICORN OF . . . . . . . . . . . . . . .
TROPIC . . . . . . . . . . I
9Kyr 0 500 1000 t I f
Kilometres 110 ° 130 ° 140 °
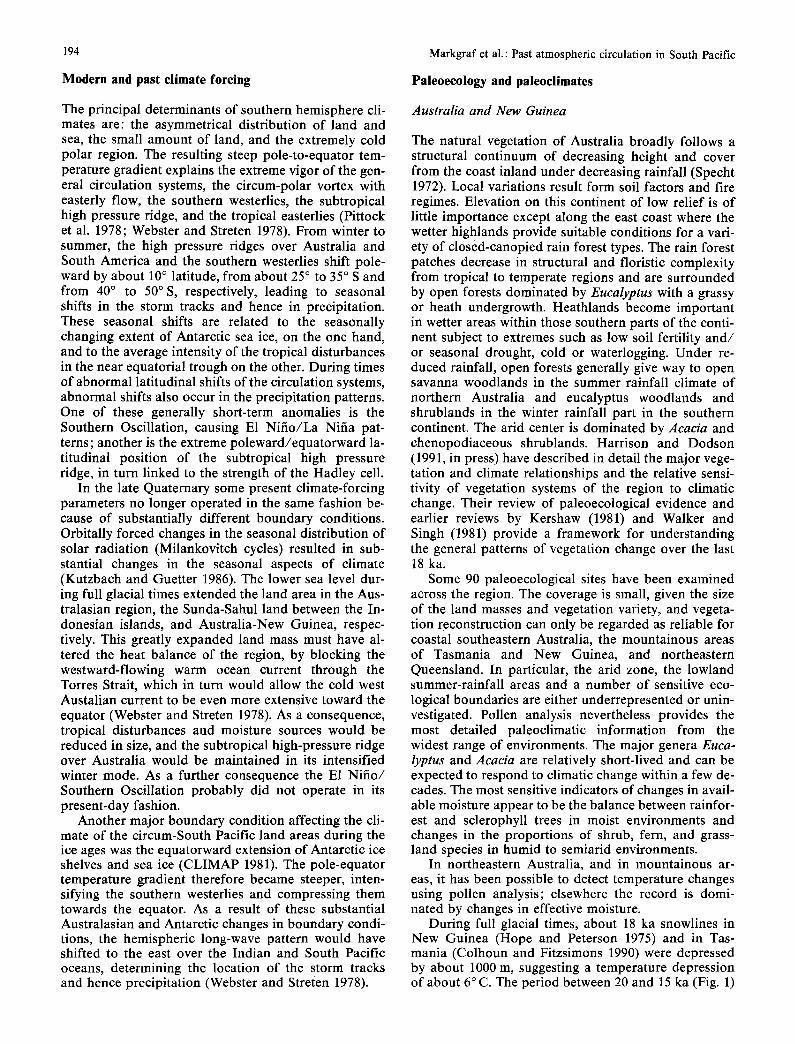
Fig. 1. Reconstruction of vegetation for Australia and New Gui- nea for 18000 and 9000 y BP based on pollen records
was characterized throughout Australia by more arid vegetation; open steppe in the southeast, including Tas- mania (Markgraf et al. 1986), shrubland in the eastern interior (Dodson and Wright 1989), and savannah woodland, dominated by Eucalyptus and Casuarina-
195
ceae in tropical northern Australia. At this time temper- atures are estimated to have been about 6°C cooler than today in southeastern Australia, but there is little information on temperature levels from the northern part of the continent. In New Guinea, there were for- ests at elevations below 2200 m, and grasslands above this altitude, indicating a lowering of the treeline by ca. 1700 m. Climates must have been substantially cooler and drier there.
Between 15 and 10 ka, the vegetation in southern Australia changed from steppe and shrubland to sclero- phyll forests and woodland, although major regional variations in the nature of this transition and its timing are evident. In the Tasmania highlands, rising tempera- tures resulted in the development of shrub-dominated forests after 12 ka that changed into more closed, but still summer-dry rain forests, after 11 ka (Markgraf et al. 1986). On the mainland, forest expansion occurred as early as 14 ka in wetter, lowland areas but later at higher altitudes. In drier areas, there is evidence of an increase in drier communities, including chenopodia- ceous shrublands, between about 15 and 11 ka before any woodland expansion, suggesting an effective de- crease in effective precipitation during this period. It is likely that temperatures rose at a rate greater than the precipitation, effectively reducing the moisture levels. However, was is only in the drier areas where precipita- tion rather than temperature was the limiting factor to vegetation development that a vegetation and environ- mental response was detected.
In New Guinea, the treeline shifted upslope after 12 ka but there is some indication of reduced precipitation between about 13 and 11.5 ka. In northern Australia, precipitation levels may have been lowest between about 15 and 11 ka but the vegetation cover remained the same as during the height of the glacial. As yet, there have been insufficient data to resolve the impor- tant question of how abrupt or transitional the climates of this time were because the sedimentation rates of the few deposits analyzed were slow and the pollen ana- lyses are supported by few radiocarbon dates.
Around 10 ka forest and woodland expanded, lead- ing to essentially present-day distributions in the south- ern part of the continent (Fig. 1). In northeastern Queensland, sclerophyll forest replaced the savannah woodland to some degree, but rain forest still had a re- stricted distribution. Through much of southeastern Australia, the initial forests or woodlands were domi- nated by Casuarinaceae rather than Eucalyptus, sug- gesting that some aspects of the prevailing climate may have been different l~rom those of today.
Maximum levels of effective moisture and tempera- ture were reached between about 8 and 5 ka in most areas, although there seems to have been regional varia- tion in the timing of these peaks (Fig. 2). In Tasmania, temperate rain forests, presently at low elevations in the south and western part of the island, expanded to higher elevations throughout the western half between 8 and 6 ka, while in the southeastern highlands of mainland Australia, wet sclerophyll forest and temper- ate rainforest elements achieved their highest altitudes

196
~-oo 1~o o 1:~oo
I II':'ain'°re't ~ Forest-Woodland
~F['~ Shrubland-Open Woodlan~ , . . . . . . . .
, , q -0 ° 120 ° 130%1
. Rainforest
F ~ Forest-Woodland
[TT]] Shrubland-Open Woodland
_ ~ Heath
[-'~'-] Alpine , - ~
1'40 ° i
150 °
Huon
- r l l I , C A P R I C O R N '
r~oPIC . . . . . . . . _%z . . . . . . . . . . . . . . . . . . . . . . . . .
3Kyr
0 500 1000 I I I
110 ° Kilometres 130 ° 140 °
Fig. 2. Reconstruction of vegetation for Australia and New Gui- nea for 6000 and 3000 y BP based on pollen records
between 8 and 5 ka. In the southeastern lowlands, the maximum extent of wetter forest elements and highest lake levels were achieved between 7 and 5 ka contem- poraneously with the highest effective precipitation re- corded for Barrington Tops.
Markgraf et al.: Past atmospheric circulation in South Pacific
In New Guinea the greatest development of forests and shrublands occurred between 8 and 5 ka. In north- east Queensland, rainforest expansion is evident after 8.5 ka, reaching maximum extent between about 6 and 3.5 ka. Elsewhere in northern Australia the present-day conditions were established about 7 ka.
After 5 ka, and especially after 3 ka, climates became cooler and somewhat drier (Fig. 2). The treeline shifted down-slope in Tasmania and New Guinea and altered its character in southeastern Australia. There was a marked reduction in rain forest and wet sclerophyll for- est with a predominance of dry sclerophyll forests and woodlands. At the same time environmental variability increased substantially, leading to marked differentia- tion of environments in some areas.
Northeast Queensland may provide an exception to the general pattern in that bioclimatic estimates indi- cate an increase in temperature at 5 ka from levels be- tween 7 and 5 ka. However, the vegetation may have been responding to reduced solar radiation under more continuous cloud cover rather than regionally lower temperatures at this time. There is certainly evidence for increased seasonality or variability in precipitation after 5 ka from an opening up of the rain forest canopy and expansion of Eucalyptus woodland from 3.5 ka.
New Zealand
Environments in present-day New Zealand range from warm temperate in the far north to cool temperate in the extreme south, with the high mountain chains sup- porting alpine and nival habitats (Meurk 1984). The predominant natural vegetation cover of the lowlands is evergreen conifer-broadleaved forest. Subalpine for- ests are mainly dominated by evergreen Nothofaous forests, although in many locations low conifer-broad- leaved forests or shrubland are also found. The natural vegetation cover of the semi-arid central southeastern South Island was sclerophyll shrubland and tussock and grassland. The broad vegetation patterns are con- trolled by a north-south temperature gradient, which is modified by the clearer skies and strong foehn wind ef- fect to the east of the main ranges, which bring colder winters and more extreme summer heat, and by a pro- nounced west-east decline in rainfall induced by the strong westerly flow over the country.
New Zealand now has a sparse network of pollen analytical sites, which provide near-continuous vegeta- tion records for the last 12 to 18 ka in most regions of the mainland. It is now possible to produce low-resolu- tion reconstructions of the vegetation history of the last 18 ka, and McGlone (1988) has reviewed this period in some detail.
Climatic interpretation made on the basis of these pollen records tends to be fairly imprecise, mainly be- cause of the low production, dispersal, and hence rep- resentation of some important pollen types (MacPhail and McQueen 1983) and the complex climatic patterns caused by the mountainous terrain and associated steep climatic gradients. Correlations between modern pollen
Markgraf et al. : Past atmospheric circulation in South Pacific
N _ I
~ adp,ne
] grassland-shrubland
takl, lowland-montane conilerous broadlear Iorest
_,}. scattered rotes1 areas
_ . - Present coaslhne
0 lOOkm L I
1 8 K
I I
170 175
170 I
1 2 K
I 175
197
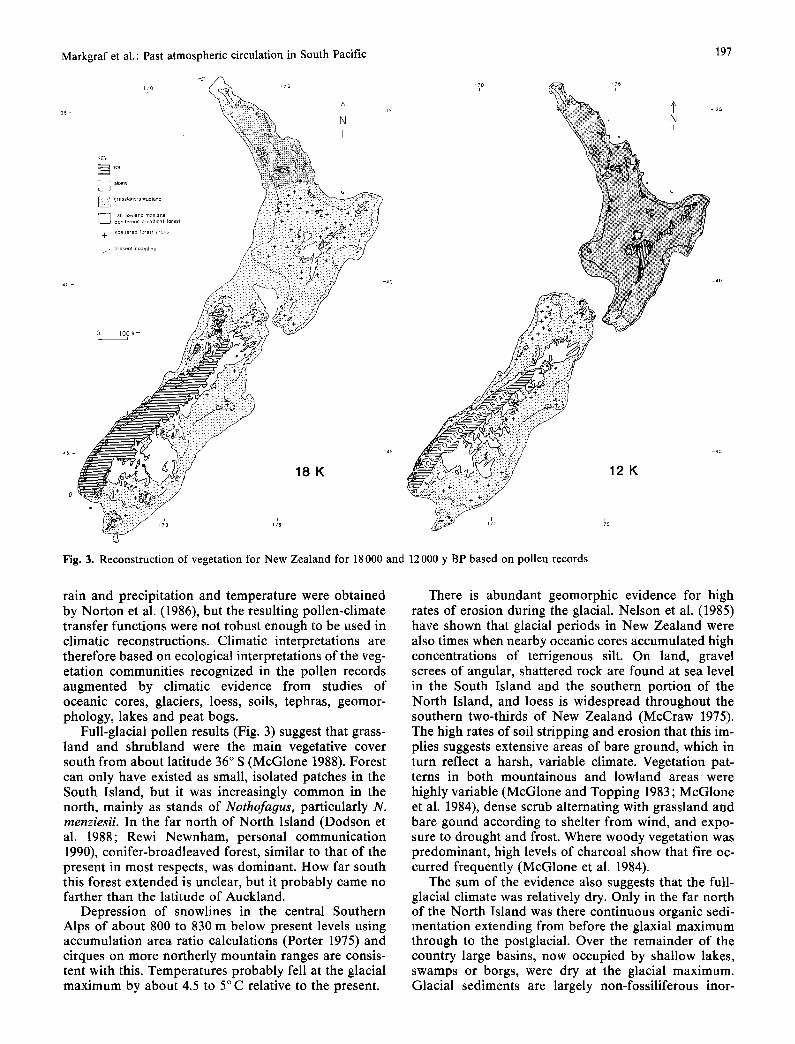
Fig. 3. Reconstruction of vegetation for New Zealand for 18 000 and 12 000 y BP based on pollen records
rain and precipitation and temperature were obtained by Norton et al. (1986), but the resulting pollen-climate transfer functions were not robust enough to be used in climatic reconstructions. Climatic interpretations are therefore based on ecological interpretations of the veg- etation communities recognized in the pollen records augmented by climatic evidence from studies of oceanic cores, glaciers, loess, soils, tephras, geomor- phology, lakes and peat bogs.
Full-glacial pollen results (Fig. 3) suggest that grass- land and shrubland were the main vegetative cover south from about latitude 36 ° S (McGlone 1988). Forest can only have existed as small, isolated patches in the South Island, but it was increasingly common in the north, mainly as stands of Nothofagus, particularly N. rnenziesiL In the far north of North Island (Dodson et al. 1988; Rewi Newnham, personal communication 1990), conifer-broadleaved forest, similar to that of the present in most respects, was dominant. How far south this forest extended is unclear, but it probably came no farther than the latitude of Auckland.
Depression of snowlines in the central Southern Alps of about 800 to 830 m below present levels using accumulation area ratio calculations (Porter 1975) and cirques on more northerly mountain ranges are consis- tent with this. Temperatures probably fell at the glacial maximum by about 4.5 to 5°C relative to the present.
There is abundant geomorphic evidence for high rates of erosion during the glacial. Nelson et al. (1985) have shown that glacial periods in New Zealand were also times when nearby oceanic cores accumulated high concentrations of terrigenous silt. On land, gravel screes of angular, shattered rock are found at sea level in the South Island and the southern portion of the North Island, and loess is widespread throughout the southern two-thirds of New Zealand (McCraw 1975). The high rates of soil stripping and erosion that this im- plies suggests extensive areas of bare ground, which in turn reflect a harsh, variable climate. Vegetation pat- terns in both mountainous and lowland areas were highly variable (McGlone and Topping 1983; McGlone et al. 1984), dense scrub alternating with grassland and bare gound according to shelter from wind, and expo- sure to drought and frost. Where woody vegetation was predominant, high levels of charcoal show that fire oc- curred frequently (McGlone et al. 1984).
The sum of the evidence also suggests that the full- glacial climate was relatively dry. Only in the far north of the North Island was there continuous organic sedi- mentation extending from before the glaxial maximum through to the postglacial. Over the remainder of the country large basins, now occupied by shallow lakes, swamps or borgs, were dry at the glacial maximum. Glacial sediments are largely non-fossiliferous inor-

198
i
KEY
1 Nothota~us reresI c o m m o n
~ I~ll, Iowland-moman~ conifer- broadleat Ioresl
~ inland conifer broadleal rarest
[ 1 ~ wet upland conirer-broadrear ror~sl shrubland
~ owland scrub
alpine
9 K
Markgraf et al.: Past atmospheric circulation in South Pacific
170 ~ T7 S
" a S
170 f75 170 175
3 K
Fig. 4. Reconstruction of vegetation for New Zealand for 9000 and 3000 y BP based on pollen records
ganic silts and gravels (McGlone and Topping 1983; Kennedy et al. 1978). In lowland sites in eastern South Island, a sparse vegetation cover of low growing plants points to dry, possibly saline conditions (Moar 1980), perhaps the equivalent of a precipitation drop of 40 to 50%. In wetter areas in the west of both islands, the presence of sclerophyll and small-leaved shrubland and the general absence of broadleaved species suggest either lower rainfall or more frequent drought.
Termination of the full-glacial period occurred at around 14.5 to 14 ka with a major retreat of glaciers (Suggate 1990) and rapid expansion of tall conifer- broadleaved forest in all but the southern and south- western sector of the North Island. Between 14 and 12 ka there was continued expansion of conifer-broad- leaved forest, low forest and shrubland, and mixed shrubland. By 12 ka (Fig. 3) tall conifer-broadleaved forest covered all but the southern tip of the North Is- land, pockets of broadleaved forest had established along the western coast of the South Island, and in nearly all localities tall shrubland-low forest was begin- ning to replace the full-glacial low shrubland-grassland communities.
This late-glacial revegetation was driven by a pro- nounced warming. By 12 ka average temperatures must have risen to within 2°C of those of the present (McGlone and Topping 1977). Widespread initiation of
wetlands and development of large, raised bog com- plexes at the same time in both the North and South Islands point to a concomitant increase in precipitation (McGlone 1990). However, precipitation was almost certainly lower than at present in many areas, and espe- cially in the east and south. The persistence of shrub- land-grassland communities until around 10 ka cannot be satisfactorily explained by lower temperatures and precipitation because if these are the only two factors considered, forest communities should have been more widespread in the south. McGlone (1988) argues that a continuation of irregular but devastating outbreaks of cold air from high latitudes, combined with overall lower precipitation and temperature, may have inhi- bited tall forest growth.
Between 10.5 and 9.5 ka, tall conifer-broadleaved forest expanded to cover the entire country, with the exception of central south-east South Island, which re- mained in dry grassland-shrubland, and the southwes- tern edge of the South Island, which was mainly domi- nated by tree-fern-rich broadleaved forest (Fig. 4). No- thofaous forest was highly restricted, and ferns and broadleaved plants characteristic of mild, moist cli- mates were abundant (McGlone 1988). As far as can be judged from very scanty evidence, treelines were either at or just below present-day levels, but definitely no higher than at present. Glaciers shrank to their smallest

Markgraf et al.: Past atmospheric circulation in South Pacific
area between 9 and 5 ka y (Gellatly et al. 1988). Aver- age annual temperatures may have been 1 to 1.5°C warmer overall (Hendy and Wilson 1968).
We therefore have an apparent discrepancy between our lines of evidence. On the one hand, the dominance of drought-intolerant vegetation in western and south- western South Island districts points to a wetter climate over a large part of the mainland. On the other, the ab- sence of wetlands in the east and the absence of forest in central southeastern South Island point to a climatic regime drier than at present. However, despite the evi- dence that there are drier climates overall in the east, the frequency of fire seems to have been less than at present. McGlone (1988) and Rogers and McGlone (1989) proposed that a combination of dry, mild wint- ers, and moist, cloudy summers could explain most of this pattern. Dry winters would not adequately re- charge groundwater, lakes and wetlands, but moist, cloudy growing seasons would favor the dominance of drought-sensitive trees in the west and prevent the oc- currence of severe summer moisture deficit in the east. A necessary component of this climatic model is the weakening of the present strong westerly wind flow over the southern two-thirds of New Zealand, and hence the diminution of strong foehn wind episodes in the east. If this was associated with a reduction in cy- clogenesis in the Southern Ocean, winter rainfall would have been lower, and the vigorous deep fronts needed to bring rain to central southeastern South Island would have been fewer than now. Overall then, New Zealand climates in the early postglacial were relatively less windy, milder, and drier in winter than at present.
The history of the mid-to late postglacial is of the expansion of forest types with more inherent drought resistance and/or tolerance of cold, disturbance, and poor soils, such as Agathis australis, Nothofagus, and Quintinia, and the retreat of species characteristic of mild, moist climates such as tree ferns and Ascarina lu- cida (McGlone 1988). At the same time, bogs and lakes spread in high altitude and eastern districts (McGlone 1990). By 6 ka, climate cooling was well advanced, al- though in absolute terms precipitation may have been at a Holocene peak. Glaciers began to expand again in the southern Alps (Gellatly et al. 1988) at around 5 ka. The climate cooled, probably by 1 to 1.5 ° C overall, but there is no evidence that the treeline has ever been higher than that at present. Cooler average annual tem- peratures at treeline may therefore have been balanced by increased summer solar radiation and clearer skies over the main mountain ranges (Rogers and McGlone 1989). These conditions may have favored tall Nothofa- gus dominant forest over the previous low forest-scrub communities. Fire became more frequent in the south, and in the driest districts natural fires around 2.5 ka began to replace previous sclerophyll scrub and low forest with open grassland. Relative to the early post- glacial, climates were cooler, more windy, more varia- ble, more continental and droughty, but probably wet- ter in winter.
199
Southern South America
The palynological records used for paleoclimatic re- construction are located between latitudes 35 ° and 55 ° S, east and west of the Andes, and represent many different environments today from deserts, subtropical woodlands, warm-temperature deciduous forests, cool- temperate rainforests to moorland, subalpine deci- duous forests, and steppe. These environments are pri- marily related to precipitation seasonality and precipi- tation gradients, both across the Andes and from north to south. The seasonality of precipitation is a reflection of seasonally shifting atmospheric circulation patterns, the monsoonal pattern east of the Andes north of lati- tude 35 ° S, the El Nifio/Southern Oscillation pattern, primarily west of the Andes at low latitudes, and the storm tracks of the southern westerlies south of 35 ° S. To varying degrees, and complicated by the mountai- nous terrain, all are linked to the seasonal changing po- sition and strength of the subtropical high-pressure cells in the Pacific and Atlantic oceans, which in turn are related to the seasonally changing pole/equator thermal gradient, related to the changing extent of the Antarctic sea ice. Thus, reconstruction of circulation patterns and their shifts in the past on a subcontinental scale is based on comparison of paleoclimatic informa- tion of records distributed across the major climate gra- dients.
Thirty palynological records have been examined for southern South America, most of them located within the Andean forest region, east and west of the Andes. Only at mid-latitudes, however, do records ex- tend back in time to the full-glacial. Information on full-glacial climates from high latitudes are conse- quently extrapolated from the oldest samples available. A review of the paleoecological evidence from all pub- lished records is the basis of this present discussion (Markgraf 1989a, 1991a). The major steps that led from full-glacial to the present interglacial conditions oc- curred synchronously within the radiocarbon dating control at 14, 12.5, 9.5, and 5/3 ka in all records along the latitudinal band.
At mid-latitudes prior to 18 ka, glaciers had ex- panded into the lowlands on both sides of the Andes primarily as valley glaciers (Caldenius 1932; Mercer 1984; Rabassa and Clapperton 1990). At the latitudes of the Patagonian ice fields, ice was most extensive, probably forming an ice shield, with outlet glaciers de- scending to below modern-day sea level. Snowline de- pression ranged from over 1000 m at latitude 40°S to less than 500 m at latitude 55°S (Garleff and Stingl 1988).
Full-glacial conditions apparently lasted until 14 ka throughout the whole region, expressed by predomi- nance of vegetation types more arid than today (Fig. 5). In south-central Chile (latitude 38 ° to 42 ° S) woodland, dominated by Nothofagus dombeyi, Myrtaceae, and conifers (Podocarpus, Fitzroya) in the arboreal stratum expanded, and there were substantial amounts of open ground and steppe taxa in the non-arboreal stratum (Markgraf 1989b). North of latitude 42 ° S, Andean veg-

200
etation and some of the montane tree taxa (e.g. Prum- nopitys andina) occurred at lower elevations than to- day, descending by at least 600 m. This indicates that the increased effective moisture of the lower latitudes may be related to temperatures of a minimum of 4°C cooler than today (Markgraf 1989b). On the other hand, increased precipitation may also have played a role. This precipitation, however, could not have been re- lated to the southern westerly storm tracks, because the presence of steppe taxa just to the south in the Chilean lake district indicates seasonal moisture stress (Mark- graf 1989b). The subtropical greater moisture could in- stead be related to the winter rain anomalies, such as those occuring during E1 Nifio events or during times when the subtropical high pressure is positioned ano- malously far to the south (Markgraf 1983). East of the Andes and south of latitude 50°S environments were treeless during full-glacial times, dominated by steppe- scrub at mid-latitudes and by heath-grasslands at high latitudes. This implies substantially drier conditions and probably also frequent cold-air incursions from the south, related to the far closer location of Antarctic sea- ice and occurrence of high-pressure ridges that join with the poleward-placed Pacific high-pressure cell.
At 43°S latitude, however, full-glacial conditions must have been as wet or wetter and substantially stor- mier than today, evidenced by expansion of moorland vegetation to lower elevations (Villagran 1988). This was interpreted to indicate the full glacial location of the westerly storm tracks.
The paleoclimatic implications are that there was lit- tle seasonal shift in circulation. The northern and southern margin of the westerlies were compressed and intensified, the former having shifted poleward and the latter equatorward, respectively. This compression was in response to the steepened pole/equator temperature gradient. In the zone where the gradient was steepest, the storm tracks would be located. Compared to their
Markgraf et al.: Past atmospheric circulation in South Pacific
present location, especially in winter, evidence suggests that the storm tracks were shifted polewards by about 5 ° latitude (Markgraf 1989b). Greater intensity also translates into greater windiness, for which there is pal- eoenvironmental evidence, not only from mainland South America, but also from Antarctica, shown by the high dust content found in the Antarctic ice cores prior to 14 ka (DeAngelis et al. 1987).
At 14 ka moisture conditions began to change. At mid-latitudes, west of the Andes open ground and steppe indicators disappeared and the forest, although composed of the same taxa as before, became more closed. Moorland vegetation disappeared from the re- cords at 43 ° S, not to reappear until 9.5 ka farther south at latitude 50 ° S. East of the Andes grasses replaced the steppe-scrub vegetation. At high latitudes, peat bog growth began at many sites. By 14 ka glaciers had begun to retreat rapidly without readvancing into the pre-Andean lowlands (Mercer 1984; Ashworth and Markgraf 1989). The overall paleoclimatic implication calls for less severe conditions than before, higher tem- peratures and lower wind intensity, and less frequent cold fronts. Precipitation must have increased, propor- tionally more at mid-latitudes than at high latitudes.
At 12.5 ka (Fig. 5) paleoenvironmental changes were far more substantial than at 14 ka. Montane elements disappeared from the lowlands at latitude 37 ° S, cool- temperate north Patagonian forests expanded in the Chilean lowlands and east of the Andes from mid-lati- tudes south to latitude 50 ° S. This suggests that between latitudes 40 ° and 50 ° S modern temperature and preci- pitation levels were reached by that time. South of 50 ° S, in contrast, environments continued treeless, al- though replacement of arid heath environments by her- baceous grassland indicates slightly higher precipita- tion - however, a less substantial increase than at lower latitudes. This indicates that the westerly storm tracks brought moisture uniformly throughout the year to the
1 2 k 18 k rs ,M
j S, ,~.~. M ' . B A . ~ .
,oo . s-- 0os ,oo - ".:.'. i - ~ . . 7 :
• '.'. - - 4 5 S
~ ,,., ....,,, .'.",' ~ Nolhofaous dornbeyl woodland
," I
Fig. 5. Reconstruction of vegetation for southern South America for 18000 and 12000 y BP based on pollen records

Markgraf et al. : Past atmospheric circulation in South Pacific 201
"¢: M 9 k *+. M 3 k • + -
:]]. [ ] Shrubland ~.'.
40 °-- 40°,,.. :.'.
77 Warm lernperata Nothofagus forest ::::-~JJ//~, -- 45°S
450-- ) FTA O°°'-'emperale N°lh°|aOua f°r es | 45 °- .... ":":~/~/.~ ? ~ Valdlvlan ralnforo6l I
' iii!-ii- 50% ~ N o r t h Patagonlan/Magellanic ralnlorest 500-- J i 50°-- " '""" ~ [ ] Pataoonian steppe .
I ~ Magallanlc moorland
55 °--- ~55°S [ ] Heath 55 °--
] G l a c i e r s
Fig. 6. Reconstruction of vegetation for southern South America for 9000 and 3000 y BP based on pollen records
BA,,
-- 40°S
-- 45°S
50%
5 5°5
--35°S
mid-latitudes only, without the storminess that at least seasonally characterizes the storm tracks today.
By 9.5 ka (Fig. 6) the subantarctic high latitudes also experienced a shift to Holocene conditions, represented by expansion of sub-Antarctic forest elements. These forests, however, were still relatively open, both east and west of the Andes, suggesting less effective mois- ture than today and absence of the modern precipita- tion gradient across the Andes. The mid-latitudes be- tween 40 ° and 45 ° S, showed instead a decrease in pre- cipitation, indicated by the expansion of warm temper- ate Valdivian forest elements such as Weinrnannia. Ex- pansion of moorland vegetation in the southern Chi- lean channels points to the region with maximum preci- pitation and windiness. This implies that the westerly storm tracks had intensified to levels comparable to to- day and focused at higher latitudes than before.
These conditions lasted until 5 ka at low and mid- latitudes, but only until 6 ka at high latitudes. There, for about 1000 years moorland vegetation disappeared at latitude 50 ° S, and steppe and open forest expanded in Tierra del Fuego, all indicating sustantially drier condi- tions.
After 5 ka modern regional patterns of vegetation became established, which were far more regionally diverse than before (Fig. 6). In subtropical latitudes de- sert and woodland vegetation developed that thrives on a combination of winter and summer precipitation. Overall winter precipitation along the northern margin of the storm tracks had become more predictable than before, based on the relatively highest forest density re- corded for that region at that time (Villagran and Var- ela 1990; Markgraf 1987). South of latitude 37 ° S winter precipitation was somewhat less than before, and tem- peratures were lower than before with more frequent
cold fronts, judging from the increased importance of conifers such as Austrocedrus, and Fitzroya in the vege- tation. At high southern latitudes (south of latitude 50 ° S) the greater closeness of the forests suggests a les- sening of the summer moisture stress, related to higher precipitation and/or lower temperatures, especially during summer. Glaciers in many areas showed neogla- cial advances, also indicating increased precipitation and lower temperatures (Mercer 1984). All this implies that storm tracks had begun to shift seasonally far more widely than before, resulting in well-defined regions of winter (north) versus summer (south) precipitation maxima, with somewhat more variable (less predicta- ble) precipitation in the intermediate regions. It may also point to the increased frequency of E1 Nifio/ Southern Oscillation events that bring moisture to lower latitudes, in particular to central Chile (Pittock 1980; Aceituno 1988; Kiladis and Diaz 1989).
Discussion
Boundary conditions for 18 ka
During full-glacial times many of the environmental and climatic boundary conditions were substantially different from today. 1. Mountain glaciers in New Guinea, southern Austra- lia, Tasmania, New Zealand, and South America were greatly expanded (CLIMANZ 1983; Mercer 1984). Snowline depressions were relatively greater in low lati- tudes than in high latitudes, ranging from 1100 m in New Guinea and in mid-latitudes in South America, to 850 m in southeastern Australia and New Zealand, and to 500 m in southernmost South America (Garleff and Stingl 1988). The Antarctic ice sheet was grounded

202
farther sea-ward from today, filling e.g., at least in part the Ross Embayment (Denton et al. 1989) and the grounding line around the South Shetland Islands (lati- tude 62 ° S) reached a water depth of about 250 m below present sea level (Herron and Anderson 1990). Floating ice shelves extended to about latitude 58°S (Johnson and Andrews 1986) with the greatest equatorward ex- tension in the Australian/New Zealand sector (CLI- MAP 1981). 2. A global fall of sea levels of around 120 m exposed most of the Sahul shelf (Aharon and Chappell 1986) and expanded the size of the Sunda islands to the west. To the south, the land area of Australia-New Guinea and New Zealand expanded by about 30% and 50%, re- spectively. South America showed large increases in exposed land area, primarily along the Atlantic coast, but also along the southwestern Pacific coast of what today is the Chilean channel region (CLIMAP 1981). 3. CO2 values during full-glacial times (13 to 30 ka) were about 50% of modern based on ice core analyses from Greenland and Antarctica (Oeschger et al. 1984). Although the mechanisms causing these fluctuations in CO2 are not yet understood, the effect on global tem- perature and global radiation budget is highly signifi- cant. Because the CO2 increase at 13 ka appears to pre- cede the oxygen isotope change, it is likely that it con- tributed substantially to the establishment of the post- glacial climates. 4. Sea surface temperature estimates provided by the CLIMAP project (1981) are shown to have been de- pressed by only 1 ° C in the Sunda-Sahul region, i.e., re- mained close to present-day temperatures, while in mid-latitudes they were depressed by 2 ° to 4 ° C. Rind and Peteet (1985) pointed out the discrepancy between the CLIMAP SST estimates and proxy paleoclimatic evidence from the tropics. For instance, snowlines were depressed by at least 1700 m in the New Guinea-Sahul region, and other terrestrial evidence suggests a 5-6°C cooling as well, in addition to extreme events such as severe icing, high winds and drought (Hope 1989). Rind and Peteet (1985) also showed that GCMs utilizing the CLIMAP (1981) estimates both fail to cool the Earth and to reduce the tropical hydrological cycle suffi- ciently to permit the observed tropical aridity. Attempts to reconcile depressions of snowlines by 800-1000 m while retaining adjacent ocean surfaces only a little cooler than at present have failed (Webster and Streten 1978; Smith 1989).
Aharon (1983) showed that sea surface temperatures in north-eastern New Guinea had fallen by 3 ° C during an interstadial immediately prior to the last glacial maximum, and that temperature depressions of up to 6°C had occurred during earlier stadials during the last glaciation. Given the concordance of Aharon's data with independent estimates from depressed treelines and glacial limits, we will assume that the CLIMAP SSTs are incorrect for the tropics and that a depression of both terrestrial and ocean surface temperatures of between 4 and 6°C prevailed during the last glacial maximum.
Markgraf et al.: Past atmospheric circulation in South Pacific
5. The seasonal cycle of insolation in the southern hemisphere closely approximated that of the present at 18 ka. High summer insolation contrasted with low winter insolation. However, insolation was substan- tially lower than today during the southern spring sea- son (August to October) and Kukla (1979) suggested that this could probably explain the more permanent sea-ice cover around Antarctica at full-glacial times.
Proxy climatic evidence for 18 ka
All latitudes and all places in the southern hemisphere show drier conditions than at present with the possible exception of far northern New Zealand and western South America at 43 ° S. In these two regions, precipita- tion may have been as high as at present, indicating the location of the storm tracks. In northern Queensland and the Chilean lake district there was at least a 50% reduction in precipitation at this time. Lowered precipi- tation is one of the preconditions for increased erosion, for production of windblown silts, and for mobilization of sand dunes. Sand dune fields in Australia were ac- tive as this time, and New Zealand has several exam- ples of sand dune mobilization. Loess was widespread in eastern New Zealand. A major eolian episode oc- curred in the the loess province of the Argentine pam- pas prior to 11 ka (Zarate and Fasano 1989). In addi- tion to lowered precipitation, aeolian activity also de- pends on greater windiness. Wasson (1989) has calcu- lated that sand-shifting winds increased by at least 20% during the last glacial maximum (LGM). Over southern and central New Zealand winds are thought to have been much stronger during the LGM from the evidence of sand dunes, loess, and ocean productivity (Thiede 1979). In South America the westerlies belt was com- pressed as both its northern and southern border had shifted closer, which resulted in greater intensity of the winds and focusing of the storm tracks year round in the latitudinal band between 43 and 50 ° S. Dust accu- mulation in Antarctic ice cores is high prior to 14 k, indicating substantially greater eolian activity than to- day (Thompson and Mosley-Thompson 1981; DeAnge- lis et al. 1987).
Full-glacial temperatures must also have been lower based on evidence from New Guinea, Australia, and New Zealand, where the present continuous timberline forests appear to have both been lowered and frag- mented as alpine-appearing grasslands and shrnblands expanded greatly (Hope 1989; Kershaw 1981). In South America at lower latitudes, montane forest elements de- scended into the lowlands. In addition, there is eviden- ce for severe geomorphic change such as permafrost ac- tivity in all areas, reflecting depression of mean annual temperatures and irregular intrusion of southern cold air masses, with accompanying strong radiation frosts, particularly in eastern New Zealand (McCraw 1975) and southern Patagonia (Corte and Beltramone 1984).
Thus, the vegetational and geomorphic evidence is consistent with enhanced continentality, i.e., enhanced daily and seasonal temperature fluctuations relative to the present.

Markgraf et al. : Past atmospheric circulation in South Pacific
Paleocirculation reconstruction for 18 ka
The interannual climate variations of most of the coun- tries surrounding the South Pacific are related to the E1 Nifio-Southern Oscillation phenomenon (see, for in- stance, McBride and Nicholls 1983; Gordon 1986; Ro- pelewski and Halpert 1987, 1989; Aceituno 1989; Kila- dis and Diaz 1989). The dominant effect of El Nifio- Southern Oscillation in this region has led some to con- sider how it might have operated in previous eras, based on paleoclimatic data. Quinn (1971) suggested that lowered sea levels during the last glacial would have arrested the E1 Nifio-Southern Oscillation in its high index or La Nifia phase (when the east equatorial Pacific is in drought but the west Pacific receives co- pious rains). Colinvaux (1972) also concluded that E1 Nifio-Southern Oscillation would have been stuck in the high index phase, relying on evidence that the Gal- apagos Islands were much drier than present during the glacial. These islands currently receive heavy rainfall during the low index (El Nifio) phase of the E1 Nifio- Southern Oscillation. Pittock and Salinger (1982) sug- gested that New Zealand paleoclimatic data indicated that E1 Nifio-Southern Oscillation would have been in its high index phase during the maximum Holocene warming of around 9 ka.
The arguments that the E1 Nifio-Southern Oscilla- tion was stuck in one or other of its extremes during any particular epoch are not compelling for several rea- sons. Firstly, the reasoning of Quinn and Colinvaux that the E1 Nifio-Southern Oscillation was stuck in its high index during the glacial maximum appear to con- tradict the Salinger-Pittock proposal that it was in this phase during a warm period. It seems unlikely that the phenomenon would be arrested in the same extreme in two periods of opposite global temperature anomaly.
Secondly, each of these studies examined the paleo- climate evidence from only a small portion of the re- gion strongly affected by the E1 Nifio-Southern Oscilla- tion. Since the E1 Nifio-Southern Oscillation is really a "see-saw" between the west and east Pacific, the evi- dence from both sides of the ocean should be consid- ered before a conclusion is reached about the behavior of the E1 Nifio-Southern Oscillation. Thus, as pointed out above and in Webster and Streten (1978), Australia and New Guinea was dry at the glacial maximum. This is exactly the opposite to what would be expected if the E1 Nifio-Southern Oscillation were stuck in its high in- dex phase (heavy rains usually occur over Australia and New Guinea in this phase, e.g., Nicholls 1973 ; McBride and Nicholls 1983).
The final reason suggesting that it is not profitable to consider in which phase the El Nifio-Southern Oscil- lation was arrested in earlier times relies on recent evi- dence about the nature of the E1 Nifio-Southern Oscil- lation phenomenon. Several studies (Nicholls 1979, 1984; Meehl 1987; Rasmusson et al. 1990; Barnett 1991) have indicated that the E1 Nifio-Southern Oscilla- tion is a truly oscillatory phenomenon, as well as being a "see-saw" across the Pacific. These studies indicate that the El Nifio-Southern Oscillation has an underly-
203
ing biennial time scale. The concept of an oscillation becoming stuck at one extreme appears as unlikely as a pendulum sticking at one extreme of its arc. It seems possible for an oscillator to change its amplitude or fre- quency, or even to stop operating completely, but not to stick at one extreme. Also, the biennial signal operates on top of the climatological mean, causing the climate to fluctuate about the mean. The El Nifio-Southern Os- cillation's characteristic biennial time-scale means that most paleoclimatic evidence, which rarely has suffi- cient detail to resolve a biennial signal, would not be able to detect changes in the El Nifio-Southern Oscilla- tion signal. Any change in precipitation, for instance, discernible in paleoclimatic evidence is more likely to represent changes in the climatological mean rather than the high-frequency E1 Nifio-Southern Oscillation fluctuations.
If the idea of the E1 Nifio-Southern Oscillation stick- ing in one of its extremes was supportable and could be applied to previous eras, this could simplify the deriva- tion of circulation patterns during these eras. However, since this does not seem to be a profitable approach, different methods are needed. One approch would be to derive statistical relationships between regional cir- culation patterns and rainfall and temperature anomal- ies. Thus, the anomalies in the atmospheric circulation over the western South Pacific could be related to tem- perature and rainfall anomalies, using modern data from the region. Then the glacial circulation, for in- stance, could be derived from applying these specifica- tion equations to paleoclimatic evidence of rainfall and temperature anomalies. The same approach could be used in the east Pacific to indicate the atmospheric cir- culation likely to have existed there during the same pe- riod, using South American paleoclimatic data.
Unfortunately, for most of the South Pacific, the prerequisite specification equations between modern atmospheric regional circulation and temperature and precipitation anomalies have not been derived. This is partly because of the dominance of the E1 Nifio-South- ern Oscillation, which has concentrated attention on this phenomenon. There have been, however, a number of studies of the El Nifio-Southern Oscillation and re- gional circulation anomalies, and also between the E1 Nifio-Southern Oscillation and rainfall and tempera- ture anomalies. If the pattern of temperature and preci- pitation anomalies in a previous era (e.g., 18 ka) in a particular region were similar to those in one phase of the El Nifio-Southern Oscillation during modern times, we might conclude that the mean regional circulation in the earlier era was similar to that of the particular ex- treme phase of the El Nifio-Southern Oscillation in modern times.
This would not necessarily or even probably lead us to conclude anything about the behaviour of the El Nifio-Southern Oscillation during the earlier era. The relationship with the El Nifio-Southern Oscillation is used simply as an intermediary step in deducing likely patterns of regional atmospheric circulations in the ear- lier era. Of course, this approach assumes that the mean circulation of the earlier era was similar to the present-
204
day circulation, so that a present-day circulation ex- treme could be a feasible analogue for the earlier circu- lation. Also, the approach can only work for regions and eras when the pattern of rainfall and temperature anomalies is indeed similar to that of one of the El Nifio-Southern Oscillation extremes.
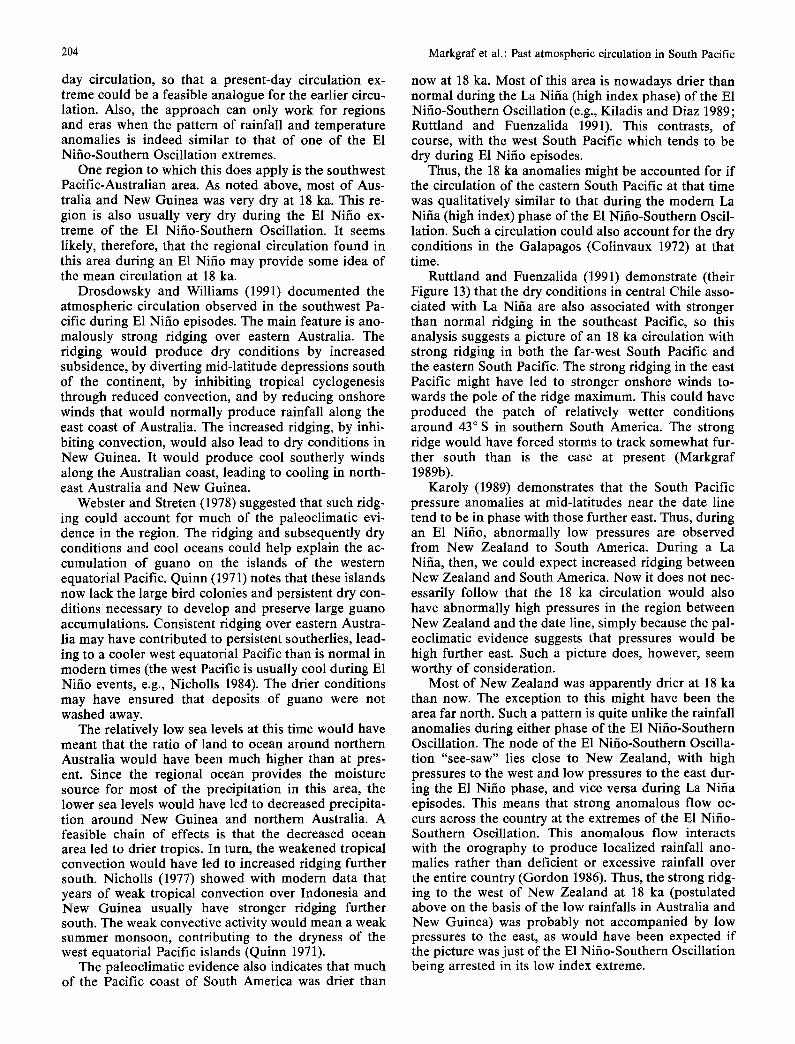
One region to which this does apply is the southwest Pacific-Australian area. As noted above, most of Aus- tralia and New Guinea was very dry at 18 ka. This re- gion is also usually very dry during the E1 Nifio ex- treme of the E1 Nifio-Southern Oscillation. It seems likely, therefore, that the regional circulation found in this area during an E1 Nifio may provide some idea of the mean circulation at 18 ka.
Drosdowsky and Williams (1991) documented the atmospheric circulation observed in the southwest Pa- cific during E1 Nifio episodes. The main feature is ano- malously strong ridging over eastern Australia. The ridging would produce dry conditions by increased subsidence, by diverting mid-latitude depressions south of the continent, by inhibiting tropical cyclogenesis through reduced convection, and by reducing onshore winds that would normally produce rainfall along the east coast of Australia. The increased ridging, by inhi- biting convection, would also lead to dry conditions in New Guinea. It would produce cool southerly winds along the Australian coast, leading to cooling in north- east Australia and New Guinea.
Webster and Streten (1978) suggested that such ridg- ing could account for much of the paleoclimatic evi- dence in the region. The ridging and subsequently dry conditions and cool oceans could help explain the ac- cumulation of guano on the islands of the western equatorial Pacific. Quinn (1971) notes that these islands now lack the large bird colonies and persistent dry con- ditions necessary to develop and preserve large guano accumulations. Consistent ridging over eastern Austra- lia may have contributed to persistent southerlies, lead- ing to a cooler west equatorial Pacific than is normal in modern times (the west Pacific is usually cool during E1 Nifio events, e.g., Nicholls 1984). The drier conditions may have ensured that deposits of guano were not washed away.
The relatively low sea levels at this time would have meant that the ratio of land to ocean around northern Australia would have been much higher than at pres- ent. Since the regional ocean provides the moisture source for most of the precipitation in this area, the lower sea levels would have led to decreased precipita- tion around New Guinea and northern Australia. A feasible chain of effects is that the decreased ocean area led to drier tropics. In turn, the weakened tropical convection would have led to increased ridging further south. Nicholls (1977) showed with modern data that years of weak tropical convection over Indonesia and New Guinea usually have stronger ridging further south. The weak convective activity would mean a weak summer monsoon, contributing to the dryness of the west equatorial Pacific islands (Quinn 1971).
The paleoclimatic evidence also indicates that much of the Pacific coast of South America was drier than
Markgraf et al.: Past atmospheric circulation in South Pacific
now at 18 ka. Most of this area is nowadays drier than normal during the La Nifia (high index phase) of the El Nifio-Southern Oscillation (e.g., Kiladis and Diaz 1989; Ruttland and Fuenzalida 1991). This contrasts, of course, with the west South Pacific which tends to he dry during E1 Nifio episodes.
Thus, the 18 ka anomalies might be accounted for if the circulation of the eastern South Pacific at that time was qualitatively similar to that during the modern La Nifia (high index) phase of the El Nifio-Southern Oscil- lation. Such a circulation could also account for the dry conditions in the Galapagos (Colinvaux 1972) at that time.
Ruttland and Fuenzalida (1991) demonstrate (their Figure 13) that the dry conditions in central Chile asso- ciated with La Nifia are also associated with stronger than normal ridging in the southeast Pacific, so this analysis suggests a picture of an 18 ka circulation with strong ridging in both the far-west South Pacific and the eastern South Pacific. The strong ridging in the east Pacific might have led to stronger onshore winds to- wards the pole of the ridge maximum. This could have produced the patch of relatively wetter conditions around 43°S in southern South America. The strong ridge would have forced storms to track somewhat fur- ther south than is the case at present (Markgraf 1989b).
Karoly (1989) demonstrates that the South Pacific pressure anomalies at mid-latitudes near the date line tend to be in phase with those further east. Thus, during an E1 Nifio, abnormally low pressures are observed from New Zealand to South America. During a La Nifia, then, we could expect increased ridging between New Zealand and South America. Now it does not nec- essarily follow that the 18 ka circulation would also have abnormally high pressures in the region between New Zealand and the date line, simply because the pal- eoclimatic evidence suggests that pressures would be high further east. Such a picture does, however, seem worthy of consideration.
Most of New Zealand was apparently drier at 18 ka than now. The exception to this might have been the area far north. Such a pattern is quite unlike the rainfall anomalies during either phase of the E1 Nifio-Southern Oscillation. The node of the El Nifio-Southern Oscilla- tion "see-saw" lies close to New Zealand, with high pressures to the west and low pressures to the east dur- ing the E1 Nifio phase, and vice versa during La Nifia episodes. This means that strong anomalous flow oc- curs across the country at the extremes of the El Nifio- Southern Oscillation. This anomalous flow interacts with the orography to produce localized rainfall ano- malies rather than deficient or excessive rainfall over the entire country (Gordon 1986). Thus, the strong ridg- ing to the west of New Zealand at 18 ka (postulated above on the basis of the low rainfalls in Australia and New Guinea) was probably not accompanied by low pressures to the east, as would have been expected if the picture was just of the E1 Nifio-Southern Oscillation being arrested in its low index extreme.

Markgraf et al. : Past atmospheric circulation in South Pacific
Webster and Streten (1976) also proposed that a strong through over the New Zealand area was needed to generate strong southerlies along the Australian coast to produce strong cooling around New Guinea. In fact, such southerlies, slightly weaker, would still oc- cur without the strengthened trough east of New Zea- land, as long as the strong ridge over eastern Australian extended well into the Tasman and Coral Seas.
The most obvious circulation pattern of the east of New Zealand that could lead to drier conditions across most of the country would be increased ridging, accom- panying that to the west. If the ridging was situated in this area, it could even explain the wetter conditions in the far north of the country at 18 ka. In the south of the country, the ridging right across these longitudes would cause depressions to track further south than now. The northeasterly winds on the north-west edge of the ridge located to the east of New Zealand, however, could tend to bring warmer, moister air from farther north onto the northern parts. Thus, rainfall might be relatively high here, while remaining low elsewhere.
Present-day mean circulation of the South Pacific at- mosphere shows a broad trough east of New Zealand (e.g., Le Marshall et al. 1985). Such a trough, if intensif- ied as is often the case during E1 Nifio episodes, would lead to stronger southwesterly flow across New Zea- land. This would lead to drier conditions in the east of the country, with wetter conditions on the west coast. Anomalously strong ridging to the east of New Zealand would weaken the South Pacific trough and shift the position of the South Pacific convergence zone.
The increased ridging to the east of New Zealand could also mean that the trades were stronger across most of the east and central Pacific, as proposed by Quinn, to explain the guano deposits on the western equatorial Pacific islands. These stronger trades would lead to a strengthening and westward extension of the cold sea-surface temperature belt and equatorial up- welling. The upwelling of nutrients would help support the large bird population. The cool waters would fur- ther dry these islands. Thus, both the high pressure re- gion in the east Pacific and the decreased convection in the west Pacific due to the larger relative area of land could be implicated in the relative dryness of the west- ern equatorial Pacific islands.
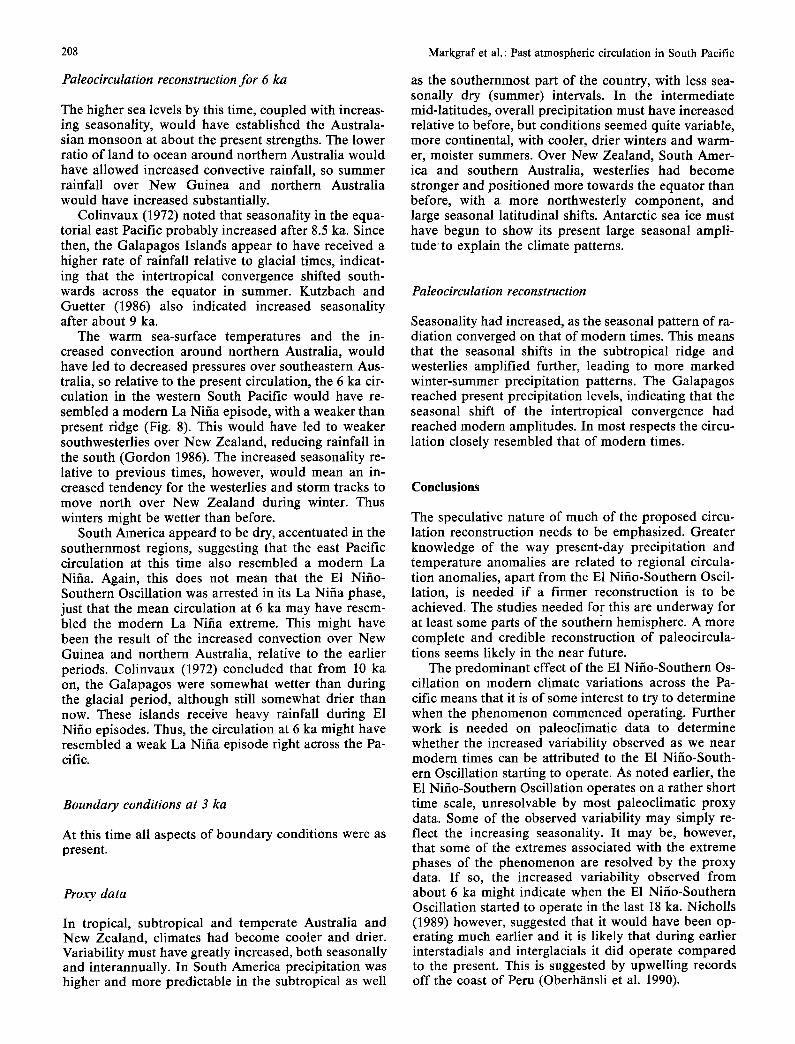
The atmospheric circulation picture (Fig. 7) that emerges from these considerations is one of increased ridging at subtropical and middle latitudes across the South Pacific. Numerical model studies of the atmos- pheric response to equatorial sea surface temperature anomalies also tend to support such a picture (e.g., Voice and Hunt 1984). When cooler than normal sea- surface temperatures are inserted in numerical models of the atmosphere, increased pressures usually occur, over and towards the pole of the temperature anomaly. There seems to be little doubt that the equatorial Pa- cific was cooler at 18 ka than now. Even a small de- crease in equatorial sea surface temperature could lead to increased ridging to the south. The effect of the equatorial temperatures on the circulation further south would likely be to overwhelm any local atmospheric re-
205
,,oow 1 8 K
' " " " 120 *W 180 ,E " . ' " -. ' .
• .. . . . - , .. . . .' ....
. . . . . . " - , .,... . . & ... ' . . . . _ ..: . . . . . . . . . . .
. . • . . . . . - ~ , , ~ . " " . . ~ . . . . ~ i , I
. , : . . , , - . . ~ - t ~ x ~ " - ' ~ =9o .w ~SO'E " - ' " ~ . . . "~ , - . , . / , , " ~ . X ~ ' . ...- 't~,-./..-,, ~/ ~..~ . . . F r ' - ~ , . . .~ "-"~."~ .......... ....
..."1/~ \ ! . t7. ..... i . " " ' , ..-} .:-.*'id..::.:... ~ ....
,~o°~ ~', ..... • i .... <, ',i.... ~...--....-.
• " ' , . ..... . ' / . ......... i ........ ' . "
1 2 K 150*W
" ' i . . . . . . . . .
. . ' . . , . 1200W 180 "E .. • . . ..
. . : • . .
" . " . . . . . . . . . . . . . i " " ' - ' . , ' . • ~.., .. i : ,,~" 7".~ ~
- -~: ~" . . '. / .,,q,~% l~ . . " ~ \ ' . 150*E ' " - " - - " ' " " ~ , I ~ ' h "~ -~ - ' ~ ~1 " " " L~ " .O0=W
......, ...... .... . . . . . . ...
: - . " ~A - ~ i . *~". . \ .
120 "E : ' I ~ ~ " : : \ iJ -
"........"
Fig. 7. Reconstruction of prevailing atmospheric circulation pat- terns for the South Pacific for 18 000 and 12000 y BP. Dashed lines represent the present position of high- and low-pressure cells; dot- ted line around Antarctica represents postulated sea-ice limit
sponse to the cool sea-surface temperatures farther south.
A piece of paleoclimatic evidence that does not ap- pear to fit with the picture of increased ridging right across the south Pacific is the lack of increased up- swelling along the South American coast at 18 ka (Oberh~nsli et al. 1990). A stronger ridge in the south- east Pacific should presumably lead to increased up- swelling because of the stronger southerlies over the coastal ocean. It may be, however, that the increased ridging did not lead to stronger southerlies everywhere along the coast. Upswelling might be stronger in only the parts of the coastal ocean where the southerly winds were stronger.
Apart from this possible exception, increased ridg- ing right across the South Pacific appears to explain the available paleoclimatic evidence. Further tests of the hypothesized circulation could be made as new evi- dence becomes available. For instance, evidence from South Pacific islands, which also have specific climate anomalies during El Nifio and La Nifia episodes, would be an obvious source for 18 ka data to check the hypothesized circulation.

206 Markgraf et al.: Past atmospheric circulation in South Pacific
Boundary conditions at 12 ka
Mountain glaciers had essentially receded to their mod- ern limits at 12 ka. Antarctica's floating ice shelves are thought to have been greatly reduced as well (Johnson and Andrews 1986), although data from the Ross Shelf and the South Orkney Plateau (Denton et al. 1989; Her- ron and Anderson 1990) indicate that only after 9 ka did the rising sea level begin to substantially accelerate the recession of the grounding line of Antarctica's ice sheet.
The sea level had been rising since 15 ka but levels were still at least - 7 0 m at 12 ka (Fairbanks 1989). In the Australasian region, the sea level stood at about - 4 0 m. The Sunda-Sahul land area had begun to re- duce in size, but New Guinea remained connected with Australia, whereas Tasmania became isolated and New Zealand's North and South Island separated. Sea sur- face temperatures in the southern oceans were close to the modern ones (Hays et al. 1976; Labracherie et al. 1990). Southern hemisphere mean isolation was close to the inverse of that of the present, with 4% less in sum- mer, throughout the southern hemisphere, and 3 to 6% more in winter, primarily towards the equator at lati- tude 40 ° S.
Proxy evidence for 12 Ira
Everywhere wind intensities had decreased and temper- atures were coming up to near the Holocene levels. Pre- cipitation increases, however, were far less consistent. Throughout the Australian region the increase in tem- peratures outpaced increasing precipitation and high evaporation resulted in minimum effective moisture.
New Zealand temperatures and precipitation both increased, but did not reach modern levels, especially in the east and south. Outbreaks of cold air continued into lower latitudes. Between latitudes 40 ° and 45 ° S in South America, climates were moist temperate, without seasonal moisture stress. North of this zone in the sub- tropical latitudes, however, temperatures increased without equivalent precipitation increase, resulting in substantial seasonal moisture stress. South, in the sub- antarctic latitudes, both temperature and precipitation increased only marginally and cold air outbreaks con- tinued.
about 40 ° and 45 ° S. This could have resulted in in- creased precipitation at these latitudes, with more arid climates elsewhere. The stronger ridging would be re- flected as reduced cyclogenesis and more southerly storm tracks relative to today. Kutzbach and Guetter (1986) found, in a model simulation of climates since 18 ka, that ridging was strongest in the southern hemis- phere at 12 ka.
Reduced seasonality in the southern hemisphere, a result of changes in insolation (Kutzbach and Guetter 1986), would have meant that the stormtracks did not shift as far seasonally as they do today. This would be reflected in weaker seasonality of precipitation at most locations, relative to both today and 18 k. The weaker seasonality probably ensured that the intertropical con- vergence zone remained north of the Galapagos Islands throughout the year. This zone at present moves south, bringing rainfall to the islands, at the peak of summer. A weaker "summer" circulation would probably restrict its southwards excursions (Colinvaux 1972).
Boundary conditions at 9 ka
By 9 ka, warmer oceans surrounded the southern re- gions of Australia and all of New Zealand. In the In- dian Ocean, Hays et al. (1976) and Labracherie et al. (1990) report the warmest SSTs at about this time. Sea ice was probably at its minimum, and the grounding line of Antarctic ice sheets must have been close to the present, primarily because of the rising sea level (Den- ton et al. 1989). Ice cores from Antarctica indicate that temperatures were at a maximum (Jouzel et al. 1989). Mountain glaciers had retreated back beyond their present limits in New Guinea, Australia, New Zealand and South America. Seasonal insolation patterns were similar to those at 12 ka, with 6% lower summer insola- tion primarily at low latitudes and higher winter radia- tion of + 6% at latitude 20 ° S to + 2% at latitude 60 ° S. The mean sea level continued to rise. In Australasia it was still some 20 m below the present, which meant that New Guinea was still connected with Australia (Peltier 1988). In South America, on the other hand, the sea level had reached modern levels by 9 ka (Rutter et al. 1989).
Proxy evidence for 9 ka
Paleocirculation reconstruction for 12 ka
Much of Australia, New Guinea, New Zealand (espe- cially in the east and south) and the Pacific coast of South America was still drier than now at 12 ka al- though precipitation had increased somewhat. The one exception appears to have been mid-latitude South America, which was moist temperate. A regime of stronger ridging than present at sub-tropical and mid- latitudes across the Pacific could account for the preci- pitation regime (Fig. 7). The stronger ridging in the east Pacific would lead to increased westerlies between
Everywhere at mid- and high latitudes precipitation had further increased to near modern levels. Lower pre- cipitation and cooler conditions than present in north- ern Australia reflect average climates to the north. Aha- ron (1983) reports summer SSTs some 1.5-2°C cooler than present, or, alternatively, less summer precipita- tion and therefore a failure of the summer monsoon. Consequently, there must have been less convective ac- tivity in the New Guinea region, which is consistent both with the seasonal insolation trends at that time and the Queensland vegetational evidence. Southeas- tern Australia and New Zealand had a more equable,

Markgraf et al.: Past atmospheric circulation in South Pacific
less variable climate. New Zealand evidence suggests that the westerlies' storm tracks were on average further south. Timberlines in New Zealand and southeastern mainland Australia were at the present levels or a little lower, probably the result of reduced summer insola- tion. Summer rainfall maxima are also suggested by the absence of summer moisture deficits throughout the north and west of New Zealand. In South America the lower mid-latitudes became drier than before, with sea- sonal moisture stress. Precipitation had shifted to the higher latitudes, with maximum precipitation around 50 ° S, and substantially increased precipitation in sub- Antarctic latitudes, although there the maximum levels were only reached in the late Holocene. In the subtro- pical latitudes (latitudes 32 to 35 ° S) aridity was at its maximum, winter rains were still less predictable than today, and in the desert region east of the Andes, the monsoonal summer precipitation was also lacking.
Paleocirculation reconstruction for 9 ka
Precipitation was increasing at 9 ka over eastern Aus- tralia and west and southwest New Zealand, but it was still dry in the east of New Zealand. As noted earlier,
.... w 9 K . " " . - " . . . . . . . . . . . . . . . . . . . . . . . . . . . . . . . . . .
1 8 0 , E . . - .. " ' . . . . . ! .20*W • - . " - : " : - t " ....." "'.........
" ' " " " " "" i "' "~'" . . . . - -.. .,
. . ~. ' . . . " . . . . . . . . . . . ~-2 ... . . . . . . . . . . . . . . .; . . ,
....;~: .~. ....... .. / " f ' ~ x . ; ( ~.. ?¢.~ ... 150"E ." " " ... ~ -. f . f j ,~ ,D ~ ' ~ . . - I ~ " ' ~ t ~ ' -OOnW
-'t~;..:' / - - ~ , . : / / g. . .k. ' , . \ t ... t \ ~ . \ " . ....... -.
,1/'~;/;' );II " .--':. :.~.. ..'.,;x;L)".i ,~ '.. /L~" ;I;MTI ............... " ..... ! ............... ";"x"J- t- ( '~
, " ......... ................. . ix, ', ~ - ~'k - - .- ] \ 1" #.~'- " \: :
I~I)~ ~q''I I , I ......... I III I ~ ~ ' [ ~ II I ` ~ ~ 'I IIII ..... ~ ~ I ~) I . . . . . . ..... ' " ~. : ~ I
• . ,, , .
,~o*w 3 K
..... :" " 120 W 1 8 0 " E • .. : . " . . *
# # , / . , ...... ; , ~ .... - , ....... ~ . ~ ~.~: ~, ,~ ~ h" ,.....-~.-.. ~ ' \ " ~ . . ; ~ ':
1 2 0 ° E : r . . . . . . . . . . I . ~ ' L ' " ' I " O0 W , ......... ............... •
}. ~ :, "';'. ")t,
• . , i:, : ' / i ......... ! ......... :-/ ............ / i " ' . . . . . r /
Fig. 8. Reconstruction of prevailing atmospheric circulation pat- terns for the South Pacific for 9000 and 3000 y BP. D a s h e d l i n e s
represent the present position of high- and low-pressure cells; d o t -
t e d l i n e around Antarctica represents postulated sea-ice limit
207
this suggests weaker westerlies and south-westerlies over New Zealand than today. In turn, this suggests a circulation somewhat like a La Nifia episode for this part of the Pacific, with a weak ridge over Australia, and a weaker through east of New Zealand (Fig. 8). Over New Zealand such a circulation would result in lower rainfall in the southwest and west, but perhaps increases in the east.
South America exhibited an increase in rainfall at high latitudes (although not reaching modern levels) except between 40 ° and 45 ° S where it had dried. This suggest that the strong east Pacific ridge evident from 18 to 12 ka had now started to weaken. A weaker ridge would have meant lower rainfall just to the south of the median latitude of the east Pacific ridge.
Seasonality would still be reduced, relative to today (Kutzbach and Guetter 1986), so the winter and sum- mer extremes would both have been closer to the pres- ent-day equinoctial circulation. Storm tracks would have tended to be further south, decreasing winter rain- fall at mid-latitudes. Warmer sea surface temperatures may have led to increased summer convective rainfall, except in the Australasian tropics. Thus, a summer maximum in rainfall might have been evident in areas now having a winter maximum. Precipitation over northern Australia might still have been lower than present, because of the low sea level, and thus large land area relative to ocean area. The Australasian mon- soon would still have been weak reative to today.
Boundary conditions for 6 ka
Boundary conditions began to approach those of the present. The sea level for the Australasian region peaked, resulting in the separation of New Guinea from Australia. This established present-day ocean cir- culation, especially the seasonal deflection of the cold West Australian current. In South America the sea level was up to 6 m above the present, resulting in a minor reduction of land along the Atlantic coast. Seasonal contrast in insolation increased, primarily because winter insolation decreased, while summer and fall in- solation rose, but was lower than at present.
Proxy evidence for 6 ka
Aharon (1983) records the present summer tempera- tures and enhanced seasonality in rainfall from the mid-Holocene onwards for Papua/New Guinea. Northern Australia had both warmed and become more wet. Maximum moisture levels were reached through- out southeastern Australia and New Zealand. In tem- perate mid-latitudes of South America climates were the same as at 9 ka; however, at latitudes south of 50 ° S climates returned to be substantially drier and colder for about 1000 years between 6 and 5 ka. Neoglacial readvances in southern South America have been dated between 4.7 and 4.2 ka, and it is unclear if they corre- spond to the 1000-year long cooler and drier phase doc- umented in pollen records between 6 and 5 ka.
208
Paleocirculation reconstruction for 6 ka
The higher sea levels by this time, coupled with increas- ing seasonality, would have established the Australa- sian monsoon at about the present strengths. The lower ratio of land to ocean around northern Australia would have allowed increased convective rainfall, so summer rainfall over New Guinea and northern Australia would have increased substantially.
Colinvaux (1972) noted that seasonality in the equa- torial east Pacific probably increased after 8.5 ka. Since then, the Galapagos Islands appear to have received a higher rate of rainfall relative to glacial times, indicat- ing that the intertropical convergence shifted south- wards across the equator in summer. Kutzbach and Guetter (1986) also indicated increased seasonality after about 9 ka.
The warm sea-surface temperatures and the in- creased convection around northern Australia, would have led to decreased pressures over southeastern Aus- tralia, so relative to the present circulation, the 6 ka cir- culation in the western South Pacific would have re- sembled a modern La Nifia episode, with a weaker than present ridge (Fig. 8). This would have led to weaker southwesterlies over New Zealand, reducing rainfall in the south (Gordon 1986). The increased seasonality re- lative to previous times, however, would mean an in- creased tendency for the westerlies and storm tracks to move north over New Zealand during winter. Thus winters might be wetter than before.
South America appeard to be dry, accentuated in the southernmost regions, suggesting that the east Pacific circulation at this time also resembled a modern La Nifia. Again, this does not mean that the E1 Nifio- Southern Oscillation was arrested in its La Nifia phase, just that the mean circulation at 6 ka may have resem- bled the modern La Nifia extreme. This might have been the result of the increased convection over New Guinea and northern Australia, relative to the earlier periods. Colinvaux (1972) concluded that from 10 ka on, the Galapagos were somewhat wetter than during the glacial period, although still somewhat drier than now. These islands receive heavy rainfall during El Nifio episodes. Thus, the circulation at 6 ka might have resembled a weak La Nifia episode right across the Pa- cific.
Boundary conditions at 3 ka
At this time all aspects of boundary conditions were as present.
Proxy data
In tropical, subtropical and temperate Australia and New Zealand, climates had become cooler and drier. Variability must have greatly increased, both seasonally and interannually. In South America precipitation was higher and more predictable in the subtropical as well
Markgraf et al. : Past atmospheric circulation in South Pacific
as the southernmost part of the country, with less sea- sonally dry (summer) intervals. In the intermediate mid-latitudes, overall precipitation must have increased relative to before, but conditions seemed quite variable, more continental, with cooler, drier winters and warm- er, moister summers. Over New Zealand, South Amer- ica and southern Australia, westerlies had become stronger and positioned more towards the equator than before, with a more northwesterly component, and large seasonal latitudinal shifts. Antarctic sea ice must have begun to show its present large seasonal ampli- tude' to explain the climate patterns.
Paleocirculation reconstruction
Seasonality had increased, as the seasonal pattern of ra- diation converged on that of modern times. This means that the seasonal shifts in the subtropical ridge and westerlies amplified further, leading to more marked winter-summer precipitation patterns. The Galapagos reached present precipitation levels, indicating that the seasonal shift of the intertropical convergence had reached modern amplitudes. In most respects the circu- lation closely resembled that of modern times.
Conclusions
The speculative nature of much of the proposed circu- lation reconstruction needs to be emphasized. Greater knowledge of the way present-day precipitation and temperature anomalies are related to regional circula- tion anomalies, apart from the E1 Nifio-Southern Oscil- lation, is needed if a firmer reconstruction is to be achieved. The studies needed for this are underway for at least some parts of the southern hemisphere. A more complete and credible reconstruction of paleocircula- tions seems likely in the near future.
The predominant effect of the El Nifio-Southern Os- cillation on modern climate variations across the Pa- cific means that it is of some interest to try to determine when the phenomenon commenced operating. Further work is needed on paleoclimatic data to determine whether the increased variability observed as we near modern times can be attributed to the El Nifio-South- ern Oscillation starting to operate. As noted earlier, the E1 Nifio-Southern Oscillation operates on a rather short time scale, unresolvable by most paleoclimatic proxy data. Some of the observed variability may simply re- flect the increasing seasonality. It may be, however, that some of the extremes associated with the extreme phases of the phenomenon are resolved by the proxy data. If so, the increased variability observed from about 6 ka might indicate when the E1 Nifio-Southern Oscillation started to operate in the last 18 ka. Nicholls (1989) however, suggested that it would have been op- erating much earlier and it is likely that during earlier interstadials and interglacials it did operate compared to the present. This is suggested by upwelling records off the coast of Peru (Oberh~insli et al. 1990).

Markgraf et al.: Past atmospheric circulation in South Pacific
One interesting ou tcome of this c i rcum-South Pa- cific paleocl imat ic compar i son is the no t ion that there were several modes o f climatic forcing in the past. To explain pa leoenv i ronmenta l da ta dur ing full-glacial times a tmospher ic circulat ion in the South Pacific mus t have breen greatly enhanced with increased r idging in subtropical and mid-lati tudes. The forcing that led to such circulat ion characterist ics is related to bo th the greatly ex tended Austra l ian landmass and the equator- ward ex tended Antarct ic ice shelves and sea ice. Dur ing the early Holocene , nei ther Antarc t ica nor the Australa- sian land mass appea r to have exerted an inf luence b e y o n d sou the rnmos t South Amer ica and nor thern Australia, respectively. The p r imary climate forcing at that t ime in the c i rcum-South Pacific appears to have been the low seasonal i ty contrast , result ing in circula- t ion characterist ics that resemble m o d e r n equinoct ia l circulation. Successively dur ing the remainder o f the Holocene , cl imatic forcing appears to have b e c o m e more and more regionalized, resulting in successively smaller-scale cl imate patterns.
The next step is evidently to extend the paleocli- mat ic analysis to include the nor thern hemisphere to determine the t ransequator ia l climate forcing dur ing different t imes in the past. Dur ing times o f m a x i m u m ice extent in the nor thern hemisphere , there must have been in terhemispher ic a tmospher ic forcing in addi t ion to the global effect o f lowered sea levels. However , the mechan i sms are still intangible. Taking the late-glacial Younge r Dryas event as an example, it appears that this c i r cum-Nor th Atlant ic abrupt cool ing event did not ex- tend far ther south than the nor thern Andes o f Co lum- bia (Markgra f 1989b, 1991b), a l though the ocean circu- lat ion was greatly affected. Concer ted paleocl imate ef- forts a long a pole- to-pole t ransect o f records, bo th f rom a terrestrial and a mar ine setting would p robab ly greatly advance the unders tand ing of the global climate system.
Acknowledgements. This work was stimulated by the COHMAP program that brought us together repeatedly to discuss southern hemisphere and global paleoclimatic aspects in context with pal- eoclimatic model simulations. We want to thank especially Tom Webb, III, and John Kutzbach for their help and interest. Vera Markgraf acknowledges support for this work through NSF grants ATM-8618217 and DPP-8613980.
References
Aceituno P (1988) On the functioning of the Southern Oscillation in the South American sector. I. Surface climate. Mon Weather Rev 116: 505-524
Aharon P (1983) Surface ocean temperature variations during the late Wisconsinan stages. 160//180 isotopic evidence from coral reef terraces in eastern Papua New Guinea. In: Chappell JMA, Grindrod A (eds) CLIMANZ 1 Research School of Pa- cific Studies. Australian National University, Canberra, pp 3- 4
Aharon P, Chappell JMA (1986) Oxygen isotopes, sea level changes and the temperature history of a coral reef environ- ment in New Guinea over the last 10.5 years. Palaeogeogr Pal- aeoclimat Palaeoecol 56:337-379
Ashworth AC, Markgraf V (1989) Climate of the Chilean channels
209
between 11000 to 10000 yr B.P. based on fossil beetle and pollen analysis. Rev Chilena Hist Nat 62:61-74
Barnett TP (1991) The interaction of multiple time scales in the tropical climate system. J Climate 4:269-285
Caldenius C (1932) Las glaciaciones cuaternafias en la Patagonia y Tierra del Fuego. Geograf Ann 14:1-64
CLIMANZ (1983) A symposium of results and discussions con- cerned with late Quaternary climatic history of Australia, New Zealand and surrounding areas. Department of Biogeography and Geomorphology, Australian National University, Canber- ra, pp 1-149
CLIMAP project members (1981) Seasonal reconstruction of the Earth's surface at the last glacial maximum. Cline R (ed) Geol Soc Am Map Charts Ser, p 36
COHMAP members (1988) Climatic changes of the last 18000 years: observations and model simulations. Science 241:1043- 1052
Colhoun EA, Fitzsimons SJ (1990) Late Cainozoic glaciation in western Tasmania. Quat Sci Rev 9:199-216
Colinvaux PA (1972) Climate and the Galapagos Islands. Nature 240:17-20
Corte AE, Beltramone (1984) Edad de las estructuras geocriog6ni- cas de Puerto Madryn, Chubut, Argentina. An IANIGLA 84:66-72
De Angelis M, Barkov NI, Petrov VN (1987) Aerosol concentra- tions over the last climatic cycle (160 kyr) from an Antarctic ice core. Nature 325:318-321
Denton GH, Bockheim JG, Wilson SC, Stuiver M (1989) Late Wisconsin and early Holocene glacial history. Inner Ross em- bayment, Antarctica. Quat Res 31:151-182
Dodson JR, Wright RBS (1989) Humid to arid to subhumid vege- tation shift on Pilliga Sandstone, Ulungra Springs, New South Wales. Quat Res 32:182-192
Dodson JR, Enright NJ, McLean RF (1988) A late Quaternary vegetation history for far northern New Zealand. J Biogeog 15:647-656
Drosdowsky W, Williams M (1991) The Southern Oscillation in the Australian region. I. Anomalies at the extremes of the os- cillation. J Climate 4 (in press)
Fairbanks RG (1989) A 17000-year glacio-eustatic sea level re- cord: influence of glacial melting rates on the Younger Dryas event and deep-ocean circulation. Nature 342:637-642
Garleff K, Stingl H (1988) Geomorphologische Untersuchungen in der nivalen und subnivalen Stufe der Argentinischen An- den. Tagungsbericht und wissenschaftl Abhandl 46. Deutscher Geographentag, Munchen 1987, Schneider M (ed) Franz Steiner, Wiesbaden, pp 419-425
Gellatly AF, Chinn JH, R6thlisberger F (1988) Holocene glacier variations in New Zealand: a review. Quat Sci Rev 7:227- 242
Gordon ND (1986) The Southern Oscillation and New Zealand weather. Mon Weather Rev 114:371-387
Harrison SP, Dodson JR (1991) Climate of Australia and New Guinea since 18000 yr B.P. In: COHMAP. University of Min- nesota Press, Minnesota (in press)
Hays JD, Imbrie J, Shackleton NJ (1976) Variations in the earth's orbit: pacemaker of the ice ages. Science 194:1121-1132
Hendy CH, Wilson AT (1968) Palaeoclimatic data from speleo- thems. Nature 219:48-51
Herron M J, Anderson JB (1990) Late Quaternary glacial history of the South Orkney Plateau, Antarctica. Quat Res 33:265- 275
Heusser CJ (1989) Polar perspective of late-Quaternary climates in the southern hemisphere. Quat Res 32:60-71
Hope G (1989) Climatic implications of timberline changes in Australasia from 30000 kyr BP to present. In: Donnelly TH, Wasson RJ (eds) CLIMANZ 3. CSIRO, Melbourne, pp 91- 97
Hope G, Peterson JA (1975) Glaciation and vegetation in the high New Guinea mountains. In: Suggate RP, Cresswell MS (eds) Quaternary studies. Royal Soc NZ Bull 13:155-162

210 Markgraf et al.: Past atmospheric circulation in South Pacific
Johnson RG, Andrews JT (1986) Glacial terminations in the oxy- gen isotope record of deep sea cores: hypothesis of massive Antarctic ice-shelf destruction. Palaeogeogr Palaeoclimat Pal- aeoecol 53:107-138
Jouzel J, Raisbeck G, Benoist JP, Yiou F, Lorius C, Raynaud D, Petit JR, Barkov NI, Korotkevitch YS, Kotlyakov VM (1989) A comparison of deep Antarctic ice cores and their implica- tions for climate between 65 000 and 15000 years ago. Quat Res 31:135-151
Karoly DJ (1989) Southern hemisphere circulation features asso- ciated with the E1 Nifio-Southern Oscillation. J Clim 2:1239- 1252
Kennedy NM, Pullar WA, Pain CF (1978) Late Quaternary land surfaces and geomorphic changes in Roturua Basin, North Is- land, New Zealand. NZ J Sci 21:249-264
Kershaw AP (1981) Quaternary vegetation and environments. In: Keast A (ed) Ecological biogeography in Australia. Junk, The Hague, pp 81-101
Kiladis GN, Diaz HF (1989) Global climatic anomalies associated with extremes in the Southern Oscillation. J Clim 2:1069- 1090
Kukla GJ (1979) Recent changes in snow and ice. In: Gribbin J (ed) Climatic change. Cambridge University Press, Cam- bridge, pp 114-130
Kutzbach JE, Guetter PJ (1986) The influence of changing orbital parameters and surface boundary conditions on climate simu- lations for the past 18 000 years. J Atmos Sci 43:1726-1759
Labracherie M, Labeyrie LD, Duprat J, Bard E, Arnold M, Pi- chon J-J, Duplessy JC (1990) The last deglaciation in the southern ocean. Paleoceanography 4:629-638
Le Marshall JF, Kelly GAM, Karoly DJ (1985) An atmospheric climatology of the southern hemisphere based on ten years of daily numerical analyses (1972-1982). I. Overview. Aust Me- teorol Mag 33:65-85
MacPhail MK, McQueen DR (1983) The value of New Zealand pollen and spores as indicators of Cenozoic vegetation and cli- mates. Tuatara 26:37-59
Markgraf V (1983) Late and postglacial vegetational and paleocli- matic changes in subantarctic, temperate and arid environ- ments in Argentina. Palynology 7:43-70
Markgraf V (1987) Paleoenvironmental changes at the northern limit of the sub-Antarctic Nothofagus forest, lat 37 ° S, Argenti- na. Quat Res 28:119-129
Markgraf V (1989a) Palaeoclimates in central and South America since 18 000 BP based on pollen and lake-level records. Quat Sci Rev 8 : 1-24
Markgraf V (1989b) Reply to C. J. Heusser's "Southern westerlies during the last glacial maximum". Quat Res 31:426-432
Markgraf V (1991a) Late Pleistocene environmental and climatic evolution in southern South America. Bamberger Geograph Schrift 11 (in press)
Markgraf V (1991b) Younger Dryas in southern South America? Boreas 20:63-69
Markgraf V, Bradbury JP, Busby J (1986) Paleoclimates in south- western Tasmania during the last 13 000 years. Palaios 1:368- 380
McBridle JL, Nicholls N (1983) Seasonal relationships between Australian rainfall and the Southern Oscillation. Mon Weather Rev 111 : 1998-2004
McCraw JD (1975) Quaternary airfall deposits in New Zealand. In: Suggate RP, Cresswell MM (eds) Quat Stud R Soc NZ Bull 13:35-44
McGlone MS (1988) New Zealand. In: Huntley B, Webb T III (eds) Vegetation History Kluwers Acad, Dordrecht, pp 557- 602
McGlone MS (1990) The early Holocene as an analogue for a 2 x COz New Zealand DSIR. Land Resources, Christchurch (un- published report)
McGlone MS, Toppin WW (1977) Aranuian (post-glacial) pollen diagrams from the Tongariro region, North Island, New Zea- land. New Zealand J Bot 15:749-760
McGlone MS, Topping WW (1983) Late Quaternary vegetation, Tongariro region, central North Island, New Zealand. New Zealand J Bot 21:53-76
McGlone MS, Howorth R, Pullar WA (1984) Late Pleistocene stratigraphy, vegetation, and climate of the Bay of Plenty and Gibsborne regions, New Zealand. NZ J Geol Geophys 27: 327-350
Meehl GA (1987) The annual cycle and interannual variability in the tropical Pacific. Mon Weather Rev 115:27-50
Mercer JH (1984) Late Cenozoic glacial variations in South Amer- ica south of the equator. In: Vogel JC (ed) Late Cainozoic Pal- aeoclimates of the Southern Hemisphere. Balkema, Rotterdam Boston, pp 45-58
Meurk CD (1984) Bioclimatic zones for the antipodes - and beyond? NZ J Ecol 7:175-181
Moar NT (1980) Late Otiran and early Aranuian grassland in cen- tral South Island. NZ J Ecol 3:4-12
Nelson CS, Hendy CH, Jarrett GR, Cuthbertson AM (1985) Near- synchroneity of New Zealand alpine glaciations and northern hemisphere continental glaciations during the past 750 kyr. Nature 318:361-363
Nicholls N (1973) The Walker circulation and Papua New Guinea rainfall. Bureau of Meteorol Techn, Rep no, 6. Melbourne, Australia
Nicholls N (1977) Tropical-extratropical interactions in the Aus- tralian region. Mont Weather Rev 105:826-832
Nicholls N (1979) A simple air-sea interaction model. Quat J Me- teorol Soc 105:93-105
Nicholls N (1984) The Southern Oscillation and Indonesian sea surface temperature. Mon Weather Rev 112:424-432
Nicholls N (1989) How old is ENSO ? Clim Change 14:111-115 Norton DAM, McGlone MS, Wigley TML (1986) Quantitative
analyses of modern pollen climate relationships in New Zea- land. New Zealand J Bot 24:331-342
Oberhansli H, Heinze P, Diester-Haass L, Wefer G (1990) Up- welling off Peru during the last 430000 yr and its relationship to the bottom-water environment, as deduced from coarse grain-size distributions and analyses of benthic foraminifers at holes 679D, 680B, and 681B, Leg 112. In: Suess E, von Huene R, et al. (eds) Proceed Ocean Drilling Progr Sci Res 112:369- 383
Oeschger H, Beer J, Siegenthaler U, Stauffer B (1984) Late glacial climate history from ice cores, In: Climate processes and cli- mate sensitivity. Hansen JE, Takahashi T (eds) Geophys Mon- ogr 29:299-306
Peltier WR (1988) Lithospheric thickness, Antarctic deglaciation history, and ocean basin discretization effects in a global model of postglacial sea level change: a summary of some sources of nonuniqueness. Quat Res 29:92-112
Pittock AB (1980) Patterns of climatic variation in Agentina and Chile. I. Precipitation 1931-1960. Mon Weather Rev 108:1347-1362
Pittock AB (1983) Climatic teleconnections in the southern hemis- phere. Proc Am Meteor Soc 1983, pp 283-286
Pittock AB, Salinger MJ (1982) Towards regional scenarios for a CO2-warmed earth. Clim Change 4:23-40
Pittock AB, Frakes LA, Jenssen D, Peterson JA, Zillman JW (1978) Climatic change and variability. A southern Perspec- tive. Cambridge University Press, Cambridge
Porter SC (1975) Equilibrium line of late Quaternary glaciers in the southern Alps, New Zealand. Quat Res 5:27-48
Quinn WH (1971) Late Quaternary meteorological and oceano- graphic developments in the equatorial Pacific. Nature 229:330-331
Rabassa J, Clapperton CM (1990) Quaternary glaciations of the southern Andes. Quat Sci Rev 9:153-174
Rasmusson EM, Xueliang Wang, Ropelewski CF (1990) The bien- nial component of ENSO variability. J Mar Syst 1:71-96
Rind D, Peteet D (1985) Terrestrial conditions at the last glacial maximum and CLIMAP sea-surface temperatures: are they consistent? Quat Res 24:1-22

Markgraf et al. : Past atmospheric circulation in South Pacific
Rogers GM, McGlone MS (1989) A postglacial vegetation history of the southern-central uplands of North Island, New Zea- land. J R Soc NZ 19:229-248
Ropelewski CF, Halpert MS (1987) Global and regional scale pre- cipitation patterns associated with the E1 Nifio-Southern Os- cillation. Mont Weather Rev 115 : 1606-1626
Ropelewski CF, Halpert MS (1989) Precipitation patterns asso- ciated with the high index phase of the Southern Oscillation. J Clim 2:268-284
Rutter N, Schnack EJ, Del Rio J, Fasano JL, Isla FI, Radtke U (1989) Correlation and dating of Quaternary littoral zones along the Patagonian coast, Argentina. Quat Sci Rev 8:213- 234
Ruttland J, Fuenzalida H (1991) Synoptic aspects of the central Chile rainfall variability associated with the Southern Oscilla- tion. J Clim 2:268-284
Smith IN (1989) Climatic conditions at the time of the last glacial maximum-general circulation model results for the Australa- sian region. In: Donnelly TH, Wasson RJ (eds) CLIMANZ 3. CSIRO, Melbourne, pp 33-41
Specht R (1972) The vegetation of south Australia. Government Printer, Adelaide
Suggate RP (1990) Late Pliocene and Quaternary glaciations of New Zealand. Quat Sci Rev 9:175-197
Thiede J (1979) Wind regimes over the late Quaternary southwest Pacific Ocean. Geology 7:259-262
211
Thompson LG, Mosley-Thompson E (1981) Microparticle con- centration variations linked with climatic change: evidence from polar ice cores. Science 212:812-815
Villagran C (1988) Expansion of Magellanic moorlands during the last glaciation: palynological evidence from northern Isla de Chiloe. Chile Quat Res 30:304-314
Villagran C, Varela J (1990) Palynological evidence for increased aridity on the central Chilean coast during the Holocene. Quat Res 34:199-207
Voice ME, Hunt BG (1984) A study of the dynamics of drought initiation using a global general circulation model. J Geophys Res 89:9504-9520
Walker D, Singh G (1981) Vegetation history. In: Groves RH (ed) Australian vegetation. Cambridge University Press, Cam- bridge, pp 26-43
Wasson ILl (1989) Desert dune building, dust raising and palaeo- climate in the Southern Hemisphere during the last 280000 years. In: Donnelly TH, Wasson RJ (eds) CLIMANZ 3. CSI- RO, Melbourne, p 123-137
Webster P, Streten N (1978) Late Quaternary ice age climates of tropical Australasia, interpretation and reconstruction. Quat Res 10:279-309
Zarate MA, Fasano JL (1989) The Plio-Pleistocene record of the central eastern Pampas, Buenos Aires Province, Argentina: the Chapadmalal case study. Palaeogeogr Palaeoclimat Palaeoe- col 72:27-52