evolution of la caridad porphyry copper...
TRANSCRIPT

EVOLUTION OF LA CARIDAD PORPHYRY COPPERDEPOSIT, SONORA AND GEOCHRONOLOGY OF
PORPHYRY COPPER DEPOSITS IN NORTHWEST MEXICO
Item Type text; Electronic Dissertation
Authors Valencia, Victor A.
Publisher The University of Arizona.
Rights Copyright © is held by the author. Digital access to this materialis made possible by the University Libraries, University of Arizona.Further transmission, reproduction or presentation (such aspublic display or performance) of protected items is prohibitedexcept with permission of the author.
Download date 04/07/2018 01:13:06
Link to Item http://hdl.handle.net/10150/195020

EVOLUTION OF LA CARIDAD PORPHYRY COPPER DEPOSIT, SONORA AND
GEOCHRONOLOGY OF PORPHYRY COPPER DEPOSITS IN NORTHWEST
MEXICO
by
Victor Alejandro Valencia Gomez
________________________
Copyright © Victor Alejandro Valencia Gomez 2005
A Dissertation Submitted to the Faculty of the
Department of Geosciences
In Partial Fulfillment of the Requirements
For the Degree of
DOCTOR OF PHILOSOPHY
In the Graduate College
THE UNIVERSITY OF ARIZONA
2 0 0 5

2
THE UNIVERSITY OF ARIZONA GRADUATE COLLEGE
As members of the Dissertation Committee, we certify that we have read the dissertation prepared by Victor Alejandro Valencia Gomez entitled: EVOLUTION OF LA CARIDAD PORPHYRY COPPER DEPOSIT, SONORA AND
GEOCHRONOLOGY OF PORPHYRY COPPER DEPOSITS IN NORTHWEST MEXICO
and recommend that it be accepted as fulfilling the dissertation requirement for the Degree of Doctor of Philosophy _______________________________________________________________________ Date: 8th of April 2005 Joaquin Ruiz _______________________________________________________________________ Date: 8th of April 2005 Spencer R. Titley _______________________________________________________________________ Date: 8th of April 2005 Mihai Ducea _______________________________________________________________________ Date: 8th of April 2005 Christoper Eastoe _______________________________________________________________________ Date: 8th of April 2005 Efren Perez-Segura Final approval and acceptance of this dissertation is contingent upon the candidate’s submission of the final copies of the dissertation to the Graduate College. I hereby certify that I have read this dissertation prepared under my direction and recommend that it be accepted as fulfilling the dissertation requirement. ________________________________________________ Date: 8th of April 2005 Dissertation Director: Joaquin Ruiz

3
STATEMENT BY AUTHOR
This dissertation has been submitted in partial fulfillment of requirements for an advanced degree at The University of Arizona and is deposited in the University Library to be made available to borrowers under the rules of the Library. Brief quotations from this dissertation are allowable without special permission, provided that accurate acknowledgment of source is made. Request for permission for extended quotation from or reproduction of this manuscript in whole or in part may be granted by the copyright holder.
SIGNED: _Victor Alejandro Valencia Gomez____

4
ACKNOWLEDGMENTS
Thanks to the support of Consejo Nacional de Ciencias y Tecnologia (MEXICO)
scholarship (87199), Terrones Student Research grant of the Society of Economic Geologists, Chevron scholarship and Harold Courthwright scholarship of the Arizona Geological Society.
I would like to thank my committee dissertation members: Dr. Chris Eastoe who patiently shared his knowledge in stable isotopes and fluid inclusions, Dr. Mihai Ducea for always having time to talk about projects and involving me in those projects, which are not included in this thesis. Dr Spence Titley for introducing me to and sharing his knowledge of porphyry copper deposits. Dr. Efren Perez-Segura for teaching me the metallogeny of Sonora and for help accessing different mining units of Grupo Mexico. A special thanks to my mentor and advisor Dr Ruiz whom with common sense, intelligence and perceptiveness motivated me to a higher level of thinking, scientific curiosity, and for giving me the freedom to develop myself.
I thank many people who contributed in different ways during these projects and other not included in this thesis. Special thanks to John T. Chesley for his help, friendship, and patience, to Dr Gehrels for teaching me the U-Pb techniques, to Dr. Lucas Ochoa-Landin for sharing his knowledge of Sonoran porphyries and spending time in the field with me, to Dr Seedorf for always being willing to talk about porphyry deposits, and to Diana Meza who initially motivated me to come to the U of A.
I would also like to include my colleagues and friends in this acknowledgements: Fernando and Vero Barra, Sergio Castro-Reino, Carlos Cintra, Oscar Talavera, Jason Kirk, Kevin Righter, Ken Dominick, Alex Pullen, Mark Baker, Jen Pullen, Paul Wetmore, Sara Shoemaker, Julie Humblock, Facundo Fuentes, Deb Bryan, Arda Ozacar and some other not included here for their friendship and help in completing my dissertation, thanks for being my friends!.
Thanks to the Staff of the Geosciences Department, the College of Sciences staff (Sue and Bernadette), and especially to Susan Huatala, who always helped me to reach Dr Ruiz.
My family, mi madre, mis padrinos, mis hermanos (Hugo, Lara, Juan, Hector, Diego y Paulina) and thanks to Mr and Ms. Ferrey for their support and always telling me that everything is possible.
I am most grateful to Grupo Mexico (Ing. Remigio Martinez, Ing. Jose Contla, Ing. Marco Figueroa, Ing. Narcizo Javier Olvera, Enrique Espinoza and Pepe Ortiz, Ernesto Ramos, Marco Hernandez), Servicios Industriales Penoles (Benito Noguez and Francisco Quintanar) and CICESE (Bodo Weber) for providing logistics and allowing access to the mining operations and logistics. Very special thanks and love to Hinako Uchida for all her support during the process of getting my PhD, arigatou!.

5
DEDICATION
A mi madre, mis padrinos Sergio y Laura que siempre creyeron en mi
A mi hijo Alex por su paciencia y su amor
A mi Mexico Lindo y Querido.
en Memoria de mi amigo
Robert Fromm Rhin

6
TABLE OF CONTENTS LIST OF FIGURES ......................................................................................................... 9 LIST OF TABLES...........................................................................................................14 ABSTRACT.....................................................................................................................15 CHAPTER 1: INTRODUCTION TO THE PRESENT STUDY ....................................17 CHAPTER 2: EVOLUTION AND TRANSITION OF AN ORE BEARING HYDROTHERMAL FLUID FROM A COPPER PORPHYRY TO HIGH SULFIDATION EPITHERMAL DEPOSIT AT LA CARIDAD, SONORA, MEXICO. ..........................................................................................................................................31 2.1, INTRODUCTION ........................................................................................31 2.2, GEOLOGY ...................................................................................................33 2.2.1, Regional Geology ..........................................................................33
2.2.2, Local Geology................................................................................34 2.2.3, Structure.........................................................................................37 2.2.4, Hypogene alteration and mineralization ........................................39 2.2.4.1, La Caridad Porphyry Copper Deposit.......................................39 2.2.4.2, La Caridad Antigua ..............................................................43
2.3, HOMOGENIZATION TEMPERATURES, SALINITY AND PRESSURE ESTIMATES FROM FLUID INCLUSION DATA............................................44 2.4, STABLE ISOTOPES....................................................................................49 2.4.1, Oxygen and hydrogen isotopes......................................................49 2.4.2, Sulfur isotopes ...............................................................................54 2.4.2.1, Sulfur geothermometry .........................................................55 2.4.2.2, Source of sulfur ...................................................................56 2.5, ROLE OF BOILING.....................................................................................59 2.6, SUMMARY OF FLUID INCLUSIONS AND STABLE ISOTOPES.........60 2.7,TEMPORAL LINK BETWEEN LA CARIDAD ANTIGUA AND LA CARIDAD PORPHYRY DEPOSITS .................................................................61 2.8, CONCLUSIONS...........................................................................................64
CHAPTER 3: U-PB ZIRCON AND RE-OS MOLYBDENITE GEOCHRONOLOGY FROM LA CARIDAD PORPHYRY COPPER DEPOSIT: INSIGHTS FOR THE DURATION OF MAGMATISM AND MINERALIZATION IN THE NACOZARI DISTRICT, SONORA, MEXICO ...................................................................................87

7
TABLE OF CONTENTS-Continued
3.1, INTRODUCTION ........................................................................................87 3.2, GEOLOGICAL BACKGROUND................................................................88 3.2.1, Regional geological setting............................................................88
3.2.2, District geology..............................................................................91 3.3, ANALYTICAL PROCEDURES..................................................................93 3.4, RESULTS .....................................................................................................97 3.4.1, Pre-Mineralized stage ....................................................................97
3.4.2, Mineralized stage ...........................................................................97 3.4.3, Late-Mineralization stage ..............................................................98 3.4.4, Re-Os molybdenite ages ................................................................98 3.5, DISCUSION .................................................................................................99 3.5.1, Magma emplacement and mineralization ......................................99 3.5.2, Duration of hydrothermal systems.................................................102
3.5.3, Inherited zircon ages ......................................................................104 3.6, SUMMARY..................................................................................................106 CHAPTER 4: RE-OS MOLYBDENITE AND LA-ICPMS U-PB ZIRCON GEOCHRONOLOGY FROM MILPILLAS PORPHYRY COPPER DEPOSIT: INSIGHTS FOR MINERALIZATION IN THE CANANEA DISTRICT, SONORA, MEXICO..........................................................................................................................122
4.1, INTRODUCTION ........................................................................................122 4.2, GEOLOGICAL BACKGROUND................................................................124 4.2.1, Regional Geological setting...........................................................124 4.2.2, Local geology.................................................................................126 4.2.3, Structural geology..........................................................................127 4.2.4, Mineralization and hypogene and supergene alteration.................128 4.3, ANALYTICAL PROCEDURES..................................................................130
4.3.1, Zircon U-Pb dating ........................................................................130 4.3.2, Molybdenite Re-Os dating.............................................................131 4.3.3, U-Pb in zircon results.....................................................................133 4.3.4, Re-Os in molybdenite results.........................................................133 4.4, DISCUSSION...............................................................................................134 4.4.1, Age of mineralization ....................................................................134 4.4.2, Long-lived or short-lived multiple mineralization centers ............135
4.4.3, Timing of mineralization in Northwest Mexico ............................138 4.5, SUMMARY..................................................................................................140
CHAPTER 5: RE-OS AND U-PB GEOCHRONOLOGY OF EL ARCO PORPHYRY COPPER DEPOSIT, BAJA CALIFORNIA MEXICO...................................................150 5.1, INTRODUCTION ....................................................................................................150

8
TABLE OF CONTENTS-Continued
5.2, GEOLOGICAL BACKGROUND................................................................152 5.2.1, Regional Geology ..........................................................................152 5.2.2, Deposit Geology ............................................................................154 5.3, ANALYTICAL PROCEDURES..................................................................156 5.3.1, U-Pb Systematic.............................................................................156 5. 3.2, Re-Os systematic ..........................................................................157 5.4, RESULTS .....................................................................................................158 5.4.1, Re-Os Ages ....................................................................................158 5.4.2, U-Pb Ages......................................................................................158 5.5, DISCUSSION...............................................................................................159 5.5.1, Age of Mineralization ....................................................................159 5.5.2, Alisitos-El Arco Correlations ........................................................160 5.5.3, Evidence of Jurassic Magmatism...................................................161 5.5.4, Terrane limit between El Arco-Guerrero Negro Transect? ...........164 5.6, SUMMARY..................................................................................................166 REFERENCES ................................................................................................................175

9
LIST OF FIGURES
FIGURE 1.1 Circum-Pacific map showing distribution of Cu in porphyry copper deposits, in Million of tons (Resources + Production) by region (modified from Camus 2003). ..30 FIGURE 2.1 Location of La Caridad porphyry copper deposit (star) and other porphyry copper deposit in the area (open circles); dashed lines are terrane boundaries from Campa and Coney (1983).............................................................................................................66
FIGURE 2.2 Simplified geologic map of La Caridad area. (modified after Berchenbriter, 1976 and Worcester, 1976) ..............................................................................................67
FIGURE 2.3 Geological map of La Caridad mine area (plan view at 1290 m level) and SW-NE cross section A-A’ looking NW, interpreted from drill hole information and surface mapping; Note in the cross-section the material mined up to 2002 ...................68
FIGURE 2.4 Schematic SW-NE cross section from La Caridad pit to La Caridad Antigua mine. The location of the section is shown in Figure 2.3. The deep drill hole DCV-02 that cut La Caridad fault near 850m and intercepted unaltered granodiorite at >850m. ........69
FIGURE 2.5 a) Structural map of the 1290 level and pole projections of 560 faults from benches 1380 and 1305 in La Caridad pit. Lower hemisphere Schmidt equal area nets. b) Copper iso-values map from La Caridad. c) Hydrothermal alteration map of the 1290 level. QSP=quartz-sericite-pyrite, Gn=galena, sph=sphalerite, cpy=chalcopyrite, py=pyrite ..........................................................................................................................70
FIGURE 2.6 Paragenetic sequence of the vein assemblage of La Caridad, according to crosscutting relationships. Temperatures were determined from fluid inclusions. Horizontal arrows are related to the relative distribution of the veins in different lithologies. qtz =quartz, Kfeld = potassium feldspar, mo= molybdenite, anh= anhydrite, bt= biotite, sph=sphalerite, mt=magnetite, ser= sericite, py=pyrite, tourm=tourmaline, cpy=chalcopyrite, gn=galena, tt=tetrahedrite/tennantite .................................................71
FIGURE 2.7 a) Photograph of the massive sulfide body at la Caridad Antigua, with pencil as a scale. Barite (Ba), enargite (En), pyrite (Py) and alunite (Al) are present. b) Photomicrograph of a polished section from the massive sulfide body, showing bornite (Bn), Covellite (Cv), bluish chalcocite (Di), gray chalcocite (Cc), scarce pyrite (Py) and chalcopyrite (Cpy), and large subidiomorphic crystals of enargite. See text and figure 2.8 for explanation. ................................................................................................................72
FIGURE 2.8 Paragenetic sequence of La Caridad Antigua.............................................73 FIGURE 2.9 Frequency distribution of homogenization temperatures (L+V→V) of primary (?) fluid inclusions in quartz veins classified according to paragenetic stage. ..74

10
LIST OF FIGURES-Continued
FIGURE 2.10 Salinity versus homogenization temperature Th (L-V) plot, showing the distribution of data relative to the NaCl saturation and critical curves from Ahmad and Rose (1980). Dashed lines are contours vapor pressures of NaCl-H2O (bars) at specific temperatures (Roedder 1984)...........................................................................................75
FIGURE 2.11 Diagram showing the liquid-vapor homogenization temperatures versus halite dissolution temperature inclusions, for hydrothermal alteration assemblage quartz veins from La Caridad. ....................................................................................................76 FIGURE 2.12 Oxygen and hydrogen compositions of water in equilibrium with hydrothermal minerals from La Caridad, shown in relation to ranges of residual waters or magmatic water box (Taylor, 1974), composition of water initially dissolved in felsic magmas or water in arc and crustal melt (Taylor, 1992), low-salinity discharges from high-temperature volcanic fumaroles or vapor from convergent arc volcanoes (Giggenbach, 1992), boiling vector at halite saturation (Schmulovich et al., 1999), Miocene Gulf of Mexico (GM) formational waters (Land and McPherson, 1989), Tertiary meteoric waters from La Caridad (Taylor, 1974), present-day meteoric waters (Taylor, 1979), and an evaporation trajectory path for lacustrine waters (Gat, 1981). The dashed ellipse represents highly evaporated lacustrine waters and fluid composition of anhydrite in equilibrium with quartz are also shown. Black square S represents a hypothetical magmatic fluid. Ranges of d18O only shown for fluid in equilibrium with anhydrite and stage III quartz. ................................................................................................................77 FIGURE 2.13 Comparison of sulfate-sulfide δ34S ranges from La Caridad and different PCDs of the world. Data from Ohmoto and Rye (1979), Turner (1983); Shelton and Rye (1982), Eastoe (1983), Lang et al. (1989), Calagari (2003), Padilla-Garza et al. (2004).78 FIGURE 2.14 The δ 34S mineral versus ∆ 34S sulfate-sulfide diagram for coexisting anhydrite and chalcopyrite, molybdenite, pyrite and sphalerite ......................................79
FIGURE 2.15 Weighted average plot for zircon U-Pb ages from La Caridad Antigua stock. The determined 206Pb/238U age is 55.0 ± 1.7 Ma (n=13, MSWD=1.2). All errors at two sigma .........................................................................................................................80
FIGURE 2.16 Geochronological data from La Caridad, Nacozari district (Valencia et al., in review) and from La Caridad Antigua. Solid squares are U-Pb ages from zircons, solid circles are Re-Os ages from molybdenite. Error bars are 2σ. Τhe estimated duration of the mineralization event is shown as a shaded rectangle.................................................81

11
LIST OF FIGURES-Continued
FIGURE 3.1 Map of the Sonora state showing the location of La Caridad porphyry copper deposit (solid start), main cities (solid squares), other porphyry copper deposits in the area (white circle).......................................................................................................107
FIGURE 3.2. (a) Main structures from La Caridad area. (b) Simplified geologic map of La Caridad area showing U-Pb sample location..............................................................108
FIGURE 3.3. Zircon morphology microphotographs (a) SEM-Cathodoluminescense (CL) image from a single euhedral zoned zircon (sample G-2), showing an inherited Late Jurassic core (~151 Ma) and a Paleocene overgrowth (~54 Ma) at the tip of the crystal; (b) SEM-CL image from a euhedral zoned zircon from sample P-2 showing a xenocryst core with age 207Pb/235U of 1477 ± 55 Ma and an age 206Pb/238U rim of 54.3 ± 1.3 Ma; (c) Backscatter electron image of the same zircon as in (b), showing the laser ablation pits, which are ~20 microns deep; (d) CL image from a euhedral zircon from sample G-1 showing narrow concentric zoning overgrowth; (e) CL image from a euhedral elongate zircon from the post mineralization Tan porphyry showing concentric overgrowth zoning; (f) Cl Image from zircons from sample P-1....................................................................109
FIGURE 3.4. U-Pb ages for La Caridad porphyry copper deposits in concordia plots. Sample G-2 is showing the presence of an the inherited component (~1.48 Ga)............110
FIGURE 3.5. 206Pb/238U crystallization ages for La Caridad porphyry copper deposits samples.............................................................................................................................111
FIGURE 3.6. Summary of geochronological data from La Caridad, Nacozari district. Solid diamond are K-Ar ages from biotite and sericite, solid squares are U-Pb ages from zircons, solid circles are Re-Os ages from molybdenite. Error bars are 2σ. Light gray shade represents magmatism duration, host rock lithologies (andesites, diorites) are excluded, and dark gray shade represents mineralization duration. K-Ar data from (1) Livingston, 1973; (2) Livingston, 1973 in Roldan-Quintana, 1980, Livingston, 1974; (4) Seagart et al., 1974; (5) Worcester, 1976; (6) Damon, 1968; (7) Damon et al., 1983.....112
FIGURE 4.1. Location of the Cananea Mining district (open square) and other porphyry copper deposit locations (open circles); dashed lines are terrane boundaries (Campa and Coney, 1983 and Sedlock et al. 1993) .............................................................................141
FIGURE 4.2 Cananea mining district showing location of porphyry copper mineralization areas (filled circles). Clear area represents gravels; outcrops of undifferentiated units are shaded. Note the Cuitaca graben divides the Cananea district in a N-S direction .................................................................................................................142

12
LIST OF FIGURES-Continued
FIGURE 4.3 Generalized stratigraphic column for the Cananea district (modified from Wodzicki, 1995)...............................................................................................................143
FIGURE 4.4 Schematic plant and cross section view of the Milpillas porphyry copper deposit. Also shown are sample locations .......................................................................144
FIGURE 4.5 Photographs of molybdenite samples from drill cores used for Re-Os analyses ............................................................................................................................145
FIGURE 4.6 U-Pb weight average plot from sample M-120 ..........................................146
FIGURE 4.7 Summary of geochronological data from the Cananea mining district. Shaded bars illustrate the proposed three discrete events of mineralization recognized in the district, dashed mineralization event in La Caridad mining district (Valencia et al. in review). Solid diamond are Re-Os ages from molybdenite analyzed by TIMS; open diamond is Re-Os ages from molybdenite analyzed by ICP-MS; open squares are U-Pb ages from zircons; open circles are K-Ar ages biotite and sericite and solid circles are Ar-Ar ages from hornblende. Error bars are at 2sigma level. Data from (1) McCandless and Ruiz, 1993; (2) Barra et al., in review; (3) This study; (4) Wodzicki, 1995; (5) Damon et al., 1983; (6) Carreon-Pallares, 2002; (7) Damon and Mauger, 1966; (8) Silver and Anderson, 1977................................................................................................................147
FIGURE 5.1.a) Geographic overview of northwestern Mexico, showing the location of El Arco porphyry copper deposit (big start), also circles represent the location of other mainland porphyry copper deposits from mainland Mexico and Southern Arizona (after Damon et al., 1983; Titley and Anthony, 1989). Dashed lines indicate boundaries: (1) Seri, (2) Yuma, and (3) Cochimi Terranes (Sedlock et al., 1993). Small starts CI= Cedros Island, IN= Inguaran. b) Simplified geological map of central Baja California modified after Martin-Barajas and Delgado-Argote (1996) showing Pre-Cenozoic rocks and El Arco locations ..................................................................................................................167
FIGURE 5.2 a) Simplified geologic map of El Arco-Calmalli area, modified from Barthelmy, 1975; Echavarri-Perez and Rangin, 1978. b) Hydrothermal alteration map from El Arco porphyry copper deposit and sample location modified from Barthelmy, 1975; Echavarri-Perez and Rangin, 1978; Coolbaugh et al., 1995.................................168
FIGURE 5.3 Weighted mean of all Re/Os molybdenite age data collected from four veins in this study. Two sigma uncertainties.............................................................................169
FIGURE 5.4 Concordia diagram showing the presence of inherited components as well as interpreted crystallization 206 Pb/ 238 U age of the individual rock ..............................170

13
LIST OF FIGURES-Continued
FIGURE 5.5 Diagram showing geochronological ages from El Arco porphyry copper deposit. Solid diamonds are K-Ar ages from biotite and whole rock, solid squares are Ar-Ar ages from pyrite (older) and whole rock (younger), solid triangles are Re-Os ages from molybdenite and solid circle is U-Pb in zircons. Error bars are 2σ. Light gray shade represents mineralization duration. (1) Barthelmy, 1975 (2) Shafiqullah, 1974 in Garcia-Farias, 1974 (3) Instituto del Petroleo, 1974 in Garcia-Farias, 1974; (4) Lopez-Martinez et al., 2002 .................................................................................................171
FIGURE 5.6 Schematic cross section of the collision of exotic island arc. Modified after Schmidt et al., 2002 .........................................................................................................172
14
LIST OF TABLES TABLE 2.1 Oxygen and hydrogen stable isotope data....................................................82 TABLE 2.2 Sulfur isotope data from sulfides and sulfates from La Caridad porphyry copper deposit and La Caridad Antigua...........................................................................83 TABLE 2.3 LA-MC-ICPMS U-Pb zircon data ...............................................................85 TABLE 2.4 Summary data .............................................................................................86 TABLE 3.1, LA-MC-ICPMS U-Pb zircon data ..............................................................113 TABLE 3.2 Sample description and summary of U-Pb ages ..........................................120 TABLE 3.3 Re-Os molybdenite age................................................................................121 TABLE 4.1, LA-MC-ICPMS U-Pb zircon data ..............................................................148 TABLE 4.2, Re-Os molybdenite ages from Cananea Mining District ............................149 TABLE 5.1, LA-MC-ICPMS U-Pb zircon data ..............................................................173 TABLE 5.2, Re-OS molybdenite ages.............................................................................174

15
ABSTRACT
In order to improve our understanding of poorly studied Mexican Porphyry
Copper Deposits in the SW regional metallogenetic province, a detailed study of the
hydrothermal fluid evolution of La Caridad porphyry copper-molybdenum deposit, and
its connection to a high sulfidation epithermal deposit, was performed using oxygen,
hydrogen and sulfur stable isotopes combined with fluid inclusion studies. In addition, U-
Pb and Re-Os geochronology from La Caridad, Milpillas and El Arco porphyry deposit
were performed to constrain the timing of mineralization and magmatism in northwest
Mexico.
Uranium-lead zircon ages from La Caridad suggest a short period of magmatism,
between 55.5 and 53.0 Ma. Re-Os molybdenite ages from potassic and phyllic
hydrothermal veins yielded identical ages within error, 53.6 ± 0.3 Ma and 53.8 ± 0.3 Ma,
respectively. Four stages of hypogene alteration and mineralization are recognized at La
Caridad porphyry copper deposit. The isotopic composition of the water in equilibrium
with hydrothermal alteration minerals is consistent with highly evaporated lacustrine
waters mixed with magmatic waters or vapor separated from magmatic fluids, however,
sulfur isotopes and fluid inclusions data support the lacustrine-magmatic water
hypothesis.
Milpillas porphyry copper deposit in the Cananea Mining District, yielded a
crystallization age of 63.9 ± 1.3 Ma. Two Re-Os molybdenite ages yielded an identical
age of 63.1 ± 0.4 Ma, Suggesting a restricted period of mineralization. Re-Os data

16 indicate that mineralization in Cananea District, spanned ~4 m.y. in three discrete pulses
at ~59 Ma, ~61 Ma and ~63Ma.
El Arco porphyry copper deposit, Baja California, Mexico, yielded a Middle
Jurassic crystallization age (U-Pb) of 164.7 ± 6.7 Ma and a Re-Os mineralization age of
164.1 ± 0.4 Ma and not ~100 Ma as previously determinated.
Porphyry copper deposits in Mexico range in age from 164 Ma to 54 Ma and the
mineralization in Sonora state occurred in two different periods, but magmatism overlaps
in space and time.

17 CHAPTER 1: INTRODUCTION TO THE PRESENT STUDY
Porphyry copper deposits (PCDs) are probably the best known ore deposit-type in
the field of economic geology. These deposits contain the most important metal resources
formed by hydrothermal processes associated with magmatism (Heinrich et al., 1999).
They are the most widely recognized style of mineralization emplaced in volcano-
plutonic arcs, commonly considered to have formed from magmas in convergent tectonic
environments. Many are related to felsic intrusion-centered systems (quartz monzonite)
but in other cases, the intrusions range to intermediate-mafic compositions (diorite).
PCDs are large, low-grade ore bodies with extensive areas of hydrothermal alteration. In
addition to copper, they contain important quantities of other metals such as gold, silver,
molybdenum and platinum-group elements (PGEs).
Despite many years of intensive study, models of PCD formation continue to
evolve. Controversial topics that are crucial to understanding the evolution of porphyry
copper systems are:
1) Source or sources of the ore-forming fluid(s)
2) Life-span of the hydrothermal system
3) Source of metals and sulfur
4) Size (amount of ore) of deposits and number of associated mineralization events
5) Metal content in the fluids

18
The source of ore-forming fluids
Conventional thinking regarding the source of fluids is based on a great number
of investigations performed in the Southwest North American province, mainly in USA
(e.g. Taylor, 1974, 1997 and references therein). These studies suggest that early
magmatic fluids interact with late meteoric waters, and that this mixing of fluids is
responsible for the phyllic alteration characteristic of PCDs and the precipitation of the
metals. However, recent work has shown that meteoric waters have only a minor role in
the precipitation of metals and associated hydrothermal alteration (Shinohara and
Hedenquist, 1997; Harris and Golding, 2002). Late phyllic alteration in some deposits is
now thought to be of magmatic origin and precipitation of metal is probably caused by
boiling (Horita et al., 1995; Shinohara and Hedenquist, 1997; Hedenquist et al., 1998;
Shmulovich et al. 1999; Heinrich et al., 1999; Harris and Golding, 2002; Redmond et al.,
2004).
Duration of the hydrothermal system
Our understanding of the time span of hydrothermal systems has been limited
mainly by the precision of the different geochronological tools. Numerical modeling on
cooling rates (i.e. Norton and Knight, 1977; Norton and Taylor, 1979; Norton and
Cathles, 1979, Cathles et al., 1997) and dating of young hydrothermal systems (e.g.
Skinner, 1979, Mathur, 2000; Mathur et al. in press) suggested that hydrothermal systems
remain active for less than 1 my.

19
Technological improvements in mass spectrometry, ionization and isotopic
separation, have increased analytical precision and reduced the sample size required for
isotopic analyses. With techniques such as Sensitive High Resolution Ion MicroProbe
(SHRIMP) or Laser Ablation Inductively Coupled Plasma Mass Spectrometry Multi
collector (LA-ICP-MS-MC) it is now possible to date several points in a single zircon
grain.
The combined use of high precision geochronological techniques indicates that
certain hydrothermal deposits formed not from long-lived hydrothermal systems (as
previously thought), but rather as the result of the overprinting of multiple discrete pulses
(i.e. Marsh et al., 1997; Masterman et al., 2004; Maksaev et al., 2004, Lips et al., 2004).
The source of sulfur and metals
One of the most relevant controversies regarding PCDs is the source of sulfur and
metals. Some researchers believe that both sulfur and metals have a magmatic source
(Burnham, 1979), others state that at least part of the sulfur and metals has its origin in
the assimilation of upper crust (hydrothermal leaching of surrounding rocks) (Ohmoto
and Goldhaber, 1997). Recent studies have shown that while the copper contained in a
PCD could be supplied entirely and solely from felsic magmas (Dilles and Proffet, 1995),
the sulfur could not be totally derived from these felsic magmas (Hattori and Keith, 2001).
The latter authors proposed that sulfur, and a significant proportion of metals, are derived
from mafic magmas injected into the felsic magma chamber. On the other hand, Lang and

20 Eastoe (1988) and Field et al. (in press) suggested that sulfur could be obtained from
evaporates located within host rocks or from saline formation waters.
Recent Re-Os work performed in Chilean porphyry copper deposits has shown
that in large deposits (i.e. Chuquicamata, El Teniente, Collahuasi) sulfides have an initial
osmium ratio that suggest a strong mantle involvement as a source of metals (McInnes,
1999; Mathur et al 2000).
Size of deposits and events of mineralization
Knowledge of the age and duration of geologic events that result in the formation
of important concentrations of ore minerals in the earth’s crust is fundamental in the
understanding of the evolution and origin of ore deposits. Even more, in porphyry copper
deposits the long-lived magmatic-hydrothermal model versus the short-lived model, with
several discrete pulses, and its role in the formation of large or giant ore deposits has
become the focus of numerous recent studies (e.g. Arribas et al., 1995; Cornejo et al.,
1997; Marsh et al., 1997; Clark et al., 1998; Hedenquist et al., 1998; Reynolds et al., 1998;
Selby and Creaser, 2001; Barra et al., 2003; Masterman et al., 2004; Maksaev et al.,
2004). Determination then, of the lifespan of porphyry copper systems and its relation
with the size of the deposit (i.e. the amount of copper contained) is critical in the
development of genetic models of PCDs at the deposit level and probably more relevant
at the district level were porphyries tend to occur in clusters. Obviously, timing
information is relevant in the construction of regional metallogenic models.

21
Recent investigations combining U-Pb, 40Ar/39Ar, Re-Os and fission track dating
techniques to study the evolution of super-giant El Teniente porphyry Cu deposit in Chile
show five short lived episodes of felsic intrusion corresponding to five periods of
mineralization. The number of mineralization events is inferred as the main cause of the
volume and high grade of this deposit (Maksaev et al., 2004).
Metal content of ore forming fluids
Early estimates of metal content in fluid inclusions indicated that the
concentration of metals in fluids was <0.1 wt% and hence that large volumes of fluid
would be required in order to form an ore deposit. New LA-ICP-MS and PIXE
techniques have the ability to measure element concentrations within individual fluid
inclusions (Heinrich et al 1999; Ulrich et al., 2001; Harris et al., 2003). These studies
shows that the relative concentration in the liquid phase follow the sequence
Au<Cu<Zn<Pb<Fe, whereas in the vapor phase Cu, Au and As are present (Heinrich et al,
1999). Copper in hypersaline liquids and vapor inclusions could reach values as high as
10 wt. % and 4.5 wt. %, respectively (Harris et al., 2003), indicating that the metal budget
in fluids is much larger than previously thought.
It is evident that a better understanding of the evolution of PCDs generates more
detailed and accurate genetic models and the application of these improved models
provides better exploration results.
Mineral resources from porphyry copper deposits of the world are more than 700
Mt of copper (Long, 1995; Camus, 2003), which represent ~57 % of the total copper

22 resources of the world (Singer, 1995). More than 240 deposits, with ages between
Mesozoic to Pleistocene, are recognized in the Circum-Pacific ring or belt (Camus 2003),
however many remain hidden and waiting to be found.
The second most important province after the Andean Cordillera is the Southwest
North America and Northern Mexico province (Fig. 1.1), with resources representing
around 25% of the total known porphyry copper resources. Despite the fact that Southern
Arizona and its porphyry copper deposits have been intensely studied, probably more
than any other area in the world ( Titley and Hicks, 1966 and references there in; Lowell,
1974; Hollister, 1974; Titley, 1981; Titley, 1982 and references there in; Titley and
Beane 1981, Titley and Anthony 1989, Lang and Titley, 1998; and Titley, 2001 and
references therein), the La Caridad and El Arco porphyry copper districts, which contain
two of the three world-class porphyry Cu-Mo and Cu-Au deposits in Mexico, still lack a
detailed and comprehensive investigation that would allow a comparison of geology and
metallogeny with that of the Southern Arizona and Northern Sonora porphyry provinces.
The third Mexican world-class deposit, Cananea district, has the highest copper resources
but is second in production after La Caridad. In spite of the economic importance of the
Cananea district, limited geochronological work has been done on the timing of
mineralization (Anderson and Silver, 1977; Damon et al., 1983; McCandless et al., 1993;
Wodzicki, 1995; Carreon-Pallares, 2002). It is important to extend the research to
northern Sonora and Baja California Peninsula in order to integrate the geology of
districts such as La Caridad, Cananea and El Arco into a regional context.

23
In this research, I address four of the five issues mentioned above, focusing each
particular topic in one or more of the three most important PCD districts in Mexico. The
purpose of this work is to improve our understanding on the evolution of porphyry copper
deposits based on the poorly known Mexican PCDs and extrapolate these results to a
develop a better regional metallogenetic model that hopefully will be useful in the
development of future exploration programs.
The results of this study are reported in the four following chapters of this
dissertation:
Chapter 2: “EVOLUTION AND TRANSITION OF AN ORE BEARING
HYDROTHERMAL FLUID FROM A COPPER PORPHYRY TO HIGH
SULFIDATION EPITHERMAL DEPOSIT AT LA CARIDAD, SONORA, MEXICO”
(to be submitted to Mineralium Deposita) provides insights on the hydrothermal
evolution of La Caridad through the study of fluid inclusion and stable isotopes (S, O, H).
The temporal link between La Caridad porphyry copper deposit and the La Caridad High
Sulfidation epithermal deposit is explored through U-Pb isotopes.
Chapter 3: “U-PB ZIRCON AND RE-OS MOLYBDENITE
GEOCHRONOLOGY FROM LA CARIDAD PORPHYRY COPPER DEPOSIT:
INSIGHTS FOR THE DURATION OF MAGMATISM AND MINERALIZATION IN
THE NACOZARI DISTRICT, SONORA, MEXICO” (in review in Mineralium
Deposita) focuses on the longevity of the La Caridad PCD from a magmatic point of
view using U-Pb LA-ICP-MS-MC in single zircons, and from a mineralization
perspective using Re-Os geochronology in molybdenites.

24
Chapter 4: “RE-OS MOLYBDENITE AND LA-ICPMS U-PB ZIRCON
GEOCHRONOLOGY FROM MILPILLAS PORPHYRY COPPER DEPOSIT:
INSIGHTS FOR MINERALIZATION IN THE CANANEA DISTRICT, SONORA,
MEXICO” (in review in Revista Mexicana de Ciencias Geologicas) deals with the timing
of mineralization and magmatism in the Milpillas PCD deposit, a hidden deposit in the
Cananea district. In addition, I address the implications of these results within the timing
of deposits in the Cananea district and northwestern Mexico.
The final chapter, chapter five, entitled “RE-OS AND U-PB
GEOCHRONOLOGY OF EL ARCO PORPHYRY COPPER DEPOSIT, BAJA
CALIFORNIA MEXICO” (In review in Journal of South American Earth Sciences)
presents new Re-Os and U-Pb ages for El Arco porphyry copper, properly reassigning
this deposit to the Middle Jurassic period, and not to the Cretaceous as previously thought.
The new age determinations for El Arco have strong metallogenetic and tectonic
implications, because no Jurassic porphyry, epithermal or replacement-type deposits have
been previously reported in Mexico.

25 REFERENCES
Anderson, T.H. and Silver, L.T., 1977. Isotope ages of Granitic plutons, Cananea, Sonora. Economic Geology, 72(5): 827-836.
Arribas, A.J., Hedenquist, J.W., Itaya, T., Okeda, T., Concepcion, R.A. and Garcia, J.S., Jr., 1995. Contemporaneous formation of adjacent porphyry and epithermal Cu-Au deposit over 300 ka in northern Luzon, Philippines. Geology, 23: 337-340.
Barra, F., 2003. A Re-Os study on sulfide minerals from the Bagdad porphyry Cu-Mo deposit, northern Arizona, USA. Mineralium Deposita, 38: 585-596.
Burnham, C.W., 1979. Magmas and hydrothermal fluids. In: H.L. Barnes (Ed), Geochemistry of hydrothermal ore deposits. John Wiley & Sons, New York, pp. 71-136.
Camus, F., 2003. Geologia de los Sistemas Porfiricos en los Andes de Chile. Servicio Nacional de Geologia y Mineria, Santiago, 267 pp.
Carreon-Pallares, N., 2002. Structure and tectonic history of the Milpillas porphyry copper district, Sonora, Mexico. M.S. Thesis, University of Utah, 72 pp.
Cathles, L.M., Erendi, A.H.J. and Barrie, T., 1997. How long can a hydrothermal system sustained by a single event? Economic Geology, 92: 766-771.
Clark, A.H., Archibald, D.A., Lee, A.W., Farrar, E. and Hodgson, C.J., 1998. Laser probe 40 Ar/39Ar ages of early- and late-stage alteration assemblages, Rosario porphyry copper-molybdenum deposit, Collahuasi district, I region, Chile. Economic Geology, 93: 326-337.
Cornejo, P., Tosdal, R.M., Mpodozis, C., Tomlinson, A.J., Rivera, O. and Fanning, M., 1997. El Salvador, Chile porphyry copper deposit revisited: Geologic and geochronologic framework. International Geology reviews, 39: 22-54.
Damon, P., Shafiqullah, M., Clark, K., 1983. Geochronology of the porphyry copper deposits and related mineralization of Mexico. Canadian Journal of Earth Sciences, 20(6): 1052-1071.
Dilles, J.H. and Proffett, J.M., 1995. Metallogenesis of the Yerington batholith, Nevada. In: F.W. Pierce and G.J. Bolm (Eds), Porphyry Copper Deposits of the American Cordillera. Arizona Geological Society Digest 20, Tucson, pp. 306-315.
Field, C.W., Zhang, L., Dilles, J.H., Rye, D.M. and Reed, M.H., in press. Sulfur and oxygen isotopic record in sulfate and sulfide minerals of early, deep, pre-main stage

26
porphyry Cu-Mo and late main stage base-metal mineral deposits, Butte district, Montana. Chemical Geology.
Harris, A.C. and Golding, S.D., 2002. New evidence of magmatic-fluid-related phyllic alteration: Implications for the genesis of porphyry Cu deposits. Geology, 30(4): 335-338.
Harris, A.C., Kamenetsky, V.S., White, N.C., van Archterbergh, E. and Ryan, C.G., 2003. Melt Inclusions in veins: linking magmas and porphyry Cu deposits. Science, 302: 2109-2111.
Hattori, K.H. and Keith, J.D., 2001. Contribution of mafic melts to porphyry copper mineralization: evidence from Mount Pinatubo, Phillippines, and Bingham Canyon, Utah, USA. Mineralium Deposita, 36: 799-806.
Hedenquist, J.W., Arribas, A.J. and Reynolds, J.R., 1998. Evolution of an intrusion-centered hydrothermal system: Far Southeast-Lepanto porphyry and epithermal Cu-Au deposits, Philippines. Economic Geology, 93: 373-404.
Heinrich, C.A., Gunther, D., Audetat, A., Ulrich, T. and Frischknecht, R., 1999. Metal fractionation between magmatic brine and vapor, determined by microanalysis. Geology, 27(8): 755-758.
Hollister, V.F., 1974. Regional characteristics of porphyry copper deposits of South America. Society of Mining Engineers Trans, 256: 45-53.
Horita, J., Cole, D.R. and Wesolowski, D.J., 1995. The activity-composition relationship of oxygen and hydrogen isotopes in isotopes in aqueous salt solutions: III. Vapor-liquid equilibration of NaCl solution to 350oC. Geochimica et Cosmochimica Acta, 59: 1139-1151.
Lang, J.R. and Eastoe, C.J., 1988. Relationships between a Porphyry Cu-Mo deposit, base and precious metal veins, and Laramide intrusions, Mineral Park, Arizona. Economic Geology, 83: 551-567.
Lang, J.R. and Titley, S.R., 1998. Isotopic and geochemical characteristics of Laramide magmatic systems in Arizona and implications for the genesis of porphyry copper deposits. Economic Geology, 93: 132-170.
Lips, L.W.A., Herrington, R.J., Stein, G., Kozelj, D., Popov, K. and Wijbrans, J.R., 2004. Refined Timing of Porphyry Copper Formation in the Serbian and Bulgarian Portions of the Cretaceous Carpatho-Balkan Belt. Economic Geology, 99(3): 601-609.

27
Long, K.R., 1995. Tables from Production and reserves of Cordilleran (Alaska to Chile) porphyry copper deposits. In: F.W. Pierce and G.J. Bolm (Eds), Porphyry Copper Deposits of the American Cordillera. Arizona Geol. Soc. Digest 20, Tucson, pp. 51-68.
Losada-Calderon, A.J. and McPhail, D.C., 1996. Porphyry and high sulfidation epithermal mineralization in the Nevados del Famitina mining district, Argentina. Special Publication 5. Society of Economic Geologists, Boulder, pp. 91-117.
Lowell, J.D., 1974. Regional characteristics of porphyry copper deposits of the southwest. Economic Geology, 69: 601-617.
Maksaev, V., Munizaga, F., McWilliams, M., Fanning, M., Mathur, R., Ruiz, J. and Zentelli, M., 2004. New Chronology for El Teniente, Chilean Andes, from U-Pb, 40Ar/39Ar, Re-Os, and fission track Dating. In: R.H. Sillitoe, J. Perello and C.E. Vidal (Eds), Andean Metallogeny: New discoveries, Concepts and Updates. Society of Economic Geologists, Special Publication, Boulder, pp. 15-54.
Marsh, T.M., Einaudi, M.T. and McWilliams, M., 1997. 40 Ar/39Ar geochronology of Cu-Au and Au-Ag mineralization in the Potrerillos district, Chile. Economic Geology, 92: 784-806.
Masterman, G.J., Cooke, D.R., Berry, R.F., Clark, A.H., Archibald, D.A., Mathur, R., Walshe, J.L. and Duran, M., 2004. 40Ar/39Ar and Re-Os geochronology of porphyry copper-molybdenum deposits and related copper-silver veins in the Collahuasi district, Northern Chile. Economic Geology, 99: 673-690.
Mathur, R., Ruiz, J. and Munizaga, F., 2000. Relationship between copper tonnage of Chilean base-metal deposit and Os isotope ratios. Geology, 28(6): 555-558.
Mathur, R. D., 2000. Re-Os Isotopes of base metal porphyry deposits. PhD Thesis, University of Arizona, Tucson, 155 pp.
Mathur, R., Ruiz, J., Titley, S., Gibbins, S., In press. A detailed Re-Os isotope study of ores and sediments from Ertsberg District: Evidence linking porphyry copper mineralization and the importance of the surrounding continental crust as a source of metals. Ore Geology Reviews
McCandless, T.E. and Ruiz, J., 1993. Rhenium-osmium evidence for regional mineralization in southwestern North America. Science, 261: 1282-1286.
McInnes, B.I., McBride, J.S., Evan, N.T., Lambert, D.D. and Andrew, A.S., 1999. Osmium isotope and noble metal recycling in subduction zones: Implications for metallogenesis of porphyry-epithermal Cu-Au deposits. Science, 286: 512-516.

28
Norton, D.L. and Cathles, L.M., 1979. Thermal aspects of ore deposition. In: H.L. Barnes (Ed), Geochemistry of Hydrothermal Ore Deposits. John Wiley and Sons, New York, pp. 611-631.
Norton, D.L. and Knight, J., 1977. Transport phenomena in hydrothermal systems: cooling plutons. American Journal of Sciences, 277: 937-981.
Norton, D.L. and Taylor, H.P., 1979. Quantitative simulation of the hydrothermal system of crystallizing magmas on the basis of transport and oxygen isotopes data: An analysis of the Skaegaard intrusion. Journal of Petrology, 20: 421-486.
Ohmoto, H. and Goldhaber, M.B., 1997. Sulfur and carbon isotopes. In: H.L. Barnes (Ed), Geochemistry of Hydrothermal Ore deposits. John Wiley & Sons, New York, pp. 517-612.
Redmond, P.B., Einaudi, M.T., Inan, E.E., Landtwing, M.R. and Heinrich, C.A., 2004. Copper deposition by fluid cooling in intrusion-centered system: new insights from the Bingham porphyry ore deposit, Utah. Geology, 32: 217-220.
Reynolds, T.J. and Beane, R.E., 1985. Evolution of hydrothermal characteristics at the Santa Rita, New Mexico, porphyry copper deposit. Economic Geology, 80: 1328-1347.
Selby, D. and Creaser, R.A., 2001. Re-Os geochronology and systematic in molybdenite from the Endako porphyry molybdenum deposit, British Columbia, Canada. Economic Geology, 96: 197-204.
Skinner, B. J., 1979. The many origins of hydrothermal mineral deposits. In: H.L. Barnes (Ed), Geochemistry of Hydrothermal Ore Deposits. John Wiley and Sons, New York, pp. 1-21.
Shinohara, H. and Hedenquist, J.W., 1997. Constraints on magma degassing beneath the Far Southeast Porphyry Cu-Au deposit, Philippines. Journal of Petrology, 38: 1741-1752.
Shmulovich, K.L., Landwehr, D., Simon, K. and Heinrich, W., 1999. Stable isotope fractionation between liquid and vapor in water-salt systems up to 600 oC. Chemical Geology, 157: 343-254.
Singer, D.A., 1995. World class base and precious metal deposits -A quantitative analysis. Economic Geology, 90: 88-104.
Taylor, H.P., 1974. The application of oxygen and hydrogen isotope studies to problems of hydrothermal alteration and ore deposition. Economic Geology, 69: 843-883.

29
Taylor, H.P., 1997. Oxygen and hydrogen isotope relationships in hydrothermal mineral deposits. In: H.L. Barnes (Ed), Geochemistry of hydrothermal mineral deposits. John Wiley, New York, pp. 229-302.
Titley, S.R., 1981. Geologic and tectonic setting of porphyry copper deposits in the southern cordillera. In: W.R. Dickinson and W.P. Payne (Eds), Relations of tectonics to ore deposits in the southern cordillera. Arizona Geological Society XIV, pp. 79-98.
Titley, S.R., 1982. Geologic setting of porphyry copper deposits, southeastern Arizona. In: S.R. Titley (Ed), Advances in Geology of the Porphyry Copper Deposits, Southwestern North America. University of Arizona Press, Tucson, pp. 37-58.
Titley, S.R., 2001. Crustal affinities of metallogenesis in the American Southwest. Economic Geology, 96: 1323-1342.
Titley, S.R. and Anthony, E.Y., 1989. Laramide mineral deposits in Arizona. In: J. Jenney and S.R. Reynolds, (Eds), Geologic Evolution of Arizona. Arizona Geological Society Digest v. 17, Tucson, pp. 485-514.
Titley, S.R. and Beane, R.E., 1981. Porphyry copper deposits, Part I, geologic settings, petrology, and tectogenesis. Economic Geology, 75th Anniversary Volume, p. 214-235.
Titley, S.R. and Hicks, C.L., eds., 1966. Geology of the Porphyry Copper Deposits, Southwestern North America. Tucson, Univ. of Arizona Press, 287p.
Ulrich, T., Gunther, D. and Heinrich, C.A., 2001. Evolution of a porphyry Cu-Au deposit, based on LA-ICP-MS analysis of fluid inclusions, Argentina. Economic Geology, 96.
Wodzicki, W., 1995. The evolution of Laramide igneous rocks and porphyry copper mineralization in the Cananea district, Sonora, Mexico. PhD Thesis, University of Arizona, Tucson, 181 pp.

30
FIGURE 1.1 Circum-Pacific map showing distribution of Cu in porphyry copper deposits, in Million of tons (Resources + Production) by region (modified from Camus 2003).

31 CHAPTER 2: EVOLUTION AND TRANSITION OF AN ORE BEARING HYDROTHERMAL FLUID FROM A COPPER PORPHYRY TO HIGH SULFIDATION EPITHERMAL DEPOSIT AT LA CARIDAD, SONORA, MEXICO.
2.1, INTRODUCTION
Numerous studies on porphyry type ore deposits have been undertaken to
understand the evolution of hydrothermal fluids (e.g. Gustafson and Hunt, 1975; Eastoe,
1978; Reynolds and Beane, 1985; Bowman, et al., 1987; Dilles and Einaudi, 1992; Dilles
et al, 1992; Beane and Bodnar, 1995; Hedenquist et al., 1998; Audetat et al., 1998; Selby
et al., 2000; Ulrich et al., 2001; Landtwing, et al., 2002; Redmond et al., 2004). The
broad view of early studies of porphyry deposits in North America suggests a major
involvement of meteoric water during the main stages of mineralization (Taylor, 1974;
1979; 1997 and references therein). Models for alteration and mineral precipitation were
constructed on this basis. More recent studies have emphasized the importance of
magmatic fluids evolving through space and time relative to that of meteoric water
(Shinohara and Hedenquist, 1997).
Spatial and temporal links between porphyry Cu deposits and epithermal deposits
were suggested early by Sillitoe (1973; 1983; 1989). Subsequently, at least 15 examples
have been documented in the Andean Cordillera (i.e. Nevados de Famatina and La
Mejicana, Argentina, Losada-Calderon and McPhail, 1996; Maricunga Belt, Chile,
Muntean and Einaudi, 2001; Agua Rica, Argentina, Landtwing, et al., 2002) and SE Asia
(i.e Lepanto, Philippines, Arribas et al., 1995; Hedenquist et al., 1998; Tombubilato,
Indonesia, Perello, 1994; Ladolam, Lihir Island, Papua New Guinea, Muller et al., 2002).

32 However, in SW North America, the second most important porphyry copper province,
no example has yet been documented, possibly because of the tectonic environment,
erosion level and extensive post-mineralization magmatism.
In order to understand the origin and evolution of hydrothermal fluids it is
necessary to combine a thorough understanding of field geology, paragenetic sequences,
fluid inclusions and stable isotopes on the same suite of samples. Although a number of
detailed studies have been undertaken within the southwestern US, such studies are very
limited in scope within Mexico (i.e. Wodzicki, 2001).
Due to the complex nature of magmatic-hydrothermal systems, more detailed
studies are needed to elucidate the age relationships between igneous rocks, alteration
and mineralization events, in order to arrive at a better understanding of the relative roles
of different fluids and metal sources.
La Caridad porphyry copper deposit, located in northeastern Sonora, Mexico (Fig.
2.1) is currently the largest copper producer in Mexico and the youngest dated porphyry
system in the American Southwest region. It is hosted by a Laramide igneous suite of
intermediate to felsic composition. A single major mineralization event (Valencia et al.,
in review), well-defined and well-preserved hydrothermal alteration zones, a clearly
recognizable paragenetic sequence, and most important, an epithermal high-sulfidation
deposit that appears to be linked genetically to the porphyry copper deposit are present at
La Caridad district. All of these characteristics, along with ready access to previous
drilling information, have allowed us to perform a systematic study of its hydrothermal
evolution.

33
In this article we use new field data, fluid inclusions and stable isotopes (O, H,
and S) to understand the hydrothermal evolution of La Caridad deposit. In addition, U-Pb
geochronology is used to demonstrate the genetic relationship between La Caridad
porphyry copper deposit and La Caridad Antigua high sulfidation epithermal deposit.
2.2, GEOLOGY
2.2.1, Regional Geology
The La Caridad deposit of northeast Sonora, Mexico, is located within the North America
Terrane (Campa and Coney, 1983). Plutonic and volcanic rocks of upper Cretaceous-
Eocene age (75-50 Ma, Shafiqullah et al., 1980) are widespread throughout Southern
Arizona, New Mexico and northern Sonora and were emplaced during the Laramide
Orogeny as a result of low angle subduction. Most of the porphyry copper mineralization
in the southwest is associated with this tectono-magmatic event.
The basement of the North American Terrane in this region is the Precambrian
Pinal Schist (1.68 Ga), which is intruded by 1.41-1.48 Ga anorogenic granites (Anderson
and Silver, 1981; Anderson and Bender, 1989). Overlying Paleozoic sedimentary rocks in
Northeast Sonora (Gonzalez-Leon, 1986; Stewart et al., 1990) represent the southern
extension of the continental platform and slope sequences of the Cordilleran
Miogeosyncline (Rangin, 1978; Stewart, 1988). Precambrian and Paleozoic rocks are
overlain and intruded by Jurassic volcanic and plutonic rocks that are part of a continental
magmatic arc (Anderson and Silver, 1978; Tosdal et al 1989), followed by Mid-
Cretaceous sedimentary sequences. These comprise volcanogenic continental (Tosdal et

34 al., 1989), shallow marine (platform) and deep marine facies (Valencia Gomez, 1994).
During the Late Cretaceous-Early Tertiary, compression and uplift occurred (McKee and
Anderson, 1998), and volcanic and non-marine sedimentary, including lacustrine,
environments dominated the region (Gonzalez-Leon, 1994, McDowell, et al. 2001;
Chacon-Baca et al., 2002).
After a period of quiescence caused by the eastward migration of the magmatic
arc (Coney and Reynolds, 1977; Damon et al., 1981), renewed magmatism led to the
deposition of extensive felsic to intermediate volcanic sequences of Oligocene age (30-25
Ma) (Shafiqullah et al 1980; Damon et al., 1981; Roldan-Quintana, 1981). Between 27
and 12 Ma, mid-crustal extension was accompanied by the formation of core complexes
(Gans, 1994), followed by Basin and Range normal faulting.
2.2.2, Local Geology
The Nacozari mining district lies within the Basin and Range Province (Raisz,
1959), which features typical horst and graben structures with general NW-oriented
faulting, related to an old structural fabric parallel to the former continental margin. The
old fabric was rejuvenated during Laramide time (Titley, 1976). The district is cut by two
regional structures that divide it into three structural blocks (Fig. 2.2). The La Caridad
and Pilares mines are located in the central block, which acts as a horst, flanked to the
east and west by graben blocks. The Pilares normal fault crops out 7 km west of La
Caridad deposit and has an orientation of N40oW dipping S72oW. The La Caridad normal
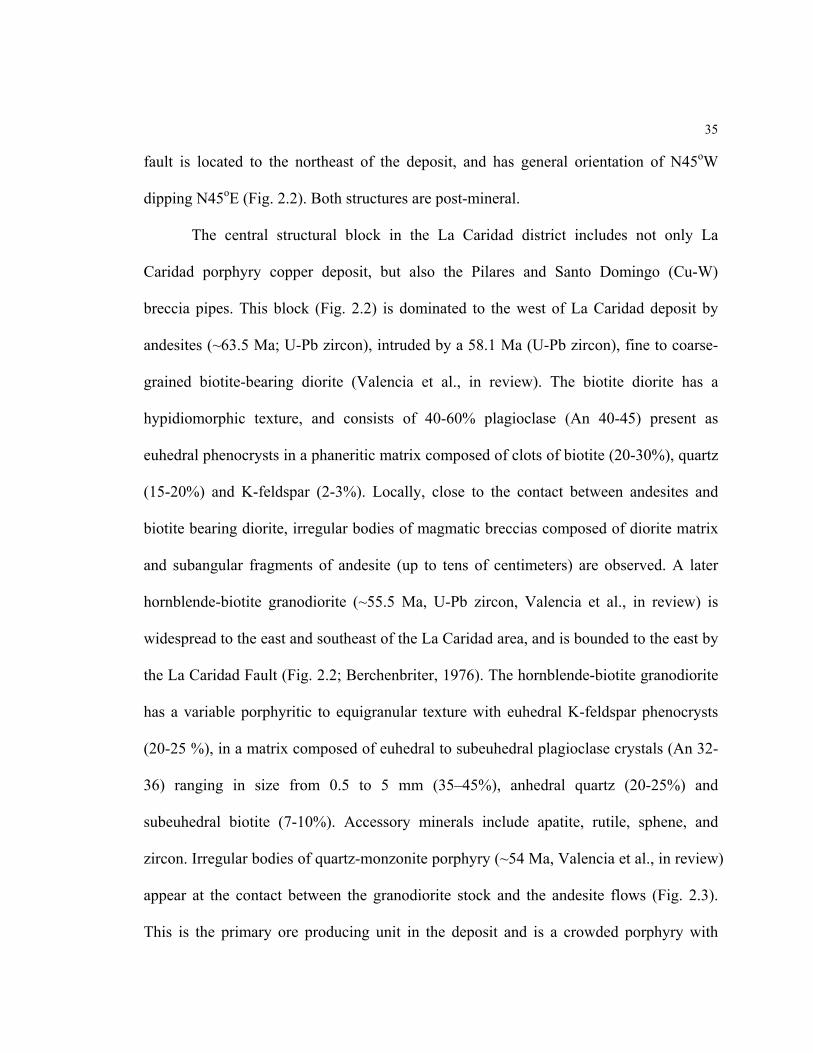
35 fault is located to the northeast of the deposit, and has general orientation of N45oW
dipping N45oE (Fig. 2.2). Both structures are post-mineral.
The central structural block in the La Caridad district includes not only La
Caridad porphyry copper deposit, but also the Pilares and Santo Domingo (Cu-W)
breccia pipes. This block (Fig. 2.2) is dominated to the west of La Caridad deposit by
andesites (~63.5 Ma; U-Pb zircon), intruded by a 58.1 Ma (U-Pb zircon), fine to coarse-
grained biotite-bearing diorite (Valencia et al., in review). The biotite diorite has a
hypidiomorphic texture, and consists of 40-60% plagioclase (An 40-45) present as
euhedral phenocrysts in a phaneritic matrix composed of clots of biotite (20-30%), quartz
(15-20%) and K-feldspar (2-3%). Locally, close to the contact between andesites and
biotite bearing diorite, irregular bodies of magmatic breccias composed of diorite matrix
and subangular fragments of andesite (up to tens of centimeters) are observed. A later
hornblende-biotite granodiorite (~55.5 Ma, U-Pb zircon, Valencia et al., in review) is
widespread to the east and southeast of the La Caridad area, and is bounded to the east by
the La Caridad Fault (Fig. 2.2; Berchenbriter, 1976). The hornblende-biotite granodiorite
has a variable porphyritic to equigranular texture with euhedral K-feldspar phenocrysts
(20-25 %), in a matrix composed of euhedral to subeuhedral plagioclase crystals (An 32-
36) ranging in size from 0.5 to 5 mm (35–45%), anhedral quartz (20-25%) and
subeuhedral biotite (7-10%). Accessory minerals include apatite, rutile, sphene, and
zircon. Irregular bodies of quartz-monzonite porphyry (~54 Ma, Valencia et al., in review)
appear at the contact between the granodiorite stock and the andesite flows (Fig. 2.3).
This is the primary ore producing unit in the deposit and is a crowded porphyry with

36 approximately 50% phenocrysts, mainly of quartz but also micropertithic, twinned K-
feldspar, normally ranging from 1 to 5 mm and locally up to 15 mm. The relative mineral
abundances in the matrix are 30-35% plagioclase, 5-10% K-feldspar, 5-10% quartz and
5-10% biotite. Accessory minerals include apatite, rutile, sphene, and zircon.
Large bodies of quartz-cemented hydrothermal breccia are located around and
within the quartz-monzonite porphyry (Figs. 2.2 and 2.3). The breccias are monolithic to
polymictic, depending on the nature of the adjacent rocks, and are related to the intrusion
of the quartz-monzonite porphyry. Irregular bodies of interlocking biotite with massive
quartz, minor K-feldspar and molybdenite occur at the center and edges of the deposit.
These bodies have been termed “pegmatites” in the past; however, their location mainly
within the breccia unit suggest that they are most likely hydrothermal open-space fillings
(e.g. the Santa Rosa, Guadalupe and Bella Union “pegmatites”). Barren porphyry dykes,
known as “Tan porphyry” (~53.0 Ma; Valencia et al. in review), crop out within the pit
and intrude all the previously mentioned rock units. This unit has an average of 15-20%
quartz and plagioclase phenocrysts in a fine-grained matrix.
The last major geologic events recorded in the central and east blocks resulted in
the deposition of the La Caridad Fanglomerate, which represents an erosional episode
around 24 Ma (Seagart et al., 1974, Berchenbriter, 1976), and Mid-Tertiary ignimbrites,
which occur to the north of the deposit (Fig. 2.2).
The west block contains the El Batamote (56.8 ± 2.4 Ma) and Florida-Barrigon
(52.4 ± 2.2 Ma) porphyry copper prospects (both dates K-Ar in biotite, 2σ error, Damon
et al., 1983) and the block is dominated by a sequence of dacitic to andesitic flows,

37 volcanic breccias and basaltic dykes (Fig. 2.2). By contrast, the east block is dominated
by post-mineral and pre-mineral rocks separated by an erosional unconformity. The pre-
mineral rocks are andesites and rhyolitic ignimbrites (51.3 ± 2.0 Ma, K-Ar whole rock,
2σ, Livingston, 1973), which are intruded by a quartz-monzonite porphyry (mineralizing
phase). They are overlain by the La Caridad Fanglomerate (CF) that represents the first
phase of post-mineral rock deposition. In the northern section, the CF is covered by El
Globo rhyolite (24 Ma, K-Ar, Worcester, 1976) that places the formation of this
fanglomerate before the Miocene. Also in the Eastern block is La Caridad Antigua, a high
sulfidation epithermal deposit, located ~3 km east of La Caridad ore body (Figs. 2.2 and
2.4). This deposit was mined between 1907 and 1916 and is hosted by latites, rhyolites
and andesites that are intruded by a series of small quartz-monzonite porphyry stocks. A
deep drilling prospecting campaign in 1997 showed the presence of the La Caridad Fault
at a depth of 858m below the La Caridad Antigua workings (drill hole DCV-2, Fig. 2.4).
This drill core cut a ~12 m fault zone, below which unaltered granodiorite was
intercepted.
2.2.3, Structure
The structural controls of ore deposition at a district scale in the southwestern
North-America porphyry copper province, appear to be consistent with regional stresses
at the time of ore formation (Titley, 2001). During the Oligocene and Miocene, the region
was extensively faulted, extended and rotated (Wilkins and Heidrick, 1995). The degree
of rotation varied from moderate (30o to 60o) to severe (60o to 90o), resulting in the

38 dismemberment of mineralized districts (i.e. Cananea, San Manuel Kalamazoo, Ajo). The
central block in the La Caridad district has been drilled vertically for 800 m from the
bottom of the Pilares mine, at the contact between the vertical Pilares breccia pipe and the
host rock, revealing no significant deviation of the contact from the vertical. This
suggests that the central block is untilted.
More than 560 local faults and fractures were measured in the La Caridad open pit
at benches 1380 and 1305. These data exhibit two dominant trends: a N31oE oriented, 68o
NW dipping system, and a N26oW oriented, 70o SW dipping system (Fig. 2.5a). The NE
oriented system is less developed than the NW system. These trends, which reflect stresses
existing after the emplacement of the stocks, coincide with the prominent directions
reported for Laramide stocks throughout Arizona (Rehrig and Heidrick, 1972; Heidrick
and Titley, 1982).
Fracturing in and around porphyry copper deposit intrusions results in zones of
permeability through which ore forming fluids can travel, and in which ore minerals are
precipitated. Titley et al. (1986) proposed a method for calculating fracture density, and
showed that fracture density generally increases toward the intrusion or mineralized
center of the porphyry copper deposit. In the La Caridad porphyry copper deposit,
fracture density increases northward from the upper to the lower benches from 0.2 to
0.4/cm-1, consistent with the location of the mineralized center at the northern end of the
open pit (Esquivias-Flores, 1997).
2.2.4, Hypogene alteration and mineralization

39 2.2.4.1, La Caridad Porphyry Copper Deposit
Previous studies of the hydrothermal alteration at La Caridad were performed
during the evaluation of the deposit by Echevarri (1971) and Seagart et al. (1974). Both
works described the alteration in the central core of the deposit as pervasive and
predominantly phyllic (quartz-sericite-pyrite) in nature. Seagart et al. (1974) mentioned
that alteration grades outward from the center, first into a poorly defined, irregular
argillic band (kaolinite-montmorillonite, chlorite), and finally into a narrow propylitic
halo. Local tourmalinization was also recognized in the central and western areas of the
deposit by both authors. The wallrock alteration mineralogy of the supergene oxide ores
was mostly quartz-sericite with kaolinitic clay and residual K-feldspar. A potassic
alteration zone was not recognized at the time, but Echevarri (1971) predicted its
presence at depth. These studies were conducted at the shallow levels of the porphyry
copper system, accessible at that time but currently mined out (Fig. 2.3) and for the most
part within leached capping and supergene enrichment zones, where early hypogene
alteration mineral assemblages were obscured or obliterated.
After 30 years of mining, hypogene mineral assemblages are well exposed in the
present-day pit. They constitute approximately 90% of the copper-molybdenum orebody
in the quartz-monzonite porphyry and hydrothermal breccias (Fig. 2.5 b), and contain
pyrite, chalcopyrite and molybdenite.
Re-logging and/or re-interpretation of several thousand meters of diamond drill
holes, new mapping and re-mapping of benches in the pit with special attention to

40 structure, mineralization and alteration, have made it possible to present an updated
geology of the deposit.
Extensive hydrothermal alteration with superimposed events, common to the
majority of porphyry copper deposits, has been recognized at La Caridad. Documentation
of crosscutting relationships between different vein types and mineral assemblages, in
outcrop as well as in drill cores, permitted a detailed sequence of hydrothermal events to
be established. Petrographic studies of polished and thin sections from outcrop and drill
core samples complemented the field evidence and resulted in a detailed paragenetic
sequence for both silicate and opaque mineral assemblages that has served as the basis for
later fluid inclusion and stable isotope studies. This approach, using diverse techniques,
has allowed us to evaluate the changes in the hydrothermal fluids, their associated
alteration and mineralization as function of time, temperature and pressure, and indirectly
to recognize spatial variations within the deposit.
We recognized four different stages of hypogene hydrothermal alteration, based on
mineral assemblages (Fig. 2.6); corresponding associated vein types and pervasive
alteration patterns at the 1290 level are shown in Figure 2.5 c. These stages are:
1) Stage 1 This stage comprises the potassic alteration assemblage and corresponds to
the earliest stage of alteration. This assemblage crops out mainly in the northern part of
the pit, however, it is also present in the deep levels of the intrusive complex. It occurs as
pervasive replacement of both phenocrysts and groundmass by K-bearing minerals and
sulfide ore minerals, and/or as early quartz veinlets containing also orthoclase ± biotite ±

41 anhydrite ± molybdenite ± chalcopyrite. In deep drill holes, local intense potassic
alteration is recognized as patches of magnetite ± K feldspar ± quartz completely
replacing the host rock. Locally, anhydrite with minor K-feldspar and biotite occurs in
deep-level samples. In the andesite unit, the potassic assemblage is dominated by
secondary biotite, which obliterates the original rock texture. Molybdenite is the most
abundant sulfide mineral, followed by chalcopyrite and pyrite. These minerals occur
within quartz and/or anhydrite veins as fine grained aggregates and disseminated crystals
and molybdenite tends to be present at vein margins. Sparse iron-poor sphalerite crystals
are associated with chalcopyrite in early quartz veins. In general, copper mineralization is
weak in this stage. On the basis of crosscutting vein relationships, eight vein types are
recognized in this stage, namely Substage 1a to Substage 1h (Fig. 2.6).
Local irregular quartz bodies are present mainly in the central and northern part of the
pit. They are characterized by large biotite crystals and thick quartz veins containing
coarse molybdenite and pyrite with minor chalcopyrite and are assigned to substage 1h
(Fig. 2.6). These bodies cut the potassic alteration assemblages, but phyllic alteration
commonly overprints them.
Propylitic alteration appears to be contemporaneous with potassic alteration. It is
poorly developed in the pit area, and is limited to the distal western area of the deposit. It
is observed mainly as selective alteration of mafic minerals and introduction of chlorite-
epidote-calcite into fractures in the andesite. In more pervasive form, it is represented by
the mineral assemblage chlorite-epidote-albite-clay minerals-carbonates.

42
2) Stage II corresponds to the main mineralization event (Table 2.5) and has
generated the most extensive alteration assemblage observed in the pit. Intermediate stage
phyllic alteration replaces and is superimposed on the potassic and propylitic
assemblages from Stage I, locally obliterating the rock texture. The typical mineral
assemblage is sericite–pyrite–quartz and locally minor tourmaline, chlorite and clays,
occurring as veins and pervasive replacements. The phyllic alteration is less intense at the
northern end of the pit (deeper zone) where the potassic alteration assemblages are
dominant. Quartz + sulfide veins and veinlets that have thin sericite selvages (1-2mm)
form part of this assemblage, and cut early quartz-K-feldspar-biotite veins. Alteration
selvages merge with pervasive alteration of large rock volumes where veins are closely
spaced. Such alteration is common in the pit and is more evident in the intrusive complex
(porphyry and granodiorite units). Tourmaline-quartz-pyrite veins are present in the west-
central area of the pit, close to the andesite unit.
Three main vein types are distinguished by cross cutting relationships and
differences in the alteration halo (Fig. 2.6): 2a (quartz-sericite-pyrite±chalcopyrite with
sericite halo), 2b (quartz-sericite-chalcopyrite-pyrite with silica halo) and 2c (tourmaline-
quartz-pyrite). Veinlets from the early Stage I (Fig. 2.6) are clearly cut by 2a, 2b and 2c
veins types.
Most of the copper was deposited during Stage II, along with lesser molybdenite.
The ore grade is evenly distributed within the porphyry quartz monzonite, but higher
grades are developed in the breccia (Fig. 2.5a and b).

43
3) Stage III. This stage corresponds to polymetallic base-metal veins (lead-zinc-
silver-copper) that cut Stages I and II (3a, Fig. 2.6). Sphalerite-galena-chalcopyrite-
pyrite-quartz-carbonate veins, that range from cm to tens of cm in width, were emplaced
mainly at the periphery of La Caridad pit, and locally in the northwestern part of the pit
(Fig. 2.5c).
4) Stage IV. This stage is represented by quartz-tennantite-chalcopyrite-pyrite-
sericite veinlets (vein type 4b) that range in width from a few mm to 10 cm. These veins
cut pyrite-quartz veins (vein type 4a; Fig. 2.6) and both represent the latest alteration
stages and the collapse of the hydrothermal system. This stage is mainly observed in the
central part of the pit (Fig. 2.5c).
5) Supergene mineralization, which has been mined out (See cross section, Fig.
2.3), was present as a blanket about 2 km in diameter with an average thickness of
approximately 50 m and ranging from 10 to 230 m (Seagart et al., 1974).
2.2.4.2, La Caridad Antigua
La Caridad Antigua (LCA) deposit is centered on a quartz monzonite porphyry
stock intruding andesites. Massive silicic alteration extends more than 50 m outward
from the stock. The acid-sulfate and high sulfidation mineral assemblage includes
pyrophyllite, kaolinite, sericite, alunite, quartz, barite and sulfide minerals such as
chalcopyrite, pyrite, enargite, bornite, tetrahedrite-tennantite, covellite and chalcocite,
which are present in massive sulfide replacement bodies (Figs. 2.7).

44
Early paragenetic studies of Wantke (1925) recognized an early stage of pyrite,
quartz and sericite, followed by a later progressive deposition of enargite, tennantite,
bornite and a final stage of barite, alunite and argillite.
Further ore microscopy was performed on selected samples from La Caridad
Antigua, and three events were recognized (Fig. 2.8). Bornite, pyrite and scarce
chalcopyrite form the bulk of the early event of mineralization. These minerals are
replaced in the main event by bluish chalcocite along fractures and grain boundaries.
Locally, bornite exsolves into a myrmekitic intergrowth of bornite + bluish chalcocite.
These copper and copper-iron sulfides are replaced by enargite. Enargite commonly
forms relatively large, subidiomorphic crystals that are clearly recognizable by their bi-
reflectance (Fig. 2.7). At the end of the main event and beginning of the late event,
bornite and early chalcocite are replaced by hypogene covellite. This replacement occurs
prior to or simultaneously with the replacement of bornite, chalcocite and enargite by a
second generation of chalcocite (dark grey).
2.3. FLUID INCLUSION DATA
Thermometric analyses were performed in approximately 400 fluid inclusions
hosted in quartz. Fluid inclusions studies were performed using a SGE, Inc.-adapted
USGS gas flow heating-freezing stage (Were et al., 1979). The SGE stage has a precision
of +0.1oC and +1.4oC at 0.0oC and 374oC, respectively, and horizontal thermal gradients
are below 0.2 oC/cm. The stage was calibrated using SYN FLINC synthetic fluid
inclusions (Sterner and Bodnar, 1984).

45
Inclusions were frozen with cooled nitrogen gas, and freezing-point depression
temperatures (temperature at which last ice remaining in the inclusion melts) were
measured. The measured values were then converted into salinity according to equations
in Bodnar (2003).
Using the classification scheme of Nash (1976) the fluid inclusions at La Caridad
can be classified according to phase composition at room temperature. Type I fluid
inclusions are the most common and consist of two phases: liquid and a vapor bubble, the
liquid amounting to >50% of cavity volume (liquid-rich). Type II also consists of liquid
and vapor, and contains more than 50% of vapor by volume (vapor-rich). Type III fluid
inclusions are multiphase inclusions, containing liquid, vapor and crystalline phases. The
most common solid phase is cubic halite (NaCl). Sylvite (KCl) crystals are more rounded
and disappear at a lower temperature than halite crystals during heating experiments.
Small rectangular prisms with high optical relief, most likely anhydrite, were rarely
observed, and did not dissolve by 500oC. Opaque phases include hematite (red flakes)
and chalcopyrite (triangular to diamond shape).
Most of the microthermometric measurements were made on primary inclusions,
identified by their presence in crystal growth zones or by their occurrence as isolated
inclusions with no visible relationship to other nearby inclusions. A small number of
secondary inclusions that delineated short healed fractures within the crystals were
studied.

46
Stage I. 289 fluid inclusions from Stage I sulfide-bearing quartz veins obtained
from drill core were studied. Inclusion of types I, II and III are present. The fluid
inclusions vary in size from 10 to 40 microns, and are predominantly of type III. Shapes
range from well-developed negative crystals to elongate ellipsoidal shapes. The type III
inclusions contain halite crystals that range in volume from 25 to 40% of the cavity
volume, and commonly small crystals of sylvite. Other daughter minerals (anhydrite and
unidentified crystals) are observed but scarce, whereas hematite is present sporadically.
The type I inclusions have vapor bubbles that range from 5 to 20% of the cavity volume
and occur mostly in fractures, and are interpreted as secondary and typically have lower
salinity and a wide range of homogenization temperatures. Two different types of
secondary fluid inclusions were recognized. One group has highly variable bubble/liquid
ratios, the bubble ranging from 10 to 50% of the liquid volume, whereas the second
group consistently contain >90 liquid (5->60µm). Evidences of necking down was
observed, whereas the formation of CO2 hydrate was not.
The homogenization temperatures of primary type III inclusions in this stage
range from 480 to 330 oC (Fig. 2.6 and 2.9). Eight vein type sub-stages (1a-1h) were
recognized in Stage I based on vein mineralogy and cross-cutting vein relationships (Fig.
2.6). However, only four of these sub-stages yielded suitable material for fluid inclusion
study. These substages have the following homogenization temperature ranges: 1b 470-
380oC; 1d 450-390oC, and 460-390oC, 1g 420-360oC and 1h 380-330 oC (Fig. 2.6 and
Table 2.5). Comparison of modal temperatures suggests a progressive decrease of
temperature during Stage I (Fig. 2.9). However, because of the limited number of

47 samples per sub-stage studied, this cooling trend could be an artifact of sampling.
Salinities of the tri-phase salt-rich Type III fluid inclusions range from 39 to 56
equivalent weight % NaCl (Bodnar, 2003) (Fig. 2.10 and Table 2.5). The Type I and
Type II phases have salinity values mostly below 7 equivalent weight % NaCl. If
evidence of boiling is observed, homogenization temperatures are equal to the trapping
temperatures, and the trapping pressure is equal to the vapor pressure of liquid at boiling
(Bodnar, 2003). When there is no evidence of boiling the vapor pressure of the solution is
less than the ambient pressure, and hence the temperature of homogenization provides a
minimum estimate of the trapping temperature (Roedder, 1984).
Pressure estimates for the salt-rich fluid inclusions (Type III) that coexist with
scarce vapor-rich fluid inclusions (Type II) and that homogenized by vapor
disappearance after halite dissolution, indicate trapping pressures of 320 to 100 bars,
which implies depths of 330-110 m under lithostatic conditions or depths of 3200 m to
1000 m under hydrostatic conditions.
Stage II. Vein samples were also obtained from drill cores. All types three of
fluid inclusions are present. The fluid inclusions vary in size from 5 to 38 microns, with
Type I usually the largest. Shapes range from oval, elongate ellipsoid, irregular to well
developed negative crystal shapes. Type I inclusions contain vapor bubbles that range
from 20 to 30% of cavity volume. In Type II inclusions the liquid phase constitutes ~10-
40 % by volume. Type III inclusions contain a halite crystal that range in volume up to 30
% of the inclusion. Sylvite is less commonly observed than in Stage I. Rare opaque
crystals of triangular section, probably chalcopyrites and other unidentified transparent
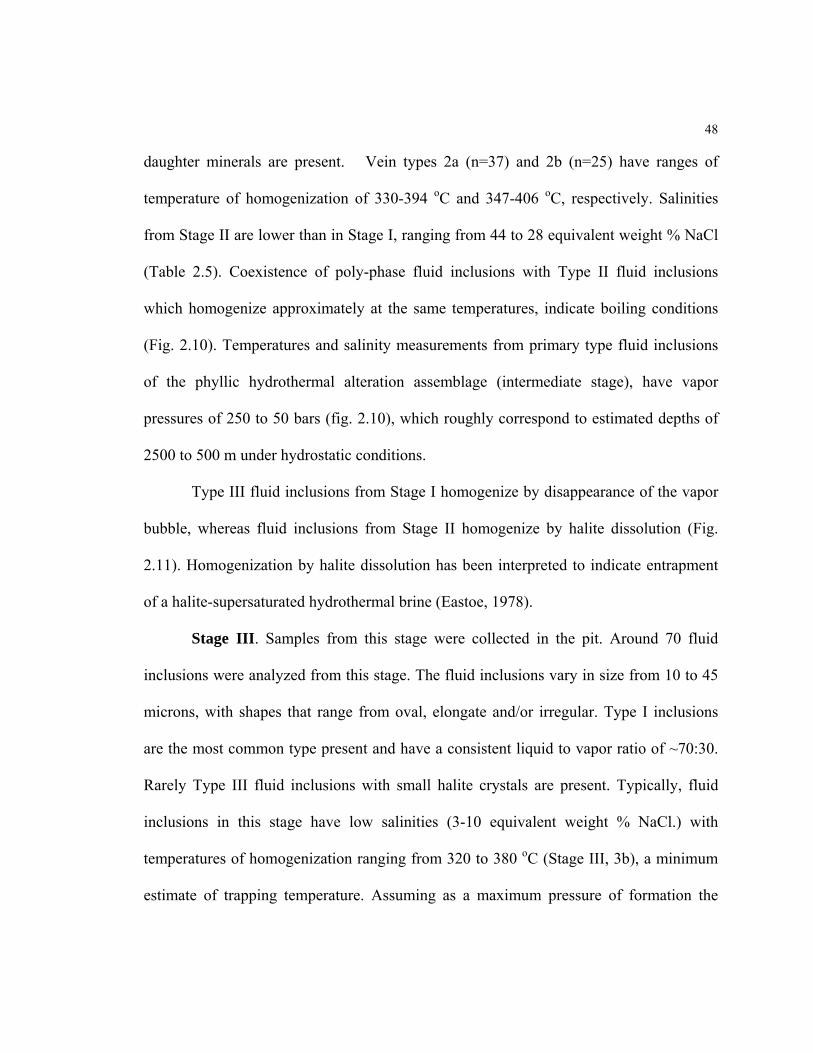
48 daughter minerals are present. Vein types 2a (n=37) and 2b (n=25) have ranges of
temperature of homogenization of 330-394 oC and 347-406 oC, respectively. Salinities
from Stage II are lower than in Stage I, ranging from 44 to 28 equivalent weight % NaCl
(Table 2.5). Coexistence of poly-phase fluid inclusions with Type II fluid inclusions
which homogenize approximately at the same temperatures, indicate boiling conditions
(Fig. 2.10). Temperatures and salinity measurements from primary type fluid inclusions
of the phyllic hydrothermal alteration assemblage (intermediate stage), have vapor
pressures of 250 to 50 bars (fig. 2.10), which roughly correspond to estimated depths of
2500 to 500 m under hydrostatic conditions.
Type III fluid inclusions from Stage I homogenize by disappearance of the vapor
bubble, whereas fluid inclusions from Stage II homogenize by halite dissolution (Fig.
2.11). Homogenization by halite dissolution has been interpreted to indicate entrapment
of a halite-supersaturated hydrothermal brine (Eastoe, 1978).
Stage III. Samples from this stage were collected in the pit. Around 70 fluid
inclusions were analyzed from this stage. The fluid inclusions vary in size from 10 to 45
microns, with shapes that range from oval, elongate and/or irregular. Type I inclusions
are the most common type present and have a consistent liquid to vapor ratio of ~70:30.
Rarely Type III fluid inclusions with small halite crystals are present. Typically, fluid
inclusions in this stage have low salinities (3-10 equivalent weight % NaCl.) with
temperatures of homogenization ranging from 320 to 380 oC (Stage III, 3b), a minimum
estimate of trapping temperature. Assuming as a maximum pressure of formation the

49 pressure obtained on Stage I (320 bars) and using pressure correction data from Bodnar
(2003), the correction to the homogenization temperature is +10 ± 5 oC.
Stage IV. Samples from this stage were collected in the pit. The fluid inclusions
vary in size from 15 to 50 microns, with shapes that range from oval, elongate and/or
irregular. Type I inclusions are the only type present and they have a consistent liquid-
vapor ratio of ~70-65:30-35. Fluid inclusions (n=24) in this stage have low salinities
(<10% equivalent weight % NaCl) with temperatures of homogenization from 260 to 320
oC (Stage IV, 4b). For non-boiling conditions, homogenization temperatures from liquid-
rich fluid inclusions give a minimum estimate of trapping temperature. Using maximum
pressure of formation the pressure obtained on Stage I (320 bars), the temperatures were
corrected using data from Bodnar (2003) as in stage III.
2.4, STABLE ISOTOPES
2.4.1, Oxygen and Hydrogen Isotopes
Quartz samples were analyzed using the bromine pentaflouride method of oxygen
extraction from silicates (Clayton and Mayeda, 1963; Sharma and Clayton, 1964). 3-6 mg
of sample was loaded into nickel bombs under a steam of nitrogen (Friedman and
Gleason, 1973), followed by a 60% excess of bromine pentaflouride. The bombs were
heated at 550-600o C for 8-12 hours, oxidizing the samples. The reaction products were
passed through a cold trap, freezing out all but the oxygen. The liberated oxygen was
converted to CO2 using a platinized carbon catalyst at 600 oC (Clayton, 1955; Taylor and
Epstein, 1962). Yields were measured using an Omega manometer, and CO2 generated

50 from silicate oxygen was analyzed for δ18O on a gas-source Finnegan Mat Delta S mass
spectrometer. This method gave a yield of 95-100%, with possible sources of error
including loading difficulties, analytical balance and manometer fluctuations. Standards
were Brazilian quartz (+15.0 ‰) and NCSU quartz (+11.6‰); these were standardized
against National Bureau of Standards # 28 (+ 9.58‰) (Rollog, 2003). One standard was
run per ten analyses and the standard deviation of the mean for the standards was ~0.17‰.
The δ18Ο of sulfates was measured on a continuous-flow gas-ratio mass spectrometer
(ThermoQuest Finnigan Delta PlusXL). Samples were combusted with excess C at 1350
°C using a ThermoQuest thermal combustion elemental analyzer (TCEA) coupled to the
mass spectrometer. Standardization is based on international standard OGS-1. Precision
is estimated to be ± 0.3 per mil or better (1σ), based on repeated internal standards. The
δD values of OH bearing minerals were measured on the same continuous-flow gas-ratio
mass spectrometer. Samples were combusted at 1400 oC using the TCEA.
Standardization is based on NIST SRM 8540. Precision is better than ± 2.5 per mil on the
basis of repeated internal standards.
Representative minerals from the different paragenetic stages in the deposit were
analyzed for O and H isotopes (Table 2.1). The quartz-water oxygen isotope fractionation
factors of Clayton et al. (1972), coupled with fluid inclusion temperatures, were used in
order to calculate δ18O of waters in equilibrium with quartz from each stage of
mineralization in the deposit, and for anhydrite-water oxygen isotope fractionation, the
factor used was from Chiba et al. (1981).

51
For hydrous minerals, δD of coexisting water was calculated using fluid inclusion
temperatures and the experimental fractionation equations of Suzuoki and Epstein (1976)
for biotite and sericite and Stoffregen et al. (1994) for alunite (Table 2.1).
The calculated δ 18O and δD ranges of water in equilibrium with Stage I
assemblages (Fig. 2.12) are 6.8 to 8.1‰ and -25 to -42 ‰, respectively. In sub-stage 1h
the values are 5.6 and 6.5 ‰ for δ 18O and -26 ‰ for δ D. Stage II water has values of
5.1 to 7.3 ‰ for δ 18O and -24 to -30 ‰ for δD; and for one sample from the Stage IV the
coexisting water has δ 18O and δD values of 7.7 and -7 ‰, respectively (Table 2.4).
Alunite from the upper levels of the pit was in equilibrium with water of a δD
value of -8‰ (similar to Stage IV water), whereas alunite from La Caridad Antigua
equilibrated with water δD value of –60‰.
Calculated hydrothermal fluids associated with the Stage II assemblages have
δ 18O and δD values similar to those measured to hydrothermal fluids associated with
Stage I assemblages, substage 1h and Stage IV (Fig. 2.12). The isotopic similarity with
hydrothermal fluids associated with phyllic and potassic alteration (Fig. 2.12) has been
interpreted in other porphyry copper deposits as indicating a predominantly magmatic
signature where the data falls within the magmatic water field/box (e.g. Wodzicki, 2001).
In general, mixing of fluids have been invoked as a precipitation mechanism for
ores and as the cause for changes in nature of hydrothermal alteration (i.e. Sheppard and
Taylor, 1974; Taylor, 1974; 1979; 1997; Norton, 1978; Bodnar and Beane, 1980, Henley
and McNabb, 1978, Beane and Titley, 1981; Guilbert and Park, 1986, Bowman et al.,

52 1987). The role of meteoric waters in the formation and evolution of porphyry copper
deposits has been a matter of debate in the last few decades. Taylor (1974; 1979; 1997
and references therein) concluded that large quantities of meteoric waters are involved in
the evolution of Southwest North American porphyry copper deposits. Henley and
McNabb (1978), suggested that changes in the fluid composition from early potassic
alteration to phyllic involved to a decrease in the salinity as a response to mixing of
meteoric and magmatic waters. Recent studies in several porphyry copper deposit (i.e. El
Salvador, Rio Blanco, El Teniente in Chile; Far Southeast, Philippines; Cananea in
Mexico) have shown that phyllic alteration is largely, if not exclusively, related to
magmatic fluids, supporting an orthomagmatic model (i.e. Burnham, 1979; 1997;
Kusakabe et al., 1990; Shinohara and Hedenquist, 1997; Hedenquist et al., 1998;
Hedenquist and Richards, 1998; Heinrich et al., 1999; Wodzicki, 2001). Other workers
have suggested mixing in PCDs between magmatic fluid and formation water (Bowman
et al., 1987, at Bingham, USA), and between magmatic water and isotopically-exchanged
seawater (Osatenko and Jones, 1976, at Valley Copper, British Columbia; and Chivas et
al., 1984, at Waisoi, Fiji). In the latter two cases, water isotope compositions plot well
above the magmatic water box.
Harris and Golding (2002) suggested that the mineralization and phyllic alteration
are a consequence of the phase separation (boiling) of magmatic fluid. The isotope effect
of boiling can be plotted using experimental data from Schmulovich et al. (1999). If a
fluid with initial isotope composition “S” (Fig. 2.12) boils, the vapor will be enriched in
deuterium and depleted in 18O (upward arrow in Fig. 2.12), while the residual liquid will

53 evolve in the opposite direction (downward arrow in Fig. 2.12). Mineral assemblages in
equilibrium with vapor would therefore yield data plotting above the magmatic water box,
potentially overlapping the area of the diagram that has formely been interpreted in terms
of mixing between magmatic water and seawater.
In summary, four main models have been proposed to describe the relative roles
of magmatic and other types of waters, including meteoric waters in PCDs. In the first
case, deposits show a clear isotopic distinction between hydrothermal fluid associated
with potassic alteration and that associated to phyllic alteration. The distinction is
interpreted as a transition from a magmatic fluid to meteoric waters, or less commonly
seawater or formation waters. In the second model it is proposed that all waters are of
primary magmatic origin. In the third model, all isotope values for water plot above the
magmatic water box, as a result of alteration by magmatic vapor. A four model envisage
the mixing of formation water with magmatic water.
The O and H isotope data indicate that magmatic fluid either evolved without
mixing with an external fluid, or mixed predominantly with water other than meteoric
water. The observed scatter in δ 18O in Figure 2.12 may be evidence of a small addition
of meteoric water. The δD data, however, indicate a different process, possibly a boiling
trend. Hence, fractionation of isotopes resulting from boiling is one possible explanation
of the isotope composition of the hydrothermal fluids in Stage I, II and III. A second
possible explanation is mixing of magmatic water with highly evaporated lacustrine
water (see in Fig. 2.12, evaporation line of Gat, 1981), a possibility that will be discussed
further in light of S-isotope data.

54
2.4.2, Sulfur Isotopes
Values of δ34S of different sulfides and sulfates were measured on a continuous-
flow gas-ratio mass spectrometer (Finnigan Delta PlusXL). Samples were combusted at
1030 oC with V2O5 using an elemental analyzer (Costech) coupled to the mass
spectrometer. Standardization is based on international standards OGS-1 and NBS123,
and several other sulfide and sulfate materials that have been compared between
laboratories. Calibration is linear in the range -10 to +30 per mil. Precision is estimated
to be ± 0.15 or better (1σ), based on repeated internal standards.
Sulfur isotopic data for 40 sulfate and sulfide samples are summarized in Table
2.2. The δ34S values of sulfides from Stage I and II are between 3.1 and 5.2 ‰. Stage III
sulfides vary from 2.6 to 4.2‰ and those from of Stage IV range from -4.1 to 3.3 ‰.
Anhydrite invariably has higher δ34S values than associated or coexisting sulfides. The
δ34S values of anhydrite range from 5.7 to 8.0 ‰ and no systematic variation with depth
and/or mineral association is observed. Barite from La Caridad Antigua has a δ34S value
of 18.2‰. Anhydrites from Stage I from La Caridad have a range of δ18O from 7.0 to
9.2‰. The δ18O values of water in equilibrium with anhydrite (Chiba et al., 1981) range
from 5.6 to 7.8 ‰, identical to the δ18O range calculated for the quartz from Stages I and
II, therefore, anhydrite and quartz of Stage I presumably formed from the same type of
water. Similar δ18O values were reported for anhydrite from the potassic alteration in the
Butte PCD (Field et al., in press).

55
The isotopic separation of sulfides and sulfates is unusually small compared to
other PCDs for which there are data (Fig. 2.13).
2.4.2.1, Sulfur isotope geothermometry
Isotopic equilibrium between sulfide and sulfate species is probably attained
within a short period of time at temperatures characteristic of magmatic hydrothermal
environments (Ohmoto and Goldhaber, 1997). At 400oC, ∆34S (anhydrite-sulfide) is
about 16‰ at equilibrium. Where isotopic equilibrium is attained, ∆34S can be used to
calculate temperatures of formation of anhydrite-sulfide assemblages (Ohmoto and
Lasaga, 1982). Likewise, temperatures can be calculated for suitable pairs of sulfide
minerals.
Anhydrite-sulfide pairs from La Caridad have a small ∆34S ranging from 2 to 4 ‰
and temperatures were calculated using equations of Ohmoto and Lasaga (1982). For
sulfide-sulfide pairs which ∆34S range of 0 to 3.3‰. temperatures were calculated using
equations of Ohmoto and Rye (1979). Sulfate-sulfide pairs from Stage I yielded aberrant
high temperatures (>1000oC). On the other hand, temperatures from sulfide-sulfide pairs
range from >2000 oC to 90 oC (Table 2.2).
Temperatures calculated using stable isotope geothermometry are far from those
obtained by fluid inclusions, and thus reflect a high degree of isotopic disequilibrium.
Many mechanisms have been proposed to explain isotopic disequilibrium: fluid mixing
(Ohmoto and Lasaga, 1982), dissolution and re-precipitation of pre-existing sulfates and
sulfides (Field and Gustafson, 1976; Shelton and Rye, 1982), preservation of a higher

56 temperature equilibrium with declining temperature (Ohmoto and Lasaga, 1982; Shelton
and Rye, 1982), rapid cooling (Ohmoto and Rye, 1979) and/or non-equilibrium
oxidation-reduction in the fluid (Shelton and Rye, 1982), and rapidity of reduction of
sulfate transported from surrounding rocks (Lang et al., 1989). A recent study by Field et
al., (in press) suggests other processes that may cause significant changes in the
H2S/SO42- and Σδ34S of the parental fluids. These processes include boiling, assimilation
of sulfur from wall rocks and loss of sulfur during magma ascent. It is not currently
possible to precisely establish which mechanism(s) is responsible for the disequilibrium
observed at La Caridad.
2.4.2.2, Source of sulfur
Porphyry copper deposits, besides being anomalous concentrations of copper, are
giant anomalous concentrations of sulfur (Hedenquist and Richards, 1998). The source of
such large amounts of sulfur is a fundamental question. Mantle-derived igneous rocks
have sulfur isotope values of 0 ± 3 ‰ (Ohmoto and Rye, 1979). These authors suggested
a magmatic origin for the sulfur in the American Cordillera PCDs on the basis of δ34S
values near to zero. Common sulfur sources in porphyry copper deposits are felsic
magmas (Burnham, 1979), which may have assimilated country rocks (Sheppard and
Taylor, 1974). Recently, mafic melts underlying the felsic magma have been proposed as
a possible sulfur source (Hattori and Keith, 2001). Mass balance calculations from Banks
(1982) pointed out that felsic magmas or basement rocks could not be the source of

57 sulfur, and assessed the existence of a “hidden special magma” or igneous source rock
and concluded that these do not solve the problem of the source of sulfur.
One way to determine the bulk composition value of the sulfur source, is by
plotting the δ34S versus ∆34S sulfate-sulfide (Field and Gustafson, 1976). This plot has
been used to explain the isotopic relationship between various solid phases and aqueous
species, and it also theoretically marks the isotopic composition of the total sulfur in the
system (δ34SΣS), which is 6.6 ‰ at La Caridad (Fig.2.14). The ratio of aqueous SO4-2:
H2S is 3:1, in the early stages. Field et al (In press) suggested that the 3:1 ratio indicates
that SO2 is the only sulfur species in the magmatic gas. As SO2 cools down, it
disproportionates according to the reaction:
4 SO2+ 4H2O → 3H2SO4 + H2S.
The sulfide data suggest a magmatic source (0-4‰), however, sulfates coupled
with sulfides have a small ∆34S sulfate-sulfide values during Stage I at La Caridad
deposit. This small isotope separation between sulfates and sulfides is inconsistent with
sulfur species evolving at or near isotopic equilibrium from high temperature in a
magmatic fluid. Most deposits in which such evolution is thought to occur show a much
closer approach to equilibrium than in the case at La Caridad (Fig.2.13). Partial reduction
of the sulfate in the deposit cannot explain the range of data, because the hydrothermal
system, where partial reduction of the sulfate is thought to occur at 300-400 oC (e.g. VMS
deposits), develop isotopic equilibrium. Instead, the data are more consistent with sulfate

58 introduced from outside the deposit, and precipitated quickly along with sulfide minerals,
formed with H2S of a different source. Norton (1982) proposed Mesozoic and Paleozoic
marine evaporates as an external source of sulfate in Southwestern North America PCDs.
Marine evaporates (of 10 to 30‰) cannot account for the sulfate at La Caridad deposit,
but lacustrine evaporates have a suitable δ34S range. Gu (2004, pers. comm.) reports δ34S
values ranging from 6 to 9‰ for several Mid-Tertiary to Recent evaporites deposits in
Arizona. In northeastern Sonora during the late Cretaceous-Early Tertiary, lacustrine non-
marine environments were present (Gonzalez-Leon, 1994; McDowell et al., 2001;
Chacon-Baca, et al., 2002). As in the Neogene lacustrine evaporates, the δ34S range of
Laramide lacustrine sulfate probably resulted from mixing of igneous sulphur with
sulphur from Permian marine gypsum, with a likely range of 6 to 9‰. Thus, a plausible
source for sulfate at La Caridad is contemporaneous lacustrine sulfate.
In addition to the evidence for fluids other than meteoric waters interacting with
the deposit, there is a clear lack of isotope evidence for meteoric water in the earlier
stages, even though relative low-salinity water is involved. However, it is difficult to
visualize in shallow crustal environments a magmatic hydrothermal system without the
involvement of meteoric water, unless it has been masked or displaced by some other
kind of fluid.
2.5 ROLE OF BOILING
Boiling is a fundamental and significant process in the evolution of porphyry
copper deposits. When a homogeneous aqueous phase experiences a decrease in pressure

59 or is mixed with other fluids, boiling occurs (Reed and Spycher, 1984). The boiling
process induces a decrease in temperature and an increase in pH, causing minerals to
precipitate. In porphyry copper deposits, first boiling caused by changes in pressure
conditions (lithostatic to hydrostatic), is responsible for early hydrothermal alteration.
Second boiling is recognized as a product of mixing of magmatic and meteoric waters
that yield low-salinity fluids and is characteristic of the phyllic alteration (Beane and
Titley, 1981), and can concentrate significant amount of metals (Hedenquist and Richards,
1998). However, Harris and Golding (2002) concluded that mineralization during phyllic
alteration can be generated solely from cooling of exsolved magmatic brines. They also
suggested that major incursion of meteoric waters occurs only after the supply of
magmatic fluid has waned. Recent studies (i.e. Horita et al., 1995; Shmulovich et al. 1999)
have shown that boiling produces a fractionation in the light stable isotopes.
Hydrothermal assemblages from the early and intermediate stages (Stage I and II)
show co-existence of primary halite-bearing inclusions and vapor-rich inclusions in the
same quartz veins, which indicates the existence of boiling conditions during these stages
(Fig. 2.10). Stage III rarely has Type III fluid inclusions and is dominated mainly by
Type I inclusions, whereas Stage IV has only Type I inclusions. These two stages (III and
IV) do not show evidence of boiling.
Breccias could have been formed late in the earlier Stage I based on the water
composition, and were produced by the exsolution of an aqueous fluid phase by second
boiling reactions and then decompression and hydrous fluids from the ascending
magmatic-hydrothermal fluids. This effect causes fractures at the porphyry-wall rock

60 interface, forming hetereolithologic breccias, and irregular to pipe-like bodies of
magmatic-hydrothermal breccias (Sillitoe, 1985). The coarse quartz filled bodies were
formed in the Stage I (Substage 1h).
2. 6, SUMMARY OF FLUID INCLUSIONS AND STABLE ISOTOPES
Coexistence of Type II and Type III fluid inclusions in the early stages of the La
Caridad PCD, with homogenization temperatures of ~450 oC, indicates boiling conditions.
Oxygen and hydrogen stable isotope data from quartz, suggests that Stage I and Stage II
are consistent either with a magmatic vapor or with mixing of magmatic waters with
lacustrine evaporite brines. Further, the calculated δ18O value for fluids from anhydrite
coexisting with quartz, are consistent with either possibility. The apparent predominance
of liquid-rich fluid inclusions in the early stages is inconsistent with the magmatic vapor
hypothesis. If a liquid phase predominated during the early stage, it should have been in
isotopic equilibrium with quartz, and should plot in the residual magmatic water field and
not within the magmatic vapor field in as observed (Fig. 2.12).
Sulfur isotopic data show a high degree of sulfate-sulfide disequilibrium. This
conclusion coupled with the unusually low δ34S range of anhydrite, suggests an external
source of sulfate. An external source of sulfate in the system is inconsistent with the
hypothesis of magmatic vapor alone to explain the evolution of the fluids. Hence, the
most plausible hypothesis to explain the isotopic data and fluid inclusion is by mixing of
magmatic waters with lacustrine evaporated brine.

61 2.7, TEMPORAL LINK BETWEEN LA CARIDAD ANTIGUA AND LA CARIDAD
PORPHYRY DEPOSIT
A single sample of the porphyry stock unit was collected at the entrance of La
Caridad Antigua underground mine. Thirteen zircons from a single porphyry sample were
analyzed (Table 2.3). Zircons from this sample are euhedral with prominent sharp
pyramidal terminations, clear and transparent typical of igneous morphologies (Pupin,
1980), without any detectable optical zoning. In addition, the U/Th ratio is <3 indicating
a magmatic origin (Rubatto, 2002). The sample yielded a 206Pb/238U age of 55.0 ± 1.7 Ma
(n=13, MSWD=1.2; Fig. 2.15) interpreted as the age of crystallization, and slightly older
than the ~52.1 Ma whole rock K-Ar age obtained by Livingston (1973) from the
porphyry host unit. No inherited components were recognized in this sample.
After Sillitoe (1983) postulated the intimate relationship between enargite-bearing
massive sulfides bodies and porphyry copper deposits, several spatial and temporal links
between epithermal and porphyry copper deposits have been documented in the Circum-
Pacific ring. Southwest North America has more than 50 porphyry copper deposits;
however as a result of the disrupted geology and characteristic erosion level, the
transition between porphyry and epithermal ore deposits has not been documented.
Sillitoe (1983,1989) and Hedenquist et al. (2000) described genetic models of the
high-sulfidation epithermal systems that are associated with magmatic-hydrothermal
systems and their relationship to volcanic host rocks. Einaudi et al. (2003) correlated
sulfide mineral assemblages with sulfidation stages in porphyry copper deposits. The
same assemblages were used to interpret the evolution of the sulfidation stages at La

62 Caridad. Ore grade assemblages (pyrite-chalcopyrite ± magnetite at early stages)
represent stages of intermediate sulfidation. As the system evolves and retracts, the
sulfidation stage increases to intermediate-high, as represented by the assemblage pyrite
+ chalcopyrite + tennantite /tetrahedrite in the central part of the pit, to high sulfidation
stage at La Caridad Antigua (copper rich enargite-bearing assemblage).
La Caridad Antigua represents the high level portion of a porphyry copper system
with a ~1.5 km gap between both deposits as a result of the displacement along La
Caridad Fault (45o dip). Given the relative by short period of hydrothermal activity at
~54-55 Ma, the similar ages for the productive rocks (Fig. 2.16) and mineralization, and
the intimate spatial association, it is very unlikely that the two deposits are independent
and unrelated. It is more likely that the two deposits were formed from a single
magmatic-hydrothermal system that evolved from a porphyry Cu-Mo deposit at depth to
a high sulfidation epithermal system at shallow levels.
Formational temperatures of high sulfidation deposits range between 90 oC and
480 oC, with typical temperatures of 230-260oC (Perello, et al., 2001). A sulfate (barite) –
sulfide (enargite) pair collected from the deposit yields an isotopic temperature of ~280
oC, consistent with temperatures reported for other deposits and similar to the fluid
inclusion temperature (320-260 oC) from Stage 4 at La Caridad.
Deposit morphology, ore texture, alteration, sulfide and gangue assemblages
suggest similar characteristics of intermediate high sulfidation mineralization (~700-1000
m depth; Hedenquist et al., 2000). This depth (700-1000m) estimate is consistent with the
pre-deformation geometric reconstruction of the hydrothermal system, if Stage I from La

63 Caridad formed at a depth of 3200 m as determined by fluid inclusions. However, it is
important to remark that the S isotope equilibrium at La Caridad Antigua is inconsistent
with the disequilibrium of Stage I at La Caridad. On the other hand, sulphur isotopes do
not exclude a relationship between Stages 2 to 4 at La Caridad and La Caridad Antigua
mineralization.
2.8, CONCLUSIONS
Fluid inclusions, O, H, S stable isotopes, U-Pb isotopes and field relationships
suggest a hydrothermal evolution in four different stages for La Caridad deposit:
Stage I. Corresponds to potassic-propylitic hydrothermal mineral assemblages.
Fluid inclusions in this stage are hypersaline and vapor rich have homogenization
temperatures that range from 460-360 oC and pressures of 320-100 bars.

64
Early potassic silicate stable minerals, such as K-feldspar, biotite, magnetite, and
quartz were formed at this stage (Stage I) with propylitic alteration developing at the
periphery of the system. Mineralization is scarce and characterized by molybdenite and
minor chalcopyrite. The δ18O and δD values suggest a strong influence of magmatic
water during the evolution of this early stage, whereas sulfur isotopes from pairs of
sulfide and sulfate indicate strong isotopic disequilibrium, caused by mixing between a
external source of sulfur and magmatic sulfur.
Stage II is represented by phyllic hydrothermal mineral assemblages. Fluid
inclusions indicate a decrease in the salinity, however, hypersaline and vapor rich
inclusions coexist. Homogenization temperatures range from 400-330oC and pressures of
250-50 bars. The main copper mineralization was introduced at this stage.
Phyllic alteration could have been caused by the influx of formational waters in
response to the cooling of the system or by the result of direct cooling of exsolved
magma brines. The δ18O and δD values suggest an evolution of magmatic waters
following the boiling vector with a signature similar to those obtained in seawater or
formational water.
Stage III. This third stage corresponds to polymetallic veins (Lead-zinc-silver
mineralization). Low-salinity Type I fluid inclusions predominate and have temperatures
of homogenization from 370 to 310 oC.
Stage IV. This stage is local and is represented by quartz-tennantite-chalcopyrite-
pyrite-quartz-sericite veinlets in the deposit. Type I fluid inclusions of very low salinity
are present. Temperatures of homogenization range from 320-260 oC.

65
The data presented here support the hypothesis of a spatial and temporal link
between La Caridad porphyry Cu-Mo deposit and La Caridad Antigua high sulfidation
epithermal system. Such a spatial and temporal link between two deposits had not been
previously described in the North American porphyry copper province.

66
FIGURE 2.1 Location of La Caridad porphyry copper deposit (star) and other porphyry copper deposit in the area (open circles); dashed lines are terrane boundaries from Campa and Coney (1983).

FIGURE 2.2. Simplified geologic map of La Caridad area. (modified after Berchenbriter, 1976 and Worcester, 1976).
67

FIGURE 2.3 Geological map of La Caridad mine area (plan view at 1290 m level) and SW-NE cross section A-A’ looking NW, interpreted from drill hole information and surface mapping; Note in the cross-section the material mined up to 2002
68

FIGURE 2.4 Schematic SW-NE cross section from La Caridad pit to La Caridad Antigua mine. The location of the section is shown in Figure 2.3. The deep drill hole DCV-02 that cut La Caridad fault near 850m and intercepted unaltered granodiorite at >850m.
69

70
FIGURE 2.5 a) Structural map of the 1290 level and pole projections of 560 faults from benches 1380 and 1305 in La Caridad pit. Lower hemisphere Schmidt equal area nets. b) Copper iso-values map from La Caridad. c) Hydrothermal alteration map of the 1290 level. QSP=quartz-sericite-pyrite, Gn=galena, sph=sphalerite, cpy=chalcopyrite, py=pyrite.

71
FIGURE 2.6 Paragenetic sequence of the vein assemblage of La Caridad, according to crosscutting relationships. Temperatures were determined from fluid inclusions. Horizontal arrows are related to the relative distribution of the veins in different lithologies. qtz =quartz, Kfeld = potassium feldspar, mo= molybdenite, anh= anhydrite, bt= biotite, sph=sphalerite, mt=magnetite, ser= sericite, py=pyrite, tourm=tourmaline, cpy=chalcopyrite, gn=galena, tt=tetrahedrite/tennantite.

72
FIGURE 2.7 a) Photograph of the massive sulfide body at la Caridad Antigua, with pencil as a scale. Barite (Ba), enargite (En), pyrite (Py) and alunite (Al) are present. b) Photomicrograph of a polished section from the massive sulfide body, showing bornite (Bn), Covellite (Cv), bluish chalcocite (Di), gray chalcocite (Cc), scarce pyrite (Py) and chalcopyrite (Cpy), and large subidiomorphic crystals of enargite. See text and figure 2.8 for explanation.

73
Figure 2.8. Paragenetic sequence of La Caridad Antigua.

74
Figure 2.9 Frequency distribution of homogenization temperatures (L+V→V) of primary (?) fluid inclusions in quartz veins classified according to paragenetic stage.

75
FIGURE 2.10 Salinity versus homogenization temperature Th (L-V) plot, showing the distribution of data relative to the NaCl saturation and critical curves from Ahmad and Rose (1980). Dashed lines are contours vapor pressures of NaCl-H2O (bars) at specific temperatures (Roedder 1984).

76
Figure 2.11 Diagram showing the liquid-vapor homogenization temperatures versus halite dissolution temperature inclusions, for hydrothermal alteration assemblage quartz veins from La Caridad.

77
Figure 2.12 Oxygen and hydrogen compositions of water in equilibrium with hydrothermal minerals from La Caridad, shown in relation to ranges of residual waters or magmatic water box (Taylor, 1974), composition of water initially dissolved in felsic magmas or water in arc and crustal melt (Taylor, 1992), low-salinity discharges from high-temperature volcanic fumaroles or vapor from convergent arc volcanoes (Giggenbach, 1992), boiling vector at halite saturation (Schmulovich et al., 1999), Miocene Gulf of Mexico (GM) formational waters (Land and McPherson, 1989), Tertiary meteoric waters from La Caridad (Taylor, 1974), present-day meteoric waters (Taylor, 1979), and an evaporation trajectory path for lacustrine waters (Gat, 1981). The dashed ellipse represents highly evaporated lacustrine waters. and fluid composition of anhydrite in equilibrium with quartz are also shown. Black square S represents a hypothetical magmatic fluid. Ranges of d18O only shown for fluid in equilibrium with anhydrite and stage III quartz.

78
Figure 2.13 Comparison of sulfate-sulfide δ34S ranges from La Caridad and different PCDs of the world. Data from Ohmoto and Rye (1979), Turner (1983); Shelton and Rye (1982), Eastoe (1983), Lang et al. (1989), Calagari (2003), Padilla-Garza et al. (2004).
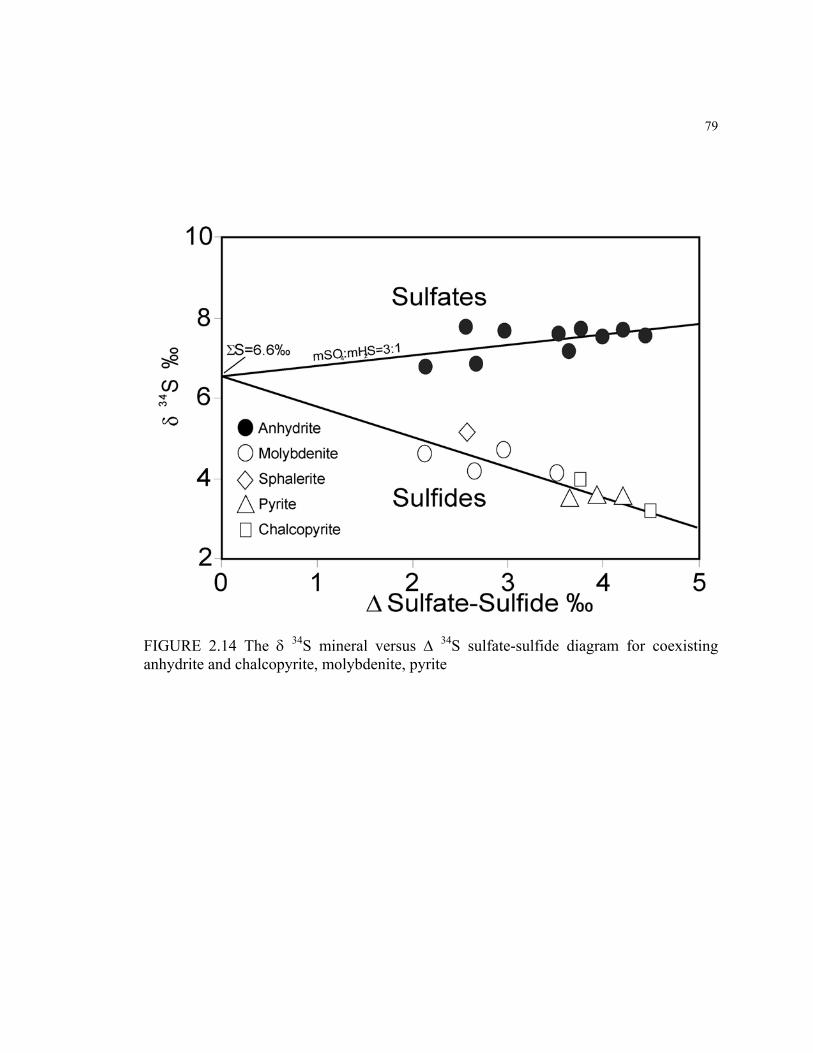
79
FIGURE 2.14 The δ 34S mineral versus ∆ 34S sulfate-sulfide diagram for coexisting anhydrite and chalcopyrite, molybdenite, pyrite

80
Figure 2.15 Weighted average plot for zircon U-Pb ages from La Caridad Antigua stock. The determined 206Pb/238U age is 55.0 ± 1.7 Ma (n=13, MSWD=1.2). All errors at two sigma.

81
Figure 2.16 Geochronological data from La Caridad, Nacozari district (Valencia et al., in review) and from La Caridad Antigua (epithermal high sulfidation). Solid squares are U-Pb ages from zircons, solid circles are Re-Os ages from molybdenite. Error bars are 2σ. Light gray shade represents the estimated duration of the mineralization event. Note the temporal correlation with high sulfidation.

Table 2.1, Oxygen and hydrogen stable isotope data.
Sample Mineral analyzed
Alteration zone
Mineral assemblage δ18 O (‰)
δD (‰)
T (oC)*
δ18 O** (‰) w
δD (‰) w
633-450 qtz, bt Stage I vx qtz+biot+Kfeld 9.76 -79 460 6.9 -37 633-332 qtz, bt Substage 1b vx qtz+biot+Kfeld+mo 10.16 -84 460 7.3 -42 617-452 qtz, bt Substage 1d Vx anh+qtz+cpy 10.24 -70 440 7.0 -25 535-524 qtz,bt Substage 1c vx qtz+biot+Kfeld+cpy+sph 10.70 -78 460 7.8 -36 570-385 qtz, bt Substage 1d Vx qtz+ biot+K feld halo 9.26 -78 460 6.4 -36 634-256 qtz, bt Substage 1b vx qzo+biot+K feld +Mo in halo 11.00 -77 460 8.1 -35 570-389 qtz, bt Stage I Bx qtz and biot 9.73 -74 460 6.8 -32 608-107 qtz,ser Substage 2a vx qtz+cpy+ser halo 10.16 -61 360 5.1 -25 633-257 qtz,ser Substage 2b Vx qtz+py+ser+ sil halo 13.22 -65 330 7.3 -29 617-395 qtz,ser Substage 2a Vx qtz+py+cpy+ser halo 12.38 -66 360 7.3 -
1545 qtz,ser Substage 2b Vx qtz+py +ser +sil halo 12.67 -61 340 7.1 -30 548-440 qtz,ser Substage 2a Vx qtz+moly+ser halo 11.76 -60 360 6.7 -24 viv-1290 qtz, vv Stage II Vx qtz +py +vv (10cm width) 11.79 -98 330 5.9 -
Bella Union qtz, bt Substage 1h cqtz + biot 10.25 -74 430 6.5 -26 Santa Rosa qtz, bt Substage 1h cqtz + biot 10.35 -74 430 6.5 -26 Guadalupe qtz, bt Substage 1h cqtz + biot 9.42 -74 430 5.6 -26 Wav-1290 Wavelite filling cavities - -71 - - - Tour-1350 qtz, tour Substage 2c Tourm +qtz+py 10.98 -49 300 4.1 - Alun-Rod Alunite Stage IV filling cavities - -14 250 - -8
CV Alunite Vx En+ba+qtz+al - -66 250 - -60 609-26 qtz,ser Substage 4b Vx qtz+py+ser 14.25 -60 310 7.7 -6.8
*Fluid inclusion Temperatures. ** Calculated fluid composition using data for quartz (Clayton, 1972), for alunite (Stoffregen et al. 1994) and for sericite and biotite (Suzuoki and Epstein, 1976). Abbreviations. qtz=quartz, bt=biotite, ser=sericite, tour= tourmaline, vv=vivianite, phy=phyllic, K=potassic, HS= High sulfidation, perv= pervasive, Cqtz=Coarse quartz
82

TABLE 2.2. Sulfur isotope data from sulfates and sulfides from La Caridad porphyry copper deposit and La Caridad Antigua
Sample Mineral analyzed
Stage Mineral assemblage δ34 S (‰)
δ18 O (‰)
δ 18O (‰) water*
Isotopic T (oC)
average
Pair
MCD-617 Pyrite Stage I (1d) anh+qtz+py+cpy 3.5 2958 py-cpy1 Chalcopyrite 3.5 Anhydrite 7.1 8.4 7.0 1176 anh-cpy2
MCD-608 Sphalerite Stage I (1c) anh +qtz+cpy+sph 4.2 MCD-534 Molybdenite Stage I (1b) anh+mo ±qtz 4.7
Anhydrite 6.8 8.1 6.7 1790 anh-mo2 MCD-548 Molybdenite Stage I (1b) anh+qtz+mo 4.2
Anhydrite 6.9 8.1 6.7 1481 anh-mo2 MCD-534 Pyrite Stage I (1d) anh+qtz+cpy-py 3.6 674 py-cpy
Chalcopyrite 3.1 Anhydrite 7.6 8.9 7.5 1103 anh-cpy2
MCD-615 Molybdnite Stage I (1e) anh+qtz+cpy-py-mo 4.1 Anhydrite 7.6 8.9 7.5 1210 anh-mo2
MCD-615 Molybdenite Stage I (1b) anh+mo 4.8 Anhydrite 7.7 9.0 7.6 1355 anh-mo2
MCD-613 Pyrite Stage I (1c) anh+qtz+biot+cpy+py+sph 3.5 Chalcopyrite 4.0 Sphalerite 5.2 Anhydrite 7.7 9.0 7.6 1052 anh-cpy2
MCD-535 Chalcopyrite Stage I (1d) qtz+biot+Kfeld+cpy 3.8 597 Anhydrite Stage I (1d) anh+cpy+py+qzo 5.7 7.00 5.6 615 Anhydrite Stage I (1b) anh+qzo+mo 6.9 8.10 6.7 633 Anhydrite Stage I (1d) anh+py+cpy 7.0 8.30 6.9 596 Anhydrite Stage I (1b) qzo+anh+mo 7.1 8.40 7.0 609 Anhydrite Stage I (1d) anh+py+cpy 7.3 8.60 7.2 615 Anhydrite Stage I (1b) anh+qtz+mo 7.3 8.60 7.2 596 Anhydrite Stage I (1d) anh+qtz+cpy-Kfeld-mo 7.6 8.90 7.5 596 Anhydrite Stage I (1d) anh+qtz+cpy 7.6 8.90 7.5 609 Anhydrite Stage I (1d) anh+qtz+cpy+py 8.0 9.20 7.8 83

TABLE 2.2, Sulfur isotope data from sulfates and sulfides (continued)
Sample Mineral analyzed
Stage Mineral assemblage δ34 S (‰)
δ18 O (‰)
δ 18O (‰) water*
Isotopic T (oC) average
Pair
MCD-617 Pyrite Stage II (2b) qtz+py+mo+ser 3.5 Molybdenite 3.4
B-1545 Pyrite Stage III (3a) qtz+poly+carb+ser 4.2 433 cpy-py1 Chalcopyrite 3.3 592 py-sph1 Galena 2.6 503 sph-gn1 Sphalerite 3.8
Pit Pyrite Stage IV (4b) 3.3 96 py-cpy1 Chalcopyrite 0.0 Tetrahedrite/tennantite 0.5
608 Pyrite Stage IV (4a) py +cpy 3.6 90 py-cpy1 Chalcopyrite 0.2
Caridad Antigua
Pyrite HS en-ba+py+bn+cc 3.3 420 py-bar1
Enargite -4.1 280 En-bar1 Barite 18.2
Abbreviations Anh = Anhidryte, qtz=quartz, mo=molybdenite, cpy=chalcopyrite, sph=sphalerite, carb=carbonate, biot=biotite, bn=bornite, ba=barite, cc=chalcocite, ser=sericite. K feld=Potassic feldspar, HS=high sulfidation. ( )= Substage, 1=Ohmoto and Rye (1979), 2=Ohmoto and Lasaga (1982). *calculated at 450 oC.
84

85
TABLE 2.3. LA-MC-ICPMS U-Pb zircon data
Sample
U
(ppm)
Th
(ppm) U/Th 206Pb/204Pbc
206Pb/238U
ratio ±(%)
206Pb/238U
Age* ±(Ma)
1 269 226 1.2 1516 0.00858 1.61 55.1 0.92 318 289 1.1 1792 0.00870 2.12 55.9 1.23 257 174 1.5 1188 0.00843 1.81 54.1 1.04 328 281 1.2 1054 0.00859 1.99 55.1 1.15 367 302 1.2 1585 0.00869 1.59 55.8 0.96 163 125 1.3 763 0.00853 1.65 54.8 0.97 54 33 1.6 247 0.00830 5.07 53.3 2.78 286 227 1.3 874 0.00853 1.32 54.8 0.79 163 113 1.4 378 0.00851 2.11 54.6 1.1
10 187 114 1.6 815 0.00860 2.09 55.2 1.111 119 104 1.1 505 0.00809 7.55 51.9 3.912 276 196 1.4 833 0.00861 1.44 55.3 0.813 195 109 1.8 659 0.00859 1.83 55.2 1.0
*Ages in table only reflect the error from determining 206Pb/238U and 206Pb/204Pb. For the sample age additional uncertainty from the calibration correction, decay constant and common lead was considered.

TABLE 2.4. Summary of Results
Stage I II III IV Hydrothermal
Alteration assemblage
Potassic/Propylitic
Phyllic Phyllic/Silicification Local -clays
Mineralization stage Early stage (Pre-Main) Intermediate (Main) Late High Sulfidation
Mineralization Mo>>Cu>>>Zn Cu>>>>Mo Zn-Cu-Pb-Ag Cu-Ag-Au-As δ 34 S (‰) sulfides 3.1 to 5.2 3.4 to 5.2 2.6 to 4.2 -4.1 to 3.3
Th (oC) 460-360 400-330 370-310 320-260 F.I. Type
Homogenization III, II, I
(H+L+V) → (L + V) → (L/V) III, II, I
(H+L+V) → (L + V) → (L/V) I >> III
(H+L+V) → (L + V) → (L) I
(L + V) → (L) Vein assemblages (Th
oC) 1b mo-anh-qtz-bt-Kf (390-460) 1d cpy-Anh-qtz-bt-Kf (390-460)
1g cpy-mt-qtz-bt (360-420) 1h Cqtz+bt+mo+py (320-380)
2a qtz-ser-py-cpy –SH (350-410) 2b qtz-ser-cpy-py-mo-QH (339-390)
3c gn-sph-py-cpy-qtz-cb (320-380) 4b tt-py-cpy-qtz (260-320)
Salinity (% NaCl equiv)
39-56 28-44 3-28 3-10
Pressure (bars) lithostatic/hydrostatic
km
(320-100) 1.2Km/3.2km
(250-50) 1.0Km/2.5km
--- ---
Abbreviations. Mo=molybdenum, Cu=copper, Zn=zinc, Pb=lead, Ag=silver, Au=gold, As=arsenic. Th= Temperature of homogenization, F. I.=fluid inclusions, mo=molybdenite, anh=anhydrite,qtz=quartz, bt=biotite, Kf= K- feldspar, mt=magnetite, ser=sericite, cpy=chalcopyrite, py=pyrite, SH=sericite halo, QH=quartz halo, gn=galena, sph=sphalerite, cb=carbonate, tt=tetrahedrite/tennantite, equiv=equivalent, km=kilometers
86

87
CHAPTER 3: U-PB ZIRCON AND RE-OS MOLYBDENITE GEOCHRONOLOGY FROM LA CARIDAD PORPHYRY COPPER DEPOSIT: INSIGHTS FOR THE DURATION OF MAGMATISM AND MINERALIZATION IN THE NACOZARI DISTRICT, SONORA, MEXICO.
3.1, INTRODUCTION
La Caridad igneous suite is part of the Laramide granitic belt, bordering western
North America (Fig. 3.1). This granitic belt has one of the highest concentrations of
porphyry copper deposits (PCDs) in the world (Titley and Anthony, 1989). The geology
of southwest North America and its porphyry copper deposits has been intensely studied,
probably more than any other area in the world; however, La Caridad district lacks a
detailed and comprehensive investigation. Such studies on Mexican porphyry copper
deposits are necessary in order to fully understand this important metallogenetic province
into the overall tectono-magmatic evolution of PCDs in North America.
The La Caridad deposit is located within the North America Terrane of Northwest
Mexico (Coney and Campa, 1987) about 170 km northeast of the city of Hermosillo (Fig.
3.1). The deposit was discovered in 1967 as part of an exploration program of the
Mexican government in a joint-venture with the United Nations. Production started in
1978 and currently, this deposit is the most productive copper mine in Mexico, yielding
~150,000 ton Cu/year. La Caridad mine is the second largest porphyry copper deposit in
Mexico, with ~1 million tons of Cu and 25,000 tons of Mo reserves in 2001 (Figueroa,
2001, personal communication).
Here, we use U-Pb (zircons) and Re-Os (molybdenite) dating to understand the
magmatic history, the timing of molybdenite mineralization, and duration of the

88
hydrothermal-mineralization system. The duration of hydrothermal systems and the
timing of porphyry copper mineralization are relevant topics in metallogenesis and
important in the development of exploration programs, providing spatial-temporal
constraints in porphyry Cu-Mo districts. The results presented here also contribute to the
interpretation of the tectonic evolution of northeastern Sonora, Mexico.
3.2, GEOLOGICAL BACKGROUND
3.2.1, Regional geological setting
La Caridad porphyry copper deposit is located in the Nacozari District in north-
east Sonora, Mexico (Fig. 1). Mining in the district has been conducted for over three
centuries (Berchenbritter, 1976) and the region gained prominence in the early 1900s,
when the Pilares mine was active (Lindgren, 1928; Bateman, 1950), producing between
the years 1901 and 1931, around 16 million of tons with 3.1% Cu (Perez-Segura, written
communication, 2001).
The geology of northeastern Sonora is an extension of the geology of southern
Arizona (Seagart et al., 1974). The La Caridad deposit is located in a region that has
several different names (e.g. Pinal block, Nourse et al., 1994; Chihuahua Terrane, Campa
and Coney, 1983; North America Terrane, Sedlock et al., 1993; Terrane I, Titley and
Anthony, 1989). The basement of the terrane is Precambrian Pinal Schist (1.68 Ga) and is
intruded by 1.41-1.48 Ga anorogenic granites (Silver et al., 1977a; Silver et al., 1977b;
Anderson and Silver, 1981; Anderson and Bender, 1989). Paleozoic sedimentary rocks in
Northeast Sonora (Stewart et al., 1990; Gonzalez-Leon, 1986, Blodgett et al., 2002)
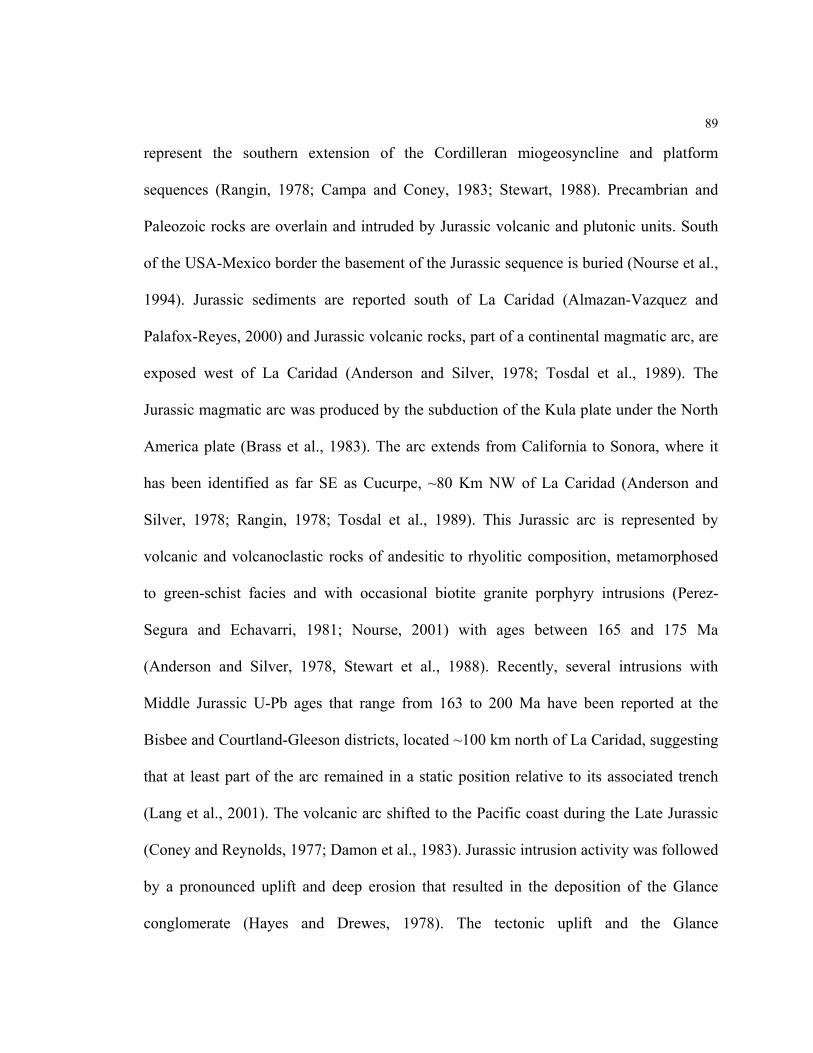
89
represent the southern extension of the Cordilleran miogeosyncline and platform
sequences (Rangin, 1978; Campa and Coney, 1983; Stewart, 1988). Precambrian and
Paleozoic rocks are overlain and intruded by Jurassic volcanic and plutonic units. South
of the USA-Mexico border the basement of the Jurassic sequence is buried (Nourse et al.,
1994). Jurassic sediments are reported south of La Caridad (Almazan-Vazquez and
Palafox-Reyes, 2000) and Jurassic volcanic rocks, part of a continental magmatic arc, are
exposed west of La Caridad (Anderson and Silver, 1978; Tosdal et al., 1989). The
Jurassic magmatic arc was produced by the subduction of the Kula plate under the North
America plate (Brass et al., 1983). The arc extends from California to Sonora, where it
has been identified as far SE as Cucurpe, ~80 Km NW of La Caridad (Anderson and
Silver, 1978; Rangin, 1978; Tosdal et al., 1989). This Jurassic arc is represented by
volcanic and volcanoclastic rocks of andesitic to rhyolitic composition, metamorphosed
to green-schist facies and with occasional biotite granite porphyry intrusions (Perez-
Segura and Echavarri, 1981; Nourse, 2001) with ages between 165 and 175 Ma
(Anderson and Silver, 1978, Stewart et al., 1988). Recently, several intrusions with
Middle Jurassic U-Pb ages that range from 163 to 200 Ma have been reported at the
Bisbee and Courtland-Gleeson districts, located ~100 km north of La Caridad, suggesting
that at least part of the arc remained in a static position relative to its associated trench
(Lang et al., 2001). The volcanic arc shifted to the Pacific coast during the Late Jurassic
(Coney and Reynolds, 1977; Damon et al., 1983). Jurassic intrusion activity was followed
by a pronounced uplift and deep erosion that resulted in the deposition of the Glance
conglomerate (Hayes and Drewes, 1978). The tectonic uplift and the Glance

90
conglomerate deposition were followed by moderately stable crustal conditions and a
marine transgression of Early Cretaceous (Aptian-Albian) age. Shallow marine facies are
observed at the north (Bilodeau, 1978) and deep facies to the south in the Lampazos area
(Valencia Gomez, 1994). This Early Cretaceous sequence is called the Bisbee group. The
origin of the Bisbee basin is still debated and different models have been proposed
ranging from a back arc model in an Andean-type collision (Coney, 1976; Rangin, 1981;
Damon et al., 1981), a rift caused by the opening of the Gulf of Mexico (Dickinson, 1981;
Dickinson and Lawton, 2001a, 2001b) to that of a concurrence of intra-arc strike slip
basin and back arc extensional basin (Busby and Bassett, in review).
Plutonic and volcanic rocks of upper Cretaceous- Eocene age are widespread
throughout Southern Arizona, New Mexico and northern Sonora, and were emplaced
during the Laramide Orogeny. Most of the porphyry copper mineralization in the
southwest is associated with this event (75-50 Ma, Shafiqullah et al., 1980). After a
period of quiescence of about ~20 myr caused by the westward migration of the
magmatic arc (Coney and Reynolds, 1977; Damon et al., 1981; Damon et al., 1983)
intensive magmatism occurred. This event is represented by extensive volcanic sequences
of Oligocene age (30-25 Ma) (Shafiqullah et al., 1980; Damon et al., 1981; Roldan-
Quintana, 1981). During the Miocene there was mid-crustal extension and core complex
formation. In Sonora these event occurred between 27-12 Ma (Gans, 1997).
3.2.2, District geology

91
The geology of the Nacozari district has been summarized by various authors (e.g.
Worcester, 1976; Berchenbriter, 1976; Theodore and Priego de Wit, 1978). However, the
most detailed studies focus on individual deposits such as La Caridad mine (Seagart et al.,
1974; Berchenbriter, 1976; Hernandez-Pena, 1978; Reyna and Mayboca, 1986), La
Caridad Antigua (Wantke, 1925), Pilares (Wade and Wandtke, 1919; Chiapa and Thoms,
1971; Thoms, 1978), La Florida (Theodore and Priego de Wit, 1978), and El Batamote
(Wendt, 1977).
The district can be divided into three blocks that form a horst and graben structure
with La Caridad located in the central block (Fig. 3.2a). This central block is dominated
by andesites that extend west of the La Caridad deposit. Further west, in the Pilares
breccia area, they are overlain by latite flows (Thoms, 1978). The andesites are intruded
by a fine to coarse-grained biotite-diorite. Berchenbriter (1976) and Reyna and Mayboca
(1986) have suggested a transitional contact between these two rock types, whereas
Seagart et al. (1974) proposed a comagmatic relationship. Hornblende-biotite
granodiorite is widespread east and southeast of La Caridad area, and is limited to the
east by La Caridad Fault (Figure 3.2b) (Berchenbriter, 1976). Quartz monzonite porphyry
appears as irregular bodies at the contact between the granodiorite and the andesites.
Reyna and Mayboca (1986) suggested multiple mineralizing intrusions based on field and
petrographic studies.
Large irregular to pipe-like breccia bodies located around and in the quartz
monzonite porphyry have been classified as siliceous magmatic-hydrothermal breccias by
Sillitoe (1985) (Fig. 3.2b). The breccias are monolithic to polymictic depending on the

92
composition of their clasts. These breccia bodies could be related to the late stages of
intrusion of the quartz monzonite porphyry. Recitation was caused by decompression and
release of fluids (Sillitoe, 1985).
Small irregular bodies, that locally have been labeled as pegmatites (i.e. Pegmatite
Santa Rosa, Guadalupe and Bella Union; Reyna and Mayboca, 1986), are composed of
interlocking biotite with massive quartz, minor K-feldspar and molybdenite. These
“pegmatites” occur at the center and edges of the deposit. Barren porphyry dikes (“Tan
porphyry”) crop out in the pit and intrude all the rock units mentioned above (Figure
3.2b). Detailed petrographic descriptions of La Caridad porphyry copper deposit have
been presented by Echavarri (1971), Seagart et al. (1974), Berchenbriter (1976)
Hernandez-Pena (1978), Reyna and Mayboca (1986).
The last major geologic events in the district were the deposition of the La
Caridad Conglomerate (Fig. 3.2b) and the El Globo Rhyolite sequence. The former
represents an extensive episode of uplift and erosion constrained by Seagart et al. (1974)
and Berchenbriter (1976) at around ~24 myr. However, this event could have occurred
between 53 to 24 Ma, because the conglomerate rests over Paleocene andesites, latites
and granodiorites (Fig. 2a), and is overlain by ignimbrites (El Globo Rhyolite) of
Oligocene age (K-Ar age of 24.0 ± 0.5 Ma; Worcester, 1976) to the north of the deposit.
3.3, ANALYTICAL PROCEDURES

93
Representative 10-15 kg samples of fresh and altered igneous rocks were
collected at sites shown in Figure 3.2a, and crushed and milled. Heavy mineral
concentrates of the <350 microns fraction were separated magnetically. Inclusion-free
zircons from the non-magnetic fraction were then handpicked under a binocular
microscope. At least fifty zircons from each sample were mounted in epoxy and polished
for laser ablation analyses.
Zircon crystals were analyzed in polished section with a Micromass Isoprobe
multi-collector ICPMS equipped with nine Faraday collectors, an axial Daly detector, and
four ion-counting channels (Dickinson and Gehrels, 2003). The Isoprobe is equipped
with an ArF Excimer laser, which has an emission wavelength of 193 nm. Analyses were
conducted on 35 to 50 micron spots with an output energy of ~32 mJ (at 22kV) and a
repetition rate of 8-9 Hz. Each analysis consisted of one 20-second integration on peaks
with no laser firing and twenty 1-second integrations on peaks with the laser firing. Hg
contribution to the 204Pb mass position is accordingly removed by subtracting the on-peak
background values. The depth of each ablation pit was ~15-20 microns. Total
measurement time was ~90 s per analysis.
The collectors were configured for simultaneous measurement of 204Pb in an ion-
counting channel while 206Pb, 207Pb, 208Pb, 232Th, and 238U are measured with Faraday
detectors. All analyses were conducted in static mode. Inter-element fractionation was
monitored by analyzing fragments of SL-1, a large concordant zircon crystal from Sri
Lanka with a known (ID-TIMS) age of 564 ± 4 Ma (2σ) (Gehrels, unpublished data).
This reference zircon was analyzed once for every three unknown samples.

94
The reported ages for zircon grains are based on 206Pb/238U ratios because errors
of the 207Pb/235U and 206Pb/207Pb ratios are significantly higher. This is due primarily to
the low intensity (commonly <1 mV) of the 207Pb signal from these young, low-U grains.
The 206Pb/238U ratios are corrected for common Pb by using the measured 206Pb/204Pb,
common Pb composition from Stacey and Kramers, (1975), and respective uncertainties
of 1.0 and 0.3 for 206Pb/204Pb and 207Pb/204Pb.
For each sample, the 206Pb/238U ages are plotted with 2 sigma error bars (Fig. 3.4)
that reflect only the error from determining 206Pb/238U and 206Pb/204Pb. The weighted
mean of each sample was calculated using the Isoplot program (Ludwig, 2001). For the
age of each sample additional uncertainty from the calibration correction, decay constant,
common lead composition and variation in measured 206Pb/238U and 206Pb/207Pb from the
SL-1 standard are considered (~1.5-2% during each session). These systematic errors
(~3.0 %) were added quadratically to the measurement error. The reported ages are based
primarily on 206Pb/238U ratios for <800 Ma grains and 206Pb/207Pb for >800 Ma grains. All
reported ages and weighted mean ages have uncertainties at the two-sigma level.
Zircons from La Caridad samples were studied optically under a petrographic
microscope (PM) and with SEM in back-scattered electron (BSE) mode and
cathodoluminescence (CL). Spot analyses were selected based in CL images (Fig 3.3b
and 3.3c). Zircons from samples are pinkish to colorless and range from oval, elongate to
very elongate, generally showing 101 type (Pupin, 1980). Most zircons are devoid of
inclusions, although a few show mainly minor apatite inclusions. Zircons display igneous
morphologies (e.g. euhedral crystals) with no detectable optical zoning however, CL

95
images show growth zoning in some zircons (Fig. 3.3). For example, D-1 zircons
(diorite) and A-1 zircons (andesite) show broad growth zoning, whereas other samples
(granodiorites and porphyries) have zircons with narrow growth zoning. In few zircons
xenocrystic cores have been identified (Fig. 3a and 3b) with external overgrowth. These
suggest a possible inherited origin. For a few of these zircons we report core and rim ages
(Table 3.1 and Fig. 3.3).
Seven samples were dated and were grouped according to their temporal
relationship with respect to mineralization (pre-mineralization, mineralization and late
mineralization). Ages from 20-40 zircon grains were measured from each sample. Results
are reported in Table 3.1 and each line represents a spot analysis.
In order to determine the span of time of the hydrothermal-mineralization event
we selected two molybdenite samples for Re-Os analyses. These samples were selected
on the basis of alteration assemblages (from potassic and phyllic alteration). Sample VA-
K was collected from a quartz-molybdenite-anhydrite - biotite ± K-feldspar ± pyrite vein
with a ~3 mm thick K-feldspar halo, and represents the early hydrothermal stage of the
deposit (i.e. potassic alteration). Sample VA-Ph was collected from a quartz– sericite -
molybdenite-pyrite-chalcopyrite vein with an inner sericite halo (1-2 mm) and an outer
silicification halo (9-10 mm). This vein-type represents an intermediate stage of alteration
that overprints and replaces all original rock forming silicates and early pre-existing
alteration products (e.g. biotite and K-feldspar) (Beane, 1982).
Re-Os analyses were conducted following the method described in Mathur et al.
(2002) and Barra et al. (2003). Briefly, approximately 0.05-0.1 g of hand-picked

96
molybdenite was loaded in a Carius tube with 8 ml of reverse aqua regia (1HCl:3HNO3).
While the reagents, sample and spikes were frozen, the Carius tube was sealed and left to
thawn at room temperature. The tube was placed in an oven and heated to 240o C
overnight. The solution was treated in a two-stage distillation process for osmium
separation (Nagler and Frei, 1997). Osmium was further purified using a micro-
distillation technique (Birck et al., 1997), and loaded on platinum filaments with Ba(OH)2
to enhance ionization. After osmium separation, the remaining acid solution was dried
and later dissolved in 0.1 HNO3. Rhenium was extracted and purified through a two-stage
column using AG1-X8 (100-200 mesh) resin and loaded on platinum filaments with
BaSO4.
Samples were analyzed by negative thermal ion mass spectrometry (NTIMS)
(Creaser et al., 1991) on a VG 54 mass spectrometer. Molybdenite ages were calculated
using a 187Re decay constant of 1.666x10⁻¹¹ year –1 (Smoliar et al. 1996). Ages are
reported with a 0.5% error, which is considered a conservative estimate and reflects all
the sources of error (i.e. uncertainty in the Re decay constant (0.31%), 185Re and 190Os
spike calibrations (0.08 and 0.15, respectively), analytical and weighing errors).
3.4, RESULTS
3.4.1, Pre-Mineralized stage

97
The four pre-mineralized samples, from older to younger, are: andesite (A-1),
diorite (D-1), granodiorite (G-1) and biotite-hornblende granodiorite in the pit (G-2).
Sample A-1 has a 206Pb/238U weighted average age of 64.2 ± 2.5 Ma (n = 19, MSWD =
0.9), with one inherited zircon of Early Cretaceous age (~100 Ma, Table 3.1). Sample D-
1 yielded a weighted average age of 58.3 ± 2.0 Ma (n=9, MSWD =2.1), with one
inherited zircon of Middle Jurassic age (~170 Ma). Sample G-1 has a weighted average
age 55.5 ± 1.9 Ma (n=16, MSWD = 6.0). In the 16 grains analyzed no older component
were detected. Sample G-2 has a 206Pb/238U weighted average age of 55.6 ± 1.7 Ma (n =
21 zircons, MSWD = 2.2). Three zircons define a linear pattern of discordance with an
upper concordia intercept of ~1.48 ± 0.05 Ga with a MSWD=0.37 (Fig. 3.4), similar to
the age of Precambrian anorogenic granites of the American southwest (Anderson and
Bender, 1989). A single zoned zircon contains an inherited Late Jurassic age (~151 Ma,
Table 3.1) and a Paleocene (~54 Ma) age at the tip of the crystal (Fig. 3.3). Overall, these
Paleocene ages are similar to the ~49-55 Ma K-Ar ages obtained by Livingston (1973,
1974) and Damon et al., (1983) in micas from the same units.
3.4.2, Mineralized stage
The two mineralized quartz monzonite porphyry samples are from different
locations within the La Caridad mine (Fig. 3.2b). Sample P-1 yielded a weighted average
age of 54.3 ± 1.7 Ma (n= 18 zircons, MSWD = 2.0), although inherited grains with Early
Cretaceous-Late Jurassic ages (~125-144 Ma) have also been found (Fig. 3.4). Sample P-
2 has very strong sericitic alteration and has a zircon 206Pb/238U weighted average age of

98
54.3 ± 1.7 Ma (n = 22 zircons, MSWD = 3.7). Three grains (two cores and one tip
analyses) have ages of 57-58 Ma. However, with the limited number of the analysis
performed on this sample it is not possible to discriminate between a single population or
bimodal population, and hence the reason of scattering in the ages remains uncertain.
Two zircons contain an inherited Precambrian (~1422 and 1492 Ma) component. Other
analyzed zircons (n=3) have Early Cretaceous ages that range from ~113 to ~142 Ma
(Table 3.1).
3.4.3, Late-Mineralization stage
Sample P-3 is a barren porphyry dike that cuts all rock units mentioned above.
This sample has a 206Pb/238U weighted average age of 52.6 ± 1.6 Ma (n = 19 zircons,
MSWD=2.0). One inherited zircon gave a Middle Jurassic (~167 Ma) age (Fig. 3.4).
3.4.4, Re-Os molybdenite ages
Two Re-Os molybdenite analyses are reported in Table 3.3. The concentration
ranges of total rhenium and 187Os are 71-195 ppm and 40-109 ppb, respectively. Samples
were analyzed only once because the age of both samples (53.6 ±0.3 Ma and 53.8 ± 0.3
Ma (2σ)) is identical within error. Both sample ages are consistent with a previous K-Ar
age of 53.0 ± 0.4 Ma (1σ) from a hydrothermal biotite in quartz monzonite (Livingston,
1974) and with K-Ar ages that range between 49 and 56 Ma for various intrusions in the
area (Livingston, 1973; 1974; Damon et al., 1983).

99
3.5, DISCUSION
Previous published geochronological data for La Caridad deposit are mainly K-Ar
analyses, and show a wide range of ages and with large errors. Here, the new U-Pb and
Re-Os molybdenite ages provide a better constrain on the timing of the magmatic
evolution and mineralization. U-Pb ages for the igneous rocks indicate three different
periods of magmatism. The youngest interval of Paleocene age comprises the age of host
rocks (volcanics) and magmatic crystallization age associated with the porphyry copper
deposit. The other two time intervals are the inherited Late Jurassic-Mid Cretaceous and
Precambrian ages.
3.5.1, Magma emplacement and mineralization
The Laramide orogeny is characterized in the North American southwest by a
compressional regime with basement uplift and thrust fault deformation, and widespread
igneous activity observed as extensive calc-alkaline magmatism in southern Arizona,
New Mexico, and Sonora ranging from 80 Ma to 40 Ma (Damon et al., 1964, Damon and
Mauger, 1966; Shafiqullah et al., 1980; Coney, 1976). McCandless and Ruiz (1993)
determined two distinctive intervals of porphyry copper mineralization in this region, one
from 74-70 Ma and the other from 60-55 Ma, based on Re-Os systematics. New Re-Os
data from a number of porphyry copper deposits in northwest Mexico suggest a wider
interval starting at ca. 50 myr (Barra et al. in review).
Available radiometric ages of major intrusive and extrusive rocks are shown in
Figure 3.6. Previous K-Ar ages that document the magmatism in Nacozari area show a
100
large span of time, from 52-43 Ma (Grijalva-Noriega and Roldan Quintana, 1998),
whereas for La Caridad deposit, the ages range from 56.0 Ma to 48.9 Ma (Damon, 1968;
Livingston, 1973, 1974; Damon et al., 1983). K-Ar data show significant discrepancies
with respect to the observed field relationships. Field mapping (Fig. 3.2b) indicates a
stratigraphic sequence from older to younger as follows: andesite, diorite, granodiorite,
quartz monzonite porphyry, “pegmatite” bodies, tan porphyry and aplites. However, K-
Ar dates suggest that the host diorite (49.8 ± 1.2 Ma) is younger than the quartz
monzonite porphyry (53.1 ± 0.8 Ma, 2σ) and the “pegmatite” (55.2 to 50.4 Ma), both of
which are observed cutting the quartz diorite porphyry. These discrepancies are possibly
the result of resetting of the radiometric clock by a later thermal event (e.g. intrusion of
late porphyry dikes). Furthermore, the age discrepancies are in part due to the fact that
some of the K-Ar ages were whole rock ages and cannot account for Ar loss or gain like
more recent Ar-Ar methods.
Our interpretation of geologic events in La Caridad District based on geologic
mapping, U-Pb and Re-Os ages, show a general progressive trend of evolution for La
Caridad Porphyry deposit (Fig. 3.6). The initial stages of formation of the porphyry
system are andesite flows (~64 Ma), which are intruded by biotite-diorite dikes (~58 Ma).
Hornblende biotite granodiorite stocks, with an area of >25 km2, were emplaced ~55.5
Ma ago. Quartz monzonite porphyry stock was emplaced at the contact between the
granodiorite stocks and the andesites. This porphyry, with an age of ~54 Ma, is the unit
responsible for the mineralization. Cross-cutting relationships and the new ages presented
here, are consistent with a model in which the mineralization at La Caridad porphyry

101
copper deposit is the result of one single large and complex intrusion, with different
textures, and overprinted by hydrothermal events rather than produced by multiple
mineralized intrusions as suggested by Reyna and Mayboca (1986). On the other hand, if
the multiple mineralized intrusions model is valid, the intrusions must have occurred
within a very short period of time.
Molybdenite samples from two hydrothermal alteration styles (potassic and
phyllic) that are progressive in time, but overlap in space, have identical Re-Os ages
within error, suggesting that the mineralization of La Caridad porphyry copper deposit
occurred within a short period of time (weighted average age of 53.7 ± 0.21 Ma). After
the mineralization event, barren porphyry dikes locally named “Tan Porphyries” (~52.6
Ma), intrude all rock units.
Our U-Pb and Re-Os ages indicate that La Caridad porphyry copper deposit is the
youngest porphyry in the region. Furthermore, the data presented suggests that the
duration of the magmatic-hydrothermal activity was brief and that the mineralization was
the product of a single complex intrusion.
This scenario is very different from that of Cananea, the largest porphyry Cu-Mo
deposit in Mexico, where K-Ar, Ar-Ar and U-Pb geochronologic ages support a long
lived magmatic-hydrothermal system (~67-50 Ma) (Meinert, 1982; Wodzicki, 1995),
with multiple centers of mineralization. However, this span of time might be a function of
disturbed Ar ages. New Re-Os molybdenite ages from different centers of mineralization
in the Cananea District (El Alacran deposit, former Maria mine, former breccia La
Colorada and Incremento 3-Cananea mine; Barra et al. in review) indicates that

102
mineralization within the district, occurred in at least two discrete periods, at ~59 and
~61 Ma.
3.5.2, Duration of hydrothermal systems
The size of a porphyry copper deposit (i.e. the amount of ore resources contained)
and which factors play an important role in the generation of a major ore deposit are
fundamental questions in economic geology. Among the different factors that are and
have been considered are: the duration of the hydrothermal system, number of
mineralizing events, volume of fluids and element budget involved, sources of metals,
and the role of structures.
Long lived hydrothermal systems versus short lived hydrothermal system has
been a matter of debate in the last decades. Several researchers (i.e. Skinner, 1979;
Norton, 1982; Cathles et al., 1997; Marsh et al., 1997) have shown that single intrusions
are short lived, i.e. < 1 Ma. More recently, a series of new studies have been made in
order to determine the duration of porphyry copper systems using diverse techniques.
Several of these studies are concentrated on the Chilean porphyries because of the large
size of these deposits. In the Escondida district (Chimborazo, Zaldivar and La Escondida),
Richards et al. (1999) suggest a short period of coeval magmatism at ~38 Ma based on U-
Pb systematics. This conclusion was supported by Ar-Ar ages and additional U-Pb
studies (Padilla-Garza et al., 2004). In the Collahuasi district (Rosario, Ujina) a
combination of Ar-Ar on alteration phases and Re-Os molybdenite ages suggest two
discrete short lived hydrothermal-mineralization episodes, separated for at least 1.8 myr

103
(Masterman et al., 2004). In Chuquicamata at least two discrete pulses have been
suggested (Reynolds et al., 1997), but a much firmer geochronology work is necessary
(Ossandon et al., 2001). An excellent example of geochronology work using multiple
geochronological techniques is presented by Maksaev et al. (2004). These authors
combined U-Pb, 40Ar/39Ar, Re-Os and fission track dating techniques to study the
evolution of El Teniente super-giant porphyry Cu deposit. Five short lived episodes of
felsic intrusion that correspond to five periods of mineralization were determined. The
number of the mineralization events is inferred as the main cause of the volume and high
grade of this deposit.
Since porphyry copper deposits are complex systems with magmatic pulses
formed in short periods of time and/or overlapping thermal, chemical, and mineralizing
events, it is clear that the single technique approach is limited, and that to properly
evaluate the longevity of a porphyry copper system and the number of mineralizing
events a combination of geochronological tools is necessary. Mexican porphyries (La
Caridad and Cananea) need additional studies including U-Pb , Re-Os in molybdenite
and in the sulfides and Ar-Ar dates in order to constrain with more detail the magmatic-
hydrothermal evolution of these two important mineralized centers.
3.5.3, Inherited zircon ages
This study provides useful information on the possible location of the
Precambrian basement in northeastern Sonora and extends farther south the location of
the transcontinental anorogenic belt to La Caridad district. Even though no Precambrian

104
rocks crop out in the district, our data shows that the basement in the La Caridad area
contains zircons that are Precambrian in age (~1.48 Ga). Other anorogenic granites that
outcrop in the North America southwest region are the Ruin Granite, Arizona (1.44 Ga,
Silver et al., 1981), the Oracle granite, Arizona (1.44 Ga, Shakel et al., 1977), and the
Cananea Granite, Sonora (1.44 Ga, Anderson and Silver, 1977).
A close spatial relation between Laramide plutonism and anorogenic Precambrian
granites has been reported in other porphyry copper deposits centers (i.e. Globe-Miami,
Christmas, Ray, San Manuel-Kalamazoo, Cananea, Morenci; Titley, 1981, 1982). Titley
(1981) mention a speculative influence of the Precambrian intrusions contact with the
host rocks acted as a structural anisotropy that control the regional structures and allowed
the emplacement of porphyry copper systems during the Laramide time.
The Jurassic zircon ages could represent the Jurassic magmatism. The arc extends
from California to Sonora, where it has been identified as far SE as Cucurpe (~80 km
NW of La Caridad), and in Cananea (Anderson and Silver, 1978; Tosdal et al., 1989).
Cretaceous magmatism is widely documented in Southwest North America
(Barton, 1996 and references therein). The Lower Cretaceous zircon ages could represent
the volcanic and intrusive rocks generated by the magmatism associated with the rift
caused by the rollback of the subducted slab in the mantle under the continental arc
(Dickinson and Lawton, 2001).
An alternative source for both the inherited Late Jurassic-Cretaceous and
Precambrian zircons is that the Glance Conglomerate of southeast Arizona, which

105
consists of Mesozoic sedimentary and volcanic rocks, Jurassic granites and Precambrian
schist and granites (Bilodeau, 1978), underlies the La Caridad area.

106
3.6, SUMMARY
U-Pb ages on zircon from different igneous units from La Caridad district suggest
that the volcanic and intrusive host rock deposition and emplacement occurred about 64.2
± 2.5 and 58.3 ± 2.0, whereas the magmatism related to the porphyry copper formation
appears to be within a short period of time, between 55.6 ± 1.8 Ma and 52.6 ±1.6 Ma.
Two U-Pb ages of the quartz monzonite porphyry (54.3 ± 1.7 Ma) suggest that a single
large complex intrusion is responsible for the copper porphyry mineralization. Re-Os
molybdenite ages from two veins of different hydrothermal alteration show identical ages
of 53.6 ± 0.3 and 53.8 ± 0.3 Ma (weighted average of 53.7 ± 0.21 Ma), and are consistent
with a short restricted episode of mineralization.
Two possible scenarios are proposed to explain the presence of inherited zircons
with Cretaceous-Late Jurassic and Precambrian ages. The first model is that Precambrian
anorogenic granites underlie this porphyry center, as seen in other porphyry copper
deposits in North America, and that the Late Jurassic –Early Cretaceous zircon ages are
probably the result of the prolongation of the Jurassic magmatic arc to this area and
emplacement of intrusive and volcanic rocks during the rifting regime in the Early
Cretaceous. The second model is that the inherited zircons are from the Glance
Conglomerate, implying its presence under the igneous Paleocene pile. In this case the
basement of this area still remains unknown.

107
FIGURE 3.1, Map of the Sonora state showing the location of La Caridad porphyry copper deposit (solid start), main cities (solid squares), other porphyry copper deposits in the area (white circle).

108
FIGURE 3.2, (a) Main structures from La Caridad area. (b) Simplified geologic map of La Caridad area showing U-Pb sample location.

109
FIGURE 3.3, Zircon morphology microphotographs (a) SEM-Cathodoluminescense (CL) image from a single euhedral zoned zircon (sample G-2), showing an inherited Late Jurassic core (~151 Ma) and a Paleocene overgrowth (~54 Ma) at the tip of the crystal; (b) SEM-CL image from a euhedral zoned zircon from sample P-2 showing a xenocryst core with age 207Pb/235U of 1477 ± 55 Ma and an age 206Pb/238U rim of 54.3 ± 1.3 Ma; (c) Backscatter electron image of the same zircon as in (b), showing the laser ablation pits, which are ~20 microns deep; (d) CL image from a euhedral zircon from sample G-1 showing narrow concentric zoning overgrowth; (e) CL image from a euhedral elongate zircon from the post mineralization Tan porphyry showing concentric overgrowth zoning; (f) Cl Image from zircons from sample P-1.

110
FIGURE 3.4, U-Pb ages for La Caridad porphyry copper deposits in concordia plots. Sample G-2 is showing the presence of an inherited component (~1.48 Ga).

111
FIGURE 3.5. 206Pb/238U crystallization ages for La Caridad porphyry copper deposits samples.

112
FIGURE 3.6, Summary of geochronological data from La Caridad, Nacozari district. Solid diamond are K-Ar ages from biotite and sericite, solid squares are U-Pb ages from zircons, solid circles are Re-Os ages from molybdenite. Error bars are 2σ. Light gray shade represents magmatism duration, host rock lithologies (andesites, diorites) are excluded, dark gray shade represents mineralization duration. K-Ar data from (1) Livingston, 1973; (2) Livingston, 1973 in Roldan-Quintana, 1980, Livingston, 1974; (4) Seagart et al., 1974; (5) Worcester, 1976; (6) Damon, 1968; (7) Damon et al., 1983.

113
Table 3.1. LA-MC-ICPMS U-Pb zircon data. Concentration Isotopic Ratio Apparent ages Sample U Th Th U206Pbm 207 Pb 206 Pb 206Pb 206Pb 207 Pb 206 Pb
P-1 (ppm) (ppm) U 204 Pbc 235 U
±% 238 U
±% Error corr 207 Pb
±% 238U
±Ma 235 U
±Ma 207 Pb
±Ma
1-t 329 210 0.64 827 0.04293 35 0.00852 2.1 0.06 27.38 34 54.7 1.1 42.7 15 NA NA 2-c 121 69 0.57 676 0.12505 33 0.01954 2.4 0.07 21.55 33 124.8 3.1 119.6 41.5 19 399 3-t 443 309 0.70 961 0.03183 35 0.00833 3.7 0.11 36.09 34 53.5 2 31.8 11.1 NA NA 4-c 427 346 0.81 2221 0.12365 16 0.02257 3.0 0.19 25.16 16 143.9 4.4 118.4 20 NA NA 5-t 364 231 0.63 817 0.06425 51 0.00861 2.9 0.06 18.49 51 55.3 1.6 63.2 32.5 375 569 6-t 973 387 0.40 1515 0.03235 24 0.00819 4.2 0.18 34.9 24 52.6 2.2 32.3 7.9 NA NA 7-t 573 374 0.65 1372 0.04827 20 0.00869 1.6 0.08 24.82 20 55.8 0.9 47.9 9.7 NA NA 8-t 676 411 0.61 1157 0.0444 27 0.00801 2.6 0.09 24.87 27 51.4 1.3 44.1 12.2 NA NA 9-t 547 341 0.62 3694 0.04373 14 0.00834 1.5 0.11 26.31 14 53.6 0.8 43.5 6.1 NA NA 10-c 432 235 0.54 1279 0.07326 14 0.00842 2.6 0.19 15.85 13 54.1 1.4 71.8 10.1 711 142 11-t 409 248 0.61 893 0.03151 37 0.00812 3.1 0.08 35.54 37 52.1 1.6 31.5 11.8 NA NA 12-t 550 413 0.75 1360 0.0514 22 0.00841 2.3 0.1 22.56 22 54 1.2 50.9 11.3 NA NA 13-t 508 265 0.52 2133 0.05412 17 0.0085 1.2 0.07 21.67 17 54.6 0.7 53.5 9.3 6 205 14-c 380 116 0.31 999 0.03897 31 0.00851 2.2 0.07 30.12 31 54.6 1.2 38.8 12.4 NA NA 15-t 366 169 0.46 1203 0.04945 39 0.00859 3.1 0.08 23.96 39 55.2 1.7 49 19.5 NA NA 16-c 361 236 0.65 1153 0.14621 59 0.00843 2.5 0.04 7.95 59 54.1 1.4 138.6 83.7 2040 519 17-t 634 361 0.57 1660 0.04181 19 0.00801 2.5 0.13 26.43 19 51.5 1.3 41.6 8.2 NA NA 18-t 1016 574 0.56 1475 0.05172 20 0.00842 1.4 0.07 22.45 20 54.1 0.8 51.2 10.1 NA NA 19-t 1143 641 0.56 1680 0.05143 18 0.00841 2.6 0.14 22.54 18 54.0 1.4 50.9 9.0 NA NA 20-t 974 852 0.87 1269 0.06672 18 0.01075 2.0 0.11 22.22 18 68.9 1.4 65.6 11.4 NA NA 21-t 798 484 0.61 714 0.04087 31 0.00825 3.3 0.10 27.82 31 52.9 1.7 40.7 12.5 NA NA 22-t 874 666 0.76 1333 0.04862 24 0.00853 1.5 0.06 24.18 24 54.7 0.8 48.2 11.2 NA NA 23-t 369 265 0.72 265 0.03494 70 0.00844 3.8 0.05 33.30 70 54.2 2.1 34.9 23.9 NA NA
113
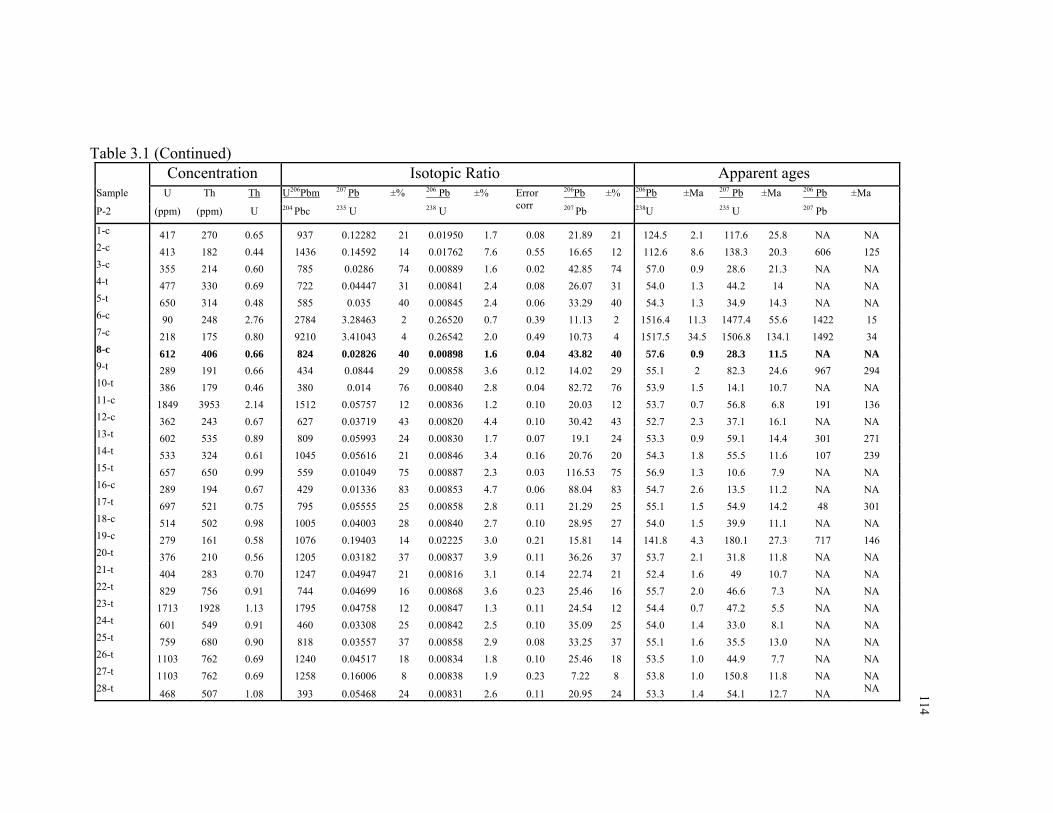
114
Table 3.1 (Continued) Concentration Isotopic Ratio Apparent ages Sample U Th Th U206Pbm 207 Pb 206 Pb 206Pb 206Pb 207 Pb 206 Pb
P-2 (ppm) (ppm) U 204 Pbc 235 U
±% 238 U
±% Error corr 207 Pb
±% 238U
±Ma 235 U
±Ma 207 Pb
±Ma
1-c 417 270 0.65 937 0.12282 21 0.01950 1.7 0.08 21.89 21 124.5 2.1 117.6 25.8 NA NA 2-c 413 182 0.44 1436 0.14592 14 0.01762 7.6 0.55 16.65 12 112.6 8.6 138.3 20.3 606 125 3-c 355 214 0.60 785 0.0286 74 0.00889 1.6 0.02 42.85 74 57.0 0.9 28.6 21.3 NA NA 4-t 477 330 0.69 722 0.04447 31 0.00841 2.4 0.08 26.07 31 54.0 1.3 44.2 14 NA NA 5-t 650 314 0.48 585 0.035 40 0.00845 2.4 0.06 33.29 40 54.3 1.3 34.9 14.3 NA NA 6-c 90 248 2.76 2784 3.28463 2 0.26520 0.7 0.39 11.13 2 1516.4 11.3 1477.4 55.6 1422 15 7-c 218 175 0.80 9210 3.41043 4 0.26542 2.0 0.49 10.73 4 1517.5 34.5 1506.8 134.1 1492 34 8-c 612 406 0.66 824 0.02826 40 0.00898 1.6 0.04 43.82 40 57.6 0.9 28.3 11.5 NA NA 9-t 289 191 0.66 434 0.0844 29 0.00858 3.6 0.12 14.02 29 55.1 2 82.3 24.6 967 294 10-t 386 179 0.46 380 0.014 76 0.00840 2.8 0.04 82.72 76 53.9 1.5 14.1 10.7 NA NA 11-c 1849 3953 2.14 1512 0.05757 12 0.00836 1.2 0.10 20.03 12 53.7 0.7 56.8 6.8 191 136 12-c 362 243 0.67 627 0.03719 43 0.00820 4.4 0.10 30.42 43 52.7 2.3 37.1 16.1 NA NA 13-t 602 535 0.89 809 0.05993 24 0.00830 1.7 0.07 19.1 24 53.3 0.9 59.1 14.4 301 271 14-t 533 324 0.61 1045 0.05616 21 0.00846 3.4 0.16 20.76 20 54.3 1.8 55.5 11.6 107 239 15-t 657 650 0.99 559 0.01049 75 0.00887 2.3 0.03 116.53 75 56.9 1.3 10.6 7.9 NA NA 16-c 289 194 0.67 429 0.01336 83 0.00853 4.7 0.06 88.04 83 54.7 2.6 13.5 11.2 NA NA 17-t 697 521 0.75 795 0.05555 25 0.00858 2.8 0.11 21.29 25 55.1 1.5 54.9 14.2 48 301 18-c 514 502 0.98 1005 0.04003 28 0.00840 2.7 0.10 28.95 27 54.0 1.5 39.9 11.1 NA NA 19-c 279 161 0.58 1076 0.19403 14 0.02225 3.0 0.21 15.81 14 141.8 4.3 180.1 27.3 717 146 20-t 376 210 0.56 1205 0.03182 37 0.00837 3.9 0.11 36.26 37 53.7 2.1 31.8 11.8 NA NA 21-t 404 283 0.70 1247 0.04947 21 0.00816 3.1 0.14 22.74 21 52.4 1.6 49 10.7 NA NA 22-t 829 756 0.91 744 0.04699 16 0.00868 3.6 0.23 25.46 16 55.7 2.0 46.6 7.3 NA NA 23-t 1713 1928 1.13 1795 0.04758 12 0.00847 1.3 0.11 24.54 12 54.4 0.7 47.2 5.5 NA NA 24-t 601 549 0.91 460 0.03308 25 0.00842 2.5 0.10 35.09 25 54.0 1.4 33.0 8.1 NA NA 25-t 759 680 0.90 818 0.03557 37 0.00858 2.9 0.08 33.25 37 55.1 1.6 35.5 13.0 NA NA 26-t 1103 762 0.69 1240 0.04517 18 0.00834 1.8 0.10 25.46 18 53.5 1.0 44.9 7.7 NA NA 27-t 1103 762 0.69 1258 0.16006 8 0.00838 1.9 0.23 7.22 8 53.8 1.0 150.8 11.8 NA NA 28-t 468 507 1.08 393 0.05468 24 0.00831 2.6 0.11 20.95 24 53.3 1.4 54.1 12.7 NA NA 114

115
Table 3.1 (Continued) Concentration Isotopic Ratio Apparent ages Sample U Th Th U206Pbm 207 Pb 206 Pb 206Pb 206Pb 207 Pb 206 Pb
P-3 (ppm) (ppm) U 204 Pbc 235 U
±% 238 U
±% Error corr 207 Pb
±% 238U
±Ma 235 U
±Ma 207 Pb
±Ma
1-c 348 308 0.89 624 0.06997 49 0.00836 3.7 0.08 16.48 49 53.7 2 68.7 34.1 628 525 2-c 232 153 0.66 1482 0.18418 18 0.02621 1.7 0.09 19.62 18 166.8 2.8 171.6 33.1 239 207 3-c 349 266 0.76 367 0.08746 29 0.00841 3.4 0.12 13.25 29 54 1.8 85.1 25.6 1081 291 4-t 357 290 0.81 686 0.03443 42 0.0088 2.1 0.05 35.23 42 56.5 1.2 34.4 14.7 NA NA 5-t 362 184 0.51 602 0.03173 44 0.00833 2.7 0.06 36.21 44 53.5 1.5 31.7 14 NA NA 6-t 381 225 0.59 943 0.02804 42 0.00838 2.1 0.05 41.21 42 53.8 1.1 28.1 11.8 NA NA 7-c 405 339 0.84 833 0.04754 28 0.00833 2.3 0.08 24.16 27 53.5 1.3 47.2 13.2 NA NA 8-c 417 223 0.53 653 0.05977 61 0.00819 3.2 0.05 18.9 61 52.6 1.7 58.9 36.6 326 696 9-c 442 218 0.49 729 0.0473 30 0.00788 3.7 0.12 22.96 30 50.6 1.9 46.9 14.5 NA NA 10-c 454 280 0.62 764 0.03263 39 0.00812 3.6 0.09 34.33 39 52.2 1.9 32.6 12.8 NA NA 11-t 460 244 0.53 1319 0.06027 19 0.0083 2.4 0.12 18.99 19 53.3 1.3 59.4 11.8 314 219 12-c 482 352 0.73 1250 0.06534 15 0.00785 4.1 0.27 16.56 15 50.4 2.1 64.3 10.2 618 160 13-c 508 412 0.81 651 0.02243 50 0.00812 2.4 0.05 49.9 50 52.1 1.3 22.5 11.4 NA NA 14-c 512 283 0.55 952 0.03696 32 0.00812 2.9 0.09 30.3 32 52.1 1.5 36.8 12 NA NA 15-c 548 429 0.78 1355 0.05491 19 0.00825 1.7 0.09 20.73 19 53 0.9 54.3 10.6 111 224 16-c 617 363 0.59 1565 0.02948 28 0.00824 2.4 0.09 38.55 28 52.9 1.3 29.5 8.3 NA NA 17-c 626 522 0.83 1473 0.0544 16 0.00788 2.9 0.19 19.96 16 50.6 1.5 53.8 8.7 200 180 18-t 627 357 0.57 1168 0.03987 32 0.00826 2.4 0.07 28.55 32 53 1.3 39.7 12.8 NA NA 19-t 696 468 0.67 839 0.05887 23 0.00819 2.2 0.1 19.18 22 52.6 1.1 58.1 13.4 291 256 20-t 912 2185 2.40 558 0.04163 40 0.00871 2.6 0.06 28.85 40 55.9 1.4 41.4 16.7 NA NA 21-t 947 476 0.50 2123 0.05539 16 0.00815 1.7 0.11 20.28 16 52.3 0.9 54.7 8.8 163 182 22-c 1149 1141 0.99 1479 0.04328 21 0.00804 2.1 0.1 25.6 21 51.6 1.1 43 9.1 NA NA
115

116
Table 3.1 (Continued) Concentration Isotopic Ratio Apparent ages Sample U Th Th U206Pbm 207 Pb 206 Pb 206Pb 206Pb 207 Pb 206 Pb
G-2 (ppm) (ppm) U 204 Pbc 235 U
±% 238 U
±% Error corr 207 Pb
±% 238U
±Ma 235 U
±Ma 207 Pb
±Ma
1-c 149 90 0.60 322 0.05114 56 0.00864 6.4 0.12 23.28 55 55.4 3.6 50.6 28.5 NA NA 2-c 311 195 0.63 1166 0.06285 63 0.00902 3.5 0.05 19.79 63 57.9 2 61.9 39.6 220 732 3-c 432 305 0.71 1310 0.06933 35 0.00871 1.6 0.04 17.33 35 55.9 0.9 68.1 24.3 519 383 4-c 348 200 0.57 1002 0.07681 22 0.00882 3.3 0.15 15.82 22 56.6 1.9 75.1 17.1 715 232 5-t 198 191 0.96 425 0.10086 61 0.00892 5.3 0.09 12.19 60 57.2 3.1 97.6 60.1 1246 590 6-t 331 189 0.57 648 0.06815 26 0.00855 2.2 0.09 17.3 26 54.9 1.2 66.9 17.9 522 286 7-c 383 295 0.77 907 0.06053 25 0.00864 2.8 0.11 19.67 25 55.4 1.5 59.7 15.2 233 285 8-t 368 272 0.74 1194 0.04389 33 0.00887 2.0 0.06 27.87 33 56.9 1.2 43.6 14.8 NA NA 9-t 478 381 0.80 1622 0.04227 25 0.00823 3.3 0.13 26.84 25 52.8 1.8 42 10.6 NA NA 10-t 498 308 0.62 1343 0.05396 24 0.0083 2.2 0.09 21.21 24 53.3 1.2 53.4 13.1 57 285 11-t 483 371 0.77 1492 0.0706 20 0.00844 3.5 0.18 16.48 19 54.2 1.9 69.3 13.9 628 208 12-c 2344 381 0.16 2580 0.15586 9 0.02373 1.5 0.17 20.99 9 151.2 2.3 147.1 14.1 81 105 13-c 157 64 0.41 12583 2.17592 9 0.17025 8.8 0.98 10.79 2 1013.5 95.6 1173.4 180.1 1482 15 14-c 122 155 1.27 4282 2.16374 5 0.17389 4.3 0.85 11.08 3 1033.5 48.2 1169.5 105.9 1431 25 15-c 223 49 0.22 3456 0.99878 6 0.08138 5.0 0.86 11.23 3 504.3 26.3 703.2 57.4 1404 28 16-c 736 277 0.38 2720 0.06624 14 0.00886 2.0 0.14 18.45 14 56.9 1.1 65.1 9.4 380 156 17-c 219 148 0.68 558 0.13549 49 0.0086 5.1 0.1 8.75 49 55.2 2.8 129 65.4 1869 441 18-t 586 597 1.02 744 0.03744 25 0.00863 3.6 0.14 31.80 25 55.4 2.0 37.3 9.3 NA NA 19-t 620 600 0.97 933 0.04365 30 0.00880 1.9 0.06 27.78 30 56.4 1.1 43.4 12.9 NA NA 20-t 1132 1943 1.72 440 0.04500 28 0.00854 4.7 0.17 26.16 27 54.8 2.6 44.7 12.1 NA NA 21-t 604 746 1.24 368 0.04787 40 0.00843 3.3 0.08 24.28 40 54.1 1.8 47.5 18.7 NA NA 22-t 1177 1086 0.92 429 0.05070 21 0.00858 1.4 0.06 23.33 21 55.1 0.7 50.2 10.3 NA NA 23-t 1228 2007 1.63 1040 0.05723 16 0.00869 2.5 0.16 20.93 16 55.8 1.4 56.5 8.8 NA NA 24-t 1011 1379 1.36 397 0.04408 29 0.00858 2.1 0.07 26.85 29 55.1 1.1 43.8 12.5 NA NA 25-t 602 605 1.00 871 0.04892 41 0.00865 2.0 0.05 24.39 41 55.5 1.1 48.5 19.6 NA NA 26-t 405 398 0.98 551 0.04861 24 0.00864 3.4 0.14 24.52 23 55.5 1.9 48.2 11.1 NA NA 116

117
Table 3.1 (Continued) Concentration Isotopic Ratio Apparent ages Sample U Th Th U206Pbm 207 Pb 206 Pb 206Pb 206Pb 207 Pb 206 Pb
G-1 (ppm) (ppm) U 204 Pbc 235 U
±% 238 U
±% Error corr 207 Pb
±% 238U
±Ma 235 U
±Ma 207 Pb
±Ma
1-c 138 99 0.72 408 0.09554 41 0.00863 5.1 0.12 12.45 41 55.4 2.8 92.7 39.1 1204 401 2-c 148 147 0.99 201 0.13542 48 0.0081 5.6 0.12 8.24 47 52.0 2.9 129.0 63.7 1976 423 3-c 526 345 0.66 668 0.03584 38 0.00835 2.6 0.07 32.13 38 53.6 1.4 35.8 13.9 NA NA 4-c 268 278 1.04 337 0.01411 75 0.00807 3.9 0.05 78.83 75 51.8 2.0 14.2 10.7 NA NA 5-c 213 179 0.84 297 0.01751 85 0.00911 3.6 0.04 71.74 85 58.5 2.1 17.6 15.0 NA NA 6-c 147 104 0.71 171 0.04522 95 0.00916 7.5 0.08 27.94 94 58.8 4.5 44.9 42.5 NA NA 7-c 263 293 1.11 385 0.03522 64 0.00847 4.4 0.07 33.15 64 54.4 2.4 35.2 22.5 NA NA 8-c 346 328 0.95 453 0.04769 84 0.00845 3.0 0.04 24.44 84 54.3 1.6 47.3 39.7 NA NA 9-c 241 222 0.92 315 0.02733 112 0.00903 3.9 0.03 45.57 112 58.0 2.3 27.4 30.5 NA NA 10-c 566 655 1.16 666 0.05534 29 0.00886 1.5 0.05 22.06 28 56.8 0.9 54.7 15.9 NA NA 11-t 1015 686 0.68 824 0.04070 31 0.00867 3.2 0.10 29.36 31 55.6 1.8 40.5 12.2 -785 882 12-t 1634 1197 0.73 1116 0.05393 10 0.00858 2.6 0.25 21.93 10 55.1 1.4 53.3 5.3 -24 241 13-t 527 389 0.74 199 0.03837 23 0.00866 3.9 0.17 31.11 23 55.6 2.2 38.2 8.6 -951 670 14-t 1557 1334 0.86 1059 0.05001 14 0.00857 3.4 0.25 23.63 13 55.0 1.8 49.6 6.6 -208 330 15-t 1699 1170 0.69 1665 0.06007 10 0.00879 3.6 0.35 20.18 10 56.4 2.0 59.2 5.9 174 226 16-t 793 736 0.93 591 0.04472 15 0.00862 2.3 0.15 26.58 15 55.3 1.3 44.4 6.5 -512 395
117

118
Table 3.1 (Continued) Concentration Isotopic Ratio Apparent ages Sample U Th Th U206Pbm 207 Pb 206 Pb 206Pb 206Pb 207 Pb 206 Pb
D-1 (ppm) (ppm) U 204 Pbc 235 U
±% 238 U
±% Error corr 207 Pb
±% 238U
±Ma 235 U
±Ma 207 Pb
±Ma
1-c 1461 2063 1.41 3790 0.06142 8 0.00910 2.9 0.34 20.42 8 58.4 1.7 60.5 5.3 146.0 94.0 2-c 1724 2649 1.54 4611 0.06366 11 0.00920 2.7 0.24 19.94 11 59.1 1.6 62.7 7.1 202.0 123.0 3-c 3375 5345 1.58 8281 0.05786 8 0.00887 2.8 0.35 21.12 7 56.9 1.6 57.1 4.6 66.0 88.0 4-c 1278 1439 1.13 2142 0.06081 15 0.00916 2.6 0.17 20.77 15 58.8 1.5 59.9 9.3 106.0 177.0 5-c 2836 6039 2.13 5114 0.06321 7 0.00922 2.0 0.29 20.12 7 59.2 1.2 62.2 4.3 182.0 76.0 6-c 2003 3717 1.86 1642 0.05928 17 0.00950 4.7 0.27 22.10 16 61.0 2.9 58.5 10.2 NA NA 7-c 375 288 0.77 865 0.05131 26 0.00868 5.0 0.19 23.33 26 55.7 2.8 50.8 13.6 NA NA 8-c 338 333 0.99 2245 0.20822 19 0.02676 4.0 0.21 17.72 19 170.2 6.9 192.1 39.6 469.0 207.0 9-t 2012 2758 1.37 300 0.04993 47 0.00892 2.3 0.05 24.63 47 57.2 1.3 49.5 23.6 NA NA 10-c 1461 2063 1.41 3790 0.06142 8 0.00910 2.9 0.34 20.42 8 58.4 1.7 60.5 5.3 146.0 94.0
118

119
Table 3.1 (Continued) Concentration Isotopic Ratio Apparent ages Sample U Th Th U206Pbm 207 Pb 206 Pb 206Pb 206Pb 207 Pb 206 Pb
A-1 (ppm) (ppm) U 204 Pbc 235 U
±% 238 U
±% Error corr 207 Pb
±% 238U
±Ma 235 U
±Ma 207 Pb
±Ma
1-c 102 370 3.63 508 0.0663 71 0.0097 13.3 0.19 20.17 69 62.2 8.2 65.2 43.7 175 810 2-c 133 138 1.04 848 0.12814 55 0.01563 7.0 0.13 16.82 55 100 7 122.4 61.8 584 595 3-t 48 106 2.21 254 0.12425 57 0.00979 10.5 0.18 10.87 56 62.8 6.6 118.9 62.1 1468 532 4-c 164 308 1.88 454 0.10009 37 0.0098 9.2 0.25 13.5 36 62.8 5.8 96.9 33.7 1044 363 5-c 89 251 2.82 308 0.17678 40 0.01035 8.7 0.22 8.08 39 66.4 5.8 165.3 59.6 2012 348 6-c 71 129 1.82 198 0.14922 50 0.01031 6.1 0.12 9.53 50 66.1 4 141.2 64.2 1714 459 7-c 126 172 1.37 589 0.10442 33 0.01015 11.7 0.35 13.4 31 65.1 7.5 100.8 31.5 1059 314 8-c 118 217 1.84 513 0.07159 48 0.00978 9.3 0.2 18.83 47 62.7 5.8 70.2 31.8 333 530 9-c 44 75 1.70 170 0.24771 71 0.00968 14.1 0.2 5.39 70 62.1 8.7 224.7 134.2 2704 576 10-c 86 113 1.31 364 0.17761 70 0.01075 15.3 0.22 8.34 68 68.9 10.5 166 101.8 1954 609 11-c 52 104 2.00 154 0.09968 72 0.00908 18.3 0.25 12.55 70 58.2 10.6 96.5 64.1 1189 686 12-c 78 157 2.01 167 0.14107 55 0.00982 13.2 0.24 9.6 53 63 8.3 134 66.8 1699 492 13-c 77 148 1.92 336 0.15378 48 0.00997 17.1 0.36 8.94 45 63.9 10.9 145.2 62.7 1830 404 14-c 47 69 1.47 228 0.25727 44 0.00814 13.1 0.3 4.36 42 52.2 6.8 232.5 87.9 3047 338 15-c 63 145 2.30 304 0.22155 28 0.00995 16.4 0.58 6.19 23 63.8 10.4 203.2 50.9 2472 196 16-c 53 38 0.72 314 0.21263 51 0.0104 17.4 0.34 6.74 48 66.7 11.5 195.8 87.2 2326 412 17-c 98 131 1.34 610 0.15736 53 0.01071 10.7 0.2 9.38 52 68.7 7.3 148.4 71.1 1742 479 18-c 144 217 1.51 1043 0.07563 43 0.0095 12.7 0.3 17.31 41 60.9 7.7 74 30.2 521 449 19-c 97 8 0.08 210 0.08968 62 0.0086 13.9 0.23 13.22 60 55.2 7.7 87.2 50.5 1086 605 20-c 96 128 1.33 587 0.11218 42 0.01057 8.3 0.2 12.99 42 67.8 5.6 108 42.6 1121 415
Age = Apparent ages + systematic errors (~3.0%), c=core, t=tip, bold are data rejected from weight mean age calculation errors
119

120
Table 3.2- Sample description and summary of U-Pb ages Sample Description* U-Pb Age Summary **
A-1 Andesite
64.2 ± 2.5 Ma, 100 ± 7Ma
D-1 Bi Diorite 58.3 ± 2.0 Ma, 170.2 ± Ma G-1 Bi-Hbl Granodiorite
55.5 ± 1.9 Ma
G-2 Bi-Hbl Granodiorite with phyllic alteration (Pit sample)
55.6 ± 1.7 Ma, 151± 5 Ma, 1483Ma ± 48Ma
P-1 Porphyry quartz monzonite (mineralized) phyllic alteration over potassic alteration (Pit sample)
54.3 ± 1.7, 125 ± 5, 143.9± 6.5
P-2 Porphyry quartz monzonite (mineralized) phyllic alteration (Pit sample)
54.3 ± 1.7, 112.6 ± 9.5, 124.5 ± 4.5, 142 ± 6, 1422 Ma ± 48Ma, 1492 Ma ± 57Ma
P-3 Barren crowded porphyry (Pit sample) “Tan porphyry”
52.6±1.6, 167 ± 6
* Bi = Biotite, Hbl = Hornblende, Phyllic alteration corresponds to the mineral assemblage of quartz + sericite and pyrite pervasive and in veinlets; Potassic alteration correspond to biotite and/or K feldspar presence in veins. ** Crystallization ages are listed first; inherited ages, when determined, are shown in italics. The reported ages are based primarily on 206Pb/238U ratios for <800 Ma grains and 206Pb/207Pb for >800 grains

121
Table 3.3, Re-Os molybdenite age
Sample Total Re
(ppm)
187 Re (ppm)
187 Os (ppb) Re-Os age*
VA-Ph 195 109 122 53.6 ± 0.3
VA-K 71 40 45 53.8 ± 0.3 * Ages are reported with a 0.5% error, which is considered a conservative estimate and reflects all the sources of error -i.e. uncertainty in the Re decay constant (0.31%), 185Re and 190Os spike calibrations (0.08 and 0.15, respectively), and analytical errors. .

122
CHAPTER 4: RE-OS MOLYBDENITE AND LA-ICPMS U-PB ZIRCON GEOCHRONOLOGY FROM THE MILPILLAS PORPHYRY COPPER DEPOSIT: INSIGHTS FOR MINERALIZATION IN THE CANANEA DISTRICT, SONORA, MEXICO.
4.1, INTRODUCTION
The American Southwest is one of the most important mineralized regions of the
world. This metallogenic province is notable for copper, molybdenum, gold, silver and
platinum resources (Titley, 1995). It contains more than 50 deposits, some of which are
considered giant ore deposits, among them Morenci in the US, and Cananea and La
Caridad in Mexico.
The first attempts to determine the timing of mineralization and magmatism for
Mexican porphyry copper deposits were by Damon et al. (1983). Later, McCandless and
Ruiz (McCandless and Ruiz, 1993) provided the first Re-Os molybdenite ages for
porphyry copper deposits (PCDs) in the American Southwest and northern Sonora,
Mexico, and concluded that there were two periods of regional mineralization at ~74-70
Ma and at 60-55 Ma. More recently, Barra et al., (in review) provided new Re-Os
molybdenite ages for ten porphyry copper deposits from northern Mexico. His data
expands the Laramide mineralization event to 50 Ma, and suggesting the idea of porphyry
mineralization could occur at ~64 Ma but not data is presented to support. The older
period of mineralization (74-70 Ma) has not been recognized in Mexico.
In recent years and with the advancement of geochronological analytical
techniques, new studies have been made in order to determine the timing of

123
mineralization and the duration of hydrothermal systems in different porphyry copper
provinces of the world (i.e. Chilean province, Marsh et al., 1997; Ossandon et al., 2001;
Bertens et al., 2003, Padilla-Garza., 2003; Masterman, 2004; Maksaev et al., 2004). In the
American southwest porphyry copper province advances have been made in only a few
deposits (i.e. Bagdad, Barra et al., 2003; Morenci, Enders, 2002; Sierrita, Jensen, 1998;
Herrmann, 2001; La Caridad, Valencia et al., in review; El Arco, Valencia et al., in
review). However, at the district level the timing of the different deposits is generally not
well constrained (i.e. Cananea district in Sonora, Mexico and Pima district in Arizona,
USA).
The Cananea district, located in northeast Sonora, Mexico (Fig. 4.1), has
produced more than 3.5 millions of tons of copper (written communication, Perez-Segura
2001). The district is characterized by a cluster of PCDs that includes the world class
porphyry copper deposit of Cananea, Lucy and Maria mines, Milpillas and Mariquita
projects and Los Alisos, El Toro, El Alacran and La Piedra prospects (Fig. 4.2). These
deposits have reserves over 11 millions tons of copper (Long, 1995).
In spite of the economic importance of the Cananea district, only reconnaissance
scale geochronological work had been done on the timing of mineralization and
mineralization (Anderson and Silver, 1977; Damon et al., 1983; McCandless et al., 1993;
Wodzicki, 1995; Carreon-Pallares, 2002). An important remaining question is whether
the multiple centers of mineralization in the district are the result of one episode or
multiple short-lived episodes of mineralization.

124
In this paper, we reported data from the Milpillas deposit, which is the prime
example of a hidden deposit in Mexico, and specifically in the Cananea porphyry copper
district, which ranks among the three largest known porphyry copper districts in North
America. Here we use U-Pb in zircons and Re-Os in molybdenite to constrain the timing
of magmatism and molybdenite mineralization in the Milpillas deposit, and to compare
with previous Re-Os molybdenite ages from ore deposits in the same district
(McCandless and Ruiz, 1993; Barra et al., in review). The question of the number of
mineralization episodes in the district is relevant both to the metallogeny of Southwest
North America and to provide guidance for the development of exploration programs.
4.2, GEOLOGICAL BACKGROUND
4.2.1, Regional geological setting
The Cananea district lies on the southwestern edge of the North American craton
(Sedlock et al., 1993) (Fig. 4.1), which is an extension of the geology of southern Arizona
(Terrane I of Titley and Anthony, 1989). The basement of the terrane is the Precambrian
Pinal Schist (1.68 Ga), intruded by 1.41-1.48 Ga anorogenic granites (Fig. 4.3) (Silver et
al., 1977; Anderson and Silver, 1981; Anderson and Bender, 1989). Paleozoic
sedimentary rocks in Northeast Sonora (Stewart et al., 1990; Gonzalez-Leon, 1986;
Blodgett et al., 2002) represent the southern extension of the Cordilleran miogeocline and
platformal sequences (Rangin, 1978; Campa and Coney, 1983; Stewart, 1988) and these
rocks are represented in the district by the Bolsa (Cambrian), Abrigo (Cambrian), Martín
(Devonian) and Escabrosa (Mississippian) Formations and part of the Permian Naco
Group (Fig. 3) (Meinert, 1982; Wodzicki, 1995; Wodzicki, 2001).

125
Precambrian and Paleozoic rocks are overlain by Triassic-Jurassic volcanic rocks
(Fig. 3.3) (Elenita and Henrietta Formations; Valentine, 1936) and intruded by Jurassic
plutonic rocks. These rocks are part of a continental magmatic arc and the arc extends
from California, USA to Durango, Mexico (Anderson and Silver, 1978; Tosdal et al.,
1989; Jones et al., 1995). The Bisbee Group of Late Jurassic-Early Cretaceous age crops
out northeast of the area, but it is absent in the Cananea region, suggesting that this area
was a topographic high during the Mesozoic (McKee and Anderson, 1998). Plutonic and
volcanic rocks of Late Cretaceous-Eocene age are widespread throughout southern
Arizona, New Mexico and northern Sonora and were emplaced during the Laramide
orogeny. The most prominent units in the region are volcanic rocks from the Mesa
Formation (hornblende Ar-Ar age of 69.0 ± 0.2 Ma, Wodzicki, 1995) and the
granodioritic Cuitaca Batholith (Fig. 3) (conventional U-Pb zircon age of 64.0 ± 3 Ma,
Anderson and Silver, 1977). Most of the porphyry copper deposits in southwest North
America are associated with the Laramide orogeny (75-50 Ma, Shafiqullah et al., 1980)
and their geologic setting has been discussed by Titley (1981; 1982), Titley and Beane
(1981), Titley and Anthony (1989), and Titley (2001).
Most of the deposits in the Cananea district have been dated by K-Ar dating
techniques, which yield ages ranging from ~60 ± 4 Ma to ~54 ± 2 Ma (Damon and
Mauger, 1966; Damon et al., 1983; Wodzicki, 1995).
After a period of quiescence of about ~20 myr, caused by the westward migration
of the magmatic arc (Coney and Reynolds, 1977; Damon et al., 1981; Damon et al.,
1983), intensive magmatism occurred and is represented by extensive volcanic sequences

126
of Oligocene age (30-25 Ma) (Shafiqullah et al., 1980; Damon et al., 1981; Roldan-
Quintana, 1981). During the Miocene, mid-crustal extension and core-complex formation
occurred in Sonora between 27-12 Ma (Gans, 1997) causing disruption and rotation of
the Cananea district (Carreon-Pallares, 2002).
4.2.2, Local geology
The geology of the Cananea district has been described by numerous authors
since the early 20th century (i.e. Emmons, 1910; Valentine, 1936). More recently, studies
have focused on the geology of individual deposits that form part of the district (i.e. Perry,
1961; Ochoa-Landin and Echavarri, 1978; Meinert, 1982; Bushnell, 1988; Wodzicki,
1995; 2001; Carreon-Pallares 2002). The first comprehensive work on Milpillas was done
by De la Garza et al. (2003).
The Milpillas deposit, is a secondary enriched porphyry copper deposit that
consists of a high-grade chalcocite blankets that are entirely covered by Tertiary-
Quaternary alluvial sediments commonly 50-250 meters thick (De la Garza et al., 2003).
Milpillas was discovered and developed after intensive exploration programs and more
than 100,000 meters of drilling, initially by Minera Cuicuilco (1975) and continued up to
feasibility by Industrias Minera Peñoles (1998). Current resources are estimated at 30
million tons of leachable ore with 2.5% copper (Carreon-Pallares, 2002).
The Milpillas ore deposit is located in a zone of extension common in the Basin
and Range province, which is referred as the Cuitaca Graben (Fig. 4.2). The Milpillas

127
deposit is included within the down-dropped block 7 km wide Cuitaca Graben, which
cuts the Cananea region from north to south (Fig. 4.2). The eastern portion of the graben
is at a shallower level than the western portion and is dominated by Tertiary gravels,
Quaternary alluvium, and erratic sub-crops of Laramide volcanic units. The deeper
western part of the Cuitaca graben is dominated by Quaternary alluvium. Close to the
eastern boundary of the Cuitaca graben, a small horst is present where altered and
oxidized sub-outcropping reveals the existence of the Milpillas ore deposit (Fig. 4.2 and
4.4)
The main host rocks in the Milpillas area consist of volcaniclastic and andesitic
rocks that range in age from Jurassic to Late Cretaceous-early Tertiary (Henrietta and
Mesa Formation). These rocks were intruded by small porphyry stocks that vary in
composition from quartz monzonite to monzonite (Fig. 4.4). No porphyry units crop out
at the surface, however there are some isolated outcrops of altered and leached volcanic
host rocks. Most of the ore body is covered by a sequence of post mineralization
conglomerates and syn-tectonic gravels.
4.2.3, Structural geology
The district-scale of structural controls of porphyry copper deposits in
southwestern North America are consistent with the dominant tectonic stresses that
existed at their particular time of evolution. These stresses vary from compressional to
tensional (Titley, 2001). However, tectonic evolution of this region has continued after
ore deposit formation. During Oligocene and Miocene time, the region has been intensely

128
faulted, extended and rotated, resulting in a significant disruption and rotation of deposits
(e.g. San Manuel-Kalamazoo, Ajo, and Cananea). The magnitude of rotation varies from
moderate (30o to 60o) to severe (60o to 90o) (Wilkins and Heinrich, 1995).
In the Milpillas area, three main lineaments have been described: a pre-mineral
N-S trend, a syn-mineral NE trend, and a post-mineral NW trend (De la Garza et al.,
2003). However, a detailed structural study of the Milpillas deposit from quartz veins
and mineralized structures performed by Carreon-Pallares (2002) shows a flat radial and
concentric structural pattern with preferential dips to the NE, E and SE. These dip trends
are the same primary main orientations reported for Laramide stocks throughout Arizona
(Rehrig and Heidrick, 1976; Heidrick and Titley, 1982), whereas the concentric pattern
has been recognized for Sierrita, Arizona by Titley (1982).
4.2.4.Mineralization and Hypogene and Supergene Alteration
The hypogene mineralization in PCDs in the district is mainly present as breccias,
stockwork and/or disseminated sulfide minerals. Where pre-Laramide sedimentary host
rocks are present, skarn mineralization is developed. High grade but low tonnage ore
bodies are found in skarn zones, as for example in the Cananea mine, where
mineralization of Cu-Zn-Pb was developed by replacement of Paleozoic carbonate rocks
interbedded with quartzites (Meinert, 1982). In some deposits, high grade mineralization
was developed in breccias pipes, such as in Cananea mine (Brecha La Colorada,
Bushnell, 1988) or in Maria mine (Wodzicki, 1995). Scarce and low grade hypogene

129
mineralization is recognized at the Milpillas deposit (0.15-0.20 % Cu), because of these
low grades, the exploration program focused on areas of supergene enrichment.
The supergene enrichment zone presents a vertical zoning with a leach cap and
oxide level typical of porphyry copper systems. The secondary zones (Fig. 4.4) comprise
the most important ore bodies in the deposit. These bodies can reach copper grades that
range from > 1% to more than 10%.
Descriptions of supergene mineralization are scarce or non-existing for Mexican
PCDs. The only known description was reported by Seagart et al., (1974) for La Caridad.
In the Milpillas ore body the high grades of Cu are found in horizontal bodies (blankets)
(Fig. 4.4). At least three cycles of secondary enrichment are recognized in the deposit,
which resulted in at least six ‘blankets’ that occur at a depth of 150 to 750 meters below
the surface. The upper three blankets contain oxide mineralization and have a complex
mineralogical assemblage consisting of: “green Cu-oxides” (antlerite, brochantite,
malachite, azurite and chrysocolla); “red Cu-oxides” (cuprite, native copper, delafossite,
and minor “pitch” limonite ); and “black Cu-oxides” (neotocite, melaconite, tenorite, and
minor “Cu-wad”) (De la Garza et al., 2003). Below these three blankets is an
intermediate horizon that contains a mixture of oxides and sulfides. The two deepest
blankets contain dominantly secondary sulfide minerals (mainly chalcocite and minor
covellite) (De la Garza et al., 2003). Total copper resources for these blankets are 30 Mt
at 2.5% Cu.
4.3, ANALYTICAL PROCEDURES

130
4.3.1, Zircon U-Pb dating
We collected a drill core sample from drill hole M-120 at a depth of ~540 m (Fig.
4.4). The sample was later crushed and milled. Heavy mineral concentrates of the <350
microns fraction were separated magnetically. Inclusion-free zircons from the non-
magnetic fraction were then handpicked under a binocular microscope. Zircons were
mounted in epoxy and polished for laser ablation analysis.
Single zircon crystals were analyzed in polished sections with a Micromass
Isoprobe multi-collector ICPMS equipped with nine Faraday collectors, an axial Daly
detector, and four ion-counting channels (Dickinson and Gehrels, 2003). The Isoprobe is
equipped with an ArF Excimer laser, which has an emission wavelength of 193 nm. The
analyses were conducted on 50-35 micron spots with output energy of ~32 mJ and a
repetition rate of 10 Hz. Each analysis consisted of a background measurement (one 20-
second integration on peaks with no laser firing) and twenty 1-second integrations on
peaks with the laser firing. Any Hg contribution to the 204Pb mass is accordingly removed
by subtracting the backgrounds values. The depth of each ablation pit was ~20 microns.
Total measurement time was ~90 s per analysis.
The collectors were configured for simultaneous measurement of 204Pb in an ion-
counting channel and 206Pb, 207Pb, 208Pb, 232Th, and 238U in Faraday detectors. All
analyses were conducted in static mode. Inter-element fractionation was monitored by
analyzing fragments of SL-1, a large concordant zircon crystal from Sri Lanka (SL-1)
with a known (ID-TIMS) age of 564 ± 4 Ma (2σ) (Gehrels, unpublished data). The
reported ages for zircon grains are based entirely on 206Pb/238U ratios because errors of

131
the 207Pb/235U and 206Pb/207Pb ratios are significantly greater. This is due primarily to the
low intensity (commonly <0.5 mV) of the 207Pb signal from these young, low-U grains.
207Pb/235U and 206Pb/207Pb ratios and ages are accordingly not reported.
The 206Pb/238U ratios are corrected for common Pb by using the measured 206Pb/204Pb,
a common Pb composition from Stacey and Kramers (1975), and an uncertainty of 1.0 on
the common 206Pb/204Pb.
The weighted mean of ~20-25 individual analyses was calculated according to
Ludwig (2003). This measurement error is added quadratically to the systematic errors,
which include contributions from the calibration correction, decay constant, age of the
calibration standard, and composition of common Pb. The systematic error is 1.8% for
this sample. All age uncertainties are reported at the 2-sigma level.
4.3.2, Molybdenite Re-Os dating
Molybdenum mineralization at Milpillas occurs frequently intergrown with
copper sulfides. In order to determine the timing of hydrothermal mineralization, we
selected two molybdenite samples from two different drill holes M-120 (at ~514m depth)
and M-098 (at ~540m depth). Selection of samples was based on sulfide assemblages.
The Re-Os system applied to molybdenite is an important tool in determining the timing
of mineralization since ore minerals (molybdenite) are dated directly. Other dating
techniques, such as K-Ar and Ar-Ar are applied to associated silicates and hence provide
indirect age determinations. Furthermore, the very low errors usually associated to the
Re-Os technique (between 0.33% to <1% of age determination) allows us to constrain or

132
identify different pulses of mineralization that occurs in very short periods of time (e.g.
Maksaev et al., 2004).
Molybdenite sample M-120 was collected from a 4-mm-thick vein that has an
assemblage of quartz-sericite-molybdenite (Fig. 4.5). Sample M-98 was collected for a 5-
mm-thick vein with an assemblage of quartz-sericite-molybdenite-chalcopyrite-pyrite
(Fig. 4.5). Both samples are in the quartz monzonite porphyry unit, with a middle to
strong quartz-sericite alteration that overprints and partially replaces the original rock
forming silicates and their pre-existing alteration products (e.g. biotite and K-feldspar)
(Beane, 1982).
Approximately 0.05 g of hand-picked molybdenite was loaded in a Carius tube
with 8 ml of reverse aqua regia. While the reagents, sample and spikes were frozen, the
Carius tube was sealed and left to thaw at room temperature (Shirley and Walker, 1995).
The tube was placed in an oven and heated to 240o C for 12 hours. The solution was
treated in a two-stage distillation process for osmium separation (Nagler and Frei, 1997).
Osmium was further purified using micro-distillation technique, (Birck et al., 1997) and
loaded on platinum filaments with Ba(OH)2 to enhance ionization. After osmium
separation, the remaining acid solution was dried and later dissolved in 0.1 HNO3.
Rhenium was extracted and purified through a two-stage column using AG1-X8 (100-
200 mesh) resin and loaded on nickel filaments with Ba(NO3)2.
Samples were analyzed by negative thermal ion mass spectrometry (NTIMS)
(Creaser et al, 1991) on a VG 54 mass spectrometer. Molybdenite ages were calculated
using a 187Re decay constant of 1.666x10⁻¹¹ year –1 (Smoliar et al., 1996). Ages are

133
reported with a conservative total error of 0.5 % (~2 sigma), which is the upper limit of
reported Re-Os analyses, considering uncertainties from instrumental counting statistics,
uncertainties in spike calibrations and in the 187 Re decay constant (0.31%).
4.3.3, Re-Os in molybdenite results
Re-Os age determinations of two molybdenite samples are shown in Table 4.1.
This table also includes previous data from the district reported by Barra et al. (in review).
Sample locations are shown in Figure 4.4. Total rhenium and 187Os concentration range
from 6547-8785 ppm and 4288-5735 ppb, respectively. Sample M-120 yielded an age of
63.0 ± 0.4 Ma (~0.5% error) and sample M-098 and 63.1 ± 0.4 Ma (~0.5% error).
4.3.4, U-Pb in zircon results
Sixteen zircon grains were measured from sample M-120. Results are reported in
Table 4.2 and each line represents a spot analysis. All reported ages in Table 4.2 have
uncertainties at the two-sigma level, which only includes the analytical error. The age of
each sample includes additional uncertainties from the calibration correction, decay
constant and common lead. These systematic errors (1.8 %) are added quadratically to the
analytical error.
Zircons analyzed are clear pinkish in color and range from 80 to 250 µm in size. They
are doubly-terminated prisms dominated by the [100] face with a 2.5-3:1 length to width
ratio, which are typical morphologies of zircons in igneous rocks. Measurements were
made at the center and tip of zircons.

134
Zircons from sample M-120 have U and Th concentration that varies from 530-195
ppm and 240-88 ppm, yielding U/Th ratios of ~2, characteristic of igneous zircons
(Rubatto et al., 2002). These zircons yielded a weighted average 206 Pb/ 238 U age of 63.9
± 1.3 Ma (n=16, MSWD =0.91; Fig. 6). In the sixteen grains analyzed no older
component was detected.
4.4, DISCUSSION
4.4.1, Age of mineralization
Chemical composition and cross cutting relationships at the Milpillas deposit
indicate at least four different porphyry pulses intrude the Late Cretaceous Mesa (69 ±
0.2 Ma, Wodzicki, 1995) and Jurassic Henrietta Formations (Gustafson, 2000). The four
porphyry phases recognized by Gustafson (2000) include two pre-mineral units, a syn-
mineralization phase and a late porphyry.
The 206 Pb/ 238U zircon age of 63.9 ± 1.3 Ma (Fig. 4.6) for the mineralized quartz
monzonite porphyry unit presented in this work is the only crystallization age reported so
far for a productive intrusion in the Cananea district. This age is similar to the Cuitaca
Granodiorite (64 ± 3 Ma) that crops out in the western border of the Cuitaca Graben,
However, this unit has not been identified in any of the several drill holes from the
Milpillas area.
Molybdenite samples of two different mineral assemblages from two deep drill
holes (separated about 100 m from each other), have identical Re-Os ages, suggesting

135
that the molybdenite mineralization of Milpillas porphyry copper deposit occurred within
a very short period of time (weighted average age of 63.1 ± 0.3 Ma).
Our U-Pb and Re-Os ages not only indicate a temporal relationship between the
magmatism and hydrothermal activity, but also that the Milpillas porphyry copper deposit
is the oldest Laramide porphyry in the Cananea district. Furthermore, the limited data
presented suggests that the duration of magmatic-hydrothermal activity in Milpillas was
brief and that the mineralization was the product of a single complex intrusion as
proposed by Gustafson (2000).
4.4.2, Long-lived or short-lived multiple mineralization centers
It is evident that knowledge of the age and duration of geologic events that result
in the formation of important concentrations of ore minerals in the earth’s crust is
fundamental in the understanding of the evolution and origin of ore deposits. Even more,
in porphyry copper deposits the long-lived magmatic-hydrothermal model versus the
short-lived model, with several discrete pulses, and its role in the formation of large or
giant ore deposits has become the focus of numerous recent studies (e.g. Arribas et al.,
1995; Cornejo et al., 1997; Marsh et al., 1997; Clark et al., 1998; Hedenquist et al., 1998;
Reynolds et al., 1998; Selby and Creaser, 2001; Barra et al., 2003; Masterman et al., 2004;
Maksaev et al., 2004). Determination, then, of the lifespan of porphyry copper systems
and its relation with the size of the deposit (i.e. the amount of copper contained) is critical
in the development of genetic models of PCDs at the deposit level and probably more

136
relevant at the district level were porphyries tend to occur in clusters. Obviously, timing
information is relevant in the construction of regional metallogenic models.
The pioneering work of Damon et al. (1983) remained for many years the only
geochronological data on Mexican PCDs. This work reported several K-Ar ages of
different K-rich minerals (i.e. hornblende, biotite, K-feldspar) for host rocks and
mineralized porphyries. However, more recent age determinations using other techniques
have shown that some of the K-Ar ages of Damon et al. (1983) do not represent the main
hydrothermal-mineralization or magmatic episodes (i.e. El Arco Baja California, Mexico
K-Ar of ~98-106 Ma (Barthelmy, 1975) versus U-Pb and Re-Os of ~164 Ma (Valencia et
al., 2005); Cumobabi K-Ar of ~40 Ma compared to K-Ar of ~55.6-63.1 Ma
(Scherkenbach et al., 1985) and Re-Os of ~59 Ma (Barra et al., in review)). These K-Ar
ages apparently record cooling rather than magmatic or hydrothermal events, and
therefore led to erroneous metallogenetic models of the region.
It has been stated that porphyry copper deposits in the North America southwest
did not form during temporally random or isolated events, but rather during the
maturation of complex magmatic centers that progressed through a long-lived sequence
of igneous episodes (Lang, 1991). The Cananea cluster, the largest porphyry Cu-Mo
district in Mexico, has been suggested to be the result of long-lived magmatic-
hydrothermal system, spanning from ~64 Ma to ~52 Ma (Fig. 7) (Meinert, 1982;
Wodzicki, 1995). This statement is supported by previous less precise K-Ar and Re-Os
ICP-MS ages, scarce U-Pb ages and limited Ar-Ar geochronologic data from different
geological units from various deposits in the district. However, it is clear that the large

137
span of time (>10Ma) in the magmatic-hydrothermal system might be a function of
equivocal dating techniques or of disturbed Ar ages. An important question to answer in
here is if the multiple mineralization centers in the district are the result of a single long-
lived magmatic-mineralization episode or multiple short-lived discrete periods.
Barra et al. (in review) dated several porphyry copper centers from Arizona,
Sonora and Sinaloa. These new Re-Os molybdenite ages were obtained from different
centers of mineralization in the Cananea District, including El Alacran prospect, former
Maria mine and former breccia La Colorada and Incremento 3 at Cananea mine (Table
4.1). These data, in addition to the new data from Milpillas deposit indicate that
mineralization within the district occurred in at least three discrete episodes, at ~59 Ma,
~61 Ma and ~63Ma (Fig. 4.7), suggesting a model of multiple centers of mineralization
produced during short-lived discrete periods of time.
Furthermore, it is possible that the large volume of metal in the Cananea mine is
the result of overprinting of multiple discrete periods of hydrothermal-mineralization, in
contrast to single mineralization events in Maria, Milpillas and El Alacran. The limited
geochronological data for Cananea does not allow to test this hypothesis, however,
several examples from Chilean porphyry copper deposits ( i.e. Chuquicamata, Reynolds
et al., 1998; Ballard et al., 2001; Ossandon et al., 2001; Los Pelambres, Bertens et al.,
2003, La Escondida, Padilla et al., 2004; El Teniente, Maksaev et al., 2004) suggest that
large deposits are the result of multiple overlapping discrete episodes of mineralization.
4.4.3, Timing of mineralization in Northwest Mexico

138
Porphyry copper mineralization in Northwest Mexico is Laramide in age, with the
exception of El Arco in Baja California, which has an older Middle Jurassic age (164 Ma,
Valencia et al., in review).
The Laramide orogeny is characterized in the North American southwest by a
compressional regime with basement uplift and thrust fault deformation, and widespread
igneous activity observed as extensive calc-alkaline magmatism in southern Arizona,
New Mexico, and Sonora ranging from 80 Ma to 40 Ma (Damon et al., 1964; Damon and
Mauger, 1966; Shafiqullah et al., 1980; Coney, 1976). McCandless and Ruiz (1993)
determined two distinct intervals of porphyry copper mineralization in the southwestern
region (including northern Mexico), one from 74-70 Ma and the other from 60-55 Ma,
based on Re-Os systematics. However, in spite of this important and pioneering
contribution, these ages were determined using less precise ICP-MS technique, and ages
were calculated with the old decay constant (1.64 x 10⁻¹¹ a-1, Lindler et al., 1989),
yielding results with high errors and slightly older ages. For example the Re-Os
molybdenite age of Maria Mine calculated at 57.4 ± 1.6 Ma (1sigma) is recalculated to
56.5 ± 3.2 Ma (2 sigma) using the latest decay constant of 1.666 x 10⁻¹¹ a-1 (Smoliar et al.,
1997). Re-Os age determination of a sample from the same deposit using the more
precise TIMS technique yielded an age of 60.4 ± 0.3 Ma (Barra et al., in review). This
new determination and the small associated error, allow us to better constrain the relative
timing of the different deposits in this important province. Re-Os data from a number of
porphyry copper deposits in northwest Mexico (La Caridad, (Valencia et al., in review),
El Creston, Cananea, El Alacran, Suaqui Verde, Maria and Cuatro Hermanos (Barra et

139
al., in review), and Milpillas (this study)), suggesting that the two largest districts in
northwest Mexico occurred at two main intervals; at 63-59 Ma (Cananea district), and at
55-53 Ma (La Caridad District) (Fig. 4.7). Although mineralization in these districts
formed at two different geologic times, magmatism seems to have occurred over a much
more extensive period, overlapping in space and time. This is illustrated in La Caridad,
where 63.5 Ma volcanic rocks host the 54 Ma porphyry mineralization (Valencia et al., in
review). Similar examples of this have been recognized in other PCDs in the Arizonan
province.
Finally, the ~70 Ma porphyry mineralization recognized in northern Arizona (e.g.
Mineral Park, Titley, 1982; Bagdad, McCandless and Ruiz, 1993; Barra et al., 2003) has
not been recognized in northwestern Mexico.

140
4.5, SUMMARY
The crystallization age of the productive quartz monzonite porphyry at Milpillas
deposit yields a 206 Pb/ 238U age of 63.9 ± 1.3 Ma. This age coupled with molybdenite
ages from two deep drill holes which have identical Re-Os ages (weighted average age of
63.06 ± 0.3 Ma), suggests that the mineralization of Milpillas porphyry copper deposit
occurred within a short period of time.
Mineralization within the Cananea district, occurred in at least three discrete
periods, at ~59 Ma, ~61 Ma and ~63Ma, supporting the model of multiple centers of
mineralization produced by the short lived discrete periods rather than a long lived
period of mineralization.
We believe that the large volume of metal in the Cananea Mine could result from
the overprinting of multiple discrete periods of hydrothermal mineralization, contrasting
with single mineralization event as in Maria, Milpillas and el Alacran.
The largest mineralized districts in northwest Mexico occur in two main intervals
one at 59-63 Ma (Cananea), and the other at 53-55 Ma (La Caridad Districts), where
associated magmatism overlaps in space and time.

141
Figure 4.1. Location of the Cananea Mining district (open square) and other porphyry copper deposit locations (open circles); dashed lines are terrane boundaries (Campa and Coney, 1983 and Sedlock et al. 1993).
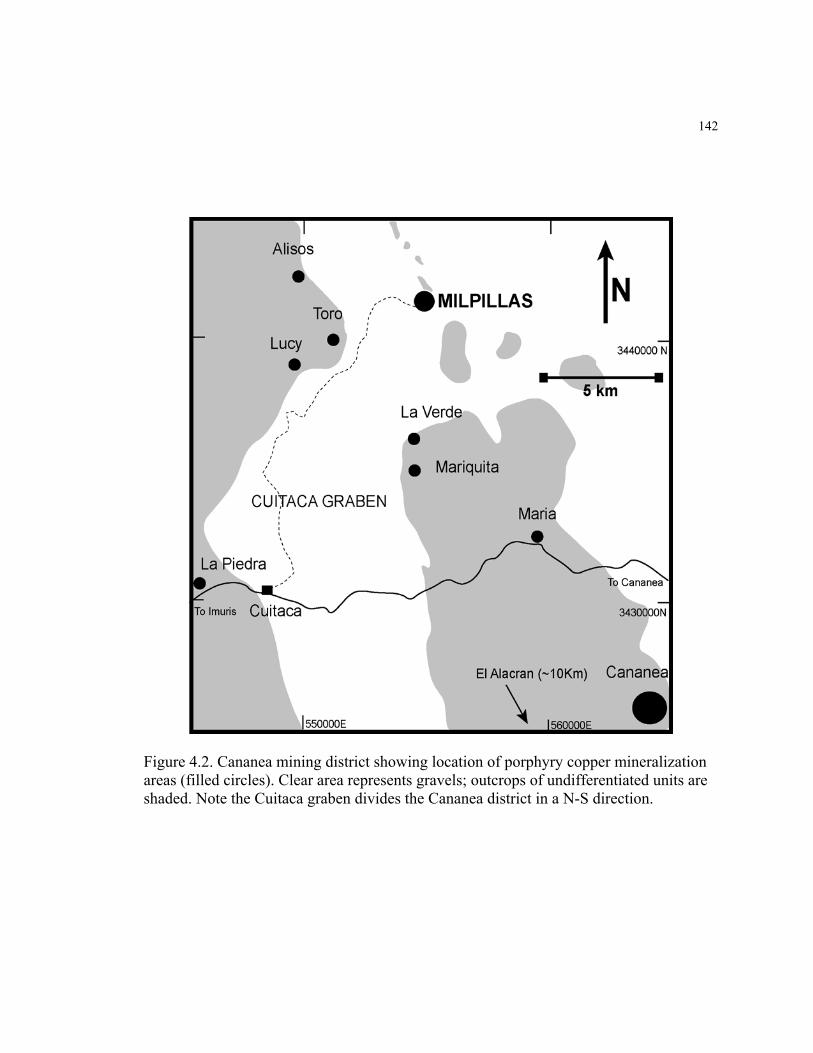
142
Figure 4.2. Cananea mining district showing location of porphyry copper mineralization areas (filled circles). Clear area represents gravels; outcrops of undifferentiated units are shaded. Note the Cuitaca graben divides the Cananea district in a N-S direction.

143
Figure 4.3. Generalized stratigraphic column for the Cananea district (modified from Wodzicki, 1995).

144
Figure 4.4. Schematic plant and cross section view of the Milpillas porphyry copper deposit. Also shown are sample location.

145
.
Figure 4.5. Photographs of molybdenite samples from drill cores used for Re-Os analyses

146
Figure 4.6. U-Pb weight average plot from sample M-120.

147
Figure 4.7. Summary of geochronological data from the Cananea mining district. Shaded bars illustrate the proposed three discrete events of mineralization recognized in the district, dashed mineralization event in La Caridad mining district (Valencia et al. in review). Solid diamond are Re-Os ages from molybdenite analyzed by TIMS; open diamond is Re-Os ages from molybdenite analyzed by ICP-MS; open squares are U-Pb ages from zircons; open circles are K-Ar ages biotite and sericite and solid circles are Ar-Ar ages from hornblende. Error bars are at 2sigma level. Data from (1) McCandless and Ruiz, 1993; (2) Barra et al., in review; (3) This study; (4) Wodzicki, 1995; (5) Damon et al., 1983; (6) Carreon-Pallares, 2002; (7) Damon and Mauger, 1966; (8) Silver and Anderson , 1977.

148
Table 4.1.- LA-MC-ICPMS U-Pb zircon data
Sample U Th U 206Pb 206Pb/238U ±(%) 206Pb/238U ±(Ma) (ppm) (ppm) Th 204Pbc Ratio Age*
1 230 218 1.1 627 0.00986 4.36 63.2 2.7 2 289 157 1.8 842 0.00956 4.18 61.4 2.6 3 379 178 2.1 606 0.00996 4.02 63.9 2.6 4 242 118 2.0 1150 0.00985 4.17 63.2 2.6 5 316 218 1.4 342 0.00972 6.23 62.4 3.9 6 530 123 4.3 1415 0.01008 3.57 64.7 2.3 7 318 177 1.8 643 0.01013 3.39 64.9 2.2 8 310 190 1.6 620 0.00983 4.02 63.1 2.5 9 295 123 2.4 1095 0.01003 3.01 64.4 1.9
10 275 119 2.3 832 0.00983 3.62 63.0 2.3 11 196 88 2.2 303 0.01008 4.30 64.6 2.8 12 286 163 1.8 460 0.01031 3.86 66.1 2.5 13 335 147 2.3 612 0.00997 2.92 63.9 1.9 14 266 240 1.1 1284 0.01012 2.87 64.9 1.9 15 195 87 2.2 372 0.00975 3.85 62.5 2.4 16 303 166 1.8 718 0.00994 4.09 63.7 2.6
*Ages in table only reflect the error from determining 206Pb/238U and 206Pb/204Pb. For the sample age additional uncertainty from the calibration correction, decay constant and common lead was considered. These systematic errors were (1.8 %) added quadratically to the measurement error

149
Table 4.2. Re-Os molybdenite ages from Cananea Mining District.
Location sample Total Re (ppm)
187 Re (ppm)
187 Os (ppm)
Age (Ma)
Milpillas M-098 8755 5523.4 5735.7 63.07 ± 0.35 M-120 6547 4116.1 4288.4 63.04 ± 0.35
El Alacran * B9 7352 4622 4690 60.9 ± 0.2 Maria * MR1 316.9 199.2 200.4 60.4 ± 0.3
Cananea* Incremento 3 95.7 60.2 59.2 59.3 ± 0.3 Brecha La
Colorada 90.7 57.0 55.7 59.2 ± 0.3
*Data from Barra et al. (in review), molybdenite ages were calculated using a 187Re decay constant of 1.666x10⁻¹¹ year –1 (Smoliar et al. 1996). Ages are reported with a 0.5% error, which is considered a conservative estimate and reflects all the sources of error (i.e. uncertainty in the Re decay constant (0.31%), 185Re and 190Os spike calibrations (0.08 and 0.15, respectively), and analytical errors).

150
CHAPTER 5: RE-OS AND U-PB GEOCHRONOLOGY OF THE EL ARCO PORPHYRY COPPER DEPOSIT, BAJA CALIFORNIA MEXICO.
5.1, INTRODUCTION
During Mesozoic time multiple orogenies affected the western area of the North
American continent, resulting in a complex and poorly understood mountain belt
(Umhoefer, 2003). As a consequence of one of these orogenies, specifically the Laramide
orogeny, a series of porphyry copper deposits were emplaced in southwest North
America making this region one of the most important porphyry Cu provinces in the
world (Fig. 5.1a) with more than 50 deposits (Titley and Anthony, 1989).
Although most of these deposits are Laramide in age (i.e. 50-70 Ma), older
porphyry copper mineralization from Early to Late Jurassic has been recognized in
California (Lights Creek, Storey, 1978; McFarlane, 1981), Nevada (Yerington district,
Dilles and Wrigth, 1988) and Arizona (Bisbee, Lang, 2001). These deposits are
associated with a continental Jurassic magmatic arc (Tosdal, 1989). Early Cretaceous
porphyry copper mineralization has also been described in Baja California (El Arco
deposit, Barthelmy, 1975; Echavarri-Perez and Rangin, 1978; Coolbaugh et al, 1995) and
in Michoacan (La Verde Inguaran, Coochey and Heckman, 1978; Sawkins, 1979; Damon
et al., 1981; Solano-Rico, 1995), which have been interpreted as being associated with
the Coastal batholith or with the accretion of the Guerrero Terrane (Campa and Coney,
1983). The Lights Creek, Bisbee, and El Arco have copper and important gold content,
whereas the La Verde Inguaran deposit has tungsten as a by-product (Osoria et al, 1991;
Coochey and Heckman, 1978).

151
For more than thirty years the El Arco porphyry copper deposit has been
interpreted to be Cretaceous in age (Shafiqullah, 1974 in Farias-Garcia, 1978; Instituto
del Petroleo, 1974 in Farias-Garcia, 1978; Barthelmy, 1975; 1979; Lopez-Martinez et al.,
2002). It was accordingly viewed as a continuation of the Early Cretaceous Alisitos
Formation (i.e. Rangin, 1978b; Sedlock et al., 1993; Sedlock, 2003; Ortega-Rivera, 2003;
Gastil, 1975; Gastil et al 1981; Wetmore et al, 2003; Schmidt et al. 2002).
El Arco porphyry Cu-Au deposit is located in an area of particular interest
because of its tectonic environment of formation (oceanic island arc) and its unique
hydrothermal and magmatic characteristics, compared to other classic porphyry copper
deposits of mainland Mexico and the U.S. Southwest. Furthermore, different age
determinations of El Arco area have been used in studies and interpretations of the
Mesozoic tectonic evolution of northwest Mexico and Baja California (i.e. Rangin,
1978b; Radelli, 1989; Gastil, 1975; Gastil et al., 1981; Gastil and Miller, 1984; Gastil,
1993; Schmidt et al., 2002; Wetmore et al., 2003). However, the age of the El Arco
porphyry copper deposit is poorly constrained, with K-Ar ranging from 93-138 Ma.
Recently a 40Ar-39Ar isochron age of 137 ± 1.4 Ma on pyrite single grains was reported
(Lopez-Martinez et al. 2002), prior to the Re-Os and U-Pb results reported here, it was
taken as the most probable age of formation of the El Arco porphyry copper deposit.
In this paper, we present new geochronological data from two robust isotopic
methods, Re-Os in molybdenite and U-Pb in zircons, in order to elucidate the
mineralization and crystallization ages of the El Arco porphyry copper deposit.

152
5.2, GEOLOGICAL BACKGROUND
5.2.1, Regional Geology
The Pacific margin of Baja California is part of the large mosaic of accreted
tectonostratigraphic terranes that make much of the North America Cordillera and
Circum-Pacific rim. Westward growth of the North American Craton occurred as
fragments of ocean basins, volcanic arcs, and subduction complexes that were accreted
onto the pacific margin of North America (Bonini, 1994). The geology of the Baja
California peninsula is characterized by three main geological units (Fig. 5.1a): (1) the
Pre-batholitic basement consisting of Franciscan-equivalents of the Vizcaino-Cedros
region, a Mesozoic volcanic and volcanoclastic belt (Choyal and Alisitos Formations), a
Triassic-Jurassic shale-sandstone belt and a Paleozoic metasedimentary belt. (2) The
second unit is the Peninsular Range batholith, also known as the Mesozoic thermal event.
(3) The third unit includes the post-batholitic sequences that have sedimentary and
volcanic rocks of Tertiary age (Gastil, 1975).
El Arco-Calmalli area is located in central Baja California ~40 km east of the city
of Guerrero Negro (Fig. 1b). El Arco porphyry deposit is located tectonostratigraphically
in the Alisitos terrane of Campa and Coney (1983), or the Santa Ana terrane of Coney
and Campa (1987) and the Yuma terrane of Sedlock et al (1993). This terrane with
different names is characterized by a Lower Cretaceous insular arc with a volcano-
sedimentary sequence that outcrops discontinuously from Punta Chinos to El Arco-
Calmalli, with a length of 500 km and 50 km width on average (Almazan-Vazquez, 1988).

153
The Vizcaino Terrane (Campa and Coney, 1993) or Cochimi Terrane (Sedlock et al.,
1993), is located to the west of El Arco-Calmalli area and it comprises oceanic island arc
rocks, ophiolites, melange and blueschist of Triassic-Jurassic age (Rangin, 1978; Campa
and Coney, 1983, Sedlock et al., 1993), and Jurassic back-arc basin sediments. The
boundary between these terranes is not exposed, but a gravimetric anomaly in the area
has been interpreted by Sedlock et al. (1993) as the possible boundary (Fig. 5.1b).
El Arco-Calmalli area, has a prebatholitic basement (Gastil, 1975) composed of a
sequence of andesitic flows, hornblende diorites, gabbros and possibly pillow lavas
(Radelli, 1989), all strongly deformed (Fig. 5.2a). These units are overlain by foliated
meta-volcanic and meta-sedimentary rocks, including meta-volcanic agglomerates, meta-
graywackes, thin-bedded lenticular marble, meta-andesitic flows and breccias (Barthelmy,
1975; Farias-Garcia, 1978). The upper part of this sequence is composed of massive
volcanic rocks affected by a greenschist facies metamorphism, and hosts the porphyry
granodioritic intrusions that are responsible for the Cu-Au mineralization at El Arco
(Farias-Garcia, 1978; Radelli, 1989). Based on cooling K-Ar ages of ~107-93 Ma
(Shafiqullah, 1974 in Farias-Garcia, 1978; Barthelmy, 1975) from these intrusions and on
general stratigraphic similarities, the meta-volcanic and meta-sedimentary rocks have
been correlated by many authors (Rangin, 1978; Echavarri-Perez and Rangin, 1978;
Farias-Garcia, 1978; Barthelmy, 1975, 1979; Coolbaugh et al., 1995) with the Alisitos
Formation.

154
5.2.2, Deposit Geology
The Cu-Au-(Mo) mineralization at El Arco world-class porphyry deposit
(Mutschler et al., 1999), has reserves of 600 million tons with a grade of 0.60% Cu and
0.2 gr/ton Au (Coolbaugh et al, 1995). The porphyry copper deposit occurs in hornblende
andesite flows that are intruded by a granodiorite porphyry (Coolbaugh, et al, 1995) or a
monzodiorite porphyry (Echavarri-Perez and Rangin, 1978). This intrusive stock is
directly related to the Cu-Au mineralization. Based in field geology and petrography
studies, mineralization seems to be the product of a single intrusion event (Echavarri-
Perez and Rangin, 1978). Barren diabase dikes cut both units. All these rocks have been
affected by a greenschist facies regional metamorphism (Gastil, 1975) characterized by
chlorite-epidote-calcite-quartz. Locally amphibolites facies metamorphism is observed
(Echavarri-Perez and Rangin, 1978)
Detailed geological and petrographic descriptions from the El Arco-Calmalli area
were reported by Barthelmy (1975; 1979); Farias-Garcia (1978), and Echavarri-Perez and
Rangin, (1978). These studies indicate that El Arco deposit differs significantly from
other porphyry copper deposits in mainland Mexico and the Southwestern U.S. These
differences include the tectonic setting of formation (island arc), the nature of the
intrusions (silica poor intrusions) and the lack of a quartz-sericite (phyllic) hydrothermal
alteration. All these characteristics indicate that the El Arco deposit corresponds to a
diorite-type porphyry model (Hollister et al., 1975; Hollister and Seraphim, 1976;

155
Barthelmy, 1979) rather than the classic type (Lowell and Guilbert, 1970; Titley and
Beane, 1981; McMillan and Panteleyev, 1988).
Hydrothermal alteration shows that a prophylitic assemblage is more intensely
developed in the andesitic rocks at the periphery of the deposit, whereas a potassic
assemblage is centered at the core of the stock (Fig. 5.2b). Sodic-calcic alteration is also
present in the stock, and at the contact with the andesite. This alteration is represented by
oligoclase veins (An 26) and associated with quartz, epidote, calcite, and sphene
(Echavarri-Perez and Rangin, 1978). This type of alteration (sodic-calcic) has been
recognized in Yerington, Nevada (Jurassic porphyry Cu deposit) and was interpreted as
being the result from the flow of brines that are heated by the stock and as a consequence
of this, exchange alkalis with the wallrocks producing a strong sodium and calcium
metasomatism (Dilles et al, 2000). Sericitic and argillic alteration are absent in El Arco
(Echavarri-Perez and Rangin, 1978). Hydrothermal alteration decreases with distance
from the intrusion until is indistinguishable from the regional metamorphism.
The copper mineralization is present in veins and disseminated as chalcopyrite
with subordinate bornite-molybdenite-gold, and is restricted to the inner potassic
alteration, whereas magnetite is widespread. In the potassic alteration core, the
chalcopyrite:pyrite ratio is 1:1.4, whereas pyrite dominates over chalcopyrite in the outer
propylithic zone, reaching up to 9% in weight or a ratio of 14:1 (Echavarri-Perez and
Rangin, 1978).

156
5.3 ANALYTICAL PROCEDURES
5.3.1, U-Pb Systematics
A granodiorite sample from el Arco was collected (Figure 5.2b) for U-Pb zircon
analysis. About 10-15 kg of rock were crushed and milled. Heavy mineral concentrates
were separated from the sieve fraction smaller than 350 microns. Zircons were
concentrated using di-iodomethane heavy liquids and magnetic techniques. Inclusion-free
zircons, were handpicked under a binocular microscope, from the non-magnetic fraction.
About fifty zircons were mounted in epoxy and polished for U-Pb analysis.
The single zircons crystals were analyzed with a Micromass Isoprobe
multicollector ICP-MS equipped with 9 Faraday collectors, an axial Daly detector, and 4
ion-counting channels. The Isoprobe is equipped with an ArF Excimer laser, which has
an emission wavelength of 193 nm and which is used for laser ablation. The analyses
were conducted on 35 or 50 micron spots with an output energy of ~32 mJ and a
repetition rate of 8 Hz. Each analysis consisted of one 30-second integration on the
backgrounds (on peaks with no laser firing) and twenty 1-second integrations on peaks
with the laser firing. The depth of each ablation pit is ~15 microns. Total measurement
time was ~90 s per analysis.
The collector configuration allows for simultaneous measurement of 204Pb in an ion-
counting channel while 206Pb, 207Pb, 208Pb, 232Th, and 238U are measured with Faraday
detectors. All analyses were conducted in static mode. Inter-element fractionation was
monitored by analyzing fragments of SL-1, a large concordant zircon crystal from Sri
Lanka (SL-1) with a known (ID-TIMS) age of 564 ± 4 Ma (2σ) (Gehrels, unpublished

157
data). The reported ages for zircon grains are based on 206Pb/238U ratios because errors of
the 207Pb/235U and 206Pb/207Pb ratios are significantly greater. This is caused primarily to
the low intensity (commonly <1 mV) of the 207Pb signal from these young, low-U grains.
The 206Pb/238U ratios are corrected for common Pb by using the measured 206Pb/204Pb, a
common Pb composition (Stacey and Kramers, 1975), and an uncertainty of 1.0 on the
common 206Pb/204Pb.
5.3.2, Re-Os systematics
For Re-Os analyses, four molybdenite samples were selected from different areas
and mineral assemblages of the deposit (Figure 5.2b). About 25 to 50 mg of fine-grained
molybdenite was loaded in a Carius tube and dissolved with 8 ml of reverse aqua regia.
While the reagents, sample and spikes were still frozen, the Carius was sealed and left to
melt at room temperature. The tube was placed in an oven and heated to 240o C
overnight. The solution was processed in a two-stage distillation process for osmium
separation (Nagler and Frei, 1997). Osmium was further purified using microdistillation
techniques, (Birck et al, 1997), and loaded on platinum filaments with Ba(OH)2 to
enhance ionization. After osmium separation, the remaining acid solution was dried and
later dissolved in 0.1 HNO3. Rhenium was extracted and purified through a two-stage
column using AG1-X8 (100-200 mesh) resin and loaded on platinum filaments with
Ba(SO)4.
Samples were analyzed by negative thermal ion mass spectrometry (N-TIMS)
(Creaser et al, 1991) on a VG 54 mass spectrometer. Molybdenite ages were calculated

158
using a 187Re decay constant of 1.666x10⁻¹¹ year –1 (Smoliar et al. 1996). Uncertainties
are calculated using error propagation considering the error in the decay constant (0.31%),
errors in spike calibrations, analytical and weighting errors (~3%).
5.4, RESULTS
5.4.1, Re-Os Ages
Four analyses from four different molybdenite samples are reported in Table 5.1.
Sample locations are shown in Figure 2b. Total Re and 187 Os concentrations vary from
67-497 ppm and 115-855 ppb, respectively. All four Re-Os ages are consistent and
overlap within error. The ages range from 164.6-163.7 Ma and have a weighted average
of 164.1 ± 0.4 Ma (Fig. 5.3). This age corresponds to the time of molybdenite
crystallization and hence, is the age of the formation of the deposit.
5.4.2, U-Pb Ages
Twenty-one zircons from a single granodiorite sample were analyzed (Table 5.1).
Zircons separated from the granodiorite porphyry were studied optically under a
petrographic microscope and with SEM in back-scattered electrons (BSE) mode and
cathodoluminescence (CL) images. Zircons were grouped according to the zircon
morphology classification of Pupin (1980). The zircons from El Arco sample are
euhedral with prominent sharp pyramidal terminations, clear, transparent and no
detectable optical zoning, typical of igneous morphologies (Pupin, 1980). In addition,
their U/Th ratio of <3 indicated a magmatic origin (Rubatto, 2002). The sample yield an

159206Pb/238U age of 164.7 ± 6.5 Ma (n=21, MSWD=0.45; Figure 4a) which is interpreted as
the age of igneous crystallization of the El Arco stock. It is important to note that no
inherited components were recognized in this sample (Figure 5.4b).
5.5, DISCUSSION
5.5.1, Age of Mineralization
Previous geochronological studies on El Arco-Calmalli area reported Aptian-
Albian ages (~93.4 - 127 Ma), based on K-Ar determinations (Shafiqullah, 1974 in
Farias-Garcia, 1978; Instituto del Petroleo, 1974 in Farias-Garcia, 1978; Barthelmy,
1975). More recent studies using 40Ar-39Ar systematics on pyrite suggested an older age
of 138 ± 2.5 Ma, which was interpreted as the time when tiny K-bearing inclusions were
trapped by pyrite crystals (Lopez-Martinez, 2002). These same authors also reported a
whole rock 40Ar-39Ar age of 95.2 ± 0.8 Ma, from a low grade metamorphosed and
unmineralized diabasa dike crosscutting the El Arco porphyry intrusive stock. This age
was interpreted as the time of cooling after regional metamorphism (Fig. 5.5).
The new Re-Os and U-Pb data presented here provide strong evidence that a
Middle Jurassic (Callovian) magmatic event is responsible for the porphyry intrusion and
copper mineralization at El Arco. Furthermore, the consistence of Re-Os ages from four
different samples suggests that molybdenite mineralization occurred during a short period
of time (< 1Ma). The previously reported Albian K-Ar and Ar-Ar ages (Shafiqullah, 1974
in Farias-Garcia, 1978; Instituto del Petroleo, 1974 in Farias-Garcia, 1978; Barthelmy,
1975; Martinez-Lopez et al., 2002), do not reflect ages of primary crystallization and/or

160
mineralization at El Arco. The K-Ar ages probably reflect, the influence of metamorphic
overprinting, Ar loss and/or partly resetting of the K-Ar system, possibly associated to
the accretion of the oceanic arc terrane to the North American continent.
The new Re-Os and U-Pb ages for El Arco porphyry copper, properly reassigns
this deposit to the Middle Jurassic period, and not to the Cretaceous as previously thought
(Figure 5.5). The new age determination for El Arco has strong metallogenetic
implications because no Jurassic porphyry, epithermal or replacement-type deposits have
been reported in Mexico (Barton, 1996). This provides new insights for porphyry copper
exploration in the region.
5.5.2, Alisitos-El Arco Correlations
The El Arco-Calmalli area was previously correlated with the Alisitos Formation,
based on its erroneous Cretaceous age and arc related rock types. The Alisitos Formation
has an Albian age assigned by mollusk fossils (Allison, 1974) and volcanic and plutonic
U-Pb ages (Carrasco et al., 1995; Johnson, 1999; Wetmore et al., submitted). The new U-
Pb age for El Arco granodiorite does not support a correlation between El Arco-Calmalli
area and Alisitos Formation. However, the geochronological data suggest that the El
Arco-Calmalli area could be associated to the San Andres-Cedros volcano-plutonic
complex (Rangin, 1978). This complex is a Middle-Late Jurassic arc with granitoids that
intrude Jurassic volcanic and volcaniclastic strata that in turn overlies pillow lavas and
sedimentary rocks that cover a Triassic ophiolite sequence (Franciscan-like rocks)
(Rangin et al., 1981; Kimbrough and Moore, 2003).

161
More specifically, The Punta Norte Arc plutonic complex located at the northern
part of the Cedros Island, intruded the Choyal Formation volcanic arc assemblage
(Kimbrough and Moore, 2003). The stocks range in composition from hornblende-
pyroxene diorite to granodiorite (Kilmer, 1984). Intrusive bodies have an intense
hydrothermal alteration (albitic, potassic and propylitic), in addition to disseminated
copper and gold mineralization (Kilmer, 1984). The hydrothermal alteration and
mineralization style are similar to those described at El Arco area. Furthermore,
geochronological data from granodiorites at Punta Norte yielded 206U-238Pb ages that
range from 163.0 to 167.5 Ma (Kimbrough and Moore, 2003), in perfect agreement with
the new ages determined from the El Arco porphyry copper deposit. However,
stratigraphic and provenance studies are required in order to properly establish a coherent
correlation between El Arco-Calmalli area, Cedros Island and the San Andres region.
5.5.3, Evidence of Jurassic Magmatism
Postdating the Permio-Triassic Sonoma Orogeny, an early Mesozoic, west-facing
Andean Type arc was constructed along the western margin of North America (Dilles and
Wright, 1988). This Jurassic magmatic arc, which extends from California to Sonora
(Anderson and Silver, 1978; Tosdal et al., 1989), was the result of the subduction of the
Kula plate under the North America plate (Brass et al., 1983). In Mexico, this arc has
been identified as a belt with a NW-SE orientation and extending from Sonoita at the
north to the Cucurpe region in central Sonora (Rangin, 1978). This Jurassic arc is
manifested by volcanic and volcanoclastic rocks of andesitic to rhyolitic composition,

162
metamorphosed to greenschist facies and with occasional biotite granite porphyry
intrusions (Perez-Segura and Echavarri-Perez, 1981, Nourse, 2001) with ages that range
from 165-175 Ma (Anderson and Silver, 1978; Stewart et al, 1988). In the southernmost
area, the Nazas Formation, in the Zacatecas state, has been proposed as part of the
Jurassic Magmatic Arc (Jones et al, 1990, Jones et al, 1995). In addition, several
intrusives of Early to Middle Jurassic age (U-Pb ages of 163 to 200 Ma) have been
reported at the Bisbee and Courtland-Gleeson porphyry copper districts. This suggests
that at least part of the arc remained static relative to its associated trench during the
Early- Middle Jurassic (Lang, 2001) and later shifted to the Pacific coast during the Late
Jurassic (Coney and Reynolds, 1977; Damon et al. 1983). This belt represents either an
inland arc or a continental arc.
On the other hand, Jurassic magmatic island arc activity has been recognized in
Punta Norte in Cedros Island (~166 Ma). This, in addition to the island arc assemblages
and oceanic island arc isotope signatures of the El Arco-Calmalli (Weber and Lopez-
Martinez, submitted), and our geochronological data suggests the presence of two
magmatic arcs (oceanic - Cedros-El Arco, and continental, from Nevada, USA to Nazas,
Mexico) acting at the same time during the middle Jurassic (Fig. 5.6). However, the
position of the oceanic arc with respect to the North America remains unknown (Busby et
al, 1988; Schmidt et al, 2002). This continental-oceanic arc model has been proposed for
the early Cretaceous for the Baja California Peninsula but not for the Middle Jurassic
(Figure 2A; Johnson et al., 1999; Wetmore, et al., 2003).

163
I-Type, S-Type and transitional I-S type gneissic granites of middle Jurassic age
(206Pb/238U in zircons, 161-170 Ma) have been recognized in San Diego southern
California (Todd and Shaw, 1985; Shaw et al, 2003), which have a Precambrian
inherited component (Gastil and Girty, 1993). In the Sierra San Pedro Martir North of El
Arco area, an orthogneiss unit yield an U-Pb age of 164.4 ± 1.2 Ma with a Precambrian
inherited component (Schmidt 2000). Similar Jurassic–Cretaceous magmatism,
deformation structures, metamorphic geobarometry have been described in both areas
(Schmidt and Paterson, 2002; Shaw et al, 2003). In addition, The Agua Caliente
tourmaline-bearing biotite tonalite of Baja California has an age of 164 ± 2.3 Ma
(Schmidt and Paterson, 2002). These ages together with el Arco, suggest a Jurassic
intrusive belt extending along and outboard the continental border of North America
(Shaw et al, 2003). However, in spite of the similar Jurassic age to the areas mentioned
above, the absence of inherited zircons components (xenocrysts) in the El Arco
granodiorite (n=21) and granitoids of Punta Norte in Isla Cedros area, reflect the lack of
continental derived material in the basement. This is in agreement with data reported by
Weber and Lopez-Martinez (submitted), suggesting that El Arco deposit was formed in
an outboard island arc terrane. Initial epsilon Nd values of >5, Initial 87Sr/86Sr ratios of
<0.704, and lead isotopes that come from a source with an average µ value of 9.4,
indicate that the magmas of the El Arco porphyry and host rocks evolved from a
moderately depleted mantle source reservoir without significant influence of the
continental crust (Weber and Lopez, submitted). All these data support the tectonic model

164
of an intra-oceanic arc-ophiolite system during the Early-Middle Jurassic (Busby et al,
1998, Schmidt et al, 2002).
5.5.4, Terrane limit between El Arco-Guerrero Negro Transect?
Based on geological studies and our new geochronological data, the El Arco-
Calmalli area represents a Middle Jurassic oceanic arc sequence whose basement
comprises ophiolitic rocks of Middle Jurassic age or older. These ophiolites have been
interpreted as the roots of the Mid-Cretaceous Alisitos Formation or as an extension of
the Triassic-Jurassic ophiolites of the Vizcaino Peninsula (Rangin, 1981). On the other
hand, Radelli (1989) had assigned the ophiolite sequence to be part of the La Olvidada
sequence, which are Cretaceous meta-sediment and meta-volcanic rocks, with unknown
basement age, located at the north of El Arco and are part of a marginal sea. Two of these
three different interpretation, use Mid-Cretaceous ages to assign possible correlations;
since the El Arco area has a Middle Jurassic age, both interpretations can be discarded,
and thus the interpretation that we support is that the ophiolitic rocks and the island arc
sequences in El Arco-Calmalli area are an extension of the Middle-Late Jurassic
volcanic-plutonic (San Andres-Cedros volcanic arc) and late Triassic ophiolites of
Vizcaino peninsula and adjacent Cedros Island.
However, a tectono-stratigraphic boundary between the Alisitos and Vizcaino
Terranes (Campa and Coney, 1983) or Cochimi and Yuma Terranes (Sedlock et al,
1993), has been recognized along the transect between El Arco and the Guerrero Negro

165
area (Fig. 5.1b). The criteria used by Campa and Coney (1983) to determine tectono-
stratigraphic limits are abrupt changes in age and/or lithologies, and state that these
boundaries between terranes are faults or suspected faults. Campa and Coney (1983)
highlighted two main differences between the Alisitos Terrane and the Vizcaino Terrane,
which are: age (Aptian-Albian versus Triassic-Jurassic) and stratigraphic sequences
(partially continental affinities versus oceanic affinities). However, the boundary between
these two terranes is not exposed, and its existence was inferred based on resetted K-Ar
ages (Campa and Coney, 1983) and on the interpretation of gravity anomalies (Sedlock et
al., 1993), which in the absence of other independent data, might not be uniquely
constrain the existence of this boundary.
Since the age and stratigraphic affinities of El Arco-Calmalli area are similar to
those at Cedros Island and Vizcaino Peninsula, and the interpretation of a major fault
zone is inferred (Sedlock et al., 1993), we questione the existence of a tectono-
stratigraphic limit between within this transect.

166
5.6, SUMMARY
El Arco porphyry copper deposit has a Middle Jurassic crystallization age (U-Pb) of
164.7 ± 6.7 Ma and mineralization age (Re-Os) 164.1 ± 0.41 Ma.
El Arco-Calmalli area could be more properly associated to San Andres-Cedros
volcanic-plutonic complex (~166 Ma) instead that of the Alisitos Formation. This
indicates an alloctonous or distinct origin (oceanic terrane) with respect to the Cretaceous
Alisitos arc which was accreted in the Cretaceous (~98-110Ma). Therefore, the proposed
terrane limit between the Cochimi-Yuma or Vizcaino-Alisitos Terrane in the transect
between Vizcaino-El Arco area is not required.
The presence of the Continental Jurassic magmatic arc in mainland (Tosdal et al.,
1989) in addition to the El Arco-Calmalli (San Andres-Cedros) volcanic–plutonic
complex suggest the presence of two independent arcs during the middle Jurassic
evolving at same time (one continental and one oceanic), where the distance between
both arcs is unknown.

167
Figure 5.1.a) Geographic overview of northwestern Mexico, showing the location of El Arco porphyry copper deposit (big start), also circles represent the location of other mainland porphyry copper deposits from mainland Mexico and Southern Arizona (after Damon et al., 1983; Titley and Anthony, 1989). Dashed lines indicate boundaries: (1) Seri, (2) Yuma, and (3) Cochimi terrane (Sedlock et al., 1993). Small starts CI= Cedros Island, IN= Inguaran. B) Simplified geological map of central Baja California modified after Martin-Barajas and Delgado-Argote (1996) showing Pre-Cenozoic rocks and El Arco location.

168
Figure 5.2. a) Simplified geologic map of El Arco-Calmalli area, modified from Barthelmy, 1975; Echavarri-Perez and Rangin, 1978. b) Hydrothermal alteration map from El Arco porphyry copper deposit and sample location modified from Barthelmy, 1975; Echavarri-Perez and Rangin, 1978; Coolbaugh et al., 1995.
13
0°3
0’W
13
0°2
5’W
13
0°2
0’W
28°00’N
28°05’N
28°10’N
El Cañon
Calmalli
Pozo Alemán
El Arco
Q
Te
rtia
ryM
eso
zo
ic
Alluvium
Conglomeraticsandstone
Volcanic rocks
Sandstone
Ultramafic rocks
Schist, phyllite
Foliated vocani-clastic rocks
Massive andesite
Fault
Anticline
Syncline
Foliation
El Arco porphyry(mostly covered)
Plutonic rocks(granite-diorite)
Volcano-sedimentary rocks
N0 5km
3102. mN000
EL ARCO
12R 264. mE000 265
3103
131
275
279
Shaft
277
N
Limit of Cu-mineralization
Alteration type
Propylitic
Potassic and Sodic-calcic
Potassic
Silicatation
Porphyry intrusion
Re-Os Sample EAD #
1000 m
b
a
U-Pb Sample

169
Figure 5.3. Weighted mean of all Re/Os molybdenite age data collected from 4 veins in this study. Two sigma uncertainties.
162.4
162.8
163.2
163.6
164.0
164.4
164.8
165.2
165.6
Mean = 164.1 0.4 MaMSWD = 0.79
+_

170
Figure 5.4.Concordia diagram showing the absence of inherited components as well as interpreted crystallization 206 Pb/ 238 U age of the individual rock.
210
200
190
180
170
160
150
140
Mean = 164.7 4.4Age = 164.7 9.5
MSWD = 0.45 ( )s
+_
+_
0.035
0.032
0.038
0.024
0.020
0.016
0.0 0.2 0.4
Pb/
U2
06
23
8
Pb/ U207 235

171
Figure 5.5.- Diagram showing geochronological ages from El Arco porphyry copper deposit. Solid diamonds are K-Ar ages from biotite and whole rock, solid squares are Ar-Ar ages from pyrite (older) and whole rock (younger), solid triangles are Re-Os ages from molybdenite and solid circle is U-Pb in zircons. Error bars are 2σ. Light gray shade represents mineralization duration. (1) Barthelmy, 1975 (2) Shafiqullah, 1974 in Garcia-Farias, 1974 (3) Instituto del Petroleo, 1974 in Garcia-Farias, 1974; (4) Lopez-Martinez et al., 2002.

172
Figure 5.6. Schematic cross section of the collision of exotic island arc. Modified after Schmidt et al., 2002.

173
Table 5.1.- LA-MC-ICPMS U-Pb zircon data
Concentration
Isotopic Ratio Apparent ages
Sample
U (ppm)
Th (ppm)
U/Th
U206Pbm 204 Pbc
207 Pb 235 U ±%
206 Pb 238 U ±% Error
corr 206Pb 207 Pb ±%
206Pb 238U ±Ma
207 Pb 235 U ±Ma
206 Pb 207 U ±Ma
EAS-1 101 49 2 225 0.155 60.43 0.0264 8.28 0.14 23.48 59.86 168.3 14.1 146.5 91.1 NA NA EAS-2 260 151 1.7 956 0.182 23.52 0.0247 4.46 0.19 18.77 23.09 157.5 7.1 169.4 42.5 340 261 EAS-3 260 148 1.8 868 0.227 27.89 0.0269 3.29 0.12 16.39 27.69 171.4 5.7 207.4 62.2 639 298 EAS-4 93 18 5.2 329 0.276 41.2 0.0254 5.89 0.14 12.69 40.78 161.7 9.6 247.5 109.4 1167 404 EAS-7 72 29 2.5 301 0.232 53.57 0.0271 8.97 0.17 16.11 52.82 172.6 15.7 212 119 676 565 EAS-8 112 37 3 464 0.163 45.47 0.0254 5.25 0.12 21.48 45.17 162.1 8.6 153.7 72.8 26 542 EAS-9 114 74 1.5 425 0.138 52.32 0.0248 7.18 0.14 24.87 51.83 158.3 11.5 131.1 70.7 NA NA EAS-10 85 31 2.7 385 0.168 47.47 0.0254 6.67 0.14 20.89 47.00 162.2 11 157.8 78 92 557 EAS-11 103 47 2.2 424 0.204 35.63 0.0244 5.19 0.15 16.49 35.25 155.6 8.2 188.8 71.4 627 380 EAS-12 128 70 1.8 553 0.176 38.68 0.0247 6.95 0.18 19.38 38.05 157.5 11.1 164.6 66.9 267 436 EAS-13 288 189 1.5 1281 0.208 20.45 0.0264 3.66 0.18 17.88 20.12 168.3 6.2 188.5 41.5 449 224 EAS-14 174 88 2 547 0.228 36.14 0.0297 6.78 0.19 18.02 35.49 189.2 13 208.4 80.3 431 395 EAS-15 99 43 2.3 362 0.165 56.84 0.0259 8.52 0.15 21.67 56.2 165.4 14.3 155.4 91.2 5 677 EAS-16 147 61 2.4 581 0.139 48.74 0.0263 7.05 0.14 26.13 48.23 167.3 11.9 131.9 66.4 NA NA EAS-17 141 76 1.9 567 0.117 46.38 0.0249 8.07 0.17 29.55 45.67 159.1 13 112 53.5 NA NA EAS-18 181 105 1.7 699 0.140 34.45 0.0255 7.08 0.21 25.19 33.71 162.9 11.7 133.1 47.9 NA NA EAS-19 143 77 1.8 668 0.178 35.86 0.0258 10.45 0.29 20.00 34.3 164.5 17.4 166.5 62.9 194 399 EAS-20 90 41 2.2 464 0.152 50.95 0.0258 10.47 0.21 23.46 49.86 164.2 17.4 143.3 75.5 NA NA EAS-21 159 82 1.9 607 0.182 33.13 0.0258 10.89 0.33 19.52 31.29 164.3 18.1 170 59.5 250 360 EAS-23 295 225 1.3 801 0.158 32.58 0.0260 9.45 0.29 22.68 31.18 165.4 15.8 149 51 NA NA EAS-25 481 786 0.6 1077 0.157 24.59 0.0260 9.55 0.39 22.83 22.66 165.7 16 148.3 38.5 NA NA
173

174
Table 5.2. Re-Os molybdenite ages
Sample
Total Re
187 Re (ppm)
187 Os (ppb)
Re-Os age*
EAD-277 497.1 312.5 855.2 164.6± 0.82 EAD-131 430.7 270.7 731.1 163.8 ±0.81 EAD-275 66.9 42.1 115.3 164.2± 0.82 EAD-279 277.6 174.5 469.4 164.0± 0.82
Weighted Mean 164.1 ± 0.41 * Uncertainties in age are calculated using error propagation and include error in the Re decay constant (0.31%), 185Re and 190Os spike calibration (0.08 and 0.15, respectively) and analytical errors.

175
REFERENCES
Allison, E.C., 1974. The type Alisitos Formation (Cretaceous, Aptian-Albian) of Baja California and its bivalve fauna. In: G. Gastil and J. Lillegraven (Eds), Geology of peninsular California. American Association of Petroleum Geologists Pacific Section, Los Angeles, California, pp. 20-59.
Almazan-Vazquez, E., 1988. Marco paleosedimentario y geodinamico de la formacion Alisitos en la peninsula de Baja California. UNAM Instituto de Geologia Revista, 7(1): 41-51.
Almazan-Vazquez, E. and Palafox-Reyes, J., 2000. Secuencia Samitica del Jurasico Tardio con amonitas del Genero Subdichotomoceras (Kimmeridgiano) expuesta al oriente de Arivechi, Sonora. In: T. Calmus and E. Perez-Segura (Eds), Cuarta reunion sobre la geologia del Noroeste de Mexico y areas adyacentes. UNAM, Hermosillo., pp. 1-2.
Ahmad, S. N., A. W. Rose. 1980. Fluid inclusions in porphyry and skarn ore at Santa Rita, New Mexico. Economic Geology, 75: 229-250.
Anderson, J.L. and Bender, E., 1989. Nature and origin of Proterozoic A-Type granitic magmatism in the southwestern United States of America. Lithos, 23: 19-52.
Anderson, T.H. and Silver, L.T., 1977. Isotope ages of Granitic plutons, Cananea, Sonora. Economic Geology, 72(5): 827-836
Anderson, T.H., and Silver, L.T., 1978. Jurassic magmatism in Sonora, Mexico., Geological Society of America, Abstract with Program., pp. 359.
Anderson, T.H., and Silver, L.T., 1981. An overview of Precambrian rocks in Sonora. UNAM Instituto de Geologia Revista, 5(2): 131-139.
Anthony, E.Y. and Titley, S.R., 1988. Progressive mixing of isotopic reservoirs during magma genesis at the Sierrita porphyry copper deposit, Arizona; inverse solutions. Geochimica et Cosmochimica Acta, 52: 2235-2249.
Arribas, A.J., Hedenquist, J.W., Itaya, T., Okeda, T., Concepcion, R.A. and Garcia, J.S., Jr., 1995. Contemporaneous formation of adjacent porphyry and epithermal Cu-Au deposit over 300 ka in northern Luzon, Philippines. Geology, 23: 337-340.
Audetat, A., Guenther, D., Heinrich, C. A., 1998. Formation of a magmatic-hydrothermal ore deposit; insights with LA-ICP-MS analysis of fluid inclusions. Science, 279: 2091-2094.

176
Ballard, J.R., Palin, J.M., William, I.S., Campbell, I.H. and Faunes, A., 2001. Two ages of porphyry intrusions resolved for the supergiant Chuquicamata copper deposit of northern Chile by ELA-ICP-MS and SHRIMP. Geology, 29(5): 383-386.
Banks, N.G., 1982. Sulfur and copper in magma and rocks, Ray porphyry deposit, Pinal County, Az. In: R. Titley S (Ed), Advances in geology of the Porphyry Copper Deposits, Southwestern North America. University of Arizona Press, Tucson, pp. 227-257.
Barra, F., 2003. A Re-Os study on sulfide minerals from the Bagdad porphyry Cu-Mo deposit, northern Arizona, USA. Mineralium Deposita, 38: 585-596.
Barra, F., Ruiz, J., Valencia, V.A., Ochoa-Landin, L., Chesley, J.T. and Zurcher, L., In review. Laramide porphyry Cu-Mo minralization in northern Mexico: Age constraints from Re-Os geochronology in molybdenites. Economic Geology.
Barthelmy, D.A., 1975. Geology of the El Arco-Calmalli area, Baja California, Mexico. Master's Thesis, San Diego State University, San Diego.
Barthelmy, D.A., 1979. Regional geology of the El Arco porphyry copper deposit, Baja California. In: P.L. Abbott and R.G. Gastil (Eds), Baja California geology, field guides and papers. Geological Society of America, Boulder.
Barton, M., 1996. Granitic magmatism and metallogeny of southwestern North America. Transactions of the Royal Society of Edinburgh: Earth Sciences, 87: 261-280.
Basset, K. N., and Busby, C., in review. Sequence, stratigraphy,structure and tectonic setting of an intra-arc strike slip –basin (Bisbee basin, southern Arizona). Geological Society of America Bulletin.
Bateman, A. M., 1950, Economic mineral deposits. New York, John Wiley and Sons, 916p.
Beane, R., 1982. Hydrothermal alteration in silicate rocks. In: S. Titley (Ed), Advances in geology of the porphyry copper deposits Southwestern North America. The university of Arizona press, Tucson, pp. 117-137.
Beane, R.E. and Bodnar, R. J., 1995. Hydrothermal fluids and hydrothermal alteration in porphyry copper deposits. In: F.W. Pierce and J.G. Bolm (Eds), Porphyry copper deposits of the American Cordillera. Arizona Geological Society, Tucson, pp. 83-93.
Beane, R.E. and Titley, S.R., 1981. Porphyry copper deposits, Part II, Hydrothermal alteration and mineralization. In: B. Skinner (Ed), Economic Geology, 75th Anniversary Volume. The Economic Geology Publishing Company, New Heaven, pp. 235-269.

177
Berchenbriter, D.K., 1976. The Geology of La Caridad Fault, Sonora, Mexico., University of Iowa, Iowa, 127 pp.
Bertens, A., Deckart, K. and Gonzalez, A., 2003. Geocronologia U-Pb, Re-Os y Ar-Ar del porfido Cu-Mo Los Pelambres, Chile Central., X Congreso Geologico Chileno. (ext. abs.), Concepcion, Chile.
Bilodeau, W., 1978. The Glance Conglomerate, a lower Cretaceous syntectonic deposit in southeastern Arizona. In: J. Callender, Wilt, J., Clemons, R. (Ed), Land of Cochise. New Mexico Geol. Society, 29th Field Conference.
Birck, J.L., RoyBarman, M. and Campas, F., 1997. Re-Os measurements at the femtomole level in natural samples. Geostandard Newsletter, 20: 19-27.
Blodgett, R., Moore, T. and Gray, F., 2002. Stratigraphy and paleontology of Lower Permian Rocks north of Cananea, northern Sonora, Mexico. Journal of South American Earth Sciences, 15: 481-495.
Bodnar, R. J., 2003, Interpretation of Data from aqueous-electrolyte fluid inclusions. In: L. Samson, A. Anderson, D. Marshall (Eds) Fluid Inclusions, analysis and interpretation. Mineralogical Asociation of Canada, Vancouver, pp. 81-100.
Bodnar, R. J., and Beane, R. E., 1980, Temporal and spatial variations in hydrothermal fluid characteristics during vein filling in preore cover overlying deeply porphyry copper type mineralization at Red Mountain, Arizona. Economic Geology, 75: 876-893.
Bonini, J., 1994. 40 Ar/ 39 Ar Geochronology of accreted terranes from southwestern Baja California Sur, Mexico. MSc Thesis, University of Arizona, Tucson, 52 pp.
Bowman, J.R., Perry, W.T., Kropp, W.P. and Kruer, S.A., 1987. Chemical and isotopic evolution of the hydrothermal solutions at Bingham, Utah. Economic Geology, 82: 395-428.
Brass, G.W., Mattes, B.W., Reid, R.P. and Withman, J.M., 1983. Mesozoic interaction of the Kula Plate and the western margin of North America. Tectonophysics, 99: 231-239
Burnham, C.W., 1979. Magmas and hydrothermal fluids. In: H.L. Barnes (Ed), Geochemistry of hydrothermal ore deposits. John Wiley & Sons, New York, pp. 71-136..
Burnham, C.W., 1997. Magmas and hydrothermal fluids. In: H.L. Barnes (Ed), Geochemistry of hydrothermal ore deposits. John Wiley & Sons, New York, pp. 63-123

178
Busby, C., Smith, D., Morris, W. and Fackler-Adams, B., 1998. Evolutionary model for convergent margins facing large ocean basins: Mesozoic Baja California, Mexico. Geology, 26(3): 227-230.
Bushnell, S.E., 1988. Mineralization at Cananea, Sonora, Mexico, and the paragenesis and zoning of breccia pipes in quartzofeldespathic rocks. Economic Geology, 83: 1760-1981.
Calagari, A.A., 2003. Stable isotope (S, O, H and C) studies of the phyllic and potassic-phyllic alteration zones of the porphyry copper deposit at Sungun, East Azarbaidjan, Iran. Journal of Asian Earth Sciences, 21: 767-780.
Calagari, A.A., 2004. Fluid inclusions studies in quartz veinlets in the porphyry copper deposit at Sungun, East-Azarbaidjan, Iran. Journal of Asian Earth Sciences, 23: 179-189.
Campa, M. and Coney, P.J., 1983. Tectono-stratigraphic terranes and mineral resource distribution in Mexico. Canadian Journal of Earth Sciences, 20: 1040-1051.
Carrasco, A.P., Kimbrough, D.L. and Herzig, C., 1995. Cretaceous arc volcanic strata of the western Peninsular Ranges: Comparison of the Santiago Peak Volcanics and Alisitos group, Abstracts of Peninsular Geological Society International Meeting on Geology of the Baja CaliforniaPeninsula, pp. 19.
Carreon-Pallares, N., 2002. Structure and tectonic history of the Milpillas porphyry copper district, Sonora, Mexico. M.S. Thesis, University of Utah, 72 pp.
Cathles, L.M., Erendi, A.H.J. and Barrie, T., 1997. How long can a hydrothermal system sustained by a single event? Economic Geology, 92: 766-771.
Chacon-Baca, E., Beraldi-Campesi, H., Cevallos-Ferriz, S.R.S., Knoll, A. H., Golubic, S., 2002. 70 Ma nonmarine diatoms from northern Mexico. Geology, 30: 279-281
Chiapa, C. and Thoms, J.A., 1971. Bosquejo geologico del distrito minero d Nacozari., Asociacion de Ingenierio de Minas, Metalurgia y Geologos de Mexico, IX Convencion Nacional., pp. 1-14.
Chiba, H., Kusakabe, M., Hirano, S., Matsuo, S., Somiya, S., 1981. Oxygen isotope fractionation factors between anhydrite and water from 100 to 550oC. Earth and Planetary Sciences Letters, 53: 55-62.
Chivas, A. R., O’Neill, J. R., and Katchan, G., 1984, Uplift and formation of some Malesian porphyry copper deposits: stable isotope evidence. Earth and Planetary sciences letters, 68: 130-145.

179
Clark, A.H., Archibald, D.A., Lee, A.W., Farrar, E. and Hodgson, C.J., 1998. Laser probe 40Ar/39Ar ages of early- and late- stage alteration assemblages, Rosario porphyry copper-molybdenum deposit, Collahuasi district, I region, Chile. Economic Geology, 93: 326-337.
Clayton, R.N., 1955. Variation in oxygen isotope abundances in rock minerals Ph.D. Thesis. California Institute of Technology, Pasadena, pp 85.
Clayton, R. N., Mayeda, T. K., 1963. The use of bromine pentlafluride in the extraction of oxygen from oxides and silicates for isotopic analysis. Geochimica et Cosmochimica Acta 27: 43-52.
Clayton, R.N., O'Neil, J.R. and Mayeda, T.K., 1972. Oxygen isotope exchange between quartz and water. Journal of Geophysical Research, 77: 3057-3067.
Coney, P.J., 1976. Plate tectonics and the Laramide orogeny, New Mexico Geological Society Special Publication 6. New Mexico Geological Society, pp. 5-10.
Coney, P.J., and Campa M. F., 1987. Lithotectonic terrane map of Mexico. US Geological Survey Miscellaneous Field Studies.
Coney, P.J., and Reynolds, S. J., 1977. Cordilleran Benioff zones. Nature, 270: 403-406.
Coochey, D.W. and Eckman, P., 1978. Geology of La Verde copper deposits, Michoacan, Mexico. In: A.G. Society (Ed), Procedding of the porphyry copper simposium. Arizona Geological Society Digest XI, Tucson.
Coolbaugh, D.F., Osoria-Hernandez, A., Echevarri-Perez, A. and Martinez-Mueller, R., 1995. El Arco porhyry copper deposit, Baja California, Mexico. In: F.W. Pierce and J.G. Bolm (Eds), Porphyry copper deposits of the American Cordillera. Arizona Geological Society, Tucson, pp. 525-534.
Cornejo, P., Tosdal, R.M., Mpodozis, C., Tomlinson, A.J., Rivera, O. and Fanning, M., 1997. El Salvador, Chile porphyry copper deposit revisited: Geologic and geochronologic framework. International Geology reviews, 39: 22-54.
Creaser, R.A., Papanastassiou, D.A. and Wasserburg, G., 1991. Negative thermal ion mass spectometer of Os, Re and Ir. Geochimica et Cosmochimica Acta, 55: 397-401.
Damon, P., Mauger, R.L. and Bikerman, M., 1964. K-Ar dating of Laramide plutonic and volcanic rocks within the Basin Province of Arizona and Sonora., 12th International Geological Congress, India, pp. 45-55.

180
Damon, P. and Mauger, R.L., 1966. Epeirogeny-orogeny viewed from the Basin and Range province., Transaction of the Society of Mining Engineers of AIME, pp. 99-112.
Damon, P.E., 1968. Potassium-argon dating of igneous and metamorphic rocls with applications to the Basin and Ranges of Arizona and Sonora. In: E.I. Hamilton and R.M. Farquar (Eds), Radiometric dating for geologist. Interscience, New York, pp. 1.
Damon, P., Shafiqullah, M., Clark, K.,1981. Evolucion de los arcos magmaticos en Mexico y su relacion con la metalogenesis. UNAM Instituto de Geologia Revista, 5(2): 223-228.
Damon, P., Shafiqullah, M., Clark, K., 1983. Geochronology of the porphyry copper deposits and related mineralization of Mexico. Canadian Journal of Earth Sciences, 20(6): 1052-1071.
De la Garza, V., Noguez, B. and Carreon-Pallares, N., 2003. Geology, mineralization and emplacement of the Milpillas secondary-enriched porphyry copper deposit, Sonora, Mexico., XX Convencion internacional AIMMGM. AIMMGM, Acapulco, Guerrero, Mexico.
Dickinson, W.R., 1981. Plate tectonic evolution of the southern Cordillera. In: W.R. Dickinson and W.D. Payne (Eds), Relations of Tectonics to Ore Deposith in the Southern Cordillera. Arizona Geological Society Digest, Tucson, pp. 113-135.
Dickinson, W.R., and Lawton, T., 2001. Carboniferous to Cretaceous assembly and fragmentation of Mexico. Geological Society of America., 113: 1142-1160.
Dickinson, W.R., and Lawton, T., 2001. Tectonic setting and sandstone petrofacies of the Bisbee basin (USA-Mexico). Journal of South American Earth Sciences, 14: 475-504.
Dickinson, W.R. and Gehrels, G.E., 2003. U–Pb ages of detrital zircons from Permian and Jurassic eolian sandstones of the Colorado Plateau, USA: paleogeographic implications. Sedimentary Geology, 163: 29-66.
Dilles, J. and Wright, J., 1988. The Chronology of early Mesizoic arc magmatism in the Yerington district of western Nevada and its regional implications. Geological Society of America Bulletin, 100: 644-652.
Dilles, J.H. and Einaudi, M.T., 1992. Wall-rock alteration and hydrothermal flow paths about the Ann-Mason porphyry copper deposit, Nevada- A 6 km vertical reconstruction. Economic Geology, 87: 1963-2001.

181
Dilles, J.H., Solomon, G.C., Taylor, H.P. and Einaudi, M.T., 1992. Oxygen and hidrogen isotope characteristics of the Ann Masson porphyry copper deposit, Yerington district, Nevada. Economic Geology, 87: 44-63.
Eastoe, C.J., 1978. A fluid of the Panguna porphyry of the Panguna porphyry copper deposit, Bougainville, Papua New Guinea. Economic Geology, 73: 721-748.
Eastoe, C. J., 1983. Sulfur isotope data and nature of the hydrothermal systems at Panguna and Frieda porphyry copper deposits, Pupua New Guinea. Economic Geology, 78:201-213.
Echavarri, A., 1971. Petrography and Alteration at the La Caridad Deposit, Nacozari, Sonora, Mexico., 9th AIMMGM metting, Hermosillo, pp. 1-33.
Echavarri-Perez, A. and Rangin, C., 1978. El Yacimiento cuprifero del Arco, B. C., su ambiente geologico y sus caracteristicas de alteracion y mineralizacion. Boletin del Departamento de Geologia Uni-Son, 1(1): 1-18.
Emmons, S.F., 1910. Cananea mining district of Sonora, Mexico. Economic Geology, 5: 312-356.
Enders, M.S., 2000. Evolution of supergene enrichment in the Morenci porphyry copper deposit, Greenle County, Arizona. Ph.D. Thesis, University of Arizona, Tucson, 517 pp.
Esquivias-Flores, J., 1997. Fluid Inclusion, geochemistry, and petrology of intrusions, related to porphyry base metal deposits in northern Sonora, Mex., Geological Society of America, Abstract with Programs, pp. A-62.
Einaudi, M.T., Hedenquist, J.W. and Inan, E.E., 2003. Sulfidation state of hydrothermal fluids. In: S.F. Simmon (Ed).
Farias-Garcia, R., 1978. Geophysical exploration of the El Arco-Calmalli mining district, Baja California, Mexico. Master's Thesis, University of Arizona, Tucson, Az., 59 pp.
Field, C.W. and Gustafson, L.B., 1976. Sulfur isotopes in the porphyry copper deposits at El Salvador. Economic Geology, 71: 1533-1548.
Field, C.W., Zhang, L., Dilles, J.H., Rye, D.M. and Reed, M.H., in press. Sulfur and oxygen isotopic record in sulfate and sulfide minerals of early, deep, pre-main stage porphyry Cu-Mo and late main stage base-metal mineral deposits, Butte district, Montana. Chemical Geology.
Friedman, I., Gleason, J. D., 1973. Notes on the bromine pentaflouride technique of oxygen extraction. Journal of research of the U. S. Geological Survey 2: 7-12.

182
Gans, P.B., 1997. Large-magnitude Oligo-Miocene extension in southern Sonora: Implications for the tectonic evolution of northwest Mexico. Tectonics, 16(3): 388-408.
Gastil, G. and Girty, M.S., 1993. A reconnaissance U-Pb study of detrital zircon in sandstones of peninsular California and adjacent areas. In: G. Gastil and R.H. Miller (Eds), The prebatholitic stratigraphy of peninsular California. Geological Society of America, Boulder, pp. 135-144.
Gastil, G. and Miller, R.H., 1984. Prebatholithic paleogeography of peninsular California and adjacent Mexico. In: P.L. Abbott (Ed), Field Trip Guidebook - Pacific Section, Society of Economic Paleontologists and Mineralogists. Society of Economic Paleontologists and Mineralogists, Pacific Section, Los Angeles, CA, pp. 9-16.
Gastil, G., Wracher, M., Strand, G., Kear, L., Eley, D., Chapman, D. and Anderson, C., 1992. The tectonic history of the southwestern United States and Sonora, Mexico, during the past 100 M. Y. Tectonics, 5: 990-997.
Gastil, R.G., 1993. Prebatholithic history of Peninsular California. In: R.G. Gastil and R.H. Miller (Eds), The Prebatholithic stratigraphy of peninsular California. Geological Society of America Special Paper 279, Boulder, Colorado, pp. 145-156.
Gastil, R.G., Morgan, G.J. and Krummenacher, D., 1981. The tectonic history of peninsular California and adjacent Mexico. In: W.G. Ernst (Ed), The geotectonic evolution of Baja California. Prentice-Hall, Englewood Cliffs, New Jersey, pp. 284-306.
Gastil, R.G., Phillips, R. and Allison, E., 1975. Reconnaissance geology of the State of Baja California. Geological Society of America Memoir 140, Boulder, 170 pp.
Gat, J. R., 1981. Isotopic fractionation, In J.R. Gat, R.Gionfantini (Eds), Stable Isotope Hydrology. International Atomic Energy Agency. Vienna, pp. 21-32.
Giggenbach, W.F., 1992. Isotopic shifts in waters from geothermal and volcanic systems along convergent plate boundaries and their origin. Earth and Planetary Science Letters, 113: 495-510.
Gonzalez-Leon, C. M., 1986. Estratigrafía del Paleozoico de la Sierra del Tule, noreste de Sonora. Revista Mexicana de Ciencias Geológicas, 6(2): 117-135.
Gonzalez-Leon, C. M., 1994. Stratigraphy, depositional environments, and origin of the Cabullona basin, Northeastern Sonora, Mexico. Ph. D. Thesis, University of Arizona, Tucson, Az., 144 pp

183
Grijalva-Noriega, F. and Roldan-Quinatana, J., 1998. An overview of the Cenozoic tectonics and magmatic evolution of Sonora, northwestern Mexico. Revista Mexicana de Ciencias Geologicas, 15(2): 145-156.
Guilbert, J. M., and Park, C. F., 1986, The Geology of Ore Deposits: New York, W. H. Freeman, 985p.
Gustafson, L.B., 2000. Milpillas Geologic Mode, Internal Report to Servicios Industriales Peñoles, SA de CV.
Gustafson, L.B. and Hunt, J.P., 1975. The porphyry copper deposit at El Salvador, Chile. Economic Geology, 70: 857-912.
Harris, A.C. and Golding, S.D., 2002. New evidence of magmatic-fluid-related phyllic alteration: Implications for the genesis of porphyry Cu deposits. Geology, 30(4): 335-338.
Hattori, K.H. and Keith, J.D., 2001. Contribution of mafic melts to porphyry copper mineralization: evidence from Mount Pinatubo, Phillippines, and Bingham Canyon, Utah, USA. Mineralium Deposita, 36: 799-806.
Hayes, P. and Drewes, H., 1978. Mesozoic depositional history of southeastern Arizona. In: J. Callender, J. Wilt and R. Clemons (Eds), Land of Cochise, Southeastern Arizona. New Mexico Geol. Society, 29th Field Conference, pp. 201-207.
Hedenquist, J.W., Arribas, A.J. and Gonzalez-Urien, E., 2000. Exploration for epithermal gold deposits, Reviews in Economic Geology, v. 13, pp. 245-277.
Hedenquist, J.W., Arribas, A.J. and Reynolds, J.R., 1998. Evolution of an intrusion-centered hydrothermal system: Far Southeast-Lepanto porphyry and epithermal Cu-Au deposits, Philippines. Economic Geology, 93: 373-404.
Hedenquist, J.W. and Richards, J.P., 1998. The influence of geochemical techniques on the development of genetic models for the porphyry copper deposits. In: P.B. Larson (Ed), Techniques in hydrothermal ore deposits geology. Reviews in Economic Geology, Boulder, pp. 235-256.
Heidrick, T.L. and Titley S, R., 1982. Fracture and dike pattern in Laramide plutons and their structural and tectonics implications. In: R. Titley S (Ed), Advances in Geology of the porphyry copper deposits, southwestern North America. University of Arizona Press, Tucson, pp. 73-92.
Heinrich, C.A., Gunther, D., Audetat, A., Ulrich, T. and Frischknecht, R., 1999. Metal fractionation between magmatic brine and vapor, determined by microanalysis. Geology, 27(8): 755-758.

184
Henley, R.W. and McNabb, A., 1978. Magmatic vapor plumes and ground water interactions in porphyry copper emplacement. Economic Geology, 73: 1-20.
Hernandez Pena, J., 1978. Petrologia y geologia del deposito "La Caridad", Nacozari, Sonora, Simposio sobre la Geologia y Potencial Minero del Estado de Sonora, Resumenes. Universidad Nacional Autonoma de Mexico, Instituto de Geologia, pp. 73-75.
Herrmann, M., 2001. Episodic magmatism and hydrothermal activity, Pima mining district, Arizona. M. S. Thesis, University of Arizona, Tucson, 44 pp.
Hollister, V.F., Anzalone, S.A. and Richter, D.H., 1975. Porphyry copper deposits of southern Alaska and contiguous Yukon Territory. Canadian Mining and Metallurgical Bulletin, 68: 104-112.
Hollister, V.F. and Seraphim, R.H., 1976. Intrusive rocks associated with porphyry copper mineralization in island arc areas. Economic Geology, 71(3): 678-679.
Horita, J., Cole, D.R. and Wesolowski, D.J., 1995. The activity-composition relationship of oxygen and hydrogen isotopes in isotopes in aqueous salt solutions: III. Vapor-liquid equilibration of NaCl solution to 350oC. Geochimica et Cosmochimica Acta, 59: 1139-1151.
Jensen, P.W., 1998. A structural and geochemical study of the Sierrita porphyry copper system, Pima County, Arizona., University of Arizona, Tucson, 136 pp.
Johnson, S.E., Tate, M.C. and Fanning, C.M., 1999. New geologic mapping and SHRIMP U-Pb data in Peninsular Ranges batholith, Baja California Mexico: Evidence of a suture? Geology, 27: 743-746.
Jones, N.W., McKee, J.W., Anderson, T.H. and Silver, L.T., 1990. Nazas Formation: A remnat of the Jurassic Arc of western North America in north-central Mexico, Geological Society of America, Abstract with Programs, Dallas, pp. A327.
Jones, N.W., Mc Kee, J.W., Anderson, T.H. and Silver, L.T., 1995. Jurassic volcanic rocks in northeastern Mexico: A possible remnant of a Cordilleran magmatic arc. In: C. Jaques-Ayala, C.M. Gonzalez-Leon and J. Roldan-Quintana (Eds), Studies on the Mesozoic of Sonora and adjacent areas. Geological Society of America Special Paper 301, pp. 179-190.
KIlmer, F.H., 1984. Geology of Cedros Island Baja California, Mexico. Kilmer, F. H, Arcata, California., 69 pp.
Kimbrough, D.L. and Moore, T.E., 2003. Ophiolite and volcanic arc assemblages on the Vizcaino Peninsula and Cedros Island, Baja California Sur, Mexico; Mesozoic

185
forearc lithosphere of the Cordilleran magmatic arc. In: S.E. Johnson, S.R. Paterson, J.M. Fletcher, M.S. Girty, D.L. Kimbrough and A. Martin-Barajas (Eds), Tectonic evolution of northwestern Mexico and the Southwestern USA. Special Paper - Geological Society of America. 374, Boulder, CO, pp. 43-71.
Kusakabe, M., Hort, M. and Matsuhisa, Y., 1990. Primary mineralization-alteration of the El Teniente and Rio Blanco porphyry copper deposits, Chile. Stable isotopes, fluid inclusions and Mg2+/Fe2+/Fe3+ ratios of hydrothermal biotite. In: S.E. Ho (Ed), Stable isotopes and fluid processes in mineralization. University of Western Australia Geology Department and Extension Services Publication 23, pp. 226-243.
Landtwing, M. R., Dillenbeck, E. D, Leake, M. H., Heinrich, C. A. 2002Evolution of the breccia-hosted porphyry Cu-Mo-Au deposit at Agua Rica, Argentina: progressive unroofing of a magmatic hydrothermal system Economic Geology 97(6), pp 1273-1292.
Lang, J.R., 1991. Isotopic and geochemical characteristics of Laramide igneous rocks in Arizona. Ph.D. Thesis, University of Arizona, Tucson, 201 pp.
Lang, J.R. and Eastoe, C.J., 1988. Relationships between a Porphyry Cu-Mo deposit, base and precious metal veins, and Laramide intrusions, Mineral Park, Arizona. Economic Geology, 83: 551-567.
Lang, J.R., Guan, Y. and Eastoe, C.J.,1989. Stable Isotope Studies of Sulfates and Sulfides in the Mineral Park Porphyry Cu-Mo System,Arizona. Economic Geology, 84: 650-662.
Lang, J.R., Thompson, J., Mortensen, J., Baker, T., Coulson, I., Duncan, R., Maloof, T., James, J., Friedman, R. and Lepitre, M., 2001. Regional and System-Scale Controls on the Formation of Copper and/or Gold Magmatic-Hydrothermal Mineralization. Special Publication 2. The Mineral Deposit Research Unit The University of British Columbia, Vancuver, 115 pp.
Lang, J.R. and Titley, S.R., 1998. Isotopic and geochemical characteristics of Laramide magmatic systems in Arizona and implications for the genesis of porphyry copper deposits. Economic Geology, 93: 132-170.
Lindgreen, W., 1933. Mineral Deposits,New York, McGraw Hill, 930p.
Lindner, M., Leich, D.A., Borg, R.J., Russ, G.P., Bazan, J.M., Simons, D.S. and Date, A.R., 1986. Direct Laboratory determination of the 187Re half-life. Nature, 320: 246-248.

186
Livingston, D.E., 1973. A plate tectonic hypothesis for the genesis of porphyry copper deposits of the southern Basin and Range Province. Earth and Planetary Science Letters, 20: 171-179.
Livingston, D.E., 1974. K-Ar Ages and Sr Isotopy of La Caridad, Sonora, compared to other porphyry copper deposits of the southern Basin and Range Province, Geological Society of America abstracts with programs, pp. 208.
Long, K.R., 1995. Tables from Production and reserves of Cordilleran (Alaska to Chile) porphyry copper deposits. In: F.W. Pierce and G.J. Bolm (Eds), Porphyry Copper Deposits of the American Cordillera. Arizona Geol. Soc. Digest 20, Tucson, pp. 51-68.
Lopez-Martinez, M., Smith, P.E., Weber, B., Evensen, N.M., York, D. and Martinez-Mueller, R., 2002. Direct Dating of El Arco pyrites by 40Ar-39Ar. GEOS, 22: 242.
Losada-Calderon, A.J. and McPhail, D.C., 1996. Porphyry and high sulfidation epithermal mineralization in the Nevados del Famitina mining district, Argentina., Special Publication 5. Society of Economic Geologists, Boulder, pp. 91-117.
Lowell, J.D. and Guilbert, J.M., 1970. Lateral and vertical alteration-mineralization zoning in porphyry ore deposits. Economic Geology, 65(4): 373-408.
Ludwig, K.J., 2003. Isoplot 3.00 Berkeley Geochronology Center Special Publication No. 4, 70 p.
Ludwig, K.R., 2001. Users manual for Isoplot/Ex v. 2.47. A geochronological toolkit for Microsoft Excel, Berkeley Geochronology Center Special Publication, Berkeley, pp. 43.
Maksaev, V., Munizaga, F., McWilliams, M., Fanning, M., Mathur, R., Ruiz, J. and Zentelli, M., 2004. New Chronology for El Teniente, Chilean Andes, from U-Pb, 40Ar/39Ar, Re-Os, and fission track Dating. In: R.H. Sillitoe, J. Perello and C.E. Vidal (Eds), Andean Metallogeny: New discoveries, Concepts and Updates. Society of Economic Geologists, Special Publication, Boulder, pp. 15-54.
Marsh, T.M., Einaudi, M.T. and McWilliams, M., 1997. 40 Ar/39Ar geochronology of Cu-Au and Au-Ag mineralization in the Potrerillos district, Chile. Economic Geology, 92: 784-806.
Masterman, G.J., Cooke, D.R., Berry, R.F., Clark, A.H., Archibald, D.A., Mathur, R., Walshe, J.L. and Duran, M., 2004. 40Ar/39Ar and Re-Os geochronology of porphyry copper-molybdenum deposits and related copper-silver veins in the Collahuasi district, Northern Chile. Economic Geology, 99: 673-690.

187
McCandless, T.E. and Ruiz, J., 1993. Rhenium-osmium evidence for regional mineralization in southwestern North America. Science,, 261: 1282-1286.
McDowell, F. W., Roldan-Quintana, J., Connelly, J. N., 2001. Duration of Late Cretaceous-early Tertiary magmatism in east-central Sonora, Mexico. Geological Society of America Bulletin, 113 (4): 521-531.
McFarlane, M.J., 1981. Geology of the Moonlight Valley porphyry copper deposit, Lights Creek, Plumas County, California. Master's Thesis, University of Nevada, Reno, 81 pp.
McKee, M.B. and Anderson, T.H., 1998. Mass-gravity deposits and structures in the Lower Cretaceous of Sonora, Mexico. Geological Society of America Bulletin, 110(12): 1516-1529.
McMillan, W.J. and Panteleyev, A., 1988. Porphyry Copper Deposits. In: R.G. Roberts and P.A. Sheahan (Eds), Ore Deposit Models. Geological Association of Canada, St. John's, NF, pp. 45-58.
Meinert, L.D., 1982. Skarn, manto, and breccia pipe formation in sedimentary rocks of the Cananea mining district, Sonora, Mexico,. Economic Geology,, 77: 919-949.
Muller, D., Kaminski, K., Uhlig, S., Graupner, T., Herzig, P.M., Hunt, S., 2002, The transition from porphyry- to epithermal-style gold mineralization at Ladolam, Lihir Island, Papua New Guinea: a reconnaissance study. Mineralium Deposita, 37: 61-74
Muntean, J.L. and Einaudi, M.T., 2001. Porphyry-epithermal transition. Maricunga Belt, Northern Chile. Economic Geology, 96: 743-772.
Nagler, T.F. and Frei, R., 1997. Plug in plug osmium destillation. Schweizer Mineralogische Petrogrologische Mitteilungen, 77: 123-127.
Nash, J.T., 1976. Fluid Inclusion petrology- data from porphyry copper deposits and application to exploration. U. S. G. S. professional paper., paper 907-D: 1-16.
Norton, D.L., 1982. Fluid and heat transport phenomena typical of copper-bearing pluton environments. In: S.R. Titley (Ed), Advances in Geology of the Porphyry Copper Deposits, Southwestern North America. University of Arizona Press, Tucson, pp. 59-72.
Norton, D.L., Cathles, L. M., 1979. Thermal aspects of ore deposition In: H. L. Barnes (Ed), Geochemistry of hydrothermal ore deposits. John Wiley & Sons. New York, pp. 611-631.

188
Norton, D.L., Knight, J. E., 1977.Transport phenomena in hydrothermal systems; cooling plutons. American Journal of Science. 277 (8): 937-981.
Norton, D.L., Taylor, H. P., 1979. Quantitative simulation of the hydrothermal systems of crystallizing magmas on the basis of transport theory and oxygen isotope data; an analysis of the Skaergaard Intrusion. Journal of Petrology, 20 (3): 421-486.
Nourse, J., 2001. Tectonic insight from an Upper Jurassic-Lower Cretacous stretched-clast conglomerate, Cabarca-Altar region, Sonora, Mexico. Journal of South American Earth Sciences, 14: 453-474.
Nourse, J., Anderson, T.H. and Silver, L.T., 1994. Tertiary metamorphic core complexes in Sonora, northwestern, Mexico. Tectonics, 13(5): 1161-1182.
Ochoa-Landin, L. and Echavarri, A., 1978. Observaciones preliminares sobre la secuencia de las intrusiones hipabisales en el Tajo Colorada-veta del distrito minero de Cananea. Bol. Depto. de Geología, UNISON, 1(1): 57-60.
Ohmoto, H. and Goldhaber, M.B., 1997. Sulfur and carbon isotopes. In: H.L. Barnes (Ed), Geochemistry of Hydrothermal Ore deposits. John Wiley & Sons, New York, pp. 517-612.
Ohmoto, H. and Lasaga, A.C., 1982. Kinetics of reactions between aqueous sulfates and sulfides in hydrothermal systems. Geochimica et Cosmochimica Acta, 46: 1727-1745.
Ohmoto, H. and Rye, D.M., 1979. Isotopes of sulfur and carbon. In: B. Skinner (Ed), Geochemistry of Hydrothermal Ore Deposits. John Wiley & Sons, New York, pp. 509-567.
Ortega-Rivera, A., 2003. Geochronological constraints on the tectonic history of the Peninsular Ranges Batholith of Alta and Baja California; tectonic implications for western Mexico. In: S.E. Johnson, S.R. Paterson, J.M. Fletcher, M.S. Girty, D.L. Kimbrough and A. Martin-Barajas (Eds), Tectonic evolution of northwestern Mexico and the Southwestern USA. Special Paper - Geological Society of America. 374, Boulder, CO, pp. 297-335.
Osatenko, M. J. and Jones, M. B., 1976, Valley Copper, In Brown, A. S. (Ed), Porphyry deposits of the Canadian Cordillere, Canadian Institute of Mining and Metallurgy. Special Volume 15, 130-143.
Ossandon, G., Freraut, R., Gustafson, L.B., Lindsay, D.D. and Zentelli, M., 2001. Geology of the Chuquicamata mine: A progress report. Economic Geology, 96: 249-270.

189
Padilla-Garza, R.A., 2003. Description and evolution of the Escondida porphyry copper deposit, Antofagasta region, northern Chile., University of Arizona, Tucson, 216 pp.
Padilla-Garza, R.A., Titley S, R. and Eastoe, C., 2004. Hypogene evolution of the Escondida porphyry copper deposit, Chile. In: R.H. Sillitoe, J. Perello and C.E. Vidal (Eds), Andean Metallogeny: New Discoveries, Concepts, and Updates. Society of Economic Geologists, Special Publication 11, Boulder, pp. 141-166.
Perello, J., 1994. Geology, porphyry Cu-Au and epithermal Cu-Au-Ag mineralization of the Tombulilato district, North Sulawesi, Indonesia. Journal of Geochimical Exploration, 50: 221-256.
Perello, J., Cox, D., Garamjav, D., Sanjdorj, S., Diakov, S., Schissel, D., Munkhbat, T. and Oyun, G., 2001. Oyu Tolgoi: Siluro-Devonian porphyry Cu-Au-(Mo) and high sulfidation Cu mineralization with Cretaceous chalcocite blanket. Economic Geology, 96(6): 1407-1428.
Perez-Segura, E., and Echavarri, A., 1981. La Carta Metalogenica de Sonora. Direccion de Mineria, Geologia y Energeticos del Gobierno del Estado de Sonora, Hermosillo, 18 pp.
Perry, V.D., 1961. The significance of mineralized breccia pipes. Mining Engineering., 13: 367-376.
Pupin, J.P., 1980. Zircon and Granite petrology. Contributions to Mineralogy and Petrololgy, 73: 207-220.
Raisz, E., 1959. Landforms of Mexico, Cambridge, Mass. Map with Text. 1:3,000,000.
Radelli, L., 1989. The ophiolites of Calmalli anf the Olvidada nappe of northern Baja California and west-central Sonora. In: P.L. Abbott (Ed), Geologic Studies in Baja California. The Pacific SEction of the Society of Economic Paleontologists and Mineralogists, Los Angeles, California, pp. 79-89.
Rangin, C., 1978. Consideraciones sobre la Evolucion Geologica de la parte Septentrional del Estado de Sonora., Libreto guia 1er Simposio sobre la geologia y potencial minero del Estado de Sonora. Instituto de Geologia UNAM, Hermosillo., pp. 35-36.
Rangin, C., 1978. Speculative model of Mesozoic geodynamics, central Baja California to northeastern Sonora (Mexico). In: D.G. Howell and K.A. McDougall (Eds), Mesozoic paleogeography of the western United States. Pacific Section, Society of Economic Paleontologists and Mineralogists.

190
Rangin, C., 1981. Aspectos geodinamicos de la region noroccidental de Mexico. UNAM Instituto de Geologia Revista, 5(2): 180-194.
Rangin, C., Steinberg, M., Bonnot-Courtois, C., 1981. Geochemistry of the Mesozoic bedded cherts of Central Baja California (Vizcaino-Cedros-San Benito): implications for paleogeographic reconstruction of an old oceanic basin. Earth and Planetary Science Letters, 54: 313-322.
Reed, M. H., Spycher, N. F., 1984. Calculation of pH and mineral equilibria in hydrothermal waters with application to geothermotry and studies of boiling and dilution. Geochimica et Cosmochimica Acta 48: 1479-1492.
Redmond, P.B., Einaudi, M.T., Inan, E.E., Landtwing, M.R. and Heinrich, C.A., 2004. Copper deposition by fluid cooling in intrusion-centered system: new insights from the Bingham porphyry ore deposit, Utah. Geology, 32: 217-220.
Rehrig, W.A. and Heidrick, T.L., 1972. Regional fracturing in Laramide stocks of Arizona and its relationship to porphyry copper mineralization. Economic Geology, 67: 198-213.
Reyna, L. and Mayboca, A., 1986. Estudio geologico detallado del yacimiento de La Caridad, Universidad de Sonora, Hermosillo, 48 pp.
Reynolds, P., Revenhurst, C., Zentilli, M. and Lindsay, D.D., 1998. High-precision 40 Ar/39Ar dating of two consecutive hydrotermal events in the Chuquicamata porphyry copper system. Chile. Chemical Geology, 148: 45-60.
Reynolds, T.J. and Beane, R.E., 1985. Evolution of hydrothermal charactyeristics at the Santa Rita, New Mexico, porphyry copper deposit. Economic Geology, 80: 1328-1347.
Richards, J. P., Noble, S. R., Pringle, M. S., 1999. A revised late Eocene age of porphyry Cu magmatism in the Escondida area, northern Chile. Economic Geology. 94 (8), 1231-1248.
Roedder E. (1984) Fluid Inclusions. Reviews in Mineralogy 12, Mineralogical Society of America. 644 p.
Roldan-Quintana, J., 1981. Evolucion tectonica del estado de Sonora. UNAM Instituto de Geologia Revista, 5(2): 178-185.
Rollog, M. E. 2003. Oxygen, strontium and neodynium isotopic patterns in granitoids of the North American Cordillera Department of Geosciences. University of arizona, Tucson, pp 89.

191
Rubatto, D., 2002. Zircon trace element geochemistry; partitioning with garnet and the link between U-Pb ages and metamorphism. Chemical Geology, 184(1-2): 123-138.
Rye, D.M., Bethke, P.M. and Wasserman, D.M., 1992. The stable isotope geochemistry of acid sulfate alteration. Economic Geology, 87: 225-262.
Sawkins, F.J., 1979. Fluid inclusion studies of the Inguaran copper-bearing breccia pipes, Michaocan, Mexico. Economic Geology, 74(4): 924-927.
Scherkenback, D.A., Sawkins, F.J. and Seyfried, W.E., 1985. Geologic, fluid inclusions, and geochemical studies of the mineralized breccias at Cumobabi, Sonora, Mexico. Economic Geology, 80: 1566-1592.
Schmidt, K.L., 2000. Investigation of arc processes: Relationships among deformation, magmatism, mountain building, and the role of crustal anisotropy in the evolution of the Peninsular Ranges batholith, Baja California. Ph. D. thesis Thesis, University of Soutrhern California, Los Angeles, 310 pp.
Schmidt, K.L. and Paterson, S.R., 2002. A doubly vergent fan structure in the Peninsular Ranges Batholith; transpression or local complex flow around a continental margin buttress?. Tectonics, 21(5): 19.
Schmidt, K.L., Wetmore, P.H., Johnson, S.E. and Paterson, S.R., 2002. Controls on orogenesis along an ocean-continent margin transition in the Jura-Cretaceous Peninsular Ranges batholith. In: A. Barth (Ed), Contributions to Crustal Evolution of the Southwestern United States. Geological Society of America Special Paper 365, Boulder, Colorado, pp. 49-71.
Seagart, W., Sell, J. and Kilpatrick, B., 1974. Geology and mineralization of La Caridad porphyry copper deposits, Sonora, Mexico. Economic Geology, 69(7): 1060-1077.
Sedlock, R., Ortega-Gutierrez, F. and Speed, R.C., 1993. Tectonoestratigraphic terranes and tectonic evolution of Mexico. Geological society of America, Special Paper 278.
Sedlock, R.L., 2003. Geology and tectonics of the Baja California Peninsula and adjacent areas. In: S.E. Johnson, S.R. Paterson, J.M. Fletcher, M.S. Girty, D.L. Kimbrough and A. Martin-Barajas (Eds), Tectonic evolution of northwestern Mexico and the Southwestern USA. Special Paper Geological Society of America 374, Boulder, CO, pp. 1-42.
Selby, D. and Creaser, R.A., 2001. Re-Os geochronology and sistematics in molybdenite from the Endako porphyry molibdenum deposit, British Columbia, Canada. Economic Geology, 96: 197-204.

192
Selby, D., Nesbitt, B. E., Muehlenbachs, K., Prochaska, W., 2000. Hydrothermal alteration and fluid chemistry of the Endako porphyry molybdenum deposit, British Columbia. Economic Geology, 95: 183-201.
Shafiqullah, M., Damon, P., Lynch, D., Reynolds, S.J., Rehigh, W. and Raymond, R., 1980. Geochronology and geologic history of southwestern Arizona and adjacent areas. In: C. Stone (Ed), Arizona Geological Society Digest 12. Arizona Geological Society, Tucson, pp. 201-260.
Shakel, D.W., Silver, L.T. and Damon, P.E., 1977. Observations on the history of the gneissic core complex, Santa Catalina Mountains, southern Arizona, Geological Society of America, Abstract with Programs, pp. 1169-1170.
Sharma, T., Clayton, R. N., 1964. Oxygen analysis of minerals and oxides. Analytical Chemistry 36: 2001-2002.
Shaw, S.E., Todd, V.R. and Grove, M., 2003. Jurassic peraluminous gneissic granites in
the axial zone of the Peninsular Ranges, Southern California. In: S.E. Johnson, S.R. Paterson, J.M. Fletcher, M.S. Girty, D.L. Kimbrough and A. Martin-Barajas (Eds), Tectonic evolution of northwestern Mexico and the Southwestern USA. Special Paper - Geological Society of America. 374, Boulder, CO, pp. 157-183.
Shelton, K.L. and Rye, D.M., 1982. Sulfur isotopic composition of ores from Mines Gaspe, Quebec: An example of sulfate-sulfide disequilibria in ore-forming fluid with application to other porphyry-type deposit. Economic Geology, 77(7): 1688-1709.
Sheppard, T. and Taylor, H.P., 1974. Hydrogen and oxygen isotope for the origin of water in the Boulder batholith and the Butte ore deposits, Montana. Economic Geology, 69: 926-946.
Shinohara, H. and Hedenquist, J.W., 1997. Constraints on magma degassing beneath the Far Southeast Porphyry Cu-Au deposit, Philippines. Journal of Petrology, 38: 1741-1752.
Shirey, S. and Walker, R., 1995. Carius tube digestion for low-blank rhenium-osmium analysis. Analytical Chemistry, 67: 2136-2141.
Shmulovich, K.L., Landwehr, D., Simon, K. and Heinrich, W., 1999. Stable isotope fractionation between liquid and vapor in water-salt systems up to 600 oC. Chemical Geology, 157: 343-254.
Sillitoe, R.H., 1973. The tops and bottoms of porphyry copper deposits, Economic Geology, 68: 799-815.

193
Sillitoe, R.H., 1983. Enargite-bearing massive sulfide deposits high in porphyry systems. Economic Geology, 78: 348-352.
Sillitoe, R.H., 1985. Ore-related breccias in volcanoplutonic ores. Economic Geology, 80: 1467-1514.
Sillitoe, R.H., 1989. Gold deposits in western Pacific island acs: The magmatic connection, Economic Geology Monograph 6, pp. 274-291.
Silver, L.T., Anderson, C.A., Crittenden, M. and Robertson, J.M., 1977. Chronoestratigraphic elements of the Precambrian rocks of the southwestern and far western United States, Geological Society of America, annual metting, Abstracts with Programs. Geological Society of America, Seattle, pp. 1176.
Silver, L.T., Williams, I. S., Woodhead, J.A., 1981. Uranium in granites from southwestern United States: Actanideparent-daughter system, sites and mobilization, U.S. Department of Energy, Open File Report, GJBX-45.
Singer, D.A., 1995. World class base and precious metal deposits -A quantitative analysis. Economic Geology, 90: 88-104.
Skinner, B. J., 1979, The many origins of hydrothermal mineral deposits. In: H.L. Barnes (Ed), Geochemistry of hydrothermal ore deposits. John Wiley & Sons, New York, pp. 1-21
Smoliar, M., Walker, R. and Morgan, J., 1996. Re-Os of group IIA, IIIA, IVA and IVB iron meteorites. Sciences, 271: 1099-1102.
Solano-Rico, B., 1995. Some geologic and exploration characteristics of porphyry copper deposits in the Sierra Madre del Sur Province, southwestern Mexico. In: F.W. Pierce and J.G. Bolm (Eds), Porphyry copper deposits of the American Cordillera. Arizona Geological Society, Tucson, AZ, pp. 545-550.
Stacey, J.S.K. and Kramers, J.D., 1975. Approximation of terrestrial lead isotope evolution by a two-stage model. Earth and Planetary Science Letters, 26(2): 207-221.
Sterner, S. M., and Bordnar, R. J., 1984. Synthetic fluid inclusions in natural quartz. I Compositional types synthesized and applications to experimental geochemistry. Geochimical et Cosmochimical Acta 48: 2659-2668.
Stewart, J., 1988. Latest Proterozoic and Paleozoic southern margin of North America and the accretion of Mexico. Geology, 16: 186-189.
Stewart, J., Poole, F.G., Ketner, K.B., Madrid, R.J., Roldan, J. and Amaya, R., 1990. Tectonics and stratigraphy of the Paleozoic and Triassic southern margin of North
194
America, Sonora, Mexico. In: J. Spencer (Ed), Geologic excursions through the Sonoran Desert region, Arizona and Sonora. Arizona Geological Survey, Special Paper 7, Tucson, pp. 183-202.
Stoffregen, R.E., Rye, R.O. and Wasserman, D.M., 1994. Experimental studies of alunite 18O-16O and D-H fractionation factors between alunite and water at 250-450oC. Geochimica et Cosmochimica Acta, 58: 903-916.
Storey, L.O., 1978. Geology and mineralization of the Lights Creek Stock, Plumas County, California. In: J.P. Jenney and H.R. Hauck (Eds), Proceedings of the Porphyry copper symposium. Arizona Geological Society Digest 11, Tucson, pp. 49-58.
Suzuoki, T. and Epstein, S., 1976. Hydrogen isotope fractionation between OH-bearing minerals and water. Geochimica et Cosmochimica Acta, 40: 1229-1240.
Taylor, H.P., 1974. The application of oxygen and hidrogen isotope studies to problems of hydrothermal alteration and ore deposition. Economic Geology, 69: 843-883.
Taylor, H.P., 1979. Oxygen and hydrogen isotope relationships in hydrothermal mineral deposits. In: H.L. Barnes (Ed), Geochemistry of hydrothermal mineral deposits. John Wiley, New York, pp. 236-277.
Taylor, H.P., 1997. Oxygen and hydrogen isotope relationships in hydrothermal mineral deposits. In: H.L. Barnes (Ed), Geochemistry of hydrothermal mineral deposits. John Wiley, New York, pp. 229-302.
Taylor, H. P., Epstein, S. 1962. The relationship between 18O/16O ratios in coexisting minerals of igneous and methamorphic rocks. Bulletin of the Geological Society of America 73: 461-480.
Theodore, T.G. and Priego de Wit, M., 1978. Porphyry-type metallization and alteration
at La Florida de Nacozari, Sonora, Mexico. Journal of Research of the U. S. Geological Survey, 6(1): 59-72.
Theodore, T.H. and Priego, M., 1976. Porphyry type metallization and alteration at La Florida de Nacozari, Sonora, Mexico. U. S. G. S. Open File report 76-7601: 28.
Thoms, J., 1978. Textural variations and mineral zoning of the Pilares breccia pipe, Nacozari mining district, Sonora, Mexico. In: J.a.H. Jenney, H. (Ed), Arizona Geological Society Digest V. XI. Arizona Geological Society, Tucson, Az., pp. 143.
Titley S, R., 1976. Evidence for a linear tectonic pattern in southwestern Arizona. In: J. Wilt and J. Jenney (Eds), Tectonics of Arizona. Arizona Geological Society Digest 10, Tucson, pp. 71-101.

195
Titley S, R., Thompson, R.C., Haynes, F.M., Manske, S., Robinson, L.C. and White, J.L., 1986. Evolution of fractures and alteration in the Sierrita-Esperanza hydrothermal system, Pima County, Arizona. Economic Geology, 81: 343-370.
Titley, S.R., 1981. Geologic and tectonic setting of porphyry copper deposits in the southern cordillera. In: W.R. Dickinson and W.P. Payne (Eds), Relations of tectonics to ore deposits in the southern cordillera. Arizona Geological Society XIV, pp. 79-98.
Titley, S.R., 1982. Geologic setting of porphyry copper deposits, southeastern Arizona. In: S.R. Titley (Ed), Advances in Geology of the Porphyry Copper Deposits, Southwestern North America. University of Arizona Press, Tucson, pp. 37-58.
Titley, S.R., 1995. Geological summary and perspective of porphyry copper deposits in Southwestern Nort America. In: F.W. Pierce and B. J.G. (Eds), Porphyry copper deposits of the American Cordillera. Arizona Geological Society Digest 20, Tucson, pp. 6-20.
Titley, S.R., 2001. Crustal affinities of metallogenesis in the American Southwest. Economic Geology, 96: 1323-1342.
Titley, S.R. and Anthony, E.Y., 1989. Laramide mineral deposits in Arizona. In: J. Jenney and S.R. Reynolds, . (Eds), Geologic Evolution of Arizona. Arizona Geological Society Digest v. 17, Tucson, pp. 485-514.
Todd, V.R. and Shaw, S.E., 1985. S-type granitoids and an I-S line in the Peninsular Range batholith, southern California. Geology, 13: 231-233.
Tosdal, R., Haxel, G. and Wright, J., 1989. Jurassic Geology of the Sonoran Desert region, southern Arizona:construction of a continental-margin magmatic arc. In: S.R. Reynolds, . (Ed), Geologic Evolution of Arizona. Arizona Geological Society Digest 17, Tucson, pp. 397-434.
Turner, K.J., 1983. The determination of the sulfur isotopic signature of an ore-forming fluid from the Sierrita porphyry copper deposit, Pima County, Arizona., University of Arizona, Tucson, 93 pp.
Ulrich, T., Gunther, D. and Heinrich, C.A., 2001. Evolution of a porphyry Cu-Au deposit, based on LA-ICP-MS analysis of fluid incluions, Argentina. Economic Geology, 96.
Umhoefer, P.J., 2003. A model for the North America Cordillera in the Early Cretaceous: Tectonic escape related to arc collision of the Guerrero Terrane and a change in North America plate motion. In: S.E. Johnson, S.R. Paterson, J.M. Fletcher, M.S. Girty, D.L. Kimbrough and A. Martin-Barajas (Eds), Tectonic evolution of northwestern Mexico and southwestern USA. Geological Society of America Special Paper 374, Boulder, Colorado.

196
Valencia Gomez, V.A., 1994. Estratigrafia y microfacies del Cretacico Inferior de Lampazos, Sonora, Mexico. Universidad de Sonora Boletin del Departamento de Geologia, 11(2): 59-86.
Valencia, V.A., Barra, F., Weber, B., Ruiz, J., Geherls, G., Chesley, J. and Lopez-Martinez, M., In review. Re-Os and U-Pb Geochronology of the El Arco Porphyry Copper Deposit, Baja California Mexico. Journal of South American Earth Sciences.
Valencia, V.A., Ruiz, J., Barra, F., Geherls, G., Ducea, M., Titley S, R. and Ochoa-Landin, L., In review. U-Pb zircon and Re-Os molybdenite geochronology from La Caridad porphyry copper deposit: Insights for the duration of magmatism and mineralization in the Nacozari District, Sonora, Mexico. Mineralium Deposita.
Valentine, W.G., 1936. Geology of the Cananea Mountains, Sonora, Mexico. Geological Society of America Bulletin, 47: 53-86.
Wade, R. and Wantke, A., 1919. Geology and mining methods at Pilares mine. Bulletin of the American Institute of Mining and Metallurgical Enginneers, 152: 1143-1170.
Wantke, A., 1925. La Caridad Mine, Sonora, Mexico. Economic Geology, 20: 311-318.
Weber, B. and Lopez-Martinez, M., 2002. Sr, Nd, Pb isotopes and Ar-Ar dating of the "El Arco" porphyry copper deposit, Baja California: evidence of Cu mineralization within an oceanic island arc., Geological Society of America, 2002 annual meeting, Boulder, pp. 88.
Weber, B. and Lopez-Martinez, M., Submitted. Pb, Sr, and Nd isotopic and chemical evidence for an oceanic island arc formation of the "El Arco" porphyry copper deposit (Baja California, Mexico). Economic Geology.
Wendt, C., 1977. Geology, alteration, and mineralization of the Batamote ranch area, northern Sonora, Mexico., University of arizona, Tucson, 110 pp.
Were, R. W., Bodnar, R. J., Bethke, P. M., and Barton, P. B., Jr., 1979. A novel gas-flow fluid inclusion heating and freezing stage. Geological Society of America abstract and programs. pp. 539.
Wetmore, P.H., Herzig, C., Alsleben, H., Sutherland, M., Schmidt, K.L., Schultz, P.W. and Paterson, S.R., 2003. Mesozoic tectonic evolution of the Peninsular Ranges of southern and Baja California. In: S.E. Johnson, S.R. Paterson, J.M. Fletcher, M.S. Girty, D.L. Kimbrough and A. Martin-Barajas (Eds), Tectonic evolution of northgwestern Mexico and the southwestern USA. Geological Society of America Special Paper 374, Boulder, pp. 93-116.

197
Wilkins, J. and Heidrick, T.L., 1995. Post Laramide extension and rotation in porphyry copper deposits, Southwestern United States. In: J.G. Bolm (Ed), Porphyry copper deposits of the American Cordillera. Arizona Geological Society Digest 20, Tucson, pp. 109-127.
Wodzicki, W., 1995. The evolution of Laramide igneous rocks and porphyry copper mineralization in the Cananea district, Sonora, Mexico., University of Arizona, Tucson, 181 pp.
Wodzicki, W., 2001. The evolution of magmatism and mineralization in the Cananea district, Sonora, Mexico. In: C.E. Nelson (Ed), New Mines and Discoveries in Mexico and Central America. Society of Economic Geologists, Boulder, pp. 243-263.
Worcester, P., 1976. Geology of northern part of the Nacozari mining district, Nacozari, Sonora, Mexico, The Miami University, Ohio.