evolution of brain size in a highly diversifying lineage of subterranean rodent genus ctenomys...
TRANSCRIPT

Fax +41 61 306 12 34E-Mail [email protected]
Original Paper
Brain Behav Evol 2009;73:138–149 DOI: 10.1159/000218738
Evolution of Brain Size in a Highly Diversifying Lineage of Subterranean Rodent Genus Ctenomys (Caviomorpha: Ctenomyidae)
Aldo Iván Vassallo Alejandra Isabel Echeverría
Laboratorio de Ecofisiología, Depto. de Biología, Facultad de Ciencias Exactas y Naturales, Universidad Nacional de Mar del Plata, Mar del Plata , Consejo Nacional de Investigaciones Científicas y Técnicas (CONICET), Argentina
lower than that obtained for families within Caviomorpha, we failed to find any significant relationship between en-cephalization and body weight. Finally, the relationship be-tween brain size and metabolism was assessed for those species of Ctenomys in which metabolic data are available. Brain size evolution in Ctenomys is discussed in regards to sensory capabilities and behavioral attributes associated with the occupation of a subterranean ecological niche.
Copyright © 2009 S. Karger AG, Basel
Introduction
Several studies have shown that brain size is closely related to body weight In general, small animals show small brains and larger animals show large brains [Pilleri 1959; Stephan and Andy, 1964; Radinsky, 1967; Harvey and Krebs, 1990; Kruska, 1987; Towe and Mann, 1992; Bush and Allman, 2004]; however, changes in body size are not accompanied in an isometric (proportional) man-ner by changes in brain size or brain components [see for example Harvey, 1988; Barton and Harvey, 2000]. The allometric function y = ax b , and its logarithmic transfor-mation log(y) = log(a) + b log(x) in which y represents brain weight, x body weight, ‘a’ is the intercept and ‘b’ the allometric coefficient, has been used in various studies to
Key Words
Brain evolution � Subterranean rodents � Ctenomys � Caviomorpha � Behavior
Abstract
We evaluated brain size evolution in a specialized subterra-nean mammal, the ctenomyid rodent genus Ctenomys (tuco-tuco) and compared it, within a phylogenetic framework, to other caviomorph rodents differing in body size and modes of life. Although brain size in Ctenomys falls below the regres-sion line obtained for caviomorph rodents, some fossorial species within the sister family Octodontidae, which make use of both above and below ground habitats, have a rela-tively larger brain size. Ctenomys has experienced a relative-ly recent and ‘explosive’ cladogenesis which yielded � 60 liv-ing species differing almost one order of magnitude in body size. Based on the evolutionary lag hypothesis between body versus brain size evolution, a negative correlation be-tween encephalization quotient and body size would be ex-pected for a group experiencing such a recent diversifica-tion in size. This is because a decrease of body size occurring during the emergence of a new species should produce a correspondingly greater encephalization and vice versa. De-spite the fact that the allometric coefficient of brain weight versus body weight for 30 living species of Ctenomys was
Received: August 29, 2008 Returned for revision: November 6, 2008 Accepted after second revision: March 16, 2009 Published online: May 18, 2009
Aldo Iván Vassallo Depto. de Biología, Facultad de Ciencias Exactas y Naturales Universidad Nacional de Mar del Plata, CC 1245 7600, Mar del Plata (Argentina) E-Mail [email protected]
© 2009 S. Karger AG, Basel0006–8977/09/0732–0138$26.00/0
Accessible online at:www.karger.com/bbe

Evolution of Brain Size in the Subterranean Rodent Genus Ctenomys
Brain Behav Evol 2009;73:138–149 139
explore this relationship. It is widely known that the form of the relationship is largely allometric, i.e. 0 ! b ! 1. Nonetheless, there are numerous estimates of the allome-tric coefficient b in the literature and, accordingly, differ-ent views regarding its significance. Empirical values of the allometric coefficient close to 0.66 obtained from samples including several mammalian taxa [Jerison, 1973] suggest a relationship in which the amount of sen-sory information processed by the brain is more likely to be related to body surface area than to body volume [Healy and Harvey, 1990; see also Gould, 1975]. On the other hand, a different estimate of 0.75 based on a more abundant sample of mammalian species, leads to the hy-pothesis of an association between brain weight and bas-al metabolic rate – BMR – [Martin, 1981; see also McNabb and Eisenberg, 1989]. This is because, at least in mam-mals, BMR increases with ¾ power of body weight. It should be noted, however, that this value might be biased upward by the inclusion of large herbivores with digestive fermentation [see White and Seymour, 2005]. In his study, Martin [1981] found that the allometric regression of brain weight on body weight adjusted for BMR yielded a nearly isometric b estimate: 1.026 (0.97; 1.08).
In addition to the problem of the form of the allome-tric relationship between brain and body weight across taxa, it has been suggested that variation among species in relative brain size is the outcome of evolutionary pro-cesses associated with particular ecological niches, and corresponding behavioral and sensory demands [Mace et al., 1981; Mace and Eisenberg, 1982; Gittleman, 1986; Hutcheon et al., 2002; Reader and Laland, 2002; Sol et al., 2007]. Residual brain sizes of species (or higher taxonom-ic entities) from regressions of brain versus body weight and the use of encephalization quotients are two frequent approaches used to control for the association between brain and body size, and to explore relationships among brain size and ecological or behavioral factors [Eisenberg, 1981; Lefebvre et al., 1997]. In particular, it has been hy-pothesized that the subterranean way of life must repre-sent one of the most simple sensory and perceptual nich-es; thus, a reduction of brain size should be expected in association with this particular mode of life [Mace et al., 1981; but it has also been shown that subterranean ro-dents have skilled sensory capabilities [for example Fran-cescoli, 2000; Begall et al., 2007]. Furthermore, previous studies indicated that the relationship between the fosso-rial habit and brain size appears to be rather complex in the different taxa [for example, Pirlot and Nevo, 1989].
South American subterranean rodents of the genus Ctenomys (suborder Caviomorpha, family Ctenomyidae),
named tuco-tucos, exemplify explosive cladogenesis oc-curring within the limits of a genus. This process, which took place during the Pleistocene, yielded more than 10 fossil species and at least 56 living species [Reig et al., 1990; Verzi, 2008]. Subterranean rodents such as Cteno-mys have been described as those species that live in un-derground burrows and conduct the vast majority of their life underground [Lacey et al., 2000]. The present study focuses on three main questions: (1) Do Ctenomys have relatively small brains, possibly because of their sub-terranean ecological niche? (2) Is there evidence of an ‘evolutionary lag’, in which body size has changed more quickly than brain size leading to lower brain/body allo-metric slopes in Ctenomys ? (3) Does brain size vary with metabolic rate in these subterranean rodents?
Regarding the first question, the evaluation of brain size and encephalization in the South American genus Ctenomys is interesting for several reasons. The genus possesses a series of striking morphological, physiologi-cal and behavioral specializations for the subterranean niche, which has been considered relatively simple, stable and predictable [Nevo, 1999]. Notwithstanding the as-sumed simplicity of the subterranean niche, species of Ctenomys are able to perform complex behaviors [Zenuto et al., 2001, 2002; Vassallo, 2006; Begall et al., 2007; Echeverría and Vassallo, 2007]. Recent studies suggest that tuco-tucos have the ability to use olfaction to orient their digging during tunnel excavation [Schleich and Ze-nuto, 2007] and to rely on chemical and acoustic commu-nication during the breeding season and for territory es-tablishment [Zenuto et al., 2002, 2004]. To analyze brain size and encephalization of the subterranean genus Cte-nomys we used the taxa within the suborder Caviomor-pha (South American histricognath rodents) as a refer-ence group. The Caviomorpha was choosen as a reference group because it is a monophyletic taxon that includes the family Ctenomyidae and other diverse South American families. The Caviomorpha represent one of the most di-verse clades of rodents in terms of ecology, life history traits, body size, and locomotor habits [Mares and Ojeda, 1982]. Cursorial adaptations are present in maras (Doli-chotis patagonum) which inhabit the Patagonian steppe, pacas (Agouti paca) and agoutis (Dasyprocta) ; coypos (Myocastor coypus) and capybaras (Hydrochoerus hydro-chaeris) show swimming adaptations and are found in diverse aquatic habitats, whereas porcupines (e.g., Erethi-zon, Coendou ) and spiny rats (e.g., Proechimys, Dactylo-mys ) show striking climbing adaptations and occupy for-est habitats [Redford and Eisenberg, 1992; Eisenberg and Redford, 1999; Galewski et al., 2005]. In an additional

Vassallo/Echeverría Brain Behav Evol 2009;73:138–149140
comparison, we used several taxa belonging to the sister monophyletic family Octodontidae, which are closely re-lated to Ctenomys . The sister taxa Octodontidae and Cte-nomyidae, which occupy the southern portion of South America, show several adaptations to open habitats, such as the acquisition of burrowing behaviors, which char-acterize the evolution of both families since the late Miocene [Quintana, 1994; Verzi, 2001]. The family Oct-odontidae is very interesting because, contrary to Cteno-myidae (one living genus, Ctenomys , including fully sub-terranean species only), the different octodontid genera have a complete range of fossorial adaptations to the un-derground niche [Lessa et al., 2008], from mostly surface dwellers to specialized subterranean forms, such as Spala-copus cyanus (the Chilean ‘coruro’) which evolved sev-eral convergent traits with those present in the genus Cte-nomys . For this reason, it is expected to show a consider-able variation in brain size in correspondence with great variation in subterranean habits within Octodontidae. Finally, brain size in Ctenomys was compared to that es-timated in the extinct Pliocene ctenomyid Actenomys .
Regarding the second question, it should be noted that although species within the genus Ctenomys are homoge-neous in their primary morphological traits [Vassallo, 1998; Mora et al., 2003], they show a great variation in body size. Body size variation within the genus was most likely the result of selection pressures associated with the different habitats occupied by the approximately 56 liv-ing species [Vleck, 1979; Luna and Antinuchi, 2007; Me-dina et al., 2007]. A distinctive characteristic of Ctenomys is that this genus has experienced an ‘explosive’ and rela-tively recent cladogenesis [Reig et al., 1990; Lessa and Cook, 1998; Verzi, 2008], posing the question of how brain size evolution tracked changes in body size. It was argued [Lande, 1979; see also Harvey and Bennett, 1983] that because direct selection on body weight does not seem to result in significant changes in brain weight, if closely related species are different mostly because of body size – for instance Ctenomys – their brain/body scaling coefficients would be expected to be lower than for species that are more distantly related, i.e., species within Caviomorpha in the present study.
Finally, regarding the relationship between metabo-lism and brain size, Martin [1981] advanced the idea that maternal metabolic rate constrains the development of an embryo’s brain and, because mammals are viviparous, the relationship between maternal metabolic rate and neonatal brain weight is a direct one. Because subterra-nean rodents belonging to different phylogenetic lineages evolved relatively lower BMR compared to epigenous ro-
dents [McNabb, 1966, 2002] we explored the relationship between brain weight and body weight adjusted for BMR in those species of Ctenomys in which metabolic data are available.
Materials and Methods
We used endocranial volume as a proxy of brain size for all spe-cies in this study. Endocranial volume was measured on skulls of caviomorph rodents stored at Museo de Ciencias Naturales de La Plata, Argentina; Museo de Ciencias Naturales ‘Lorenzo Scaglia’ de Mar del Plata, Argentina; Colección de Vertebrados y Laboratorio de Ecofisiología, FCEyN, Universidad Nacional de Mar del Plata, Argentina, and Museo de Historia Natural, Santiago, Chile. For this purpose, the skull was filled through the foramen magnum with 2 mm shot whose volume was then determined [Mann et al., 1988; Iwaniuk and Nelson, 2002]. When necessary, skull foramina were previously sealed with plastilina. Because the study focused principally on relative differences among taxa, and because the same proxy measure of brain size is used for all species (i.e., endo-cranial volume) we assumed that the estimations were close enough to actual brain volume [see for example Mann et al., 1988].
Endocranial volumes (online supplementary table 1, see www. karger.com/doi/10.1159/000218738) were obtained for the follow-ing taxa (we included 1 to 12 specimens per species and both sex-es in similar numbers but juvenile individuals were excluded from the analysis): Family Caviidae: Cavia pamparum , Galea spixii , G. musteloides , Microcavia australis , Kerodon rupestris , Dolichotis patagonum , Family Hydrochaeridae: Hydrochaeris hydrochaeris , Family Myocastoridae: Myocastor coypus , Family Chinchillidae: Lagostomus maximus , Chinchilla lanigera ; Family Echimyidae: Proechimys dimidiatus , P. albispinus ; Family Octodontidae: Spalacopus cyanus , Octodontomys gliroides , Octodon degus , Octo-mys mimax , Tympanoctomys barrerae , Aconaemys sagei , A. por-teri ; Family Ctenomyidae (30 species included): Ctenomys tala-rum , C. australis, C. porteusi , C. dorbignyi , C. azarae , C. latro , C. occultus , C. perrensi , C. opimus , C. haigi , C. emilianus , C. bonettoi , C. tuconax , C. tucumanus , C. magellanicus , C. mendocinus , C. roigi , C. sociabilis , C. argentinus , C. leucodon , C. rionegrensis , C. pundti , C. fulvus , C. maulinus , C. chasiquensis , C. boliviensis, C. torquatus, C. lami, C. flamarioni, C. minutus . These species are representative of the major subclades (subclades ‘Mendocinus’, ‘Corrientes’, Bolivian, northern Argentinean and Patagonian spe-cies group) principal distribution areas, and body size diversity within the genus Ctenomys . Further information about the mate-rial examined is listed at the ‘Specimens Examined’ Appendix, which includes the respective museum and catalog numbers (see www.karger.com/doi/10.1159/000218738).
The cranial volume of the extinct ctenomyine Actenomys pris-cus , taken from a well-preserved specimen at the Museo ‘Lorenzo Scaglia’ (Mar del Plata) was included in the analysis. For this spec-imen body weight was estimated by means of the length of the humerus using the equation provided in Fernández et al. [2000].
Additional values of brain weight were taken from Eisenberg [1981; tables in appendix 2 and 6], including Agouti paca ; Family Dasyproctidae: Dasyprocta sp .; Family Erethizontidae: Erethizon dorsatum, and from Mace et al. [1981] Family Dinomyidae: Dino-mys branickii .

Evolution of Brain Size in the Subterranean Rodent Genus Ctenomys
Brain Behav Evol 2009;73:138–149 141
Body weights of Ctenomys species (suppl. table 1) were taken from museum specimen information (that is, brain size and body size data were obtained from the same animal). This was also the case for caviomorph rodents. In some cases the average values of body weights were taken for both sexes from the literature, as in-dicated in supplementary table 1. Sources of body weight mea-surements were Eisenberg [1981], Redford and Eisenberg [1992] and Nowak [1999]. Family brain and body weight were calculated from the median of their component genera measures.
Encephalization quotients were calculated following Jerison [1973; see also Eisenberg, 1981] dividing our measures of cranial volume by the expected value obtained from the regression line.
For our analysis of interspecific scaling relations, the tradi-tional allometric approach fails to account for possible non-inde-pendence of taxa [Harvey and Pagel, 1991], so we analyzed the skull measurements using phylogenetically independent con-trasts [Felsenstein, 1985]. Log 10 data were converted to phyloge-netically independent standardized contrasts using the PDAP [Midford et al., 2003] package module in the program MES-QUITE [Maddison and Maddison, 2006]. Standardization tests in PDTREE indicated that Grafen’s branch length transformation [Grafen, 1992] was the appropriate method for assigning arbitrary branch lengths [Garland et al., 1992]. This method assumes a gradual Brownian motion model of evolution, and the height of each node is proportional to the number of species derived from it. Slopes, confidence intervals, and other regression statistics were obtained from PDTREE, Statistica 6.0, Microsoft Excel and a program for running Model II Regression develped by Andrew Bohonak (San Diego State University www.bio.sdsu.edu/pub/andy/RMA.html). To investigate hypotheses of character correla-tion between encephalization and body size in a phylogenetic context, we used the method of phylogenetic pairwise compari-
son developed by Maddison [2000] and implemented in the Pair-wise module in the program MESQUITE. The module chooses pairs of phylogenetically independent taxa, and indicates how the pairs compare in two characters under study: does the member of the pair with the higher value in body weight have higher or low-er value of encephalization? The results were analyzed using the binomial sign test.
Phylogenetic relationships among taxa were taken from Opa-zo [2005] for caviomorph rodents (Mammalia, Rodentia, Hystri-cognathi), and from different sources for species within Ctenomys (Hystricognathi, Ctenomyidae) including Castillo et al. [2005], D’Elía et al. [1999], and Mascheretti et al. [2000].
Results
We found that the allometric coefficient for families within caviomorph rodents was 0.66/0.68. The coeffi-cient did not substantially vary among different regres-sions models or considering original data versus phyloge-netically independent contrasts ( table 1 ). Brain size of the fully subterranean genus Ctenomys , obtained by averag-ing the values of 30 living species, fell slightly below the regression line, within the 95% confidence interval ( fig. 1 ). Other caviomorph families lacking subterranean habits, such as Caviidae, Echimyidae and Dinomyidae, also fell below the regression line; that is, they have brain sizes smaller than those expected for a caviomorph rodent of
Table 1. Allometric equations y = axb of brain weight versus body weight in families of caviomorph rodents, and in 30 species of the subterranean genus Ctenomys (Caviomorpha: Ctenomyidae) in this study
Caviomorph rodents Ctenomys Ctenomys BMR
Original log10 measurementsAllometric coefficient b (LS) 0.66 (0.61–0.76) 0.48 (0.34–0.62) 1.00 (0.18–1.82)Intercept (LS) –1.15 (–1.45 to –0.87) –0.77 (–1.09 to –0.45) –1.84 (–3.63 to –0.04)R2 (LS) 0.96 0.64 0.54Allometric coefficient b (RMA) 0.67 (0.59–0.76) 0.58 (0.44–0.72) 1.36 (0.54–2.18)Intercept (RMA) –1.24 (–1.51 to –0.97) –1.01 (–1.33 to –0.69) –2.62 (–4.41 to –0.82)R2 (RMA) 0.98 0.58 0.54
Phylogenetically independent contrastsAllometric coefficient b (LS) 0.66 (0.56–0.76) 0.45 (0.31–0.59) 0.75 (–0.02–1.51)R2 (LS) 0.96 0.64 0.49Allometric coefficient b (RMA) 0.68 (0.55–0.80) 0.56 (0.42–0.70) 1.07 (0.61–1.80)R2 (RMA) 0.95 0.66 0.49
Regressions were performed on both original log10 measurements and phylogenetically independent con-trasts.
LS: least squares regressions; RMA: reduced major axis regressions. Values and 95% confidence intervals are given. The last column presents values for a regression analysis adjusted by basal metabolic rates [BMR; see Armstrong, 1983] in species of Ctenomys.

Vassallo/Echeverría Brain Behav Evol 2009;73:138–149142
similar size, which is also indicated by the standardized residuals of the regression between brain size versus body size ( fig. 2 ). This figure shows that the family Ctenomy-idae has a negative standardized residual indicating a rel-atively small brain size when compared to other cavio-morph rodents.
Contrary to Ctenomys , the family value for the sister taxa Octodontidae was above the regression line ( fig. 1 , 2 ). It was found that some genera within Octodontidae have negative residual brain sizes whereas other have positive residuals ( fig. 3 ). Both the fully subterranean Spalacopus cyanus and the specialized, fossorial Aconae-mys have negative residuals and hence, smaller brain siz-es compared to those expected for a caviomorph ro-dent.
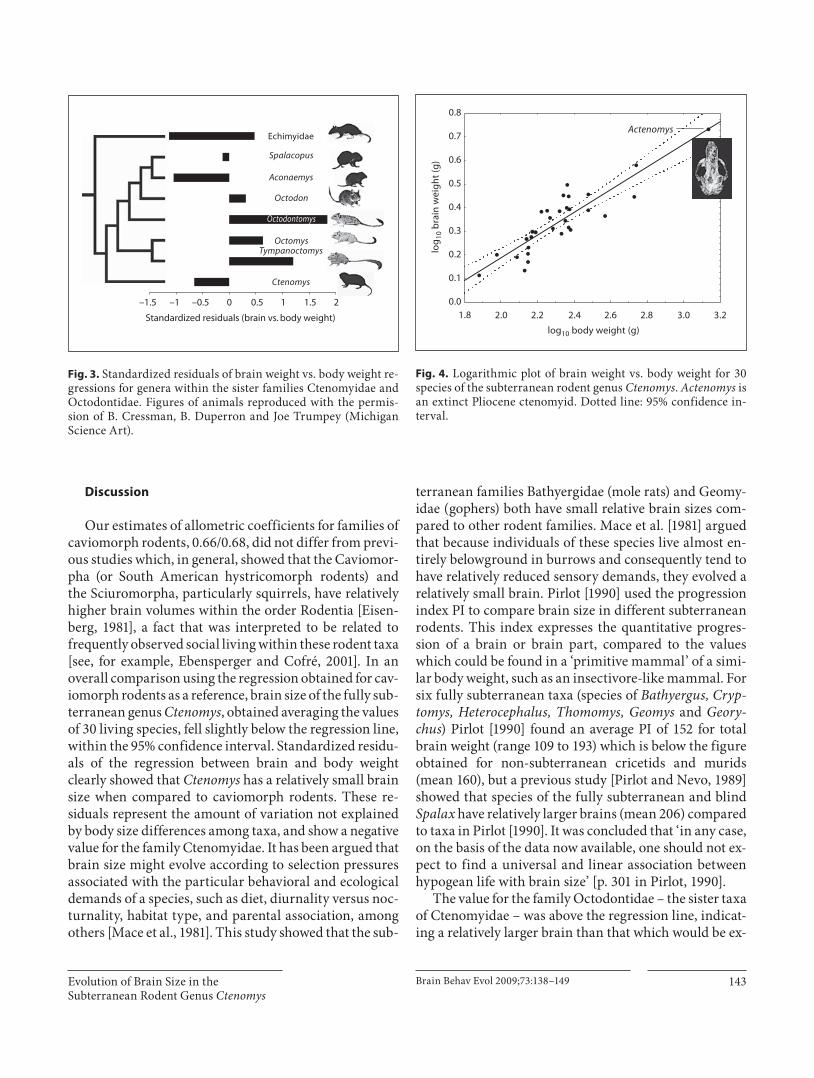
The allometric analysis of the 30 species of Ctenomys measured in this work ( fig. 4 ) yielded a slope (coefficient b) around 0.50 which is lower than that obtained for the families within Caviomorpha (0.66/0.68; table 1 ). The co-efficients obtained using RMA regressions were above those of least squares regressions, as expected at relative-ly lower R 2 , but this difference is probably negligible. The cranial volume corresponding to the large body-sized Pliocene ctenomyid Actenomys priscus did not substan-tially depart from the regression line ( fig. 4 ).
Speciation of the genus Ctenomys was accompanied by a remarkable diversification in body size ( fig. 5 ). We
found that body size both increased and decreased dur-ing the cladogenesis of the genus, which could be ob-served tracing the evolutionary history of the trait on a working phylogeny of the genus ( fig. 5 ). We found a non-significant relationship between encephalization quo-tients and body size for the 30 Ctenomys species analyzed in this study ( fig. 6 ). Additionally, the method of phylo-genetic pairwise comparison [Maddison, 2000] yielded a non-significant correlation between encephalization and body size (p = 0.15; pairwise comparison using binomial sign test; ‘most pairs’ method; n = 15 pairs: positive = 5, negative = 10, neutral = 0).
We evaluated the relationship between brain size and metabolism, based on those species of Ctenomys on which basal metabolic rate (BMR) were measured [Luna et al., 2007]. Following Armstrong [1983] we estimated the re-gression of brain weight on body weight adjusted for BMR (i.e., body mass times the metabolic rate). The data were log 10 transformed. Although the results should be inter-preted with care as they represent a subset of nine species, it was observed that the allometric coefficient b reached isometry ( table 1 ; fig. 7 ). Again, and because of dispersal of data, slopes for RMA regressions were higher than those of least squares regressions [see Legendre and Le-gendre, 1998]. Nonetheless, the confidence intervals in-clude the isometric value 1, although it should be noted that the confidence interval was very high.
0.0
0.2
0.4
0.6
0.8
1.0
1.2
1.4
1.6
1.8
2.0
Ctenomys
Octodontidae
log
10 b
rain
wei
gh
t (g
)
log10 body weight (g)1.8 2.0 2.2 2.4 2.6 2.8 3.0 3.2 3.4 3.6 3.8 4.0 4.2 4.4 4.6 4.8
Fig. 1. Logarithmic plot of brain weight vs. body weight for 12 families of Caviomorph rodents. Note massive skull in the subter-ranean genus Ctenomys ; Octodontidae exemplified by Octodon-tomys gliroides . Dotted line: 95% confidence interval.
–2 –1 0 1 2 3
Erethizontidae
Standardized residuals (brain vs. body weight)
Dinomyidae
Chinchillidae
Myocastoridae
Echimyidae
Ctenomyidae
Octodontidae
Dasyproctidae
Hydrochaeridae
Dolichotis
Caviidae
Agoutidae
Fig. 2. Standardized residuals of brain weight vs. body weight re-gressions for 11 families of Caviomorph rodents. Phylogenetic re-lations based on Opazo et al. [2005].
Evolution of Brain Size in the Subterranean Rodent Genus Ctenomys
Brain Behav Evol 2009;73:138–149 143
Discussion
Our estimates of allometric coefficients for families of caviomorph rodents, 0.66/0.68, did not differ from previ-ous studies which, in general, showed that the Caviomor-pha (or South American hystricomorph rodents) and
the Sciuromorpha, particularly squirrels, have relatively higher brain volumes within the order Rodentia [Eisen-berg, 1981], a fact that was interpreted to be related to frequently observed social living within these rodent taxa [see, for example, Ebensperger and Cofré, 2001]. In an overall comparison using the regression obtained for cav-iomorph rodents as a reference, brain size of the fully sub-terranean genus Ctenomys , obtained averaging the values of 30 living species, fell slightly below the regression line, within the 95% confidence interval. Standardized residu-als of the regression between brain and body weight clearly showed that Ctenomys has a relatively small brain size when compared to caviomorph rodents. These re-siduals represent the amount of variation not explained by body size differences among taxa, and show a negative value for the family Ctenomyidae. It has been argued that brain size might evolve according to selection pressures associated with the particular behavioral and ecological demands of a species, such as diet, diurnality versus noc-turnality, habitat type, and parental association, among others [Mace et al., 1981]. This study showed that the sub-
terranean families Bathyergidae (mole rats) and Geomy-idae (gophers) both have small relative brain sizes com-pared to other rodent families. Mace et al. [1981] argued that because individuals of these species live almost en-tirely belowground in burrows and consequently tend to have relatively reduced sensory demands, they evolved a relatively small brain. Pirlot [1990] used the progression index PI to compare brain size in different subterranean rodents. This index expresses the quantitative progres-sion of a brain or brain part, compared to the values which could be found in a ‘primitive mammal’ of a simi-lar body weight, such as an insectivore-like mammal. For six fully subterranean taxa (species of Bathyergus, Cryp-tomys, Heterocephalus, Thomomys, Geomys and Geory-chus ) Pirlot [1990] found an average PI of 152 for total brain weight (range 109 to 193) which is below the figure obtained for non-subterranean cricetids and murids (mean 160), but a previous study [Pirlot and Nevo, 1989] showed that species of the fully subterranean and blind Spalax have relatively larger brains (mean 206) compared to taxa in Pirlot [1990]. It was concluded that ‘in any case, on the basis of the data now available, one should not ex-pect to find a universal and linear association between hypogean life with brain size’ [p. 301 in Pirlot, 1990].
The value for the family Octodontidae – the sister taxa of Ctenomyidae – was above the regression line, indicat-ing a relatively larger brain than that which would be ex-
Octodontomys
Echimyidae
Spalacopus
Aconaemys
Octodon
OctomysTympanoctomys
Ctenomys
–1.5 –1 –0.5 0
Standardized residuals (brain vs. body weight)
1 20.5 1.5
Fig. 3. Standardized residuals of brain weight vs. body weight re-gressions for genera within the sister families Ctenomyidae and Octodontidae. Figures of animals reproduced with the permis-sion of B. Cressman, B. Duperron and Joe Trumpey (Michigan Science Art).
0.0
0.1
0.2
0.3
0.4
0.5
0.6
0.7
0.8
Actenomys
log
10 b
rain
wei
gh
t (g
)
1.8 2.0 2.2 2.4 2.6 2.8 3.0 3.2
log10 body weight (g)
Fig. 4. Logarithmic plot of brain weight vs. body weight for 30 species of the subterranean rodent genus Ctenomys . Actenomys is an extinct Pliocene ctenomyid. Dotted line: 95% confidence in-terval.

Vassallo/Echeverría Brain Behav Evol 2009;73:138–149144
pected for a caviomorph rodent. When analyzing the variation present at a lower taxonomic level among the seven living genera belonging to the sister families Cte-nomyidae and Octodontidae, a complex panorama merg-es: some genera within Octodontidae have negative re-sidual brain sizes, as well as Ctenomys , whereas others have positive residuals ( fig. 3 ). Extant octodontid rodents encompass a broad array of behavioral and structural ad-aptations, from surface dwelling to fully subterranean species ( table 2 ). It is noteworthy that only the fully sub-
terranean Spalacopus cyanus and the specialized, fosso-rial Aconaemys showed negative residual brain sizes, which appears to be a convergent feature characterizing the sister family Ctenomyidae ( fig. 3 ). The family Echi-myidae, however, which is a basal octodontoid taxon within the clade Octodontidae + Ctenomyidae [for ex-ample see Opazo, 2005], showed negative residual brain size, which argues in favor of a possible phylogenetic in-ertia at least in Ctenomys . The other octodontid taxa (Tympanoctomys, Octodon, Octodontomys and Octomys)
95–145145–195195–245145–295295–345345–395395–445445–495495–545545–595595–
220 C. leucodon 600 C. tuconax 535 C. boliviensis 230 C. opimus 300 C. fulvus 215 C. maulinus 135 C. talarum 140 C. pundti 141 C. bonettoi 235 C. rionegrensis 300 C. flamarioni 138 C. azarae 192 C. mendocinus 371 C. australis 140 C. chasiquensis 185 C. porteousi 235 C. magellanicus 148 C. sociabilis 164 C. haigi 154 C. emilianus 240 C. tucumanus 122 C. latro 146 C. argentinus
95 C. occultus 225 C. minutus 229 C. lami 210 C. torquatus 237 C. dorbigni 166 C. perransi 180 C. roigi
Body size (g) Encephalization
<1
>1
Fig. 5. Body size evolution and variation in encephalization for 30 living species of the genus Ctenomys mapped under the maximum parsimony criterion. Body sizes both increased and decreased during the cladogenesis of the genus, probably in association with changes in plant productivity and soil conditions. Phylogenetic relations based on various sources (see Material and Methods). Average values for both sexes.

Evolution of Brain Size in the Subterranean Rodent Genus Ctenomys
Brain Behav Evol 2009;73:138–149 145
showed positive residual brain sizes ( fig. 3 ). Although these taxa inhabit more or less complex burrows they spend a substantial fraction of their lives outside their burrows [Lessa et al., 2008 and references therein]. In contrast to fully subterranean Ctenomys and Spalacopus, their aboveground excursions to collect food consist of relatively long trips lasting several minutes. The use of both below and aboveground habitats most likely entails
a complex sensory demand and the ability to manage three spatial dimensions, which is probably associated with a bigger brain.
Brain size in Actenomys priscus did not substantially depart from that observed in extant Ctenomys species. A. priscus was an early Pliocene ctenomyid whose ancient caves protrude on shore cliffs in southern Mar del Plata, Argentina. In this species, the long bones of both fore-
Table 2. Summary of behavioral attributes of octodontid and ctenomyid taxa in this study
FamilyOctodontidae
Fossoriality Habitat use Burrow structure Morphologicaladaptations for digging
Spalacopus cyanus subterranean mostly belowground: less than 1%of time aboveground
complex with horizontalforaging tunnels
highly specialized
Octodontomysgliroides fossorial aboveground and belowground simple incipient
Octodon fossorial aboveground and belowground;relatively long aboveground trips
complex incipient
Octomys mimax fossorial aboveground and belowground simple incipientTympanoctomys
barrerae fossorial aboveground and belowground complex incipientAconaemys fossorial aboveground and belowground;
use of runways across vegetationcomplex specialized
Ctenomys subterranean mostly belowground: less than 1%of time aboveground
complex with horizontalforaging tunnels
highly specialized
Actenomys transition fossorialto subterranean (?)
aboveground and belowground (?) complex moderate adaptations
Data taken from Lessa et al. [2008] and references therein. Actenomys is an extinct Pliocene ctenomyid.
y = –8E–05x + 1.0268R2 = 0.003
N.S.
0
0.2
0.4
0.6
0.8
1
1.2
1.4
1.6
Body weight (g)
Ence
ph
aliz
atio
n q
uoti
ent
0 100 200 300 400 500 600
Fig. 6. Plot of encephalization vs. body weight for 30 living species of the genus Ctenomys . A non-significant statistical relationship was found.
y = 1.0004x – 1.8379R2 = 0.54; p = 0.023
0
0.1
0.2
0.3
0.4
0.5
0.6
log
10 b
rain
wei
gh
t
log10 body weight*BMR2 2.05 2.1 2.15 2.2 2.25 2.3 2.35
Fig. 7. Logarithmic plot of brain weight vs. body weight adjusted by basal metabolic rate [see Armstrong, 1983, for 9 species of the genus Ctenomys ].

Vassallo/Echeverría Brain Behav Evol 2009;73:138–149146
and hind-limbs are rather elongated, showing a slight de-parture from the condition seen in generalized, surface-dwelling rodents, indicating that aboveground locomo-tion was both common and agile in this fossil ctenomyid. Congruent with the osteological analysis of fossil re-mains, it was assumed that this species showed a semi-subterranean mode of life [Fernández et al., 2000]. Our estimate of brain size in Actenomys indicates that it does not differ substantially in this respect from living Cteno-mys species [see Verzi, 2008 for a recent analysis of living and extinct Ctenomyidae phylogeny]. Therefore, the ac-quisition of fully subterranean habits did not result in an appreciable reduction in overall brain size.
Correlated Evolution of Brain and Body Size during Ctenomys Cladogenesis The allometric coefficient obtained for the 30 species
of Ctenomys measured in this study was lower than that obtained at a higher taxonomic level for families within Caviomorpha, which is in accordance with Lande’s [1979] evolutionary lag hypothesis: because direct selection on body weight does not seem to result in significant chang-es in brain weight, if closely related species are differing mostly because of body size – for instance Ctenomys – their brain/body scaling coefficients would be expected to be lower than for species that are more distantly re-lated [see discussions in Harvey, 1988; Pagel and Harvey, 1989; Mann et al., 1988; Deaner and Nunn, 1999]. How-ever, based on the evolutionary lag hypothesis between body versus brain size evolution [Lande, 1979] a negative correlation would be expected also between encephaliza-tion and body size for a group experiencing a relatively recent diversification in body size. This is because a dim-inution of body size occurring during the emergence of a new species would result in a correspondingly greater en-cephalization and vice versa. This would be the case in the highly speciose genus Ctenomys, often taken as an example of explosive speciation [Reig et al., 1990; Lessa and Cook, 1998]. The age of the Ctenomys clade is esti-mated at a range of 1.3 million years [molecular data; Castillo et al., 2005] to 3 million years [paleontological data; Verzi, 2002, 2008 and references therein]. During this period, approximately 56 living species markedly differing in body size evolved at the southern portion of South America. We failed, however, to find a pattern con-sistent with the evolutionary lag hypothesis: we found a non-significant relationship between encephalization quotients and body size for the 30 Ctenomys species ana-lyzed in this study ( fig. 6 ).
Allometric Analysis of Brain Size and BasalMetabolic Rate Basal metabolic rate is another factor that might cause
a lower brain allometric coefficient in Ctenomys com-pared to our sample of caviomorph rodents. In an early study, Martin [1981] proposed the existence of a relation-ship between brain weight and BMR. He advanced the idea that maternal metabolic rate sets constraints on the development of the embryo’s brain and, because mam-mals are viviparous, the relationship between maternal metabolic rate and neonatal brain weight is a direct one [see discussions in Healy and Harvey, 1990]. Several stud-ies have shown that subterranean rodents belonging to different phylogenetic lineages evolved relatively lower BMR when compared to epigeous rodents [McNabb, 1966, 2002]. The relatively low basal metabolic rate ob-served in subterranean rodents, compared to that of sur-face-dwelling rodents, has been proposed as an adapta-tion to subterranean life. Two hypotheses have been pro-posed to explain this physiological attribute: the cost of burrowing and thermal stress. The cost of burrowing hy-pothesis [Vleck, 1979] states that individuals must have a sufficient energy intake to balance the high cost of bur-rowing, whereas the thermal hypothesis [McNabb, 1966] relates the relatively lower BMR to the possibility of over-heating in burrows where heat exchange are restricted. The adaptive value of such a physiological trait in Cteno-mys has been recently discussed [Luna and Antinuchi, 2007]. The almost isometric b coefficient for the regres-sion of brain weight on body weight adjusted for BMR in species of Ctenomys is in accordance with Martin’s [1981] hypothesis. However, as noted by Hochachka et al. [2003] and Martin et al. [2005], to date there is no general con-sensus about the ‘true’ allometric coefficient for the rela-tionship between body size and BMR in mammals, nor is there agreement about the factors influencing scaling en-ergy metabolism and brain size [Martin, 1996; Leonard et al., 2007].
Conclusions
Three main conclusions can be drawn from the pres-ent study. First, although brain size in the subterranean rodent Ctenomys (family Ctenomyidae) falls below the regression line obtained for caviomorph rodents, some digging species within the sister family Octodontidae, which make use of both above and belowground habitats, have relatively bigger brain size. Second, in spite of the fact that the allometric coefficient for Ctenomys was low-

Evolution of Brain Size in the Subterranean Rodent Genus Ctenomys
Brain Behav Evol 2009;73:138–149 147
er than that obtained at higher taxonomic levels within Caviomorpha, the lack of a significant relationship be-tween encephalization and body size evolution within the genus Ctenomys offers no further support to the evo-lutionary lag hypothesis between body versus brain size evolution. Third, the almost isometric relationship ob-served between brain weight and body weight adjusted for BMR in our reduced set of nine species is in accor-dance with hypotheses regarding the relationship be-tween maternal metabolic rate and neonatal brain weight [Martin, 1981], although additional measurements of basal metabolic rate in Ctenomys are needed to corrobo-rate this pattern.
In spite of the relatively reduced sensory demands as-sumed to be the rule for the subterranean niche [Mace et al., 1981], it has been shown that species of Ctenomys have skilled sensory capabilities and are able to perform com-plex behaviors [Zenuto et al., 2001, 2002; Echeverría and Vassallo, 2007]. As in other subterranean species, Cteno-mys performs acoustic communication in various behav-ioral contexts [Francescoli, 2000; Begall et al., 2007]. The functional analysis of the middle ear apparatus suggests acute auditory capabilities [Schleich and Vassallo, 2003; Schleich and Busch, 2004]. In addition, two recent studies suggest that tuco-tucos have the ability to use olfaction to orient their digging while foraging [Schleich and Zenuto, 2007] and to rely on chemical communication during the breeding season [Zenuto et al., 2004]. Finally, an experi-
mental analysis using a complex labyrinth showed a highly developed spatial memory in the species Ctenomys talarum [Antinuchi and Schleich, 2003]. Recent studies have focused on the relationships among brain size and cognitive/behavioral abilities [Köhler and Moyá-Solá, 2004]. Although overall brain volume or particular brain components such as the forebrain correlate with specific behavioral attributes [for example Lefebvre et al., 1997; Reader and Laland, 2002], other factors associated with information-processing capacity are the number of corti-cal neurons and conduction velocity [Roth and Dicke, 2005]. Finally, in spite of the fact that Ctenomys has a rel-atively small brain size compared to caviomorph rodents, it might not impose severe constraints upon complex be-havioral and sensory capabilities in this species of subter-ranean mammal.
Acknowledgements
We thank Damián Romero and Diego H. Verzi for allowing access to specimens under their care, and to Ariel Farías for Oc-todon degus cranial measurements. We thank Brian Cressman, Barbara Duperron and Joe Trumpey from Michigan Science Art for allowing us to use animal images in figure 3. The comments of two anonymous reviewers greatly improved the manuscript. Financial support was provided by Universidad Nacional de Mar del Plata, CONICET PIP2005 5838, and Agencia Nacional de Pro-moción Científica y Tecnológica PICTO 2004 1-423.
References
Antinuchi CD, Schleich CE (2003) Spatial mem-ory in a solitary subterranean rodent Cteno-mys talarum (Rodentia: Ctenomyidae). Belg J Zool 133: 89–91.
Armstrong E (1983) Relative brain size and me-tabolism in mammals. Science 220: 1302–1304.
Barton RA, Harvey PH (2000) Mosaic evolution of brain structure in mammals. Nature 405: 1055–1058.
Begall S, Burda H, Schleich CE (eds) (2007) Sub-terranean Rodents: News from Under-ground. Berlin: Springer Verlag.
Bush EC, Allman JM (2004) The scaling of fron-tal cortex in primates and carnivores. Proc Natl Acad Sci USA 101: 3962–3966.
Castillo AH, Cortinas MN, Lessa EP (2005) Rap-id diversification of South American tuco-tucos ( Ctenomys ; Rodentia, Ctenomydae): contrasting mitochondrial and nuclear in-tron sequences. J Mammal 86: 170–179.
Deaner RO, Nunn, CL (1999) How quickly do brains catch up with bodies? A comparative method for detecting evolutionary lag. Proc R Soc London B 266: 687–694.
D’Elía G, Lessa EP, Cook JA (1999) Molecular phylogeny of tuco-tucos, genus Ctenomys (Rodentia, Octodontidae): evaluation of the mendocinus species group and the evolution of assymetric sperm. J Mamm Evol 6: 19–38.
Ebensperger LA, Cofre H (2001) On the evolu-tion of group-living in the New World curso-rial hystricognath rodents. Behav Ecol 12: 227–236.
Echeverría AI, Vassallo AI (2007) Influencia Materna Sobre el Desarrollo del Comporta-miento en Crías del Tuco Tuco de los Talares. (Ctenomys talarum) . SAREM 2007, Tafí del Valle, Argentina.
Eisenberg JF (1981) The Mammalian Radiation. Chicago, IL: The University of Chicago Press.
Eisenberg JF, Redford KH. 1999. Mammals of the Neotropics. Volume 3: The Central Neo-tropics: Ecuador, Peru, Bolivia, Brazil. Chi-cago, IL: University of Chicago Press.
Felsenstein J (1985) Phylogenies and the com-parative method. Am Nat 125: 1–15.
Fernández ME, Vassallo AI, Zárate M (2000) Functional morphology and paleobiology of the Pliocene rodent Actenomys (Caviomor-pha: Octodontidae): the evolution to a sub-terranean mode of life. Biol J Linn Soc 71: 71–90.
Francescoli G (2000) Sensory capabilities and communication in subterranean rodents. In: Life Underground: The Biology of Subterra-nean Rodents (Lacey EA, Patton JL, Camer-on GN, eds). pp 111–144. Chicago, IL: The University of Chicago Press.
Galewski T, Mauffrey JF, Leite YLR, Patton JL, Douzery EJP (2005) Ecomorphological di-versification among South American spiny rats (Rodentia; Echimyidae): a phylogenetic and chronological approach. Mol Phylog Evol 34: 601–615.

Vassallo/Echeverría Brain Behav Evol 2009;73:138–149148
Garland T Jr, Harvey PH, Ives AR (1992) Proce-dures for the analysis of comparative data us-ing phylogenetically independent contrasts. Syst Biol 41: 18–32.
Gittleman JL (1986) Carnivore brain size, behav-ioral ecology, and phylogeny. J Mammal 67: 23–36.
Gould SJ (1975) Allometry in primates, with em-phasis on scaling and the evolution of the brain. Contrib Primat 5: 244–292.
Grafen A (1992) The uniqueness of phylogenetic regression. J Theoret Biol 156: 405–423.
Harvey PH (1988) Allometric analysis and brain size. In: Intelligence and Evolutionary Biol-ogy (Jerison HJ, Jerison I, eds), NATO ASI series vol 17, pp 199–210. Berlin: Springer Verlag.
Harvey PH, Bennett PM (1983) Brain size, ener-getics, ecology and life history patterns. Na-ture 306: 304–315.
Harvey PH, Krebs JR (1990) Comparing brains. Science 249: 140–146.
Harvey PH, Pagel MD (1991) The Comparative Method in Evolutionary Biology. New York: Oxford University Press.
Healy SD, Harvey PH (1990) Comparative stud-ies of the brain and its component. Neth J Zool 40: 203–214.
Hochachka PW, Darveau CA, Andrews RD, Su-arez RD (2003) Allometric cascade: a model for resolving body mass effects on metabo-lism. Comp Biochem Physiol A 134: 675–601.
Hutcheon JM, Kirsch JAW, Garland Jr T (2002) A comparative analysis of brain size in rela-tion to foraging ecology and phylogeny in the Chiroptera. Brain Behav Evol 60: 165–180.
Iwaniuk AN, Nelson JE (2002) Can endocranial volume be used as an estimate of brain size in birds? Can J Zool 80: 16–23.
Jerison HJ (1973) Evolution of the Brain and In-telligence. New York: Academic Press.
Köhler M, Moyà-Solà S (2004) Reduction of brain and sense organs in the fossil insular bovid Myotragus . Brain Behav Evol 63: 125–140.
Kruska D (1987) How fast can total brain size change in mammals. J Hirnforsch 28: 59–70.
Lacey E, Patton JL, Cameron GN (2000) Life Un-derground: The Biology of Subterranean Ro-dents. Chicago, IL: University of Chicago Press.
Lande R (1979) Quantitative genetic analysis of multivariate evolution, applied to brain: body size allometry. Evolution 33: 402–416.
Lefebvre L, Whittle P, Lascaris E, Finkelstein A (1997) Feeding innovation and forebrain size in birds. Anim Behav 53: 549–560.
Legendre P, Legendre L (1998) Numerical Ecol-ogy. Elsevier, Amsterdam.
Leonard WR, Snodgrass JJ, Robertson ML (2007) Effects of brain evolution on human nutri-tion and metabolism. Ann Rev Nutrition 27: 311–327.
Lessa EP, Cook JA (1998) The molecular phylo-genetics of tuco-tucos (genus Ctenomys , Ro-dentia: Octodontidae) suggests an early burst of speciation. Mol Phyl Evol 9: 88–99.
Lessa EP, Vassallo AI, Verzi DH, Mora MS (2008) Evolution of morphological adaptation for digging in living and extinct ctenomyid and octodontid rodents (Rodentia: Caviomor-pha, Octodontoidea). Biol J Linn Soc (in press).
Luna F, Antinuchi CD (2007) Energy and distri-bution in subterranean rodents: sympatry between two species of genus Ctenomys . Comp Biochem Physiol 147: 948–954.
Luna F, Antinuchi CD, Bozinovic F (2007) Al-lometric scaling of basal metabolic rate in subterranean rodents: the South American case. Seventh International Congress of Comparative Physiology and Biochemistry. Salvador, Bahia, Brasil.
Mace GM, Harvey PH, Clutton-Brock TH (1981) Brain size and ecology in small mammals. J Zool 193: 333–354.
Mace GM, Eisenberg JF (1982) Competition, niche specialization and the evolution of brain size in the genus Peromyscus . Biol J Linn Soc 17: 243–257.
Maddison WP (2000) Testing character correla-tion using pairwise comparisons on a phy-logeny. J Theoret Biol 202: 195–204.
Maddison WP, Maddison DR (2006) Mesquite: a modular system for evolutionary analysis, Version 1.12. http://mesquiteproject.org.
Mann MD, Glickman SE, Towe AL (1988) Brain/body relationship among myomorph ro-dents. Brain Behav Evol 31: 111–124.
Mares MA, Ojeda RA (1982) Patterns of diver-sity and adaptation in South American hys-tricognath rodents. In: Mammalian Biology in South America (Mares MA, Genoways HH, eds), pp 393–432. Pittsburgh, PA: Spe-cial Publication Series, Pymatuning Labora-tory of Ecology, University of Pittsburgh.
Martin RD (1981) Relative brain size and meta-bolic rate in terrestrial vertebrates. Nature 293: 57–60.
Martin RD (1996) Scaling of the mammalian brain: the maternal energy hypothesis. News Physiol Sci 11: 149–156.
Martin RD, Genoud M, Hemelrijk CK (2005) Problem of allometric analysis: examples from mammalian reproductive biology. J Exp Biol 208: 1731–1747.
Mascheretti S, Mirol PM, Giménez MD, Bidau JC, Contreras JR, Searle JB (2000) Phyloge-netics of the speciose and chromosomally variable genus Ctenomys (Ctenomyidae, Oc-todontoidea) based on mitochondrial cyto-chrome b sequence. Biol J Linn Soc 70: 361–376.
McNabb BK (1966) The metabolism of fossorial rodents: a study of convergence. Ecology 47: 712–733.
McNabb BK, Eisenberg JF (1989) Brain size and its relation to the rate of metabolism in mam-mals. Am Nat 133: 157–167.
McNabb BK (2002) The Physiological Ecology of Vertebrates: a View from Energetics. Ithaca, NY: Cornell University Press.
Medina AI, Martí DA, Bidau CJ (2007) Subter-ranean rodents of the genus Ctenomys (Ca-viomorpha, Ctenomyidae) follow the con-verse to Bergmann’s rule. J Biogeo 34: 1439–1454.
Midford PE, Garland Jr T, Maddison WP (2003) PDAP:PDTREE package for Mesquite, ver-sion 1.00.
Mora M, Olivares AI, Vassallo AI (2003) Size, shape and structural versatility of the skull of the subterranean rodent Ctenomys (Ro-dentia, Caviomorpha): functional and mor-phological analysis. Biol J Linn Soc 78: 85–96.
Nevo E (1999) Mosaic Evolution of Subterranean Mammals. Oxford: Oxford University Press.
Nowak RM (1999) Mammals of the World. 6th edition. Baltimore, MD: Johns Hopkins Uni-versity Press.
Opazo JC (2005) A molecular timescale for cav-iomorph rodents (Mammalia, Hystrico-gnathi). Mol Phyl Evol 37: 932–937.
Pagel MD, Harvey PH (1989) Taxonomic differ-ences in the scaling of brain on body weight among mammals. Science 244: 1589–1593.
Pilleri G (1959) Comparative morphology of ro-dent brain. Acta Anat 39: 1–124.
Pirlot P (1990) Brains of mole rats from Africa and North America. In: Evolution of Subter-ranean Mammals at the Organismal and Molecular Levels (Nevo E, Reig OA, eds), pp 295–315. New York: Allan Liss.
Pirlot P, Nevo E (1989) Brain organization and evolution in subterranean mole rats. Z Zool Syst Evol-Forsch 27: 58–64.
Quintana CA (1994) Sistemática y anatomía fun-cional del roedor Ctenomyinae Praecteno-mys (Caviomorpha: Octodontidae) del Plio-ceno de Bolivia. Rev Téc de Yac Petr Fed Bolivia 15: 175–185.
Radinsky L (1967) Relative brain size: a new measure. Science 155: 836–838.
Reader SM, Laland KN (2002) Social intelli-gence, innovation, and enhanced brain size in primates. Proc Natl Acad Sci USA 99: 4436–4441.
Redford KH, Eisenberg JF (1992) Mammals of the Neotropics. Volume 2: The Southern Cone: Chile, Argentina, Uruguay, Paraguay. Chicago, IL: The University of Chicago Press.
Reig OA, Busch C, Contreras JR, Ortells M (1990) An overview of evolution, systemat-ics, population biology, cytogenetics, molec-ular biology, and speciation in Ctenomys . In: Evolution of Subterranean Mammals at the Organismal and Molecular Levels (Nevo E, Reig OA, eds), pp 71–96. New York: Allan Liss.
Roth G, Dicke U (2005) Evolution of the brain and intelligence. Trends Cog Sci 9: 250–257.

Evolution of Brain Size in the Subterranean Rodent Genus Ctenomys
Brain Behav Evol 2009;73:138–149 149
Schleich CE, Busch C (2004) Functional mor-phology of the middle ear of Ctenomys tala-rum (Rodentia: Octodontidae). J Mammal 85: 290–295.
Schleich CE, Vassallo AI (2003) Bullar volume in subterraneanan and surface dwelling cavio-morph rodents. J Mammal 84: 185–189.
Schleich CE, Zenuto RR (2007) Use of vegetation chemical signals for digging orientation in the subterranean rodent Ctenomys talarum (Rodentia: Ctenomyidae). Ethology 113: 573–578.
Sol D, Székely T, Liker A, Lefebvre L (2007) Big-brained birds survive better in nature. Proc R Soc Lond B 274: 763–769.
Stephan H, Andy OJ (1964) Quantitative com-parisons of brain structures from insecti-vores to primates. Am Zool 4: 59–74.
Towe AL, Mann MD (1992) Brain size/body length relations among myomorph rodents. Brain Behav Evol 39: 17–23.
Vassallo AI (1998) Functional morphology, comparative behavior, and adaptation in two sympatric subterranean rodents genus Cte-nomys (Caviomorpha: Octodontidae). J Zool 244: 415–427.
Vassallo AI (2006) The acquisition of subterra-nean habits in tuco tucos (Rodentia, Cavio-morpha, Ctenomys ): role of social transmis-sion. J Mammal 87: 939–943.
Verzi DH (2001) Phylogenetic position of Abalo-sia and the evolution of extant Octodontidae (Rodentia, Caviomorpha, Octodontidae). Acta Theriol 46: 243–268.
Verzi DH (2002) Patrones de evolución mor-fológica en Ctenomyinae (Rodentia, Octo-dontidae). Mastozool Neotrop 9: 309–328.
Verzi DH (2008) Phylogeny and adaptive diver-sity of rodents of the family Ctenomyidae (Caviomorpha): delimiting lineages and genera in the fossil record. J Zool 274: 386–394.
Vleck D (1979) The energy cost of burrowing by the pocket gopher Thomomys bottae . Physiol Zool 52: 122–134.
White CR, Seymour RS (2005) Allometric scal-ing of mammalian metabolism. J Exp Biol 208: 1611–1619.
Zenuto RR, Fanjul MS, Busch C (2004) Use of chemical communication by the subterra-nean rodent Ctenomys talarum (tuco tuco) during the breeding season. J Chem Ecol 30: 2111–2126.
Zenuto RR, Vassallo AI, Busch C (2001) A meth-od to study social and reproductive behavior of subterranean rodents in captivity with preliminary data from Ctenomys talarum . Acta Theriol 46: 161–170.
Zenuto RR, Vassallo AI, Busch C (2002) Com-portamiento social y reproductivo del roedor subterráneo Ctenomys talarum (Rodentia, Ctenomyidae) en condiciones de semicauti-verio. Rev Chil Hist Nat 75: 165–177.