evita: a prototype system for efficient visualization and ... · evita: a prototype system for...
TRANSCRIPT

EVITA: A Prototype System for Efficient Visualization and Interrogationof Terascale Datasets
Raghu Machiraju†, James E. Fowler‡, David Thompson‡,Will Schroeder∗, Bharat Soni‡
†Department of Computer & Information Science, the Ohio State University‡Engineering Research Center, Mississippi State University
∗Rensselaer Polytechnic Institute
Abstract
Large-scale computational simulations of physical phenomena produce data of unprecedented size (terabyte and petabyte range).Unfortunately, development of appropriate data management and visualization techniques has not kept pace with the growth in sizeand complexity of such datasets. To address these issues, we are developing a prototype, integrated system (EVITA) to facilitateexploration of terascale datasets. The cornerstone of the EVITA system is a representational scheme that allows ranked access tomacroscopic features in the dataset. The data and grid are transformed using wavelet techniques while a feature-detection algorithmis used to identify and rank contextually significant features directly in the wavelet domain. The most significant parts of the datasetare thus available for detailed examination in a progressive fashion. The work described here parallels much of the work in thetraditional data-mining community at least in essence. After having described the basic system prototype, some ongoing work isdescribed. We focus on our efforts in multiscale feature detection and progressive access to two-dimensional vector fields derivedfrom a oceanographic dataset.
1. IntroductionComputational field simulation (CFS) [1, 2, 3, 4] is the process of simulating complex physical phenomena via com-putation for analysis, design, or investigation of fundamental physical phenomena. The computed results are theninterrogated for analysis and validation through visualization. In such applications, the objective of visualization is tointeractively transform data into pictorial form in a manner which fosters discovery by the viewer.
These simulations routinely produce data of unprecedented size (terabyte and petabyte range) which introducesnew challenges to data management and visualization. Coupled with exploding data size is increased need for realismas well as more demanding user expectations. Unfortunately, it is often difficult to perform even simple visualizationtasks on extremely large datasets since the development of appropriate data-management techniques has not kept pacewith the growth in size and complexity of datasets [5]. For many simulations, the storage of the data itself, not tomention transmission over a limited-bandwidth network, is a serious problem.
The research reported here attempts to respond to the challenges posed by extremely large datasets. We believethe key technology needed to facilitate terascale visualization is ranked access of relevant features in compressedrepresentations. In terascale visualization, locating important features of the dataset first is paramount for effectivedata exploration. For practical reasons arising primarily from resource limitations, only parts of a dataset may beaccessed at any given time (i.e., out-of-core analysis and visualization). Thus, it is necessary to create schemes thatallow rapid access to significant information by considering only a small portion of the dataset. To this end, automaticdetection and ranking of contextually significant features in datasets is of critical importance. Furthermore, often bothfocus and context views of datasets [6, 7, 8] are required. Under this paradigm, the researcher attempts to search foruseful information in the unfamiliar territory of the dataset in question (i.e., fish-eye focus). Additionally, based ondiscoveries along the way, the objective of the search may change.
The data exploration scenario described above is not markedly different from what occurs during a typical data-mining session. Determining correlation and inherent relationships between various entities is the primary goal of adata-mining exercise. These in turn produce a better understanding of the processes generating the data. Similarly, ameaningful scientific visualization exercise should facilitate discovery of important phenomenon. However, essentialdifferences do exist between the scientific domain and typical data-mining applications. CFS data is not abstract
Technical Report MSSU-COE-ERC-01-02, Engineering Research Center, Mississippi State University, November 2000
and, in fact, is deterministic. The generation of the dataset is dictated by mathematical models representing physicalprocesses. As a result, detection of essential spatial and temporal relationships (and hence coherent structures) can beconducted with deterministic techniques as opposed to statistical and sampling techniques characteristic of traditionaldata mining. Also, the primary reason for data explosion in typical data-mining applications arises from the largeparameter space in which the entities exist. In CFS applications, the disparate spatial and temporal scales required tosimulate complex physical phenomenon dictate the growth of these datasets.
For effective terascale visualization, data compression is a must given the enormous quantities of data involved.For generality, compressed representations should be appropriate for both scalar and vector fields, with time-varyingfields being of particular importance as the time-varying nature of such datasets often yields extremely large sizes. Ad-ditional constraints on compression algorithms are as follows. First, it is often desired, for reasons of efficiency, thatderived quantities (e.g., gradients, vorticity), needed by various visualization and analysis algorithms, be computedin the compressed domain; therefore, compressed representations should be amenable to such operations. Secondly,perfect reconstruction should be permitted. That is, the compression operation should result in no net loss of infor-mation and, if desired, the original dataset should be recoverable from the compressed representation with no loss ofdata. Finally, and most importantly for ranked-access systems, visualization should be facilitated by an incompletereconstruction of the dataset. That is, the compressed representation must support browsing by partial reconstructionof the original dataset as defined by viewer requirements. More generally, the representation should allow processingthe dataset in a piecemeal fashion, which can be achieved only if the bitstream can be modified as the user browsesaround the dataset. Such browsing capability can be implemented with a client-server model—the client delineatescertain regions-of-interest (ROIs), while a server manipulates the bitstream to place information from selected ROIsfirst. In this way, the browsing tool is amenable to distributed- or even remote-visualization uses.
In Section 2 we describe our prototype system, EVITA, for visualizing large datasets. Section 3 describes a methodto create a significance map and obtain rankings for the various ROIs in the dataset. Compression and coding of vectorfields and the associated grid are discussed in Section 4, while Section 5 outlines a vision for a good user interface.Finally, in Section 6, preliminary results are discussed for a two-dimensional vector field dataset.
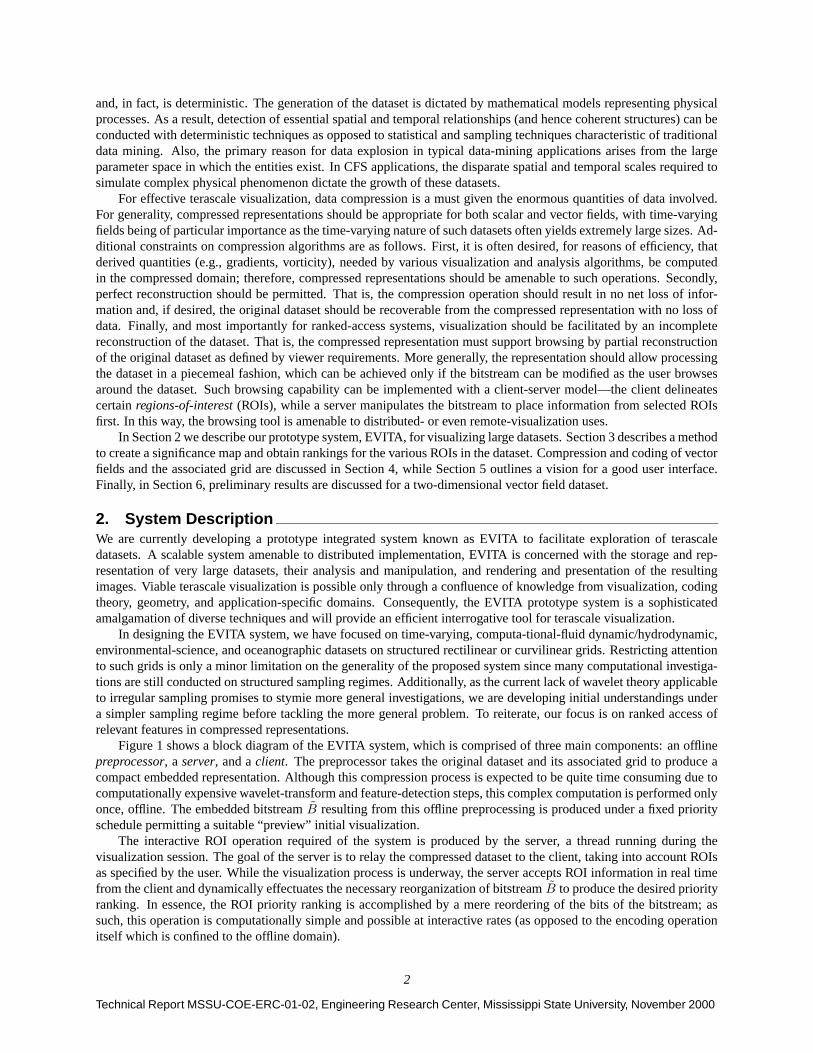
2. System DescriptionWe are currently developing a prototype integrated system known as EVITA to facilitate exploration of terascaledatasets. A scalable system amenable to distributed implementation, EVITA is concerned with the storage and rep-resentation of very large datasets, their analysis and manipulation, and rendering and presentation of the resultingimages. Viable terascale visualization is possible only through a confluence of knowledge from visualization, codingtheory, geometry, and application-specific domains. Consequently, the EVITA prototype system is a sophisticatedamalgamation of diverse techniques and will provide an efficient interrogative tool for terascale visualization.
In designing the EVITA system, we have focused on time-varying, computa-tional-fluid dynamic/hydrodynamic,environmental-science, and oceanographic datasets on structured rectilinear or curvilinear grids. Restricting attentionto such grids is only a minor limitation on the generality of the proposed system since many computational investiga-tions are still conducted on structured sampling regimes. Additionally, as the current lack of wavelet theory applicableto irregular sampling promises to stymie more general investigations, we are developing initial understandings undera simpler sampling regime before tackling the more general problem. To reiterate, our focus is on ranked access ofrelevant features in compressed representations.
Figure 1 shows a block diagram of the EVITA system, which is comprised of three main components: an offlinepreprocessor, a server, and a client. The preprocessor takes the original dataset and its associated grid to produce acompact embedded representation. Although this compression process is expected to be quite time consuming due tocomputationally expensive wavelet-transform and feature-detection steps, this complex computation is performed onlyonce, offline. The embedded bitstream B̃ resulting from this offline preprocessing is produced under a fixed priorityschedule permitting a suitable “preview” initial visualization.
The interactive ROI operation required of the system is produced by the server, a thread running during thevisualization session. The goal of the server is to relay the compressed dataset to the client, taking into account ROIsas specified by the user. While the visualization process is underway, the server accepts ROI information in real timefrom the client and dynamically effectuates the necessary reorganization of bitstream B̃ to produce the desired priorityranking. In essence, the ROI priority ranking is accomplished by a mere reordering of the bits of the bitstream; assuch, this operation is computationally simple and possible at interactive rates (as opposed to the encoding operationitself which is confined to the offline domain).
2
Technical Report MSSU-COE-ERC-01-02, Engineering Research Center, Mississippi State University, November 2000

US
ER
SE
RV
ER
PR
EP
RO
CE
SS
OR
CLI
EN
T
Wav
elet
Tra
nsfo
rm
Det
ecto
rF
eatu
reS
igni
fican
ceM
apE
ncod
er
Sig
nific
ance
Map
Dec
oder
Enc
oder
Em
bedd
ed
Sig
nific
ance
Map
Dec
oder
Sig
nific
ance
Map
Dec
oder
Dec
oder
Em
bedd
edIn
vers
eW
avel
etT
rans
form
Vis
ualiz
atio
nS
ubsy
stem
Prio
rity
Sch
edul
erP
riorit
yS
ched
uler
� �
� ��
��
��
� �
�
� � � �
� � � ��
� �
� �
� � � �
! " # $
CH
AN
NE
L
CH
AN
NE
L
Use
r C
ontr
ol C
omm
ands
Tra
nsco
der
Con
trol
ler
CH
AN
NE
L
CH
AN
NE
L
Figure 1: EVITA - A Prototype System for Effective Visualization and Interrogation of Terascale Datasets. Legend:φ scalar or vector data field, G discrete grid, S significance map, B bitstream. x̃ denotes encoded (compressed)quantities, x̂ reconstructed (decompressed) quantities, x′ reordered (transcoded) quantities, and xw wavelet-domainquantities.
3
Technical Report MSSU-COE-ERC-01-02, Engineering Research Center, Mississippi State University, November 2000

The final component of the system, the client, decodes the reorganized bitstream arriving from the server, pro-duces the visualization, and accepts user feedback in the form of ROI specification. The decoding process producesfrequent reconstructions of the dataset as additional information is received from the server; these reconstructions aresuccessively fed to the visualization subsystem which updates the current rendering of the dataset.
Development of the system is based upon advances in wavelet transforms, scalar- and vector-field analysis, pro-gressive and embedded encoding, and visualization toolkits. The EVITA system is applicable as a general visualizationenvironment for terascale datasets with underlying structure similar to that for which the system is primarily designed.The application-specific components of the system lie merely in the feature-detection algorithm and in the generationof the significance map—aside from these two modules, the system, as proposed, is amenable to many visualizationtasks.
In what follows, we present an overview of the EVITA system, describing ongoing design efforts in significance-map generation, data-grid coding, and visualization interfaces and presenting preliminary results obtained from thecurrent system implementation.
3. Significance Map GenerationCritical to the success of the EVITA system is a mechanism for locating application-specific features in the data andgenerating a ranking of the identified features. We propose to address the issue of ranked access through a procedureculminating in the generation of a four-dimensional significance map. The first step is identification of the desiredfeatures within the dataset. This step is equivalent to an initial specification of ROIs. By considering time-varying data,complexity is added because, once identified, features must be tracked across multiple time levels. The features canthen be ranked according to an appropriate criteria. In the completed prototype system, a four-dimensional significancemap will be generated that will be used to establish the baseline priority schedule for the encoding. Here we describetechniques to generate a two-dimensional significance map for a steady-state, two-dimensional vector field. The dataemployed here is from the equatorial region of the Pacific Ocean generated using the Naval Layered Ocean Model [9].
3.0.1 Linear Lifting Scheme for Vectors
An extension of the linear lifting scheme to perform the wavelet transform for vector data is discussed in this section.Intentionally, a simple scheme was chosen for this effort. More details on the lifting scheme can be found in [10]. Thelifting scheme consists of three steps: split, predict, and update. For the linear lifting scheme, the filter coefficients em-ployed during the predict stage are g = {0.5, 1.0, 0.5}, while the coefficients for the update stage are h = {0.25, 0.25}.The wavelet transform is applied to each component of the vector in an independent fashion. A multi-dimensionalwavelet transform is achieved by applying a sequence of one-dimensional wavelet transforms first along rows and thenon columns. Each level yields four subbands representing horizontal, vertical and diagonal frequencies.
3.0.2 Feature Detection in Flow Datasets
Computational fluid dynamics (CFD) datasets typically contain one or more features of interest. These features, withspecific fluid dynamic characteristics, include shocks, vortices, flow separations, etc. The focus here is on featurescharacterized by a swirling motion suggested by rotation of fluid particles about a common center, either fixed ormoving.
Berdahl and Thompson define a derived scalar quantity called swirl which can be used to identify features char-acterized by swirling flow such as vortices [11]. In this procedure, a scalar value based on the local velocity andvelocity gradients is assigned to each field point. The swirl value is interpreted as the tendency for the fluid to swirlat a given point. Contiguous regions of nonzero swirl values can therefore be thought of as distinct features. Coreregions of vortices are characterized by larger swirl values. This methodology can be contrasted with those methodsthat determine critical points and then connect them with curves [12] or seek to locate vortex core regions [13].
A three-dimensional velocity field is characterized by the vector V = [u, v, w]T at each point (x, y, z) in the
domain. The velocity gradient tensor describes the spatial variation of the velocity field at a point and is given by:
Γ =
∂u∂x
∂u∂y
∂u∂z
∂v∂x
∂v∂y
∂v∂z
∂w∂x
∂w∂y
∂w∂z
. (1)
4
Technical Report MSSU-COE-ERC-01-02, Engineering Research Center, Mississippi State University, November 2000

(a) (b)
Figure 2: (a) Original velocity field (magnitude) (b) swirl field.
A necessary condition for the occurrence of swirling motion is the existence of a region of complex conjugate pairs ofthe eigenvalues of Γ. Associated with the complex eigenvalues is a cyclical motion with a period that is proportionalto the magnitude of the imaginary component of the eigenvalues. This period can be computed using
torbit =2π
|Im (λ1,2) | . (2)
An additional consideration is that a fluid particle may convect out of a region of complex eigenvalues beforeswirling motion is apparent. Computing the time required to traverse the region of complex eigenvalues is problematicsince it would require a detailed particle trajectory computation. If d is the characteristic length associated with thesize of the region of complex eigenvalues and Vconv is the magnitude of the average velocity along d, then a simpleestimate for the convection time is given by
tconv =d
Vconv. (3)
The convection velocity Vconv is taken to be the velocity in the plane containing the swirling motion, i.e., the planenormal to the real eigenvectors at the point in question. The length d is typically taken to be unity.
The swirl parameter τ is then defined as the ratio of the time for a fluid particle to convect through the region ofcomplex eigenvalues to the orbit time
τ =tconvtorbit
=|Im (λ1,2) |
2πVconv. (4)
For small values of τ , the fluid convects too rapidly through the region of complex eigenvalues to be captured in theswirling motion. In regions of large τ , the fluid is trapped in a swirling motion. It is to be noted that the swirl valuesin this work are calculated as the logarithm of the formula given in Equation 4. More details can be found in [11].Images showing the magnitude of the original vector field and the swirl field for a portion of the equatorial region ofthe Pacific Ocean [9] are shown in Figures 2(a) and (b), respectively. Of particular significance is the fact that regionsof high velocity, as denoted by lighter shades in Figure 2(a), do not necessarily correlate with regions where the fluidis swirling.
3.0.3 Multi-Scale Significance Map Generation
The image in Figure 2(b) showing the swirl parameter calculated on a two-dimensional grid of dimension N 2 is calleda significance map and is denoted by
Ssingle = {s (i, j) |j = 0 . . . N − 1, i = . . . N − 1} . (5)
5
Technical Report MSSU-COE-ERC-01-02, Engineering Research Center, Mississippi State University, November 2000

The significance map delineates regions of interest (ROI) in the vector field of size N × N at a single resolution,usually the finest. However, the wavelet coefficient pyramid
WL = {wk (i, j) |k = 0 . . . L− 1, j = . . . N − 1, i = . . . N − 1} (6)
obtained from the L-level wavelet transform of an N × N -sized vector field using the lifting scheme is arranged atmultiple resolutions (multi-scale). Thus, the single resolution significance map Ssingle cannot be directly used to rankthe wavelet coefficients wk (i, j). This section focuses on the generation of a multi-scale significance map,
SL = {sk (i, j) |k = 0 . . . L− 1, j = . . . N − 1, i = . . . N − 1} (7)
that can directly be used on the multi-scale wavelet coefficient mask WL to determine the significance of the waveletcoefficients in terms of their contribution to feature preservation, thereby allowing ranked access to features.
3.0.4 Approximate Reconstruction of Features (Swirl)
To generate a multiscale significance map, it is necessary to perform a feature detection at each scale. The swirldetection algorithm described previously requires the computation of the velocity as well as the velocity gradient ateach point in the domain. Therefore, it is necessary to compute approximations to these quantities using only the local,compressed representation of the data.
A new method for approximately reconstructing the velocity and the velocity gradient using only data in thewavelet domain is now described. This technique corrects for the effects of the linear lifting scheme and truncationerror and is based on techniques used in multigrid solution algorithms [14].
Let the wavelet approximation obtained after an n-level wavelet transformation of a scalar quantity uj,l definedon the grid xj,l be represented by uj−n,l. The corresponding coarser grid is xj−n,l and ∆xj−n = 2n∆xj . Considerfirst the correction needed to account for the difference in truncation error in finite difference approximations of thegradient using the same data on two different levels.
A second-order, central difference approximation to the gradient of u on mesh xj,l is given by
du
dx|xj,2l =
δuj,2l2∆xj
+1
6
d3u
dx3|xj,2l∆x2
j +O(∆x4
j
)(8)
where the central difference operator is defined using
δuj,2l = uj,2l+1 − uj,2l−1 . (9)
This approximation is consistent with most CFD solutions which typically have second-order spatial accuracy. Nowsubsample the same data on mesh xj−1,l to obtain
du
dx|xj−1,l
=δuj−1,l
2∆xj−1+
1
6
d3u
dx3|xj−1,l
∆x2j−1 +O
(∆x4
j−1
). (10)
Although the difference approximations are of the same formal order of accuracy, there is a difference in the truncationerror due to the difference in the mesh spacing. This suggests adding a correction term to improve the accuracy ofgradients computed on the coarser meshes. The following result is obtained using Equations 8 and 10 and generalizingto n levels:
δuj,2nl2∆xj
=δuj−n,l2∆xj−n
− 1
6
(4n − 1
4n
)d3u
dx3∆x2
j−n +O(∆x4
j−n). (11)
Equation 11 specifies the correction that should be added to the central-difference approximation on level j − n sothat it is equivalent to the central-difference approximation on level j to the order of the approximation. A standardsecond-order, central-difference can be used to approximate the third-derivative term.
Now consider the correction to the transformed quantity u needed to remove the effects of the linear lifting scheme.Substituting the definition of the detail coefficients in the update step [15] yields:
uj−1,l =1
8(−uj,2l+2 + 2uj,2l+1 + 6uj,2l + 2uj,2l−1 − uj,2l−2) . (12)
6
Technical Report MSSU-COE-ERC-01-02, Engineering Research Center, Mississippi State University, November 2000

Using a Taylor series to expand Equation 12 about xj,2l, yields:
uj,2l =
(1 +
∆x2j−1
16
d2
dx2+O
(∆x4
j−1
))uj−1,l . (13)
Through recursive application of Equation 13, a result generalized to n levels may be obtained:
uj,2nl =
(1 +
∆x2j−n
16
(n−1∑
k=0
1
4k
)d2
dx2+O
(∆x4
j−n))uj−n,l . (14)
Equation 14 represents an approximation to the data on level j computed using only quantities defined on level j − n.Note, however, that this expression also acts as a filtering mechanism because only frequencies that can be resolvedby the mesh on level j − n are included in the approximation.
To complete the process, a correction must be made to the second derivative approximation similar to the onegiven above for the first derivative. The resulting expression is given by
uj,2nl =
(1 +
1
16
(n−1∑
k=0
1
4k
)δ +O
(∆x4
j−n))uj−n,l (15)
where the operator δ is defined by
δ = δ2 − 1
12
(4n − 1
4n
)δ4 (16)
and δ2 and δ4 are standard second and fourth difference operators given by
δ2uj,l = uj,l+1 − 2uj,l + uj,l−1 (17)
and
δ4uj,l = uj,l+2 − 4uj,l+1 + 6uj,l − 4uj,l−1 + uj,l−2 (18)
respectively.The resulting procedure to compute approximations to the velocity and velocity gradients using only transformed
data is implemented as follows:
• Compute an approximate reconstruction to the velocity components at the current level using Equation 15.
• Compute the gradients using these reconstructed values using Equation 11.
• Use these reconstructed values and gradient approximations to compute the swirl.
Current work includes design of new wavelet transforms that preserve better the nature of the physical simula-tions. [16]. Additionally, other features besides swirling motion are being considered for detection and ranking.
3.0.5 Denoising the Data and Significance Map
The presence of oscillations in the original data can result in detection of spurious features during significance mapgeneration. Laplacian smoothing can be used for this purpose prior to the generation of a significance map [15]. Noisein the significance map Sk is also removed based on the persistence of features across scales.
3.0.6 Ranking of Features
The significance map denoting the regions of interest (ROI) can distinguish distinct regions based on the swirl values.However, the significance map does not indicate if one ROI is more important than the other. The next step is to rankthe features in the significance map and use the map to prioritize the wavelet coefficients wk(i, j) from each ROI. Thisrequires segmentation of the significance map and application of a criteria to rank the features.
7
Technical Report MSSU-COE-ERC-01-02, Engineering Research Center, Mississippi State University, November 2000

3.0.7 Segmentation
The segmentation process involves identifying different swirl regions in the significance map and assigning each alabel to facilitate later access. Here, a feature is defined as a set of connected points that have non-zero swirl and aresurrounded by a zero-swirl region. A simple two-pass scanline algorithm similar to those used in image processing [17]is used for segmentation of the significance map.
3.0.8 Ranking of Regions
In this effort, three ways for ranking regions are explored. These include ranking based on the size of the feature, onthe average strength of the feature, and on the persistence of a feature across scales. For a two-dimensional case, thesize of a region is measured as the number of grid points contained in a swirling region. The strength of a feature iscalculated as the sum of swirl values in the region of interest. A ranking based on size and strength is then applied tothe single resolution significance map. The multiscale significance map is then obtained from the segmented singleresolution map using the algorithm described in Section 3.0.2.
The final approach to rank features that is considered here assigns a feature that persists across scales a higher rankthan a feature that persists across a smaller number of scales. To quantify the persistence of a feature across scales,it is necessary to track the feature across scales. A simple tracking is conducted by checking for the intersection offeatures in one scale with the features in other scales. If the intersection area is greater than certain threshold, it islikely that they are the same features at different scales because they exist at the same spatial location. The algorithmalso allows for the possibility that features are created or destroyed. Details of the algorithm are given in [15]. At theend of the tracking process, features that exist from coarsest scale onwards get a higher rank compared to those thatappeared only at finer scales.
In the following section we describe how the ranking of ROIs is used to influence a priority schedule among thewavelet coefficients obtained from the various ROIs. This will facilitate the realization of embedded and progressiveaccess for large datasets.
4. CodingThe EVITA system employs state-of-the-art compression techniques that have originated in the image- and video-coding communities. In order to support user-defined priority-based access to ROIs within the compressed dataset, thedesign methodology underlying the EVITA system is a combination of embedded coding and object-based coding.
Embedded coders produce compressed representations at a variety of amounts of compression, where each ofthese representations are included (“embedded”) at the beginning of a single output bitstream. That is, any prefixof an embedded bitstream can be decoded to produce a valid compressed representation of the original dataset; thelonger the prefix, the more accurate is the representation. The fundamental tenant of embedded coding is therefore toput the most important information first in the encoded output. In the EVITA system, the significance map is used inconjunction with user input to dynamically determine a current priority schedule governing the order of occurrence ofinformation in the encoded bitstream.
In the EVITA system, embedded coding ranks information within a single ROI; to permit rankings among mul-tiple ROIs, the EVITA system employs object-based coding. The philosophy underlying object-based coding is thatcontextually salient portions of a dataset are coded individually, so that decoding can be restricted to desired portionsonly. In object-based coding, this random access is supported from a single encoding, without knowledge of whichportions are desired in advance of coding or the need for multiple encodings as the user’s interests change.
In general terms, the compression procedure within the EVITA system follows the modern embedded-codingparadigm of wavelet transform, successive-approximation quantization, and entropy coding. Specifically, the EVITAsystem extends the coder developed in [18] for the coding of three-dimensional ocean-temperature datasets. Below,we describe some salient aspects of the EVITA encoding and decoding algorithms.
4.0.9 Shape-Adaptive Wavelet Transform
In the EVITA system, each ROI is encoded individually by applying a wavelet transform, successive-approximationquantization, and entropy coding only to the information in the dataset belonging to that ROI. This ROI-based codingis somewhat more complicated than traditional compression algorithms since ROIs may be arbitrarily shaped in three-dimensional space, and this shape may evolve over time (i.e., an arbitrary “shape” in four-dimensional time-space),whereas traditional compression methods are typically restricted to rectangular shapes.
In the EVITA system, individual coding of ROIs starts with a shape-adaptive wavelet transform (SAWT), suchas that recently adopted by the MPEG-4 standard [19]. Essentially, a SAWT is identical to a usual discrete wavelet
8
Technical Report MSSU-COE-ERC-01-02, Engineering Research Center, Mississippi State University, November 2000

transform, except at the boundaries of an arbitrarily-shaped ROI, where a symmetric extension adapted to the shapeof the ROI is employed. In the EVITA system, we use a lifting implementation of a SAWT as described in [18]; thistransform is quite similar to the filter-bank implementation specified by MPEG-4 and described in [19].
For vector-valued data fields, the transform of [18] can be applied to each vector component individually. Alterna-tively, multiwavelets [20] can be used to construct more general vector-valued wavelet transforms (VWTs) [21] whichcan also be made shape-adaptive. Whether the latter approach can offer performance superior to that of the former isan open question and is a focus of our current investigations.
4.0.10 Successive-Approximation Quantization
For scalar sources, the EVITA system employs the successive-approximation runlength (SARL) coding techniquedescribed in [18]. SARL consists of “bitplane coding,” wherein each wavelet coefficient is compared to a threshold,a bit is output to indicate whether the coefficient is greater than the threshold (i.e., a significant coefficient) or not(i.e., an insignificant coefficient), the threshold is halved, and the process is repeated. Thus, coefficients of an ROIare coded in a series of successive “bitplanes,” starting with the most-significant bits of all coefficients in the ROIand progressing to the lesser-significant bits in order. For efficient representation, groups of successive insignificantcoefficients are coded together using runlengths, and then the entire symbol stream is subjected to multiple-contextadaptive arithmetic coding. SARL is particularly well suited to use in the EVITA system since it is computationallyquite simple, easily deployed regardless of the dimensionality of the data, and scales well as dataset size increases (thememory usage of the “significance lists” of many popular wavelet-based algorithms such as [22] may quickly growprohibitive as the size of datasets increases).
As with the wavelet transform, the straightforward solution for the successive-approximation coding of vector-valued data is to apply SARL individually to each vector component. However, more general vector-quantization (VQ)equivalents of scalar successive-approximation quantization do exist—multi-stage VQ (MSVQ) in particular, has beenproposed frequently (e.g., [23]) for successive-approximation VQ (SAVQ). We are currently exploring performanceof this and other SAVQ coders within the SARL framework described above.
4.0.11 Transcoding
Whereas the preprocessor produces an efficient embedded encoding of each ROI suitable for initial preview represen-tations, the server is critical to the online, interactive exploration of the dataset because it is within the server that theROI processing takes place. The key component of the server is the transcoder. In general, a transcoder is a processorthat converts, or translates, data encoded in one encoding into another encoding. The transcoder in our system isdesigned to minimize computation in order to maximize interactive response; as a result, the transcoder essentiallyimplements merely a reordering of bits present in the compressed bitstream. 1
As mentioned above, the successive-approximation coding of wavelet coefficients is composed of a series ofbitplanes for each ROI. In the encoder of the preprocessor, the bitplanes of all the ROIs in the dataset are “interleaved”in some order and stored in an output bitstream. The order of the bitplanes in the bitstream is dictated by the relativepriorities among the ROIs as specified by the significance map; this “default” ordering is intended to provide a suitable“preview” visualization if decoded as is. However, the location within the bitstream of each bitplane of each ROI isnoted and output as a priority schedule by the encoder.
When the interactive visualization process commences, the transcoder initially transmits each bitplane to theclient in the same order as the bitplanes are found in the compressed bitstream constructed previously by the encoder.However, when the server receives a request from the user to change the current ROI ranking, the transcoder usesthe priority-schedule information to quickly locate the bitplanes of the newly selected ROI(s) so that they may betransmitted to the client immediately (or as soon as the new priority schedule dictates). Implementation of the viewfrustum essentially follows the same procedure as ROI selection; that is, ROIs outside the current view frustum aregiven the smallest priority, and a change in view frustum moves bitplanes of newly revealed ROIs to the start of thepriority list.
4.0.12 Decoder
In essence, the decoder in the client of the EVITA system serves to reverse the operations performed by the transcoderin the server and the embedded encoder in the preprocessor. The goal of the decoder is to extract wavelet coefficientsfor each ROI from the received bitstream, to reconstruct each ROI via inverse quantization and inverse transform, andfinally to “composite” the ROIs together into a representation of the dataset. Since ROI and view-frustum information
1A similar process is proposed in the JPEG-2000 standard [24], wherein it is referred to as “parsing.”
9
Technical Report MSSU-COE-ERC-01-02, Engineering Research Center, Mississippi State University, November 2000

originates at the client by way of user interaction, the decoder knows at any given time the ROI priority schedule underwhich the transcoder is operating. Consequently, the ordering of the bitplanes in the received bitstream is known tothe decoder at all times.
The decoder interacts with the visualization subsystem by producing frequent reconstructions of the datasetthroughout the time that information is being received from the server. In the current implementation of the sys-tem, the decoder performs the reconstruction process after each bitplane is received from the server, although otherarrangements are possible.
4.0.13 Grid Coding
Although the above discussion focuses on the embedded encoding of wavelet coefficients from the data field, anidentical approach can be applied directly to curvilinear grid points. That is, the point locations of a curvilinear grid(an array of three-dimensional vectors) are treated just as if they were a vector-valued data field—the grid is subjectedto the SAWT and SARL coding procedures described above. Then bitplanes of grid information are “interleaved” withthe bitplanes of data-field information and output in the embedded bitstream produced by the encoder.
It is an open question as to how “fast” the grid information needs to be transmitted to the client. That is, theserver sends bitplanes to the client to refine both the data field and grid simultaneously. Because the number of gridpoints is the same as the number of data-field points, the simplest approach would to refine both the grid and thedata equally fast; i.e., to interleave data and grid bitplanes in a one-to-one fashion. However, because at least somecrude representation of a large number (perhaps all) of the grid points may be necessary to make even an initialpreview representation possible, we suspect that the best interleaving will need to include a a large number of gridbitplanes initially, delaying many data-field bitplanes to later in the stream. Our initial investigations have confirmedthis suspicion and seem to indicate that a large majority of the initial bits transmitted to the client need to be grid,but, after some initial time, a one-to-one mixture is warranted. We are currently devising and testing algorithms todetermine optimal interleaving mixtures for data and grid dynamically as part of the transcoding operation.
4.0.14 Time-Varying Datasets
Time-varying datasets will be coded by merely considering time as a “fourth dimension” and employing a four-dimensional SAWT. The SARL-coding procedure generalizes to four-dimensional data trivially, while the transcoderis unaffected by the dimensionality of the data.
5. Visualization InterfacesThe hallmark of a useful interactive system is consistent, reliable response to user input. This is a particularly dauntingchallenge in terascale visualization. In order to achieve this requirement, the user interface will be designed withasynchronous communication mechanisms and an interrupt-driven event loop. Priority driven incremental rendering(based on feature rank) will be supported and user input will be processed at a continuous rate, with interruption ofthe rendering process possible at any time. Caching of graphics primitives will allow information to be deliveredincrementally. The cache size will be specified at runtime to support graphics platforms of different capabilities.
Additionally, the user interface must support navigation schemes and standard visualization operations such asisosurfacing, streamline generation, cut or probe surfaces, and color mapping. Navigation schemes will enable:
• traversal in three-dimensional space (gaze directed frustum with clipping planes) , time (e.g linear scrollbar) ,and feature space (scalar and vector field parameters)
• identification and specification of ROI using mouse clicks and picking operations
• automated generation of camera paths and traversal in three-dimensional space, time, and feature space, as wellas identification and specification of ROI, including automated generation of camera paths and animations
• facilities for keyframing the evolution of ROI in space and time to enable offline, higher resolution generationof images and animations.
Information about neighboring regions will be displayed to allow for selection content-rich browsing. The dis-played information can include statistics about number or density of feature-rich ROIs in various subvolumes alongvarious directions relative to the current position. Such information can be determined by the preprocessor.
Finally, given the nature of ranked access of features, the system will support parceling of the original grid andtransmission of the data field simultaneously with its corresponding grid points. The user can stop this progressive
10
Technical Report MSSU-COE-ERC-01-02, Engineering Research Center, Mississippi State University, November 2000

(a) (b)
(c) (d)Figure 3: Pacific dataset visualization—default bitplane order as output from encoder. (a) 5th frame, (b) 9th frame, (c)16th frame, (d) 24th frame.
transmission at any time, or, as the progressive access continues across scales, the user can demand higher fidelity ofeither field or grid representation.
We plan to use vtk [25] for its extensive visualization capabilities and engineer the user interface to exploit itsinteractive capabilities. Currently, only a primitive user interface exists for one to view the results of feature detectionand progressive access of the data.
6. Preliminary ResultsWe now illustrate the EVITA system through a two-dimensional example. Figures 3 and 4 depict a visualization of atwo-dimensional image of a simulated turbulent region in the Pacific Ocean [9] that was obtained from an analysis ofthe velocity field. This region roughly corresponds to the upper left quadrant of Figures 2(a) and (b). The renderingsare the scalar swirl parameter [11] mapped into a grayscale image. The swirl parameter is a measure of bulk rotationof fluid with a “large” value of the parameter indicating a highly rotational region; white in Figures 3 and 4 indicates“large” swirl value.
Figure 3 shows several images from the sequence of images produced by the visualization of the reconstructedswirl data using the “default” order of the bitplanes, that is, the order of the bitplanes as output originally from theoffline encoder. In this default bitplane order, a bitplane is output for each ROI (including the background “ROI”) inturn, resulting in refinement of all portions of the dataset equally as fast.
On the other hand, Figure 4 shows the effect on the visualization when one of the ROIs is selected by the userand given priority. In this simple example, the user selects the particular ROI at the start of the visualization process,and all bitplanes of the selected ROI are given priority over all other bitplanes (i.e., the entire ROI is sent before the
11
Technical Report MSSU-COE-ERC-01-02, Engineering Research Center, Mississippi State University, November 2000

(a) (b)
(c) (d)Figure 4: Pacific dataset visualization—ROI selected by user at start of visualization process and all bitplanes ofselected ROI sent before rest of dataset. (a) 5th frame, (b) 9th frame, (c) 16th frame, (d) 24th frame.
rest of the dataset); however, the EVITA system will support ROI selection at any time throughout the visualizationsession, and the priority increase given to the bitplanes of the ROI may be more gradual. In any event, it can be seenin Figure 4 that, after an ROI is selected, the system produces a quick refinement of the desired ROI, while refinementof the rest of the dataset is delayed. Regardless of the priority schedule in effect at the initial stages of the process, thevisualization produced when all of the dataset is received is identical to the visualization of the full dataset.
7. SummaryLarge Data Visualization is an ominous task. We presented one possible methodology to facilitate the exploration oflarge datasets. The solution is embodied in prototype system, EVITA, that is under continuous development. EVITAwas conceived to allow the continuous exploration of large datasets that are generated from simulations of complexphysical phenomenon. Additionally, it will strive to achieve a compressed representation of both scalar and vectorfields and the underlying grid that describes numerically the physical phenomenon. To achieve both goals, a pre-processing stage constructs an embedded bit-stream that includes the most significant data first. A general overviewof the system was described in Section 2. A client-server model can be possibly deployed to allow a user to exploreinteractively a large dataset. The user and hence the client can receive from the server only chosen sub-domains of thefield which when reconstructed in a streaming manner allows viable visualization.
Our solution requires the generation of a four-dimensional significance map. Ideally, the significance map ofa field will segment the spatial and temporal domains into disjoint Regions-Of-Interests (ROIs) that are tracked intime. Additionally, a ranking is obtained among the various ROIs to allow progressive access. The ROI detectionand ranking is achieved by performing a multiscale feature detection. A wavelet transform creates a multiresolution
12
Technical Report MSSU-COE-ERC-01-02, Engineering Research Center, Mississippi State University, November 2000

version of the field. The field, then, at the coarsest level, is used to measure the strength of specific features. In thiswork we describe how bulk macroscopic swirling motion can be located and measured. After a process of denoisingand segmentation, the regions are delineated and a final ranking is obtained by either determining the total area or swirlin each region or by observing the persistence of these regions across scales. This process is discussed in Section 3.
To achieve compression of the fields, data in each of the ROIs is subjected to a shape-adaptive wavelet transform(SAWT). SAWTs allow the transformation of fields in arbitrary-shaped ROIs. Additionally, successive-approximationrun-length (SARL) techniques allow the establishment of a priority schedule as dictated by the ROI ranking. Sucha bitplane coding scheme allows the generation of a bitstream that is amenable to partial reconstruction. Interactiveexploration can be enabled through the design of a scalable transcoder (server) and a decoder (client). The transcoderessentially shifts the bitstream to respond to the client’s preferential interest in certain domains. The decoder generatesfrequent reconstructions of the dataset as it obtains partial information from the server. In addition, the grid can alsobe coded and transmitted in the same way using similar techniques. The priority schedule of the field can be used todetermine one for the grid. More detail can be found in Section 4.
Section 5 describes possible interactors that will allow for useful exploration of the dataset. Currently, a simpleinterface exists that allows for the display of vector fields and rudimentary exploration. Preliminary results are de-scribed in Section 6 for a two-dimensional vector field depicting currents in the Pacific Ocean. Sample visualizationsusing two different priority schedules are included. One of the schedules is obtained from a ranking of the ROIs.
It should be noted that although this project is concerned with feature detection and coding of fields to aid visual-ization, many of the algorithms attempt to seek correlation in both spatial and temporal domains. In essence, they seekto mine and present features in a manner that best allows the user to understand a complex physical phenomenon.
8. AcknowledgmentsThis work is partially funded by the NSF under the Large Data and Scientific Software Visualization Program (ACI-9982344), an NSF Early Career Award (ACI-9734483), ITR Award (ACI-0085969), and the NSF/Mississippi StateUniversity Engineering Research Center for Computational Field Simulation. The authors would like to thank Balakr-ishna Nakshatrala for his significant contribution. A portion of the work reported here (Section 3) was conducted as histhesis work towards a MS degree in Computational Engineering at MSU. Additionally, Wei Li of MSU, contributed tothe preliminary results reported in Section 6.
References
[1] A. Jameson, “Computational Algorithms for Aerodynamic Analysis and Design,” Tech. Rep. 25th AnniversaryConference on Computer Science and Control, INRIA, Paris, 1992.
[2] F. Davoudzadeh, L. Taylor, W. Zierke, J. Dreyer, H. McDonald, and D. Whitfield, “Coupled Navier-Stokes andEquations of Motion Simulation of Submarine Maneuvers, Including Crashback,” in FEDSM97-3129, ASMEFluids Engineering Division Summer Meeting, Vancouver, B.C., Canada, June 1997.
[3] L. Kantha and S. Piacsek, “Computational Ocean Modeling,” in The Computer Science and Engineering Hand-book. 1997, pp. 934–958, CRC Press.
[4] J. S. Shang and D. Gaitonde, “Scattered Electromagnetic Field of a Reentry Vehicle,” Journal of Spacecraft andRockets, vol. 32, no. 2, pp. 294–301, March-April 1995.
[5] P. H. Smith and J. van Rosendale, “Data and Visualization Corridors,” Pasadena, CA., 1998, Report on the 1998DVC Workshop Series, Center of Advanced Computing Research, California Institute of Technology.
[6] G. W. Furnas, “Generalized Fisheye Views,” in Proceedings ACM SIGCHI Conference on Human Factors inComputing Systems, Pasadena, CA., 1986, pp. 16–23.
[7] G. G. Robertson, S. K. Card, and J. D. Mackinlay, “Information Visualization Using 3D Interactive Animation,”Communications of ACM, vol. 36, no. 4, pp. 57–71, April 1993.
[8] D. F. Jerding and J. T. Stasko, “The Information Mural: A Technique for Displaying and Navigating LargeInformation Spaces,” IEEE Transactions on Graphics and Visualization, vol. 4, no. 3, July-September 1998.
13
Technical Report MSSU-COE-ERC-01-02, Engineering Research Center, Mississippi State University, November 2000

[9] A. J. Wallcraft, “The Naval Layered Ocean Model Users Guide,” Tech. Rep. 35, Naval Oceanographic andAtmospheric Research Laboratory, December 1999.
[10] W. Sweldens, “The Lifting Scheme: A custom design construction of bi-orthogonal wavelets,” Tech. Rep.1994:7, Industrial Mathematics Initiative, Department of Mathematics, University of South Carolina, 1994.
[11] C. H. Berdahl and D. S. Thompson, “Eduction of Swirling Structure using the Velocity Gradient Tensor,” AIAAJ., vol. 31, no. 1, pp. 97–103, January 1993.
[12] J. Helman and L. Hesselink, “Representation and Display of Vector Field Topoloy in Fluid Flow Datasets,” IEEETransactions on Computers, vol. 22, pp. 27–36, August 1989.
[13] D. Sujudi and R. Haimes, “Identification of Swirling Flow in 3D Vector Fields,” in AIAA Paper 95-1715, AIAA12th Computational Fluid Dynamics Conference, San Diego, CA, June 1995.
[14] A. Brandt, “Multi–level adaptive technique (MLAT) for fast numerical solution to boundary value problems,” inProceedings of the Third International Conference on Numerical Methods in Fluid Mechanics, H. Cabannes andR. Teman, Eds., Berlin, 1973, vol. 18 of Lecture Notes in Physics, pp. 82–89, Springer–Verlag.
[15] B. Nakshatrala, “Feature-Based Embedded Representation of Vector Fields,” M.S. thesis, Mississippi StateUniversity, December 1999.
[16] D. Thompson, R. Machiraju, G. Craciun, and M. Jiang, “Feature Preservation Properties of Linear WaveletTransforms (submitted),” in Proceedings of the Yosemite Multiscale and Multiresolution Symposium, Yosemite,CA, 2000.
[17] Anil K. Jain, Fundamentals of Digital Image Processing, Prentice Hall, Englewood Cliffs, NJ, 1989.
[18] James E. Fowler and Daniel N. Fox, “Embedded Wavelet-Based Coding of Three-Dimensional OceanographicImages With Land Masses,” IEEE Transactions on Geoscience and Remote Sensing, 2000, to appear.
[19] Shipeng Li and Weiping Li, “Shape-Adaptive Discrete Wavelet Transforms for Arbitrary Shaped Visual ObjectCoding,” IEEE Transactions on Circuits and Systems for Video Technology, vol. 10, no. 5, pp. 725–743, August2000.
[20] Jeffrey S. Geronimo, Douglas P. Hardin, and Peter R. Massopust, “Fractal Functions and Wavelet ExpansionsBased on Several Scaling Functions,” Journal of Approximation Theory, vol. 78, no. 3, pp. 373–401, September1994.
[21] Xiang-Gen Xia and Bruce W. Suter, “Vector-Valued Wavelets and Vector Filter Banks,” IEEE Transactions onSignal Processing, vol. 44, no. 3, pp. 508–518, March 1996.
[22] Amir Said and William A. Pearlman, “A New, Fast, and Efficient Image Codec Based on Set Partitioning inHierarchical Trees,” IEEE Transactions on Circuits and Systems for Video Technology, vol. 6, no. 3, pp. 243–250, June 1996.
[23] Eduardo A. B. da Silva, Demetrios G. Sampson, and Mohammad Ghanbari, “Image Coding Using SuccessiveApproximation Wavelet Vector Quantization,” in Proceedings of the International Conference on Acoustics,Speech, and Signal Processing, Detroit, Michigan, May 1995, pp. 2201–2204.
[24] Michael W. Marcellin, Michael J. Gormish, Ali Bilgin, and Martin P. Boliek, “An Overview of JPEG-2000,” inProceedings of the IEEE Data Compression Conference, James A. Storer and Martin Cohn, Eds., Snowbird,UT,March 2000, pp. 523–541.
[25] W. J. Schroeder, Ken Martin, and Bill Lorensen, The Visualization Toolkit: An Object Orient Approach toComputer Graphics, Prentice-Hall, Englewood Cliffs, NJ, 1977.
14
Technical Report MSSU-COE-ERC-01-02, Engineering Research Center, Mississippi State University, November 2000