evidence of multidecadal salinity variability in the...
TRANSCRIPT

Evidence of multidecadal salinity variability in the eastern
tropical North Atlantic
Christopher S. Moses,1,2 Peter K. Swart,1 and Brad E. Rosenheim1,3
Received 13 December 2005; revised 25 March 2006; accepted 17 April 2006; published 17 August 2006.
[1] Ocean circulation and global climate are strongly influenced by seawater density, which is itself controlledby salinity and temperature. Although adequate instrumental sea surface temperature (SST) records exist formost of the surface oceans over the past 100–150 years, records of salinity really only exist for the last 40–50 years. Here we show that longer proxy records from corals (Siderastrea radians) in the eastern tropical NorthAtlantic are dominated by multidecadal variations in salinity which are correlated with the relationship betweenSST and the North Atlantic Oscillation (NAO) over the course of the 20th century. The data reveal an increase ineastern tropical North Atlantic salinity of +0.5 practical salinity units (psu) between about 1950 and 1990.Rather than a monotonic secular increase, as indicated by some instrumental records, the preinstrumental coralproxy records presented here suggest that salinity in the tropical North Atlantic is periodic on a decadal tomultidecadal scale.
Citation: Moses, C. S., P. K. Swart, and B. E. Rosenheim (2006), Evidence of multidecadal salinity variability in the eastern tropical
North Atlantic, Paleoceanography, 21, PA3010, doi:10.1029/2005PA001257.
1. Introduction
[2] Despite numerous instrumental based SST reconstruc-tions of local, regional, or global SST over the last �150years [Slutz et al., 1985; Smith and Reynolds, 2004], only ageneralized climatology exists for regional and globalsalinity [Conkright et al., 2002; Levitus et al., 1994], andmany instrumental salinity records only date back to themiddle of the 20th century [Curry et al., 2003; Zhang et al.,2003]. Longer records of salinity are needed for quantifyingmultidecadal salinity variability or preinstrumental trendsbecause of significant implications to ocean thermohalinecirculation [Boyle, 2000; Hakkinen, 1999; McManus et al.,2004; Schmidt et al., 2004], and global change [Boyle,2000; Broecker, 1994; McManus et al., 2004; Schmidt etal., 2004].[3] The Salinity Maximum Waters (SMW) of the North
Atlantic, generally located between 15�–30�N and 20�–50�W (Figure 1), have reportedly increased in salinity asmuch as 0.4–0.5 practical salinity units (psu) over the last40–50 years [Curry et al., 2003; Rosenheim et al., 2005].This increase might appear slight, and does not apply to theentire Atlantic (such as north of 40�N, where there has beena decrease in salinity [Curry et al., 2003]), but it representsa significant change in the freshwater input, or evaporationminus precipitation (E – P) balance over large sections ofthe Atlantic.
[4] Situated in the region of the strongest E – P gradients[Johnson et al., 2002; Schmitt et al., 1989], the Cape VerdeIslands are an excellent location to study such salinitychanges. Strong winds from the African continent, influ-enced by the North Atlantic Oscillation (NAO), create asteep gradient in salinity increasing to the north-northwestof the archipelago. The corals here display a strong seasonald18O signal from the subannual samples, and calibrations ofthe monthly d18O values to the monthly SST record [Moseset al., 2006] produce slopes in the range of other publishedvalues [Leder et al., 1996; Weber and Woodhead, 1972;Wellington and Dunbar, 1995]. However, when meanannual d18Ocoral values are calibrated to annual SST means,the relationships are nonsignificant because of excess var-iability not explained by SST alone [Moses et al., 2006],something that can explained by variable salinity.[5] Here we show that century length proxy records from
corals in the eastern tropical North Atlantic are dominatedby multidecadal variations in salinity which have beeninfluenced by SST and the NAO over the course of the20th century. The forcing by the NAO appears to benonstationary, perhaps in a spatial sense, on the centuryscale and changes its relationship with salinity variabilitybetween the time before and after 1930–1931. During theearly period, salinity variability persists by upwelling as theNAO influence strengthens in the Cape Verde Islands. Wepropose that interaction between the NAO and SST governchanges in regional upwelling, and the size, shape, andposition of the Salinity Maximum Waters of the NorthAtlantic.
2. Methods
[6] The two cores of the zooxanthellate coral, Siderastrearadians, discussed in this work, SAL-4 and SAL-6, werecollected only about 20 m from each other at Pedra de Lume
PALEOCEANOGRAPHY, VOL. 21, PA3010, doi:10.1029/2005PA001257, 2006ClickHere
for
FullArticle
1Rosenstiel School of Marine and Atmospheric Sciences, Division ofMarine Geology and Geophysics, University of Miami, Miami, Florida,USA.
2Now at College of Marine Science, University of South Florida, St.Petersburg, Florida, USA.
3Department of Geology and Geophysics, Woods Hole OceanographicInstitution, Woods Hole, Massachusetts, USA.
Copyright 2006 by the American Geophysical Union.0883-8305/06/2005PA001257$12.00
PA3010 1 of 12
(16�45.60N, 22�53.30W) on the island of Sal in the CapeVerde Islands (Figure 1) at a depth of 4–6 m. These coralshave annual extension rates of about 1.0–1.5 mm yr�1
[Moses et al., 2006] on the basis of sclerochronology[Hudson et al., 1976; Knutson et al., 1972] and the annualcycle in d18O. Corals were sampled for stable isotopeanalysis with a New WaveTM micromill by continuouslymilling across the thecal wall between two corallites.Setting the step increment of the micromill to 104 mmmaintained a sampling rate of 10–15 samples yr�1 despitethe subtle changes in growth rate within each coral and fromcoral to coral. The drilling was performed in a directionperpendicular to the axis of growth at each step increment,
progressing parallel to the axis of growth from step to step.Isotope analyses were performed at the University ofMiami, RSMAS Stable Isotope Lab, using a Thermo-FinniganTM DeltaPlus mass spectrometer coupled to a Kieldevice. The isotope values are corrected for the standardinterferences and reported in parts per thousand (%) relativeto VPDB (for d18Ocoral) and SMOW (for dw) in the con-ventional notation. The high-resolution samples were line-arly interpolated to 12 ‘‘monthly’’ values for comparison toclimate reconstructions (Figure 2).[7] The SST data set used in this study comes from the
National Climate Data Center (NCDC) Extended Recon-struction SST (ERSST) (version 2) with a monthly 2� � 2�data set spanning January 1854 to present [Smith andReynolds, 2004]. The NCDC ERSST data set for the gridcell centered at 16�N, 24�W was used for the local Sal SSTrecord in the absence of an otherwise complete instrumentalrecord. The NCDC data was calibrated with an in situthermistor (Hobo Tid-Bit Temp1) over 18 months. Overthat time, the root-mean-square (RMS) difference betweenthe gridded data set and the thermistor for monthly means is0.6�C. The NAO record used is that of Hurrell [1995] onthe basis of the December–March sea level pressure (SLP)difference between Stykkisholmur, Iceland and the Lisbon,Portugal. A formal long-term record of the IntertropicalConvergence Zone (ITCZ) latitudinal displacement does notexist. For the this project, a ‘‘dipole’’ index of the tropicalAtlantic, a measurement of the difference in mean SST in aregion north of the ITCZ (the tropical North Atlantic index)and the region south of the ITCZ (the tropical SouthAtlantic index), was used as an indicator of the relativeITCZ latitudinal displacement [Chiang et al., 2002; Enfieldand Mayer, 1997]. The correlation subperiods of 1910–1930 and 1931–2000 were chosen on the basis of a phaseshift seen in the relationship between calculated salinity andthe NAO instead of the changes in the relationship betweenSST and the NAO.[8] The significance of serial correlations was tested using
phase randomization methods [Ebisuzaki, 1997]. This phaserandomization method takes into account the effective
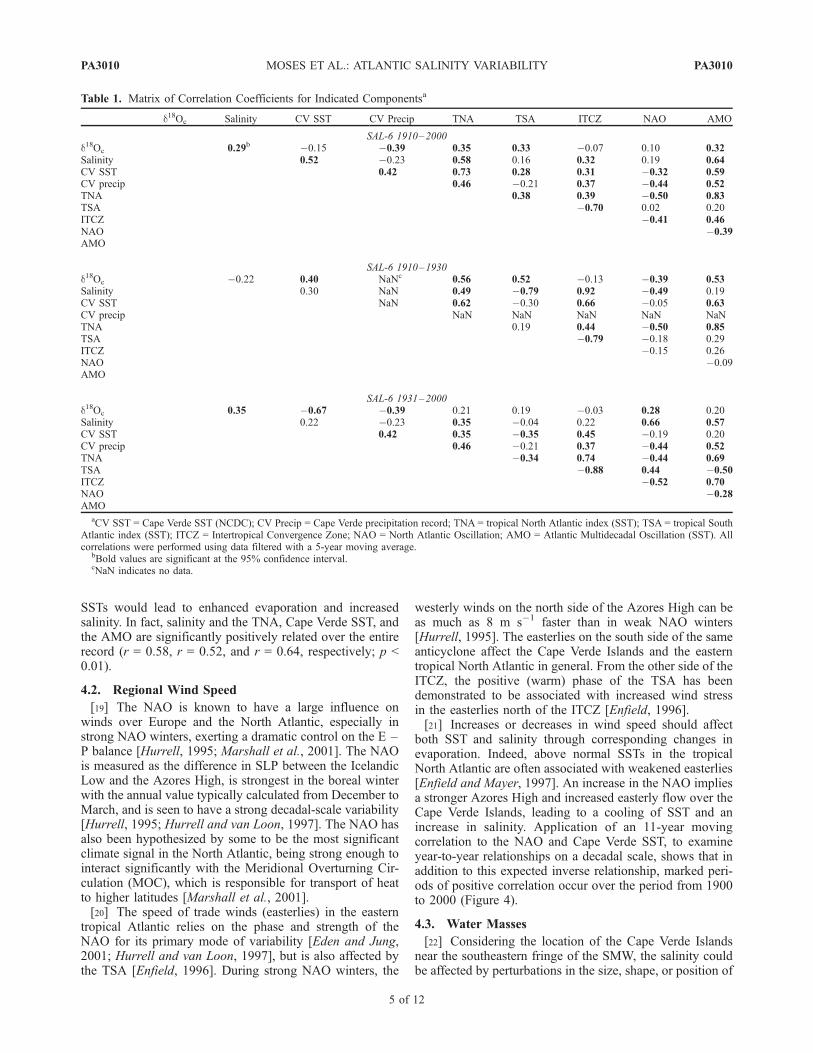
Figure 2. Monthly d18Ocoral record from coral SAL-4 (thick black line; N = 882) and concurrent CapeVerde SST (thin gray line). The scale for d18Ocoral has been inverted in the accepted manner. SST recordis from the National Climate Data Center (NCDC) Extended Reconstruction SST (ERSST), version 2(monthly) (http://iridl.ldeo.columbia.edu/SOURCES/.NOAA/.NCDC/.ERSST/.version2/).
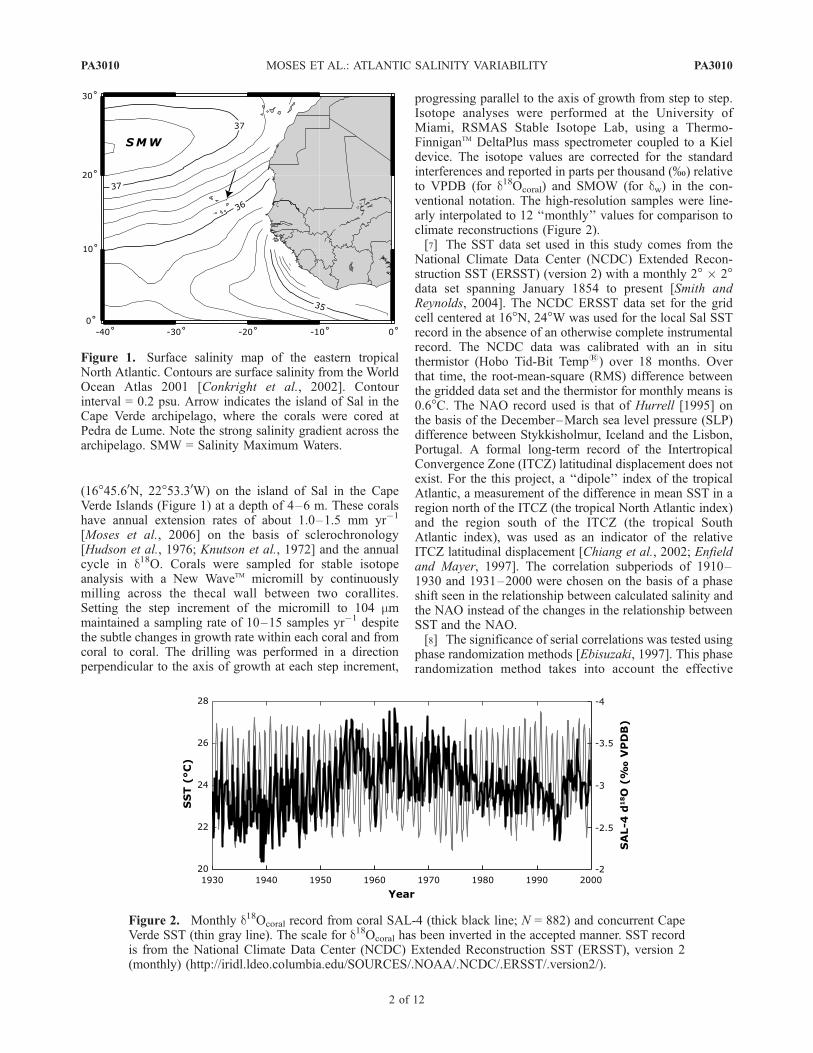
Figure 1. Surface salinity map of the eastern tropicalNorth Atlantic. Contours are surface salinity from the WorldOcean Atlas 2001 [Conkright et al., 2002]. Contourinterval = 0.2 psu. Arrow indicates the island of Sal in theCape Verde archipelago, where the corals were cored atPedra de Lume. Note the strong salinity gradient across thearchipelago. SMW = Salinity Maximum Waters.
PA3010 MOSES ET AL.: ATLANTIC SALINITY VARIABILITY
2 of 12
PA3010

degrees of freedom in a correlation, which can be reducedfrom the nomimal degrees of freedom (N � 2) as the natureof the data approaches that of a sine curve. All tests forsignificance were made at the 95% confidence interval.[9] Standard calibrations were used for SST – d18Ocoral
[Leder et al., 1996] and d18Owater – salinity [Ganssen andKroon, 2000] conversions, and error was propagatedthrough all the calculations [Schmidt, 1999]. The reproduc-ibility of an internal lab standard (KBC) through all the runsfor this project on the DeltaPlus was ±0.07% for TM18O,and ±0.09% for TM13C. This was included in the errorpropagation calculations. The full record length of 1900–2002 was truncated to 1910–2000 because of uncertaintiesin the oldest few years of one core, and the possibility of‘‘edge effects’’ from mathematical processing.[10] Oxygen isotope values recorded in the coral skeleton
are a function of both SST and the oxygen isotope ratio ofthe surrounding water (dw) [McCrea, 1950]. The SSTcomponent of d18Ocoral was isolated and removed by usingthe NCDC ERSST record and according to the SST –d18Ocoral equation [Leder et al., 1996]:
T �Cð Þ ¼ 5:33� 4:519 0:19ð Þ � d18Ocoral � dw� �
ð1Þ
[11] The Leder et al. [1996] equation was calibrated usingAtlantic corals (Montastraea sp.), and was used here in thisuntraditional manner to isolate SST in the absence of anacceptable Sr/Ca – SST calibration for S. radians. Afterremoving SST, the remaining residual d18Ocoral that is notexplained as a function of SST was attributed to variabilityin dw. Because of the lack of precipitation and mixing ofother waters, dw around the Cape Verde Islands is controlledby evaporation, and variability in dw should representproportional changes in salinity. For this work, dw variability,variability, as calculated in equation (1), was converted tosalinity deviations using an equation based on data for theupper 25 m presented by Ganssen and Kroon [2000]:
S ¼ 1:73 0:19ð Þdw þ 35:20 0:08ð Þ ð2Þ
[12] The end result of the error propagation [Schmidt,1999] (including error from analytical machines, instrumen-tal (NCDC) SST, and equations (1) and (2)) is a constanterror is cumulative such that the error in the final measure-ment of salinity deviation is estimated as ssal = ±0.31 psu.This final estimation of ssal is reflected in the error enve-lopes displayed with salinity records from these corals. Thevariables involved in the calculation of the error envelopeare constant in relation to the component equations used, sothey do not vary relative to an individual coral record orbetween corals in this project.
3. Results of Salinity Determination fromD18Ocoral
[13] After removing the SST portion of the d18Ocoral
signal using a standard SST – d18Ocoral calibration [Lederet al., 1996], the residual dw displays a systematic pattern ofdecadal to multidecadal variability over the period from
1900 to 2000 (Figure 3). The oscillation in dw representsproportional changes in the regional E – P balance,reflected in salinity differences (DS), thus relating thedw residuals to changes in the salinity around Cape Verde.About 76% of the year-to-year total variability of d18Ocoral isaccounted for by changes in salinity, with the remaining24% being attributed to year-to-year changes in SST(DSST). The RMS value of the year-to-year DS based ondw is 0.1 psu, with a maximum range of salinity variabilityof �1.1 psu, and @S/@t as high as ±0.5 psu decade�1. Thetotal variability of the salinity record is dominated evenly bythe multidecadal and decadal oscillations, rather than theinterannual frequency. The multidecadal (>25 year) spec-trum accounts for about 43% of the total variance in salinity,and the decadal (9–11 year) spectrum contributes 38% ofthe total variance in salinity. From the 1950s to the 1990s,the average DS is +0.1 psu decade�1, similar to valuesreported for the western tropical North Atlantic by instru-mental data [Curry et al., 2003] and sclerosponge proxyrecords [Rosenheim et al., 2005] in the western tropicalNorth Atlantic. Regional or basin-scale changes in thehydrologic cycle have been suggested to influence theadvection of high-salinity waters over century or longertimescales [Johnson et al., 2002; Schmidt et al., 2004].However, over decadal to multidecadal timescales, and inthe absence of substantial precipitation or hydrologicchanges around the Cape Verde Islands, these changes insalinity could be more likely attributed to a change inevaporation driven by SST and wind stress.[14] Over the period from 1910 to 2000, using data
filtered by a 5-year moving average, the salinity recordfrom coral SAL-6 displays a significant correlation of r =0.52 (p < 0.01) with SST in the Cape Verde Islands (Table 1).The salinity record also correlates positively with the twomajor North Atlantic SST indices, the tropical NorthAtlantic index (TNA) [Enfield et al., 1999] and AtlanticMultidecadal Oscillation (AMO) [Enfield et al., 2001;Schlesinger and Ramankutty, 1994] (r = 0.58 and r =0.64, respectively; p < 0.01 for both; Table 1).[15] The coral salinity record correlates significantly with
the annual mean relative north-south displacement of theITCZ (r = 0.32; p < 0.01). However, the derived salinityrecord has no correlation with Cape Verde precipitation(which has a record limited to the period from 1951 to1998) (Table 1). Over the entire period from 1900 to 2000,the coral salinity record also shows no significant response(r = 0.19; p = 0.07) to regional dynamics of SLP, which aredominated across the North Atlantic by the NAO.
4. Discussion
4.1. Atlantic Sea Surface Temperature
[16] The TNA, tropical South Atlantic index (TSA), andthe AMO are indices of sea surface temperature anomalies(SSTAs) over different ranges of the Atlantic Ocean. TheTNA is an index of the SSTA over the width of the Atlantic(including the Cape Verde Islands) from 5� to 25�N [Enfieldet al., 1999], while the AMO is an SSTA index over theentire North Atlantic from the equator to 70�N [Enfield etal., 2001; Schlesinger and Ramankutty, 1994]. The TSA
PA3010 MOSES ET AL.: ATLANTIC SALINITY VARIABILITY
3 of 12
PA3010

represents the southern hemisphere counterpart to the TNAfrom the equator to 20�S [Enfield et al., 1999]. The AMO isperhaps the most significant multidecadal SST oscillation inthe Atlantic, with a recognized periodicity of 65–70 yearswith an amplitude of about 0.4�C [Enfield et al., 2001;Schlesinger and Ramankutty, 1994].[17] Over the period of interest, from 1910 to 2000, using
the data from the 5-year moving average, the TNA and theAMO correlate with each other at r = 0.83 (p < 0.01), whilethe TSA and the AMO show no significant correlation.However, changes in the phases and strengths of the TNAand the TSA relative to each other and the AMO, result invariable correlation coefficients with time on a decadal tomultidecadal scale. As expected because of its location inthe tropical North Atlantic, Cape Verde SST correlates
significantly with both the TNA and the AMO (r = 0.73and r = 0.59, respectively).[18] Warmer SSTs, associated with the positive phase of
the TNA (TSA) are associated with a northward (south-ward) displacement of the Intertropical Convergence Zone(ITCZ), which in turn is linked to decreased trade windspeed and increased regional convection and precipitation[Andreoli and Kayano, 2004; Enfield et al., 1999; Nobreand Shukla, 1996]. Independent of wind speed, the elevatedSST would increase evaporation, but this is typically coun-tered by an associated increase in precipitation from en-hanced convection. However, the possible freshening ofsurface waters from the increased precipitation does notoccur because of the excess evaporation (E � P) around theCape Verde Islands. Thus a positive relationship betweenCape Verde SST and salinity could be expected as increased
Figure 3. Salinity reconstruction from d18Ocoral for corals SAL-4 and SAL-6. (top) Annual d18Ocoral
records for the two corals. (middle) The dw values for the two corals are calculated by removing the SSTcontribution to d18Ocoral. Correlation between the two corals is significant (r = 0.49, N = 74, p < 0.001),supporting the theory that dw variations account for the apparent lack of correlation to SST at the year-to-year scale. (bottom) Reconstructed salinity from dw and corresponding propagated error envelopes (ssal)for the two corals (SAL-4 in dark gray and SAL-6 in light gray). Salinity scale is normalized to modernclimatology.
PA3010 MOSES ET AL.: ATLANTIC SALINITY VARIABILITY
4 of 12
PA3010
SSTs would lead to enhanced evaporation and increasedsalinity. In fact, salinity and the TNA, Cape Verde SST, andthe AMO are significantly positively related over the entirerecord (r = 0.58, r = 0.52, and r = 0.64, respectively; p <0.01).
4.2. Regional Wind Speed
[19] The NAO is known to have a large influence onwinds over Europe and the North Atlantic, especially instrong NAO winters, exerting a dramatic control on the E –P balance [Hurrell, 1995; Marshall et al., 2001]. The NAOis measured as the difference in SLP between the IcelandicLow and the Azores High, is strongest in the boreal winterwith the annual value typically calculated from December toMarch, and is seen to have a strong decadal-scale variability[Hurrell, 1995; Hurrell and van Loon, 1997]. The NAO hasalso been hypothesized by some to be the most significantclimate signal in the North Atlantic, being strong enough tointeract significantly with the Meridional Overturning Cir-culation (MOC), which is responsible for transport of heatto higher latitudes [Marshall et al., 2001].[20] The speed of trade winds (easterlies) in the eastern
tropical Atlantic relies on the phase and strength of theNAO for its primary mode of variability [Eden and Jung,2001; Hurrell and van Loon, 1997], but is also affected bythe TSA [Enfield, 1996]. During strong NAO winters, the
westerly winds on the north side of the Azores High can beas much as 8 m s�1 faster than in weak NAO winters[Hurrell, 1995]. The easterlies on the south side of the sameanticyclone affect the Cape Verde Islands and the easterntropical North Atlantic in general. From the other side of theITCZ, the positive (warm) phase of the TSA has beendemonstrated to be associated with increased wind stressin the easterlies north of the ITCZ [Enfield, 1996].[21] Increases or decreases in wind speed should affect
both SST and salinity through corresponding changes inevaporation. Indeed, above normal SSTs in the tropicalNorth Atlantic are often associated with weakened easterlies[Enfield and Mayer, 1997]. An increase in the NAO impliesa stronger Azores High and increased easterly flow over theCape Verde Islands, leading to a cooling of SST and anincrease in salinity. Application of an 11-year movingcorrelation to the NAO and Cape Verde SST, to examineyear-to-year relationships on a decadal scale, shows that inaddition to this expected inverse relationship, marked peri-ods of positive correlation occur over the period from 1900to 2000 (Figure 4).
4.3. Water Masses
[22] Considering the location of the Cape Verde Islandsnear the southeastern fringe of the SMW, the salinity couldbe affected by perturbations in the size, shape, or position of
Table 1. Matrix of Correlation Coefficients for Indicated Componentsa
d18Oc Salinity CV SST CV Precip TNA TSA ITCZ NAO AMO
SAL-6 1910–2000d18Oc 0.29b �0.15 �0.39 0.35 0.33 �0.07 0.10 0.32Salinity 0.52 �0.23 0.58 0.16 0.32 0.19 0.64CV SST 0.42 0.73 0.28 0.31 �0.32 0.59CV precip 0.46 �0.21 0.37 �0.44 0.52TNA 0.38 0.39 �0.50 0.83TSA �0.70 0.02 0.20ITCZ �0.41 0.46NAO �0.39AMO
SAL-6 1910–1930d18Oc �0.22 0.40 NaNc 0.56 0.52 �0.13 �0.39 0.53Salinity 0.30 NaN 0.49 �0.79 0.92 �0.49 0.19CV SST NaN 0.62 �0.30 0.66 �0.05 0.63CV precip NaN NaN NaN NaN NaNTNA 0.19 0.44 �0.50 0.85TSA �0.79 �0.18 0.29ITCZ �0.15 0.26NAO �0.09AMO
SAL-6 1931–2000d18Oc 0.35 �0.67 �0.39 0.21 0.19 �0.03 0.28 0.20Salinity 0.22 �0.23 0.35 �0.04 0.22 0.66 0.57CV SST 0.42 0.35 �0.35 0.45 �0.19 0.20CV precip 0.46 �0.21 0.37 �0.44 0.52TNA �0.34 0.74 �0.44 0.69TSA �0.88 0.44 �0.50ITCZ �0.52 0.70NAO �0.28AMO
aCV SST = Cape Verde SST (NCDC); CV Precip = Cape Verde precipitation record; TNA = tropical North Atlantic index (SST); TSA = tropical SouthAtlantic index (SST); ITCZ = Intertropical Convergence Zone; NAO = North Atlantic Oscillation; AMO = Atlantic Multidecadal Oscillation (SST). Allcorrelations were performed using data filtered with a 5-year moving average.
bBold values are significant at the 95% confidence interval.cNaN indicates no data.
PA3010 MOSES ET AL.: ATLANTIC SALINITY VARIABILITY
5 of 12
PA3010

the SMW. Certainly, only a small enlargement (contraction)in size or a slight displacement of the SMW to the southeast(northwest) of the climatological position would be suffi-cient to impact the annual average salinity of the CapeVerde Islands. Despite implications such changes in size orlocation of the SMW would have for the formation of thehigh-salinity waters and transport of critical heat to northernlatitudes [Boyle, 2000], studies of the Atlantic SMW havenot addressed the possibility of such a migration or changein size [Blanke et al., 2002; Curry et al., 2003].[23] Additionally, the location of the Cape Verde Islands
on the eastern side of the North Atlantic, on the southboundlimb of the cyclonic North Atlantic Gyre, is in a zone proneto regional upwelling. The relatively shallow thermoclineand halocline bring cooler, fresher waters close to thesurface expression of the SMW in the eastern tropical NorthAtlantic. Reports have confirmed the periodic occurrence ofsuch regional upwelling in the eastern tropical North At-lantic in response to changes in regional wind stress [Santoset al., 2005].
4.4. Eastern Tropical North Atlantic SalinityOver the 20th Century
[24] Between 1910 and 2000, variability in the relevantSST indices can account for between 27 and 41% of thevariability seen in the geochemical record of salinity recov-ered from the coral skeletons. For the period from 1910 to2000 the strongest correlation of the coral salinity with anyclimate index is with the AMO (r = 0.64; p < 0.01; Table 1).Over the entire period, the recovered salinity record corre-lates with the TNA at r = 0.58 (p < 0.01), and with localCape Verde SST slightly less (r = 0.52; p < 0.01). Thismakes some intuitive sense, because of the smoothing effectwith each increase in incorporated index area. The AMOhas lower variability in the interannual spectrum comparedto the TNA which has less variability in the interannualspectrum than the Cape Verde SST record. The strength andsignificance of correlations between SST indices and therecovered salinity record vary over multidecadal periods.For example, the correlation of coral salinity records withthe TNA is stronger in the period between 1910 and 1930
Figure 4. Relationships between the NAO and Cape Verde SST. (top) Annual Cape Verde SST (NCDCERSST, version 2 (annual)). (middle) Annual NAO record from Hurrell [1995] (thin line with circles isannual value; thick lines are 5-year point-centered moving average). (bottom) An 11-year point-centeredmoving correlation (circles) of the NAO with Cape Verde SST shows dramatic and abrupt changes in thephase of the relationship between the NAO and SST over the last century. The thin gray lines representthe 95% confidence interval. The solid black lines labeled with the relative displacement of NAO centersof action (COA) are as reported from Jung et al. [2003].
PA3010 MOSES ET AL.: ATLANTIC SALINITY VARIABILITY
6 of 12
PA3010

(r = 0.49), a prolonged cool period, than from 1931 to2000 (r = 0.35), but is significant and of the same phase inboth sections of the record. The AMO and Cape Verde SSTboth lose their significant correlation with the coral salinityrecord during the period from 1910 to 1930. Overall, theTNA seems to be the most consistent predictor of salinitynear the Cape Verde Islands, explaining 12–34% of therecorded variability over the 20th century (Figure 5).[25] Wind patterns, and by extension evaporation, in the
eastern tropical North Atlantic are generally governed bythe NAO and the TSA [Enfield, 1996; Hurrell, 1995;Marshall et al., 2001]. Comparison of the NAO with thecalculated salinity deviation demonstrates a nonsignificant
correlation (r = 0.19) over the entire period from 1910 to2000 (Figure 5; Table 1). However, from 1931 to 2000 theNAO has a significant correlation (r = 0.66; p < 0.001),explaining 44% of the variability in the calculated DS. Thechange in NAO correlation to calculated salinity from priorto 1930 and after 1931 could imply century-scale non-stationarity in the influence of the NAO on eastern tropicalNorth Atlantic salinity, which would agree with previouslydescribed nonstationarity over several multicentury proxyrecords of the NAO [Appenzeller et al., 1998; Luterbacheret al., 1999].[26] Also noteworthy is the fact that between 1910 and
1930 the TSA displays a significant negative correlation
Figure 5. Comparison of reconstructed coral salinity records of SAL-4 and SAL-6 with the TNA andthe NAO. SAL-4 is the dark gray envelope; SAL-6 is the light gray envelope. (top) Coral salinity recordswith the TNA (squares). (bottom) Coral salinity records with the NAO (diamonds). NAO can be seen tocontinue to track the TNA during the early part of the century, but it is decoupled from the NAO duringthat period. Envelopes represent the coral salinity data and the propagated error (ssal) from the series ofcalculations involved. Correlation coefficients are reported in Table 1. Salinity scale is normalized tomodern annual climatology [Conkright et al., 2002; Levitus et al., 1994].
PA3010 MOSES ET AL.: ATLANTIC SALINITY VARIABILITY
7 of 12
PA3010

with calculated salinity (r = �0.79; p < 0.01), whereas itshows no significant correlation over the entire record or inthe period after 1930. This parallels the increase in signif-icance of the positive correlation between the TNA andcalculated salinity during the same period, as the ITCZ isdisplaced further southward than normal, anomalously cool-ing the tropical North Atlantic and warming the tropicalSouth Atlantic. The cross equatorial connection betweensalinity near the Cape Verde Islands and the TSA stemsfrom the increased easterly wind stress across the tropicalNorth Atlantic associated with unusually warm SSTs southof the ITCZ [Enfield, 1996].[27] Over the time frame from 1931 to 2000, these coral
proxy records from the eastern tropical North Atlanticmatch records of salinity from sclerosponges deeper in thewestern tropical North Atlantic [Rosenheim et al., 2005].The tropical and trans-Atlantic influence of the NAO isdemonstrated through the similarity in salinity recordsproduced from different sides of the ocean (Rosenheim etal. [2005] and this work). Waters from the SMW sink andare transported zonally to the west [Zhang et al., 2003]where their geochemical characteristics are recorded by thedeeper sclerosponges (�150 m) reported by Rosenheim etal. [2005].[28] The pattern of salinity variability is not only related
to SST or the NAO, but also influenced by the phase andstrength of the NAO – SST relationship. The pattern ofcorrelation between the NAO and Cape Verde SST, in termsof relative phase and strength, explains 60% of the variancein salinity over the 20th century (Figure 6). Since the twocontrols on evaporation (thus salinity) are SST (in the formof the TNA, AMO, and Cape Verde SST) and wind speed(as the NAO and TSA), it makes sense that a combination ofthe two could create a predictive index for salinity. Such an‘‘NAO – SST index’’ can be created from the correlation
coefficients from the moving correlation between the NAOand Cape Verde SST shown in the bottom panel of Figure 4.[29] During the period from 1931 to 2000 the NAO shows
a nonsignificant correlation with SST near the Cape VerdeIslands (Table 1). Spatial regressions of SST on the NAOreveal that the change in the previously significantly neg-ative relationship between the NAO and SST recorded inthe Cape Verde Islands is actually a regional change in thisrelationship (Figure 7). This change in the relationshipbetween SST and the NAO would have implication forchanges in winds and evaporation, and ultimately, salinity.[30] There is a notable reversal of the otherwise positive
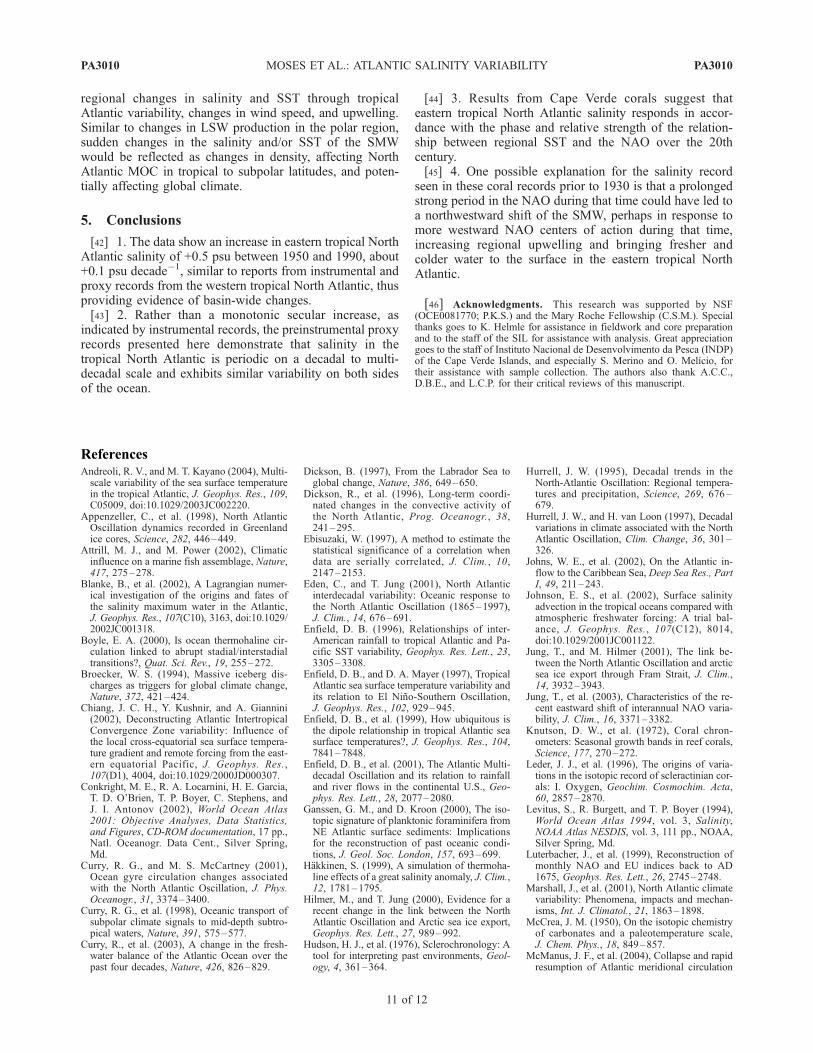
NAO – salinity correlation prior to the early 1930s(Figure 8). Instead of the strong positive relationship seenbetween the 1930s and the end of the record, the NAO –salinity correlation of r = �0.49 (p < 0.01) between 1910and 1930 is significant, but of the opposite sign. The NAO– SST relationship is also strongly negative in this time overthe whole region [Walter and Graf, 2002]. However, duringthis same time, the correlation between SST and salinityshows no change in phase. At longer correlation intervals(13–15 years), the phase change between the NAO andsalinity shifts to the right toward 1940, and at shortercorrelation intervals (7–9 years), it shifts to the left toward1930.[31] The change in the NAO – salinity relationship is
similar to a decoupling reported in some SST-forced atmo-spheric models that failed to reproduce regional decadal-scale trends in the NAO prior to about 1950, and particularlyso in the 1920s [Paeth et al., 2003, p. 66, Figure 2c]. This so-called ‘‘decoupling’’ seen here between SST and the NAOand by others [Paeth et al., 2003; Rodwell et al., 1999] isactually better described as a phase reversal to a negative,rather than positive, correlation between the NAO and SSTbetween 1900 and 1930.
Figure 6. Regression of coral salinity against the NAO – SST correlation index. When converted to anindex, the moving correlation between NAO – SST explains 60% of the variance (r = 0.77) in thecalculated salinity values. DS = 0.65(±0.12) � Idx + 0.27(±0.05), where Idx is the NAO – SSTcorrelation index value. Dashed gray lines represent the 95% confidence interval for the regression line.Salinity scale is normalized to modern annual climatology [Conkright et al., 2002; Levitus et al., 1994].
PA3010 MOSES ET AL.: ATLANTIC SALINITY VARIABILITY
8 of 12
PA3010
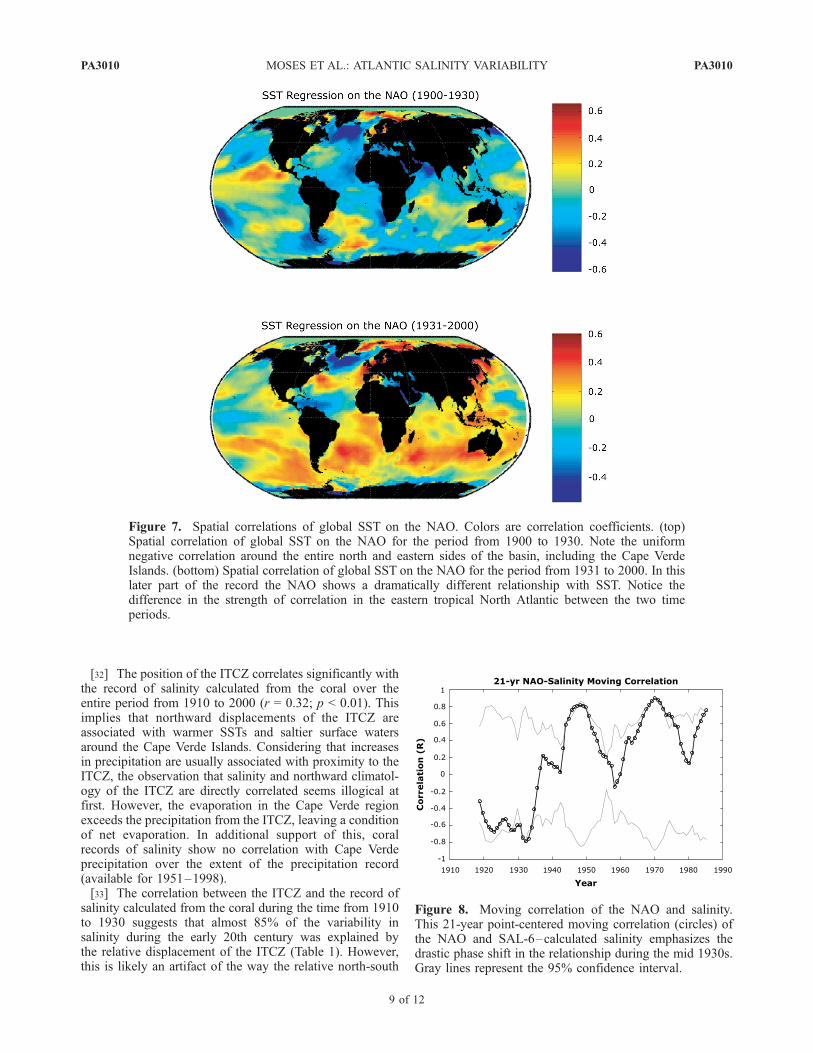
[32] The position of the ITCZ correlates significantly withthe record of salinity calculated from the coral over theentire period from 1910 to 2000 (r = 0.32; p < 0.01). Thisimplies that northward displacements of the ITCZ areassociated with warmer SSTs and saltier surface watersaround the Cape Verde Islands. Considering that increasesin precipitation are usually associated with proximity to theITCZ, the observation that salinity and northward climatol-ogy of the ITCZ are directly correlated seems illogical atfirst. However, the evaporation in the Cape Verde regionexceeds the precipitation from the ITCZ, leaving a conditionof net evaporation. In additional support of this, coralrecords of salinity show no correlation with Cape Verdeprecipitation over the extent of the precipitation record(available for 1951–1998).[33] The correlation between the ITCZ and the record of
salinity calculated from the coral during the time from 1910to 1930 suggests that almost 85% of the variability insalinity during the early 20th century was explained bythe relative displacement of the ITCZ (Table 1). However,this is likely an artifact of the way the relative north-south
Figure 8. Moving correlation of the NAO and salinity.This 21-year point-centered moving correlation (circles) ofthe NAO and SAL-6–calculated salinity emphasizes thedrastic phase shift in the relationship during the mid 1930s.Gray lines represent the 95% confidence interval.
Figure 7. Spatial correlations of global SST on the NAO. Colors are correlation coefficients. (top)Spatial correlation of global SST on the NAO for the period from 1900 to 1930. Note the uniformnegative correlation around the entire north and eastern sides of the basin, including the Cape VerdeIslands. (bottom) Spatial correlation of global SST on the NAO for the period from 1931 to 2000. In thislater part of the record the NAO shows a dramatically different relationship with SST. Notice thedifference in the strength of correlation in the eastern tropical North Atlantic between the two timeperiods.
PA3010 MOSES ET AL.: ATLANTIC SALINITY VARIABILITY
9 of 12
PA3010

displacement of the ITCZ at the annual scale was calculatedhere by subtracting the TSA from the TNA. More accu-rately, perhaps, this suggests that during the first threedecades of the 1900s, the TNA and TSA relationship wasclosely tied to eastern tropical North Atlantic salinity.However, this relationship breaks down in the period from1931 to 2000, when both the ITCZ and TSA show nosignificant relationship to salinity variability.
4.5. One Possible Theory for the ObservedSalinity Variability
[34] The logical expectation is that areas of ocean surfacenear the Cape Verde Islands which are exposed to NAO drivenwinds will experience both cooler SSTs and higher salinitiesduring strong positive NAO periods as a result of increasedevaporation. Thus the observed cool period between 1910 and1930 in Cape Verde SST and the TNA is exactly as expectedrelative to the corresponding prolonged strong NAO. How-ever, in contrast, the salinity recorded in the coral skeletalgeochemistry indicates a decrease in salinity, rather than theexpected increase, over that same time.[35] In the period from 1910 to 1930, when the correlation
between salinity and the NAO reverses its phase, the TNAmaintains the significant positive correlation with salinity(r = 0.49; p < 0.01) which it displays over the entire record,relating cooler SSTs in the eastern tropical North Atlantic todecreased salinity. The period from about 1900 to the 1930srepresents a time when the ITCZ was displaced further to thesouth (on an annual average) for a prolonged period of time.The result was a time of prolonged cooler than average SSTsin the eastern tropical North Atlantic, and warmer SSTs inthe tropical South Atlantic. Strong positive (warm) periodsin the TSA are associated with stronger than normal tradewinds in the tropical North Atlantic [Enfield, 1996]. Theimplication is that the strong positive TSA and the simulta-neous strong NAO would have worked in unison to increasethe speed of easterlies over the Cape Verde Islands for themajority of the time from 1900 to 1930.[36] The location of the Cape Verde Islands near the
eastern border of the tropical North Atlantic renders themsubject to a regional shallowing of the thermocline. Thisposition also corresponds with regional upwelling resultingfrom the cyclonic circulation of the North Atlantic Gyre.Both the local thermocline and halocline are located be-tween the surface and 200 m. Between the surface and 200m depth, temperature plummets 12.1�C and salinitydecreases by about 0.6 psu (annual climatology) [Conkrightet al., 2002].[37] A prolonged increase in the easterlies, such as
inferred during the 1910–1930 period, could conceivablypush the surface expression of the SMW westward, alongwith the associated warm SSTs. In its place, the cooler,fresher, deeper waters could upwell around the Cape VerdeIslands. This scenario is supported by reports of increasedregional upwelling between 12� and 43�N in the easternNorth Atlantic during strong NAO periods [Santos et al.,2005]. This theory could explain both the expected coolerSSTs as a combined effect of evaporation and upwelling,and the simultaneous decrease in salinity as fresheningassociated with upwelling. Furthermore, it is likely that
any displacement of the SMW to the west or northwestwould reduce the effects of the NAO recorded in the coralskeleton as upwelled (lower) salinity is recorded instead.[38] Movement of the surface expression of the SMW
could be linked to east-west shifts in the regional influenceof the NAO. The regional domain of the NAO influence isknown to undergo a seasonal zonal migration. In the winter(December–February) the strongest SLP gradient, or ‘‘cen-ters of action’’ [Jung et al., 2003], is furthest to the east, andit is furthest west in early fall (August–September) [Hurrelland van Loon, 1997]. At interannual to decadal scales, east-west migration of the NAO centers of action has beenshown to affect Arctic sea ice transport [Hilmer and Jung,2000] and surface air temperatures [Jung et al., 2003]. Onepossibility is that if the centers of action are displacedwestward for an extended period, then the steep salinitygradient (‘‘salinity front’’) surrounding the Cape VerdeIslands may also withdraw northwestward, removing thedirect influence of the SMW, and the observed influence ofthe NAO, on the coral salinity records.[39] This theory of the migration of the surface expression
of the SMW agrees with the work of Rosenheim et al.[2005]. They report no change in the influence of the NAOon the salinity recorded in their sclerosponges before andafter 1930. Sinking of high-density SMW waters and zonaltransport to the west would bring waters formed at thesurface in the SMW to the sclerosponges regardless ofthe exact location of their surface origin. However, if thesurface expression of the SMW moves away from the CapeVerde Islands, the corals there are no longer influenced bythe SMW. In conjunction with upwelled cooler and fresherwaters, this could possibly explain the differences seenbetween the sclerosponge records of salinity [Rosenheimet al., 2005] and those of the corals shown here in the earlypart of the 20th century.
4.6. Implications of Multidecadal-Scale SalinityVariability in the Atlantic
[40] Studies of the NAO have established its relationshipwith diverse factors such as European winter weather[Hurrell, 1995; Hurrell and van Loon, 1997], North Amer-ican weather [Hurrell, 1995], Arctic sea ice [Jung andHilmer, 2001], and ecosystem dynamics [Attrill and Power,2002]. Perhaps the most serious implications, however,come from the ocean-atmosphere interaction betweenSST, the NAO, and ocean circulation. Labrador Seawater(LSW) is one the keys to Atlantic THC because it is thesource for the formation of cold, fresh water. The strength ofconvection in the Labrador Sea and formation of LSW isdependent on the strength of midlatitude westerly winds[Curry et al., 1998; Dickson, 1997; Dickson et al., 1996],which are governed by the strength and phase of the NAO.The NAO has also been shown to affect the strength of theGulf Stream [Curry and McCartney, 2001], which is re-sponsible for the transport of �31 Sv (106 m3 s�1) [Johns etal., 2002] of warm, salty water to the North Atlantic,another major component of Atlantic THC.[41] The work presented here now supports evidence that
the E – P balance and position of the SMW of the tropicalNorth Atlantic are affected by the NAO, coupled with
PA3010 MOSES ET AL.: ATLANTIC SALINITY VARIABILITY
10 of 12
PA3010
regional changes in salinity and SST through tropicalAtlantic variability, changes in wind speed, and upwelling.Similar to changes in LSW production in the polar region,sudden changes in the salinity and/or SST of the SMWwould be reflected as changes in density, affecting NorthAtlantic MOC in tropical to subpolar latitudes, and poten-tially affecting global climate.
5. Conclusions
[42] 1. The data show an increase in eastern tropical NorthAtlantic salinity of +0.5 psu between 1950 and 1990, about+0.1 psu decade�1, similar to reports from instrumental andproxy records from the western tropical North Atlantic, thusproviding evidence of basin-wide changes.[43] 2. Rather than a monotonic secular increase, as
indicated by instrumental records, the preinstrumental proxyrecords presented here demonstrate that salinity in thetropical North Atlantic is periodic on a decadal to multi-decadal scale and exhibits similar variability on both sidesof the ocean.
[44] 3. Results from Cape Verde corals suggest thateastern tropical North Atlantic salinity responds in accor-dance with the phase and relative strength of the relation-ship between regional SST and the NAO over the 20thcentury.[45] 4. One possible explanation for the salinity record
seen in these coral records prior to 1930 is that a prolongedstrong period in the NAO during that time could have led toa northwestward shift of the SMW, perhaps in response tomore westward NAO centers of action during that time,increasing regional upwelling and bringing fresher andcolder water to the surface in the eastern tropical NorthAtlantic.
[46] Acknowledgments. This research was supported by NSF(OCE0081770; P.K.S.) and the Mary Roche Fellowship (C.S.M.). Specialthanks goes to K. Helmle for assistance in fieldwork and core preparationand to the staff of the SIL for assistance with analysis. Great appreciationgoes to the staff of Instituto Nacional de Desenvolvimento da Pesca (INDP)of the Cape Verde Islands, and especially S. Merino and O. Melıcio, fortheir assistance with sample collection. The authors also thank A.C.C.,D.B.E., and L.C.P. for their critical reviews of this manuscript.
PA3010 MOSES ET AL.: ATLANTIC SALINITY VARIABILITY
11 of 12
PA3010
ReferencesAndreoli, R. V., and M. T. Kayano (2004), Multi-scale variability of the sea surface temperaturein the tropical Atlantic, J. Geophys. Res., 109,C05009, doi:10.1029/2003JC002220.
Appenzeller, C., et al. (1998), North AtlanticOscillation dynamics recorded in Greenlandice cores, Science, 282, 446–449.
Attrill, M. J., and M. Power (2002), Climaticinfluence on a marine fish assemblage, Nature,417, 275–278.
Blanke, B., et al. (2002), A Lagrangian numer-ical investigation of the origins and fates ofthe salinity maximum water in the Atlantic,J. Geophys. Res., 107(C10), 3163, doi:10.1029/2002JC001318.
Boyle, E. A. (2000), Is ocean thermohaline cir-culation linked to abrupt stadial/interstadialtransitions?, Quat. Sci. Rev., 19, 255–272.
Broecker, W. S. (1994), Massive iceberg dis-charges as triggers for global climate change,Nature, 372, 421–424.
Chiang, J. C. H., Y. Kushnir, and A. Giannini(2002), Deconstructing Atlantic IntertropicalConvergence Zone variability: Influence ofthe local cross-equatorial sea surface tempera-ture gradient and remote forcing from the east-ern equatorial Pacific, J. Geophys. Res.,107(D1), 4004, doi:10.1029/2000JD000307.
Conkright, M. E., R. A. Locarnini, H. E. Garcia,T. D. O’Brien, T. P. Boyer, C. Stephens, andJ. I. Antonov (2002), World Ocean Atlas2001: Objective Analyses, Data Statistics,and Figures, CD-ROM documentation, 17 pp.,Natl. Oceanogr. Data Cent., Silver Spring,Md.
Curry, R. G., and M. S. McCartney (2001),Ocean gyre circulation changes associatedwith the North Atlantic Oscillation, J. Phys.Oceanogr., 31, 3374–3400.
Curry, R. G., et al. (1998), Oceanic transport ofsubpolar climate signals to mid-depth subtro-pical waters, Nature, 391, 575–577.
Curry, R., et al. (2003), A change in the fresh-water balance of the Atlantic Ocean over thepast four decades, Nature, 426, 826–829.
Dickson, B. (1997), From the Labrador Sea toglobal change, Nature, 386, 649–650.
Dickson, R., et al. (1996), Long-term coordi-nated changes in the convective activity ofthe North Atlantic, Prog. Oceanogr., 38,241–295.
Ebisuzaki, W. (1997), A method to estimate thestatistical significance of a correlation whendata are serially correlated, J. Clim., 10,2147–2153.
Eden, C., and T. Jung (2001), North Atlanticinterdecadal variability: Oceanic response tothe North Atlantic Oscillation (1865–1997),J. Clim., 14, 676–691.
Enfield, D. B. (1996), Relationships of inter-American rainfall to tropical Atlantic and Pa-cific SST variability, Geophys. Res. Lett., 23,3305–3308.
Enfield, D. B., and D. A. Mayer (1997), TropicalAtlantic sea surface temperature variability andits relation to El Nino-Southern Oscillation,J. Geophys. Res., 102, 929–945.
Enfield, D. B., et al. (1999), How ubiquitous isthe dipole relationship in tropical Atlantic seasurface temperatures?, J. Geophys. Res., 104,7841–7848.
Enfield, D. B., et al. (2001), The Atlantic Multi-decadal Oscillation and its relation to rainfalland river flows in the continental U.S., Geo-phys. Res. Lett., 28, 2077–2080.
Ganssen, G. M., and D. Kroon (2000), The iso-topic signature of planktonic foraminifera fromNE Atlantic surface sediments: Implicationsfor the reconstruction of past oceanic condi-tions, J. Geol. Soc. London, 157, 693–699.
Hakkinen, S. (1999), A simulation of thermoha-line effects of a great salinity anomaly, J. Clim.,12, 1781–1795.
Hilmer, M., and T. Jung (2000), Evidence for arecent change in the link between the NorthAtlantic Oscillation and Arctic sea ice export,Geophys. Res. Lett., 27, 989–992.
Hudson, H. J., et al. (1976), Sclerochronology: Atool for interpreting past environments, Geol-ogy, 4, 361–364.
Hurrell, J. W. (1995), Decadal trends in theNorth-Atlantic Oscillation: Regional tempera-tures and precipitation, Science, 269, 676–679.
Hurrell, J. W., and H. van Loon (1997), Decadalvariations in climate associated with the NorthAtlantic Oscillation, Clim. Change, 36, 301–326.
Johns, W. E., et al. (2002), On the Atlantic in-flow to the Caribbean Sea, Deep Sea Res., PartI, 49, 211–243.
Johnson, E. S., et al. (2002), Surface salinityadvection in the tropical oceans compared withatmospheric freshwater forcing: A trial bal-ance, J. Geophys. Res., 107(C12), 8014,doi:10.1029/2001JC001122.
Jung, T., and M. Hilmer (2001), The link be-tween the North Atlantic Oscillation and arcticsea ice export through Fram Strait, J. Clim.,14, 3932–3943.
Jung, T., et al. (2003), Characteristics of the re-cent eastward shift of interannual NAO varia-bility, J. Clim., 16, 3371–3382.
Knutson, D. W., et al. (1972), Coral chron-ometers: Seasonal growth bands in reef corals,Science, 177, 270–272.
Leder, J. J., et al. (1996), The origins of varia-tions in the isotopic record of scleractinian cor-als: I. Oxygen, Geochim. Cosmochim. Acta,60, 2857–2870.
Levitus, S., R. Burgett, and T. P. Boyer (1994),World Ocean Atlas 1994, vol. 3, Salinity,NOAA Atlas NESDIS, vol. 3, 111 pp., NOAA,Silver Spring, Md.
Luterbacher, J., et al. (1999), Reconstruction ofmonthly NAO and EU indices back to AD1675, Geophys. Res. Lett., 26, 2745–2748.
Marshall, J., et al. (2001), North Atlantic climatevariability: Phenomena, impacts and mechan-isms, Int. J. Climatol., 21, 1863–1898.
McCrea, J. M. (1950), On the isotopic chemistryof carbonates and a paleotemperature scale,J. Chem. Phys., 18, 849–857.
McManus, J. F., et al. (2004), Collapse and rapidresumption of Atlantic meridional circulation

PA3010 MOSES ET AL.: ATLANTIC SALINITY VARIABILITY
12 of 12
PA3010
linked to deglacial climate changes, Nature,428, 834–837.
Moses, C. S., P. K. Swart, and R. E. Dodge(2006), Calibration of stable oxygen isotopesin Siderastrea radians (Cnidaria:Scleractinia):Implications for slow-growing corals, Geo-chem. Geophys. Geosyst., doi:10.1029/2005GC001196, in press.
Nobre, P., and J. Shukla (1996), Variations of seasurface temperature, wind stress, and rainfallover the tropical Atlantic and South America,J. Clim., 9, 2464–2479.
Paeth, H., et al. (2003), Global SST influence ontwentieth century NAO variability, Clim. Dyn.,21, 63–75.
Rodwell, M. J., et al. (1999), Oceanic forcing ofthe wintertime North Atlantic Oscillation andEuropean climate, Nature, 398, 320–323.
Rosenheim, B. E., et al. (2005), Salinity changein the subtropical Atlantic: Secular increaseand teleconnections to the North Atlantic Os-cillation, Geophys. Res. Lett., 32, L02603,doi:10.1029/2004GL021499.
Santos, A. M. P., et al. (2005), Decadal changesin the Canary upwelling system as revealed bysatellite observations: Their impact on produc-tivity, J. Mar. Res., 63, 359–379.
Schlesinger, M. E., and N. Ramankutty (1994),An oscillation in the global climate system ofperiod 65–70 years, Nature, 367, 723–726.
Schmidt, G. A. (1999), Error analysis of paleo-salinity calculations, Paleoceanography, 14,422–429.
Schmidt, M. W., et al. (2004), Links betweensalinity variation in the Caribbean and NorthAtlantic thermohaline circulation, Nature, 428,160–163.
Schmitt, R. W., et al. (1989), Evaporation minusprecipitation and density fluxes for the North-Atlantic, J. Phys. Oceanogr., 19, 1208–1221.
Slutz, R. J., S. J. Lubker, J. D. Hiscox, S. D.Woodruff, R. L. Jenne, D. H. Joseph, P. M.Steurer, and J. D. Elms (1985), ComprehensiveOcean-Atmosphere Data Set, Release 1, 268pp., NOAA Environ. Res. Lab., Clim. Res.Program, Boulder, Colo.
Smith, T. M., and R. W. Reynolds (2004), Im-proved extended reconstruction of SST(1854–1997), J. Clim., 17, 2466–2477.
Walter, K., and H. F. Graf (2002), On the chan-ging nature of the regional connection betweenthe North Atlantic Oscillation and sea surfacetemperature, J. Geophys. Res., 107(D17), 4338,doi:10.1029/2001JD000850.
Weber, J. N., and P. M. J. Woodhead (1972),Temperature dependence of oxygen-18 con-centration in reef coral carbonates, J. Geophys.Res., 77, 463–473.
Wellington, G. M., and R. B. Dunbar(1995), Stable isotopic signature of El-Nino-Southern Oscillation events in easterntropical Pacific reef corals, Coral Reefs,14, 5–25.
Zhang, D., et al. (2003), Observational evidencefor flow between the subtropical and tropicalAtlantic: The Atlantic subtropical cells, J. Phys.Oceanogr., 33, 1783–1797.
�������������������������C. S. Moses, College of Marine Science,
University of South Florida, 140 7th AvenueSouth, St. Petersburg, FL 33701, USA.([email protected])B. E. Rosenheim, Department of Geology and
Geophysics, WHOI, MS#8, Woods Hole Road,Woods Hole, MA 02543, USA.P. K. Swart, Division of Marine Geology
and Geophysics, RSMAS, 4600 RickenbackerCauseway, University of Miami, Miami, FL33149, USA.