evidence of climate change: in the semi arid areas of...
TRANSCRIPT

Evidence of climate change: Increase in the Semi‐Arid areas of India
AVR Kesava RaoScientist (Agroclimatology)Resilient Dryland Systems
International Crops Research Institute for the Semi‐Arid TropicsPatancheru 502 324, Andhra Pradesh, India

Global warming, impacts on climate
Data and methods
Changes in Semi-Arid areas in India
ICRISAT’s Hypothesis of Hope
Way forward
Contents
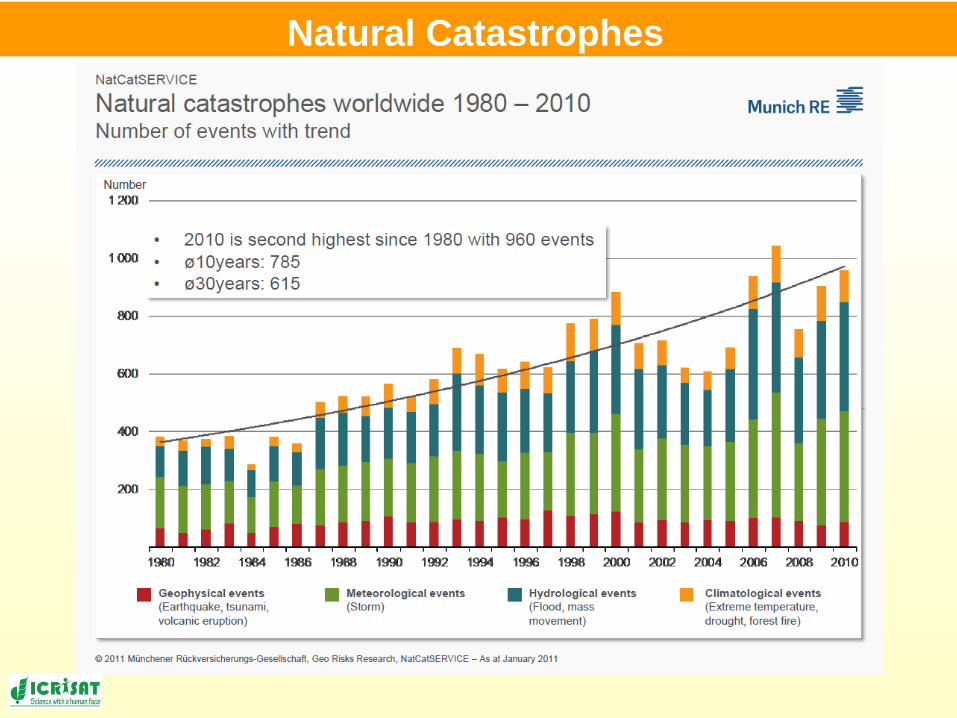
Natural Catastrophes

All India: Annual temperature anomalies
Source: IMD, 2010

India: Warmest Year 2010
Source: IMD, 2011
• Mean annual temperature of India in 2010 was +0.93°C above the 1961-1990 average
• 2010 is the warmest year on record since 1901
• Pre- Monsoon season (March-May) mean temperature was 1.8 °C above normal


Southwest monsoon onset over Kerala
Data source: IMD
(1871‐2012)
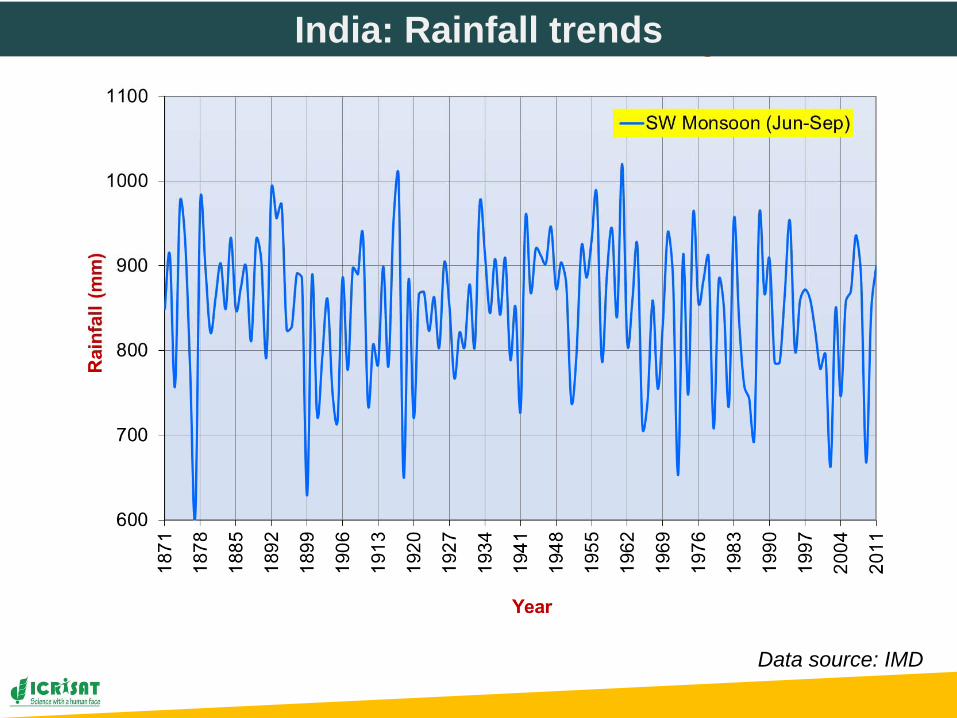
Data source: IMD
India – Rainfall variabilityIndia: Rainfall trends
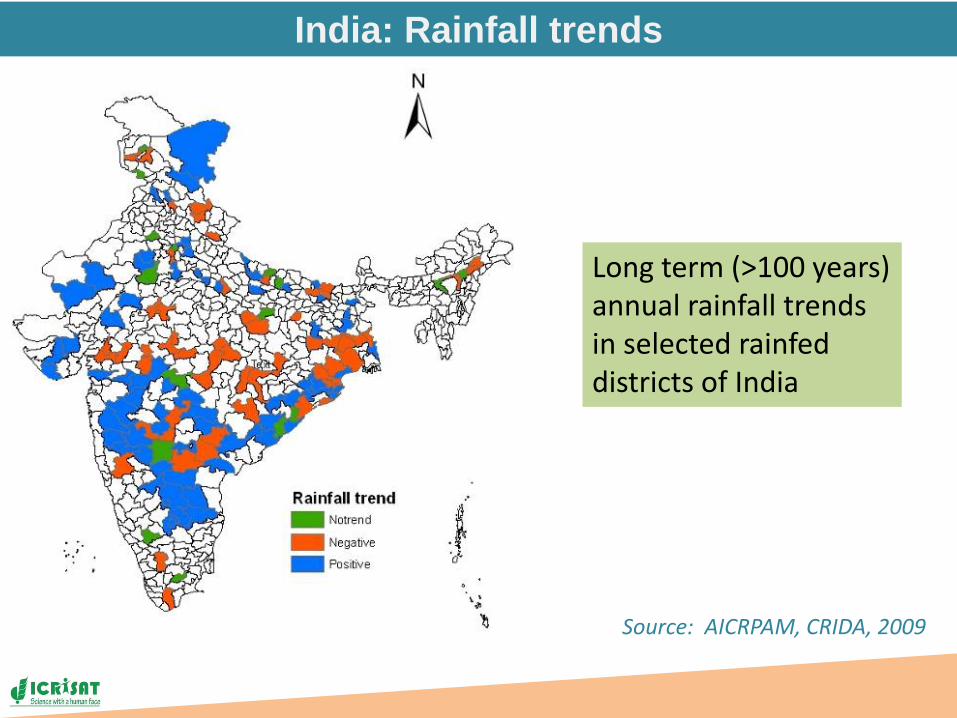
India: Rainfall trends
Source: AICRPAM, CRIDA, 2009
Long term (>100 years) annual rainfall trends in selected rainfed districts of India

• Significant rising trends in the frequency and the magnitude of extreme rain events
• Significant decreasing trend in the frequency of moderate events
• Contribution from increasing heavy events is offset by decreasing moderate events
• Substantial increase in hazards related to heavy rain is expected over Central India in the future
Source: Goswami et al., 2006, Science
Changes in rainfall intensity over Central India

Unprecedented rains in AP during 10-11 Jan 2012
• 0.49 million hectares crops have been affected
• Estimated loss is Rs. 7 billion
• On 11 Jan, Kavali in Nellore district 169 mm
Harvested paddy floating in flood water
Wet BlackgramFlood water affects color of chillies

India: Area changes in different climate types
Data, methods and results

IMD gridded daily climate data
One degree resolution
Total 351 pixels
Pixel data derived from 395 stations for temperature and 1803 stations for rainfall, using spatial interpolation (GIS)
Data for 34 years (1971‐2004)

Climatic Classification of Thornthwaite
Modified Water
Balance of Thornthwaite and Mather
PET(Hargreaves)
Soil AWC(NBSS &LUP)
Rain
Climatic Water Balance
Classification
Type Im (%)
Arid < -66.6
Semi-Arid -66.6 to -33.3
Dry Sub-humid -33.3 to 0
Moist Sub-humid 0 to 20
Humid 20 to 100
Per Humid >100
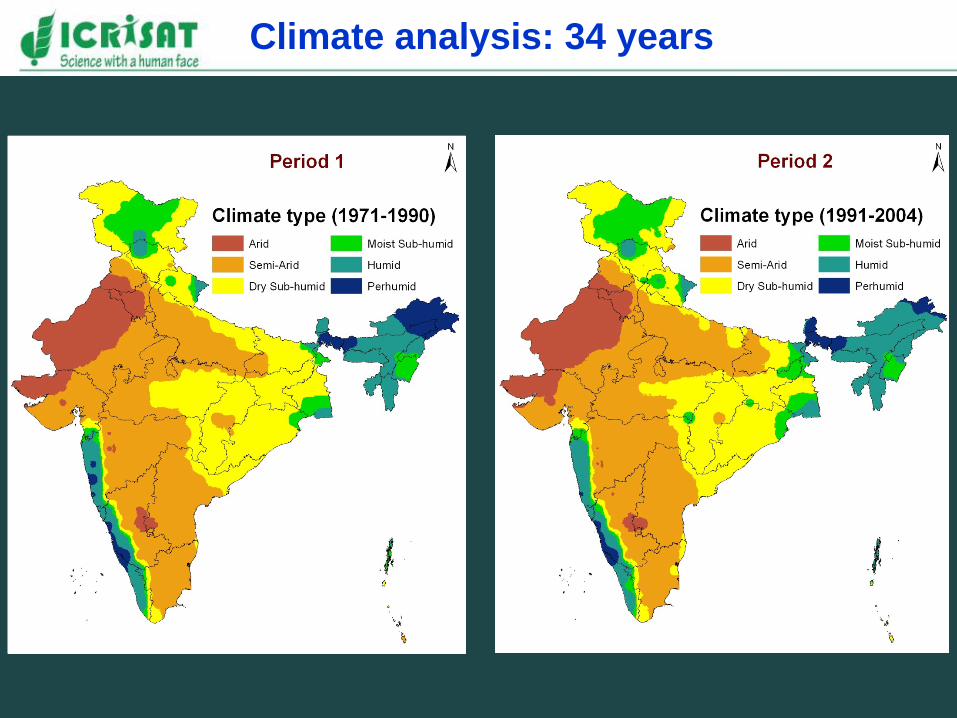
Climate analysis: 34 years

States selected for climate change area analysis
1. Andhra Pradesh2. Bihar3. Chhattisgarh4. Gujarat5. Haryana6. Himachal Pradesh7. Jharkhand8. Karnataka9. Kerala10. Maharashtra11. Madhya Pradesh12. Orissa13. Punjab14. Rajasthan15. Tamil Nadu16. Uttaranchal17. Uttar Pradesh18. West Bengal

Changes in areas under climate types
Period Arid S‐Arid D‐Sub‐H M‐Sub‐H Humid P‐Humid Total (m ha)
1971‐90 0 17.96 12.85 0.00 0.00 0.00 30.81
1991‐04 0 21.78 8.77 0.23 0.03 0.00 30.81
Difference 0 3.82 ‐4.08 0.23 0.03 0.00 0.00
Period Arid S‐Arid D‐Sub‐H M‐Sub‐H Humid P‐Humid Total (m ha)
1971‐90 0 1.82 6.87 0.39 0.32 0.02 9.42
1991‐04 0 4.48 3.39 1.04 0.48 0.03 9.42
Difference 0 2.66 ‐3.48 0.65 0.16 0.01 0.00
Madhya Pradesh
Bihar

Changes in areas under climate types
Period Arid S‐Arid D‐Sub‐H M‐Sub‐H Humid P‐Humid Total (m ha)
1971‐90 0 0.16 14.45 0.96 0.00 0.00 15.57
1991‐04 0 0.00 13.79 1.71 0.07 0.00 15.57
Difference 0 ‐0.16 ‐0.66 0.75 0.07 0.00 0.00
Period Arid S‐Arid D‐Sub‐H M‐Sub‐H Humid P‐Humid Total (m ha)
1971‐90 1.21 12.05 1.49 0.77 2.44 1.20 19.18
1991‐04 0.93 12.28 1.52 0.87 2.26 1.32 19.18
Difference ‐0.30 0.23 0.03 0.08 ‐0.20 0.12 0.00
Orissa
Karnataka
continued

Change in areas between 1971‐90 and 1991‐2004
(Based on Thornthwaite’s climatic classification and IMD gridded climate data)
Indian States

India climates: Changes in area

Global warming - Monsoon relationship ?
Higher level of saturation of errors in the high frequency events would cascade larger errors
to weather scale and could decrease predictability of monsoon weather
Source: Neena Joseph Mani, E. Suhas and B. N. Goswami, Geophys.Res. Letts (2009)
Why is the southwest monsoon rainfall not increasing with increasing temperature due to global warming?
The monsoon weather forecasting could become almost twice as difficult

Source: IMD, 2012
Southwest monsoon rainfall situation as on 31 July 2012
Region Actual (mm) Normal (mm)Percentage departuredeficit
East and NE India
708 787 ‐10%
Northwest India
184 288 ‐36%
Central India 414 488 ‐15%
South Peninsula
282 378 ‐23%
Country as a whole
366 452 ‐19

Many people who have contributed least to climate change may suffer the greatest livelihood consequences

Climate Change: ICRISAT’s Hypothesis of Hope

Resilient crop for the poor
Short‐duration chickpea cultivars that can withstand high temperatures
Super-earlyICC 9602975-80 days
Extra-earlyICCV 2
85-90 days
Early maturingKAK 2
90-95 days

Developed through cytoplasmic male sterility (CMS) systemWilt resistant and high yielding with farmers earning 80% higher than those growing traditional varieties
Short‐duration groundnut cultivar ICGV 91114 escapes
terminal drought
Resilient crop for the poorICPH 2671: World’s first pigeonpea hybrid
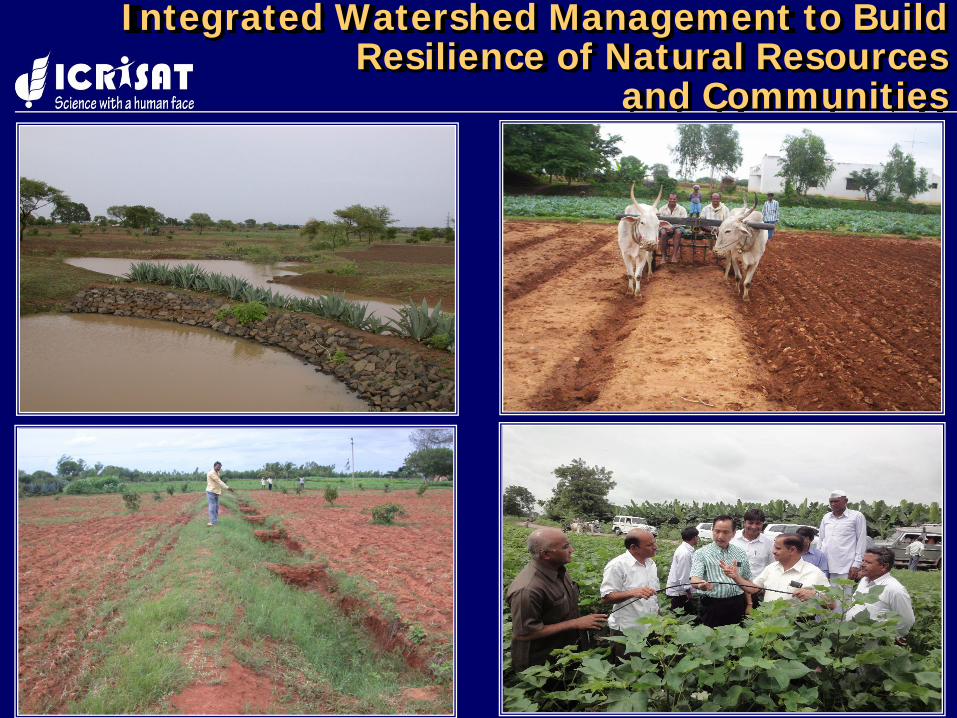
Integrated Watershed Management to Build Resilience of Natural Resources
and Communities
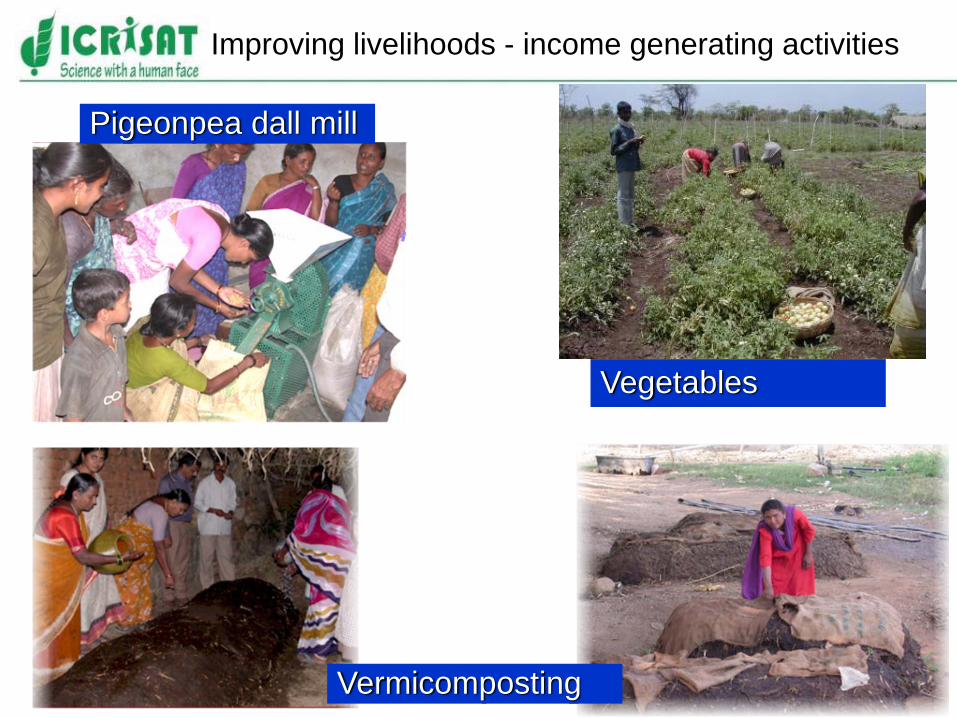
Vermicomposting
Pigeonpea dall mill
Improving livelihoods - income generating activities
Vegetables

Sharing of agroclimatic information – Wall writings

Training to the farmers to operate and maintain raingauges
Farmers themselves measure rainfall and document. Datalogger nevertheless records rainfall automatically, which will be downloaded at regular intervals
Weather awareness at watersheds

Training to the students to operate and maintain the Automatic Weather Station
Students collect the weather parameters daily and display at the school
Weather awareness at watersheds

Equity and Efficiency to Protect Economy and Environment
Efficiency Equity
EnvironmentEconomy
Adaptation &
Mitigation Strategies

Climate change impacts: Way forward
Climate Change has no respect for borders and affects all: Ban‐Ki‐Moon, Secretary General, UNO
“Hypothesis of Hope” validated in bridging the yield gaps, needs to be strengthened / operationalized
Harness potential of IWM through holistic approach to enhance crop productivity by 2‐3 folds
Diversification of livelihood options, a good adaptation strategy
Improved agromet advisory services at local level along with associated weather insurance packages
Enabling policies and institutions for the rural poor and women
Agriculture must play a key‐role in climate solutions
Rigorous climate analysis using high‐resolution data
We have no time to lose
Global warming tolerance thresholds not too far Adaptation + mitigation approach is crucial
Time to take off