evidence-informed decision making
TRANSCRIPT

School of Business
Trinity College Dublin
Week 11, 23 March 2015
9-11 AM
Tracey P. Lauriault
Programmable City Project, NIRSA, Maynooth University
BU3561 - Services and Information Management
Evidence-Informed
Decision Making
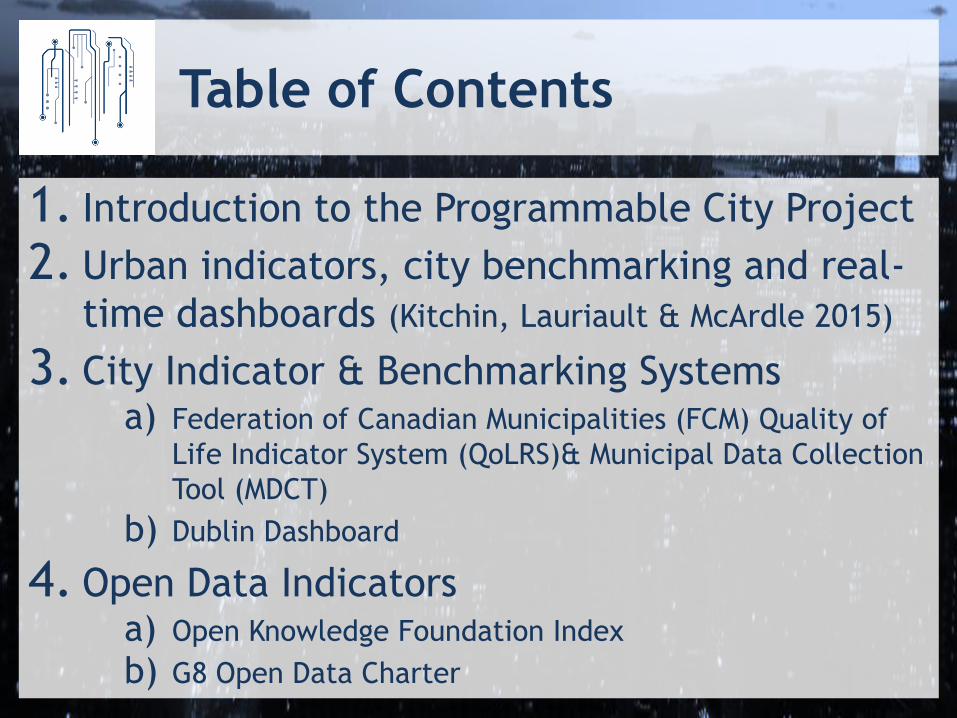
Table of Contents
1. Introduction to the Programmable City Project
2. Urban indicators, city benchmarking and real-
time dashboards (Kitchin, Lauriault & McArdle 2015)
3. City Indicator & Benchmarking Systems a) Federation of Canadian Municipalities (FCM) Quality of
Life Indicator System (QoLRS)& Municipal Data Collection
Tool (MDCT)
b) Dublin Dashboard
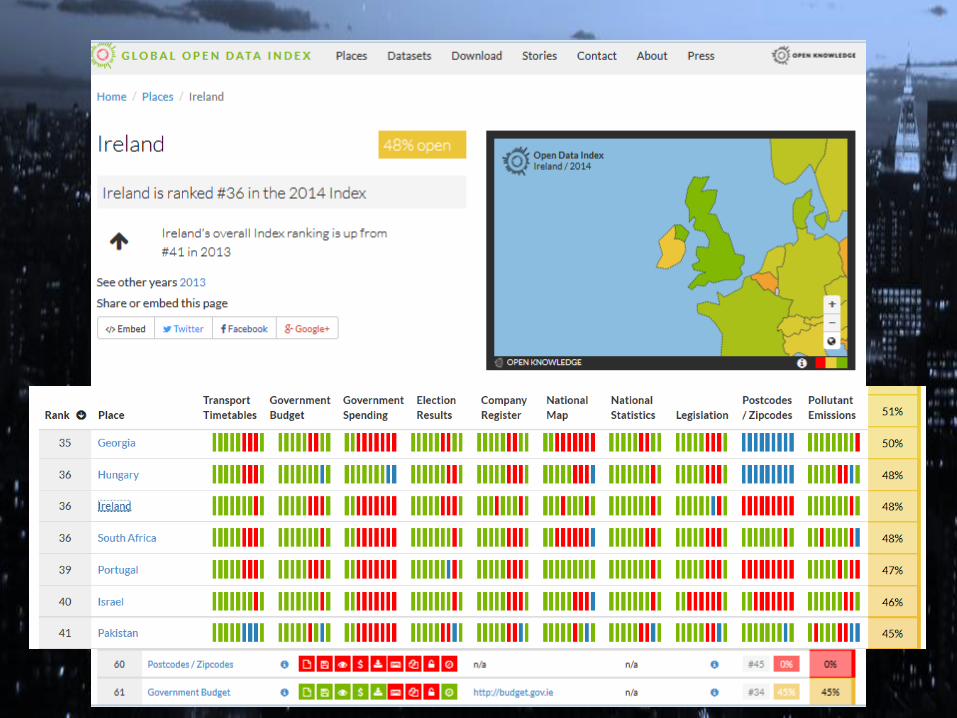
4. Open Data Indicators a) Open Knowledge Foundation Index
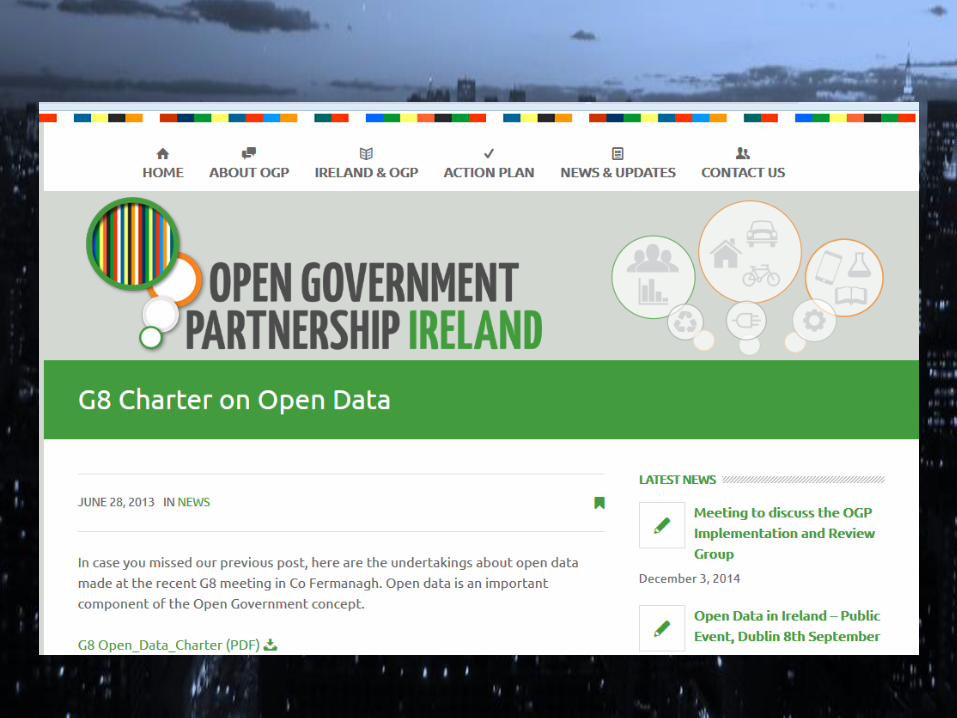
b) G8 Open Data Charter

The Programmable City
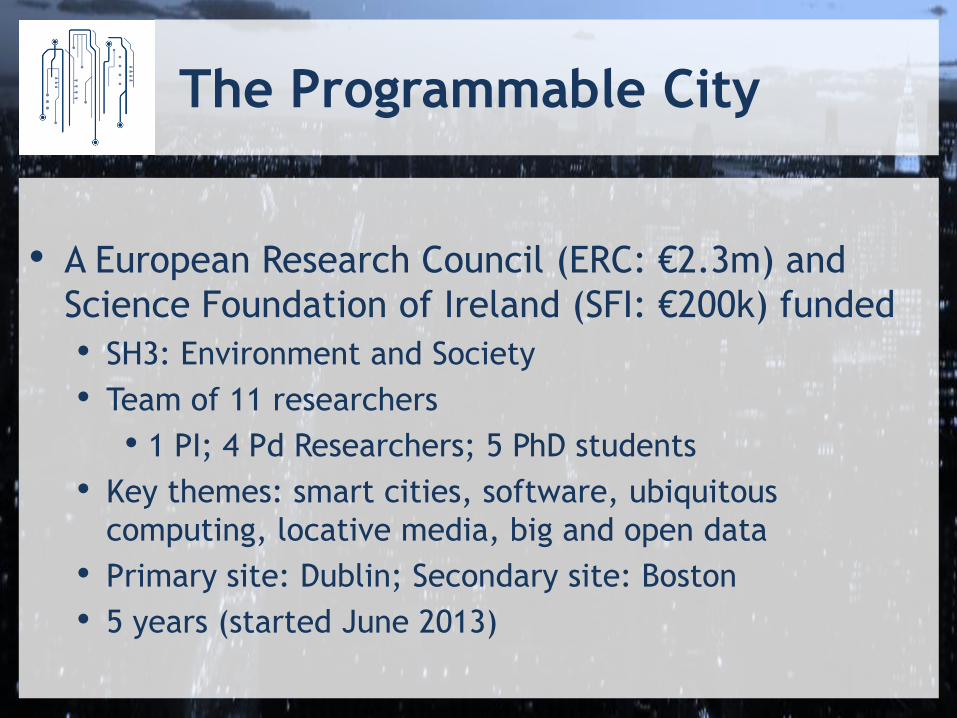
The Programmable City
• A European Research Council (ERC: €2.3m) and
Science Foundation of Ireland (SFI: €200k) funded
• SH3: Environment and Society
• Team of 11 researchers
• 1 PI; 4 Pd Researchers; 5 PhD students
• Key themes: smart cities, software, ubiquitous
computing, locative media, big and open data
• Primary site: Dublin; Secondary site: Boston
• 5 years (started June 2013)
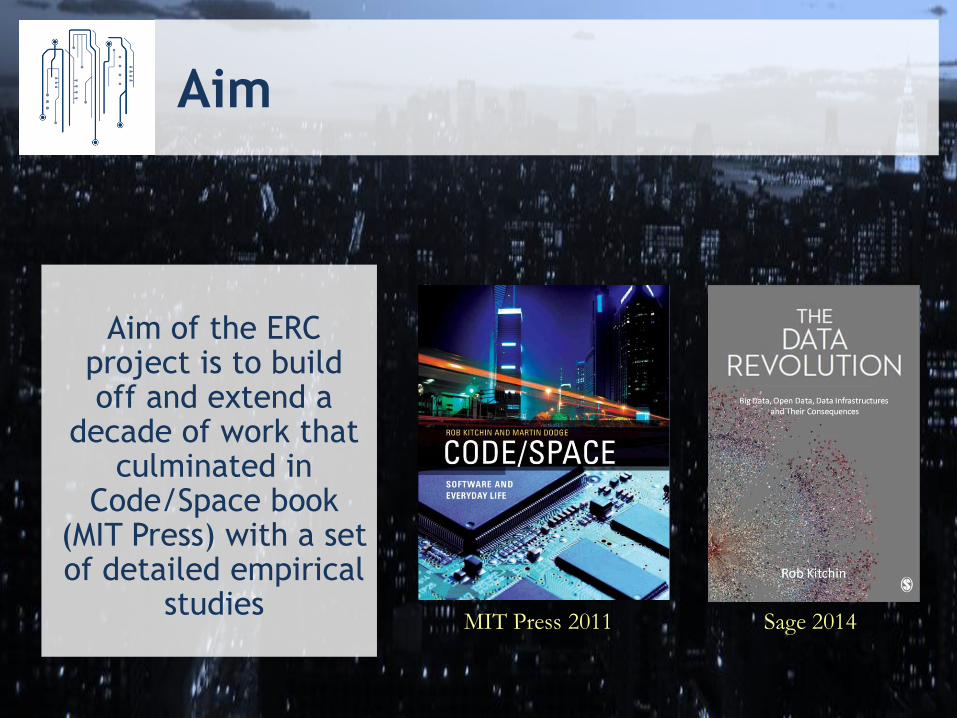
MIT Press 2011 Sage 2014
Aim of the ERC project is to build off and extend a
decade of work that culminated in
Code/Space book (MIT Press) with a set of detailed empirical
studies
Aim
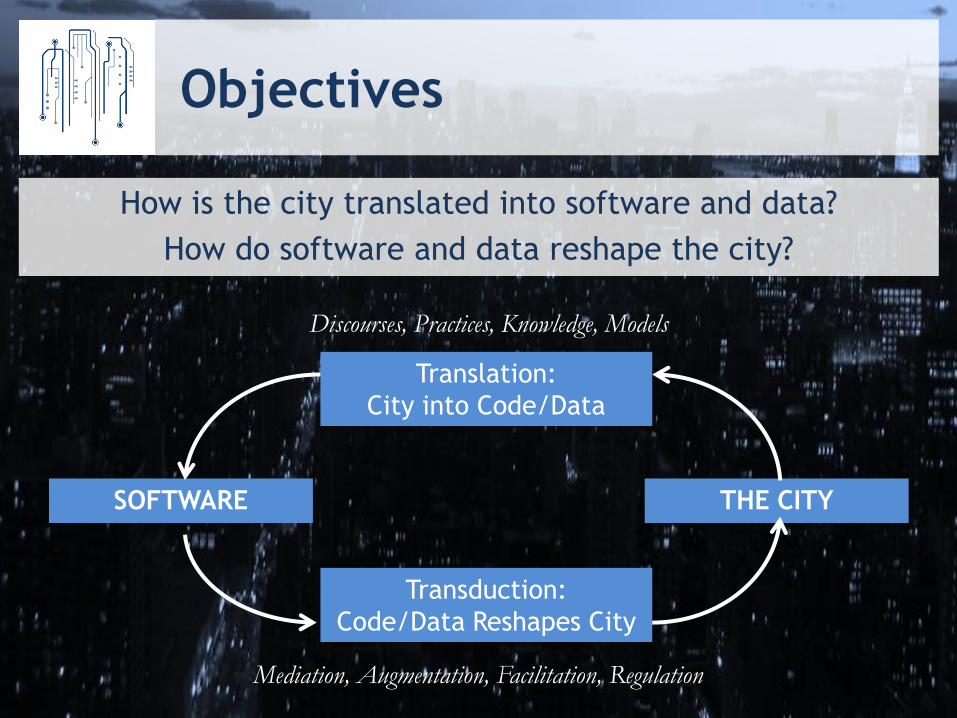
Objectives
How is the city translated into software and data?
How do software and data reshape the city?
Translation:
City into Code/Data
Transduction:
Code/Data Reshapes City
THE CITY SOFTWARE
Discourses, Practices, Knowledge, Models
Mediation, Augmentation, Facilitation, Regulation
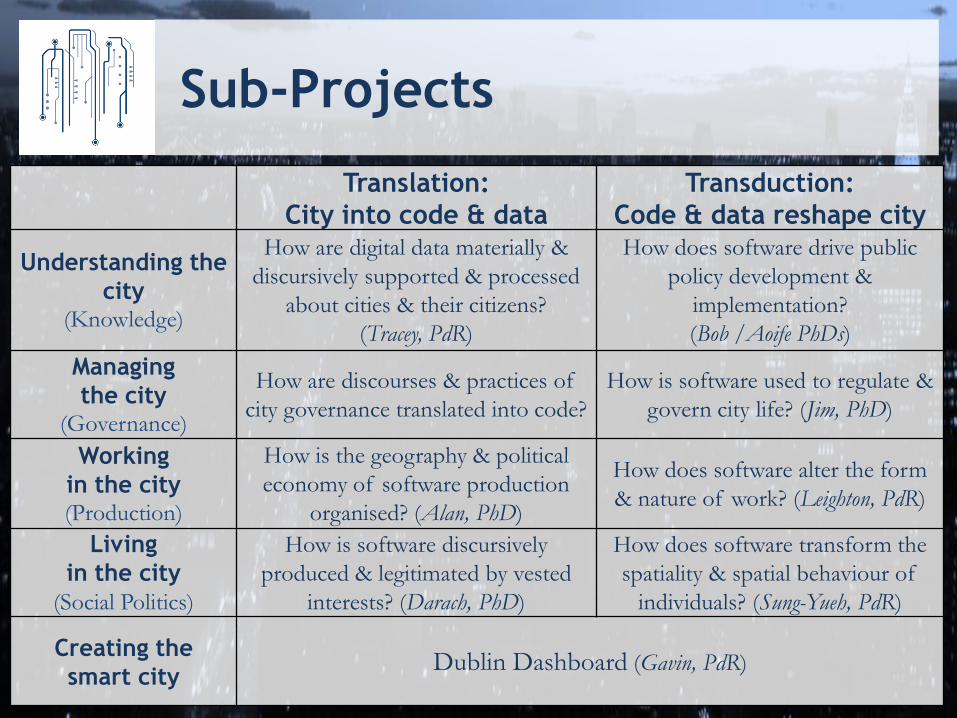
Sub-Projects
Translation:
City into code & data
Transduction:
Code & data reshape city
Understanding the
city (Knowledge)
How are digital data materially &
discursively supported & processed
about cities & their citizens?
(Tracey, PdR)
How does software drive public
policy development &
implementation?
(Bob /Aoife PhDs)
Managing
the city (Governance)
How are discourses & practices of
city governance translated into code?
How is software used to regulate &
govern city life? (Jim, PhD)
Working
in the city (Production)
How is the geography & political
economy of software production
organised? (Alan, PhD)
How does software alter the form
& nature of work? (Leighton, PdR)
Living
in the city
(Social Politics)
How is software discursively
produced & legitimated by vested
interests? (Darach, PhD)
How does software transform the
spatiality & spatial behaviour of
individuals? (Sung-Yueh, PdR)
Creating the
smart city Dublin Dashboard (Gavin, PdR)
Urban indicators, city benchmarking &
real-time dashboards
(Kitchin, Lauriault & McArdle 2015)

4 sections
1.Different types of indicators
2.Drivers & how employed
3.Critical appraisal
4.Acknowledge:
• Cities are more than disassembled facts
• Indicators, benchmarks & dashboards shape &
frame cities
• They are assemblages
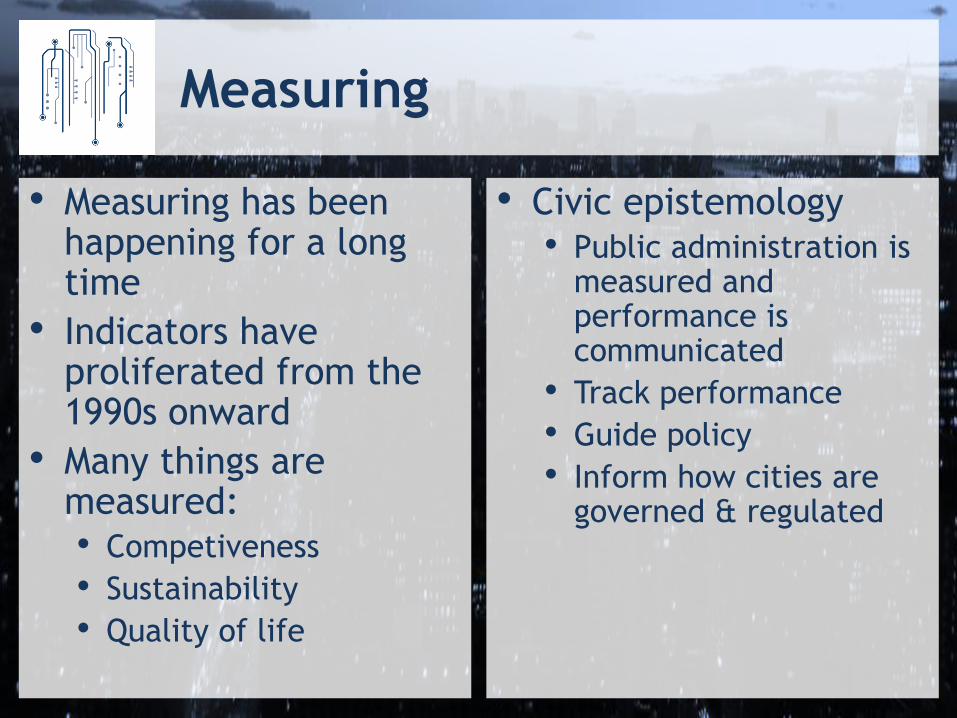
Measuring
• Measuring has been happening for a long time
• Indicators have proliferated from the 1990s onward
• Many things are measured: • Competiveness
• Sustainability
• Quality of life
• Civic epistemology • Public administration is
measured and performance is communicated
• Track performance
• Guide policy
• Inform how cities are governed & regulated
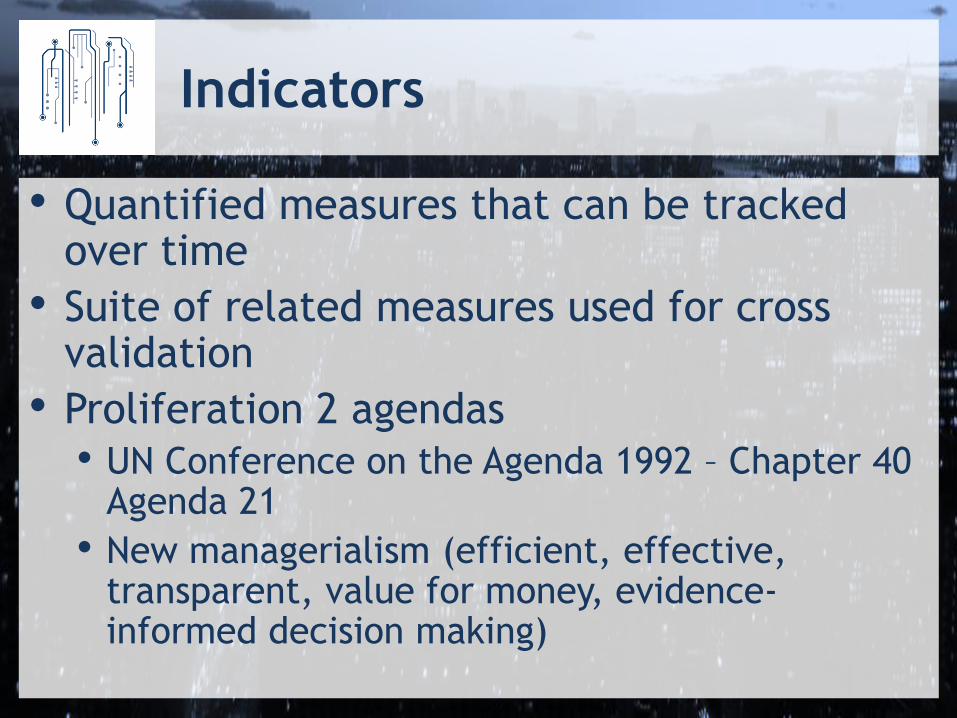
Indicators
• Quantified measures that can be tracked over time
• Suite of related measures used for cross validation
• Proliferation 2 agendas
• UN Conference on the Agenda 1992 – Chapter 40 Agenda 21
• New managerialism (efficient, effective, transparent, value for money, evidence-informed decision making)
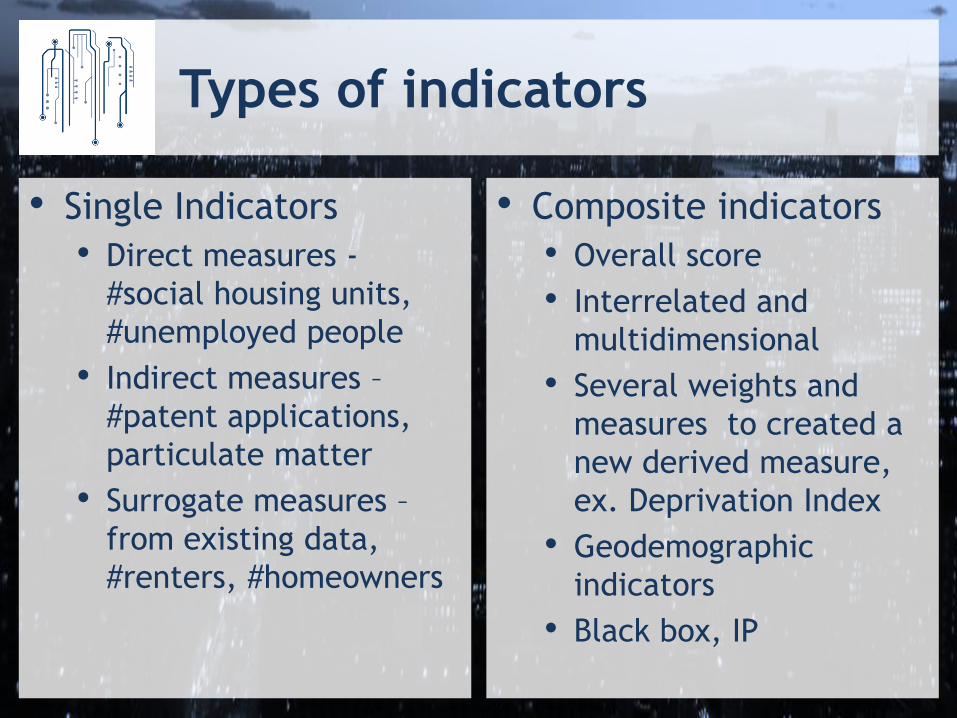
Types of indicators
• Single Indicators
• Direct measures -
#social housing units,
#unemployed people
• Indirect measures –
#patent applications,
particulate matter
• Surrogate measures –
from existing data,
#renters, #homeowners
• Composite indicators
• Overall score
• Interrelated and
multidimensional
• Several weights and
measures to created a
new derived measure,
ex. Deprivation Index
• Geodemographic
indicators
• Black box, IP
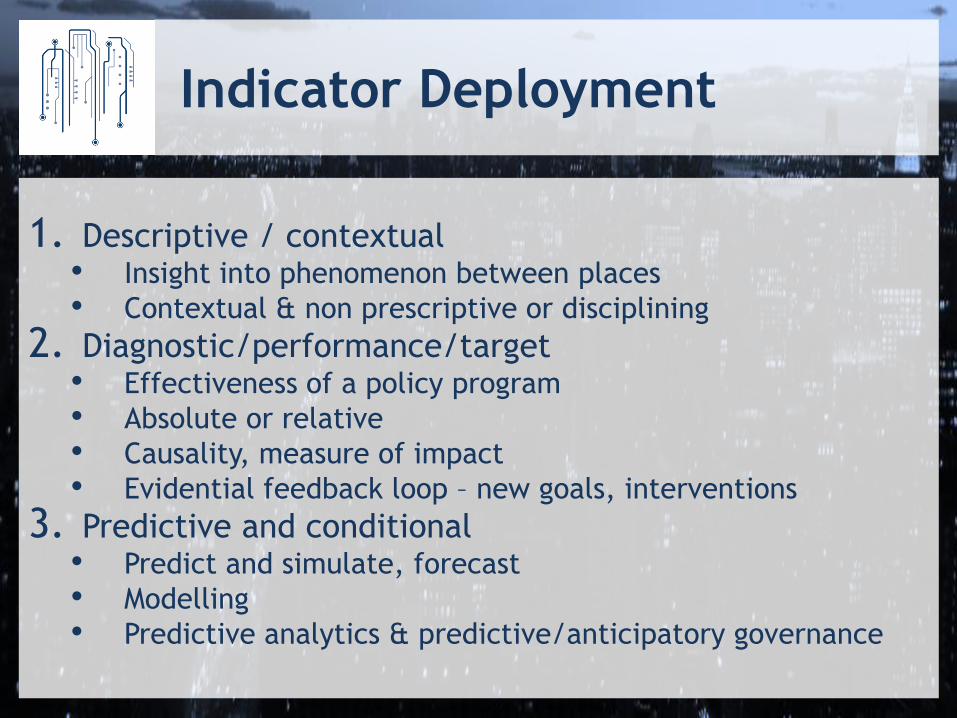
Indicator Deployment
1. Descriptive / contextual • Insight into phenomenon between places
• Contextual & non prescriptive or disciplining
2. Diagnostic/performance/target • Effectiveness of a policy program
• Absolute or relative
• Causality, measure of impact
• Evidential feedback loop – new goals, interventions
3. Predictive and conditional • Predict and simulate, forecast
• Modelling
• Predictive analytics & predictive/anticipatory governance
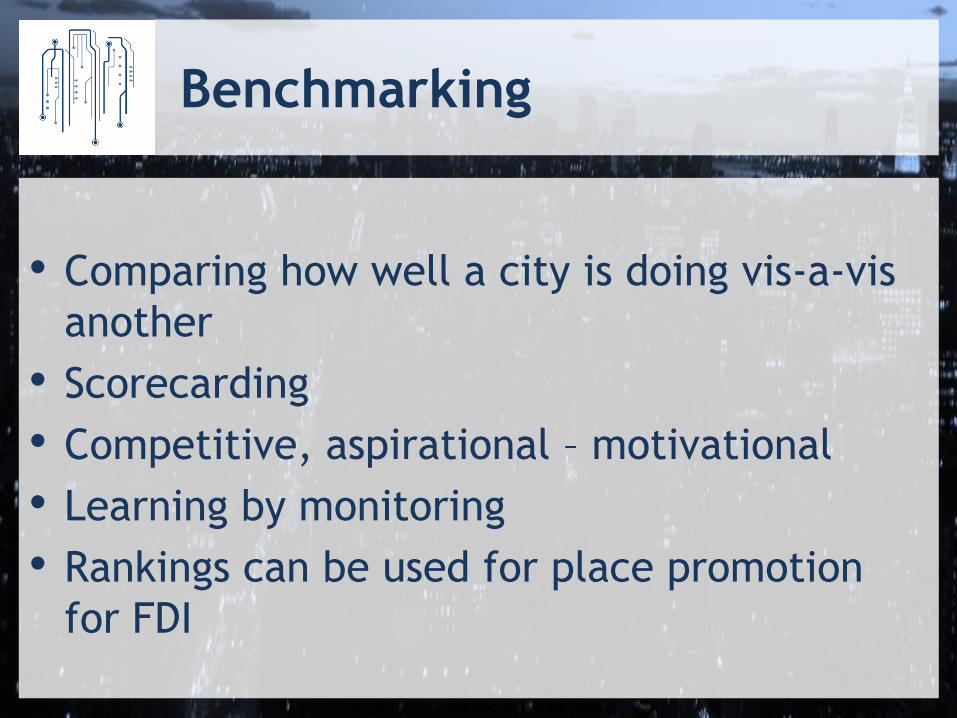
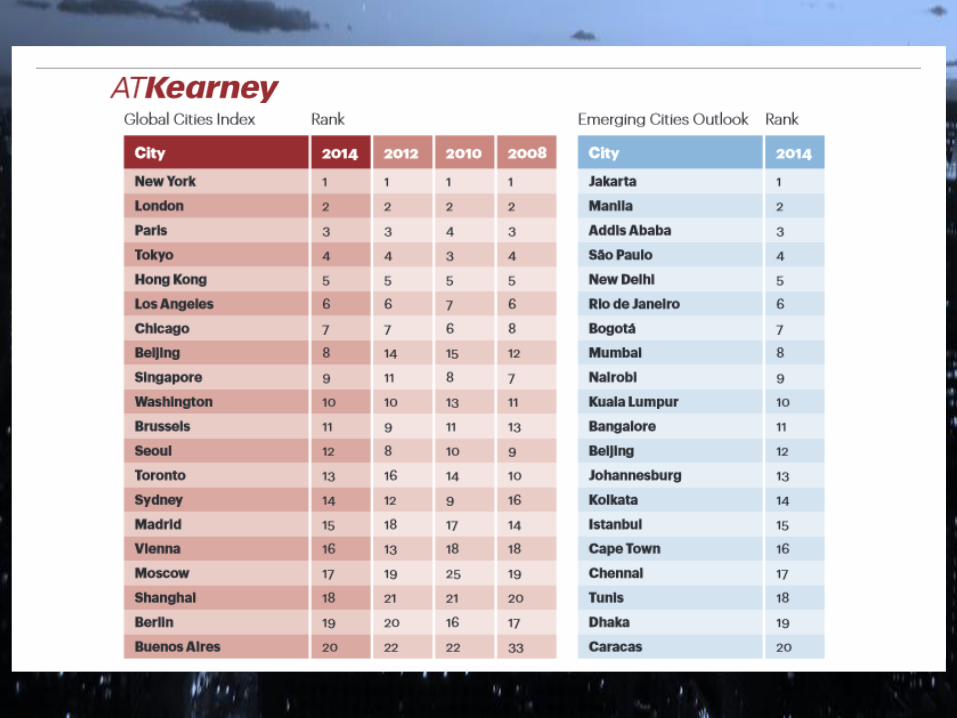
Benchmarking
• Comparing how well a city is doing vis-a-vis
another
• Scorecarding
• Competitive, aspirational – motivational
• Learning by monitoring
• Rankings can be used for place promotion
for FDI
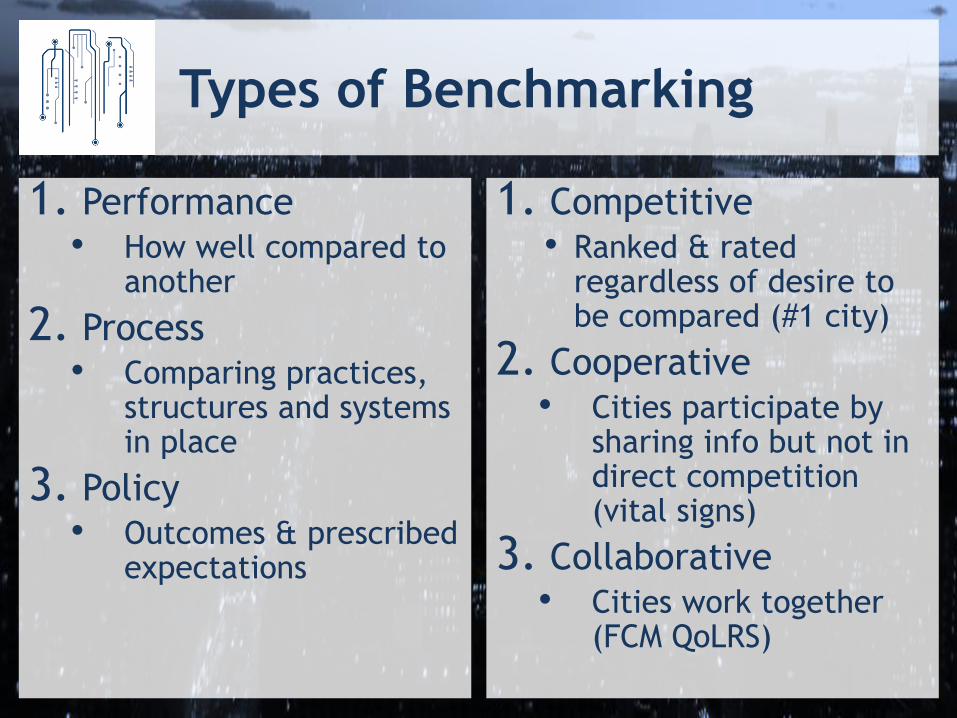
Types of Benchmarking
1. Performance • How well compared to
another
2. Process • Comparing practices,
structures and systems in place
3. Policy • Outcomes & prescribed
expectations
1. Competitive • Ranked & rated
regardless of desire to be compared (#1 city)
2. Cooperative • Cities participate by
sharing info but not in direct competition (vital signs)
3. Collaborative • Cities work together
(FCM QoLRS)

Real-Time Dashboards
• “a visual display of the
most important
information needed to
achieve one or more
objectives;
consolidated and
arranged on a single
screen so the
information can be
monitored at a glance”
(Cook 2006)
• Key info to run a city
• Console for navigating
and visualizing
interconnected data
• To improve the span of
control
• Easy interpretation &
interactive
• Control rooms
30 agencies, traffic, transport, emergency services, etc.

Indicating, benchmarking &
Dashboarding
• State of play of a city
• Objective, trustworthy,
factual data
• Rational, neutral,
comprehensive and
commonsensical view
of the city
• Monitor & evaluate
effectiveness
• Realist epistemology
2 views
1. Facilitating
empowerment,
democracy &
accountability &
transparency
2. Enacting regulation,
control, efficiency &
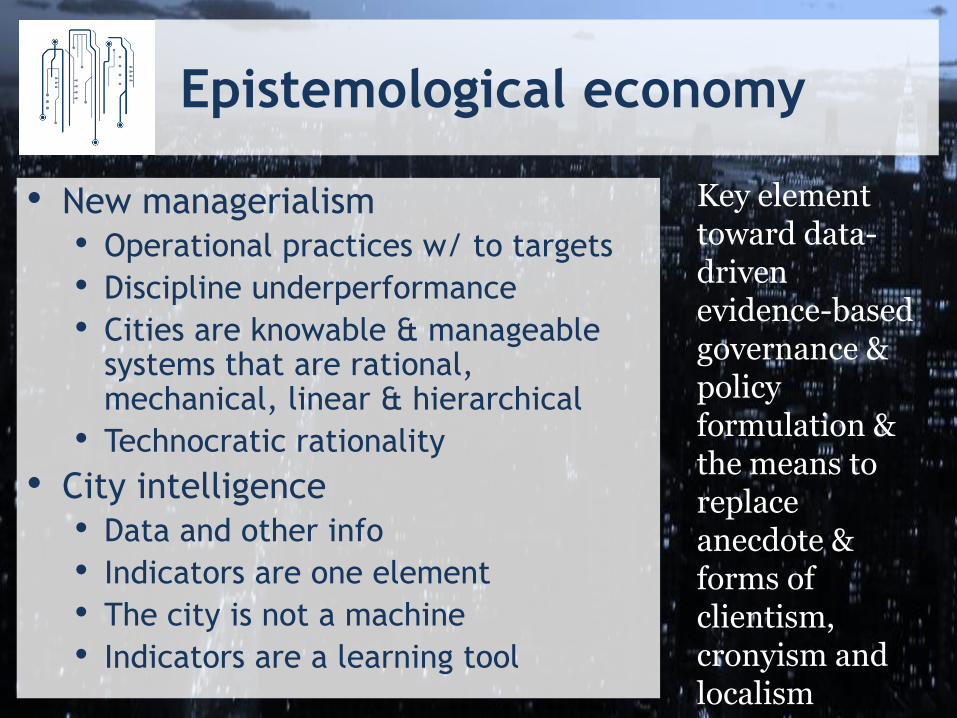
Epistemological economy
• New managerialism
• Operational practices w/ to targets
• Discipline underperformance
• Cities are knowable & manageable systems that are rational, mechanical, linear & hierarchical
• Technocratic rationality
• City intelligence
• Data and other info
• Indicators are one element
• The city is not a machine
• Indicators are a learning tool
Key element toward data-driven evidence-based governance & policy formulation & the means to replace anecdote & forms of clientism, cronyism and localism
Comstat
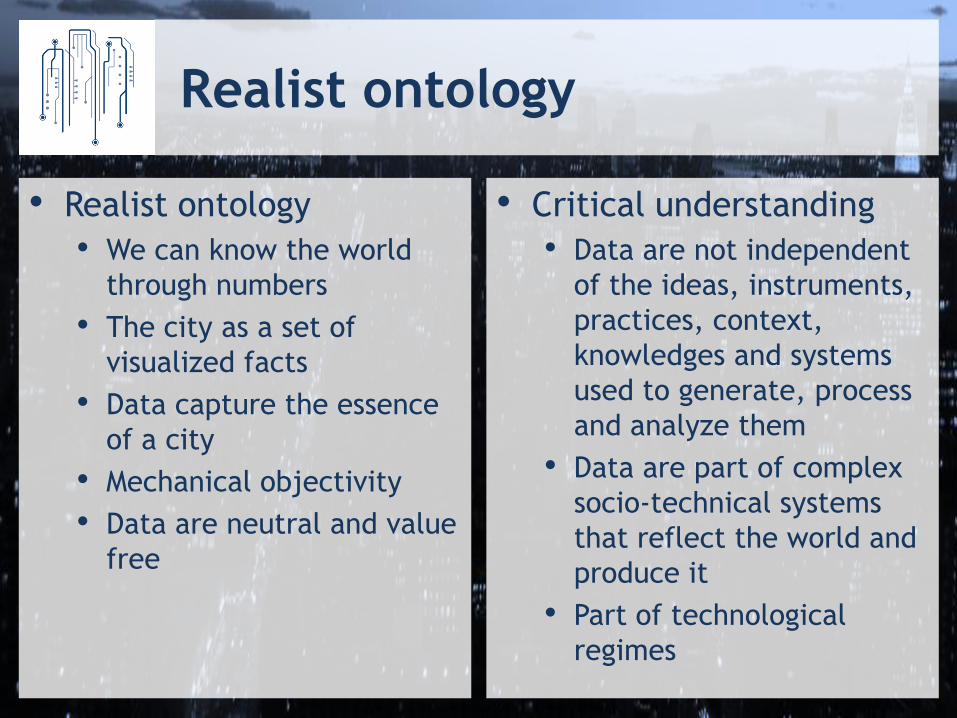
Realist ontology
• Realist ontology
• We can know the world
through numbers
• The city as a set of
visualized facts
• Data capture the essence
of a city
• Mechanical objectivity
• Data are neutral and value
free
• Critical understanding
• Data are not independent
of the ideas, instruments,
practices, context,
knowledges and systems
used to generate, process
and analyze them
• Data are part of complex
socio-technical systems
that reflect the world and
produce it
• Part of technological
regimes
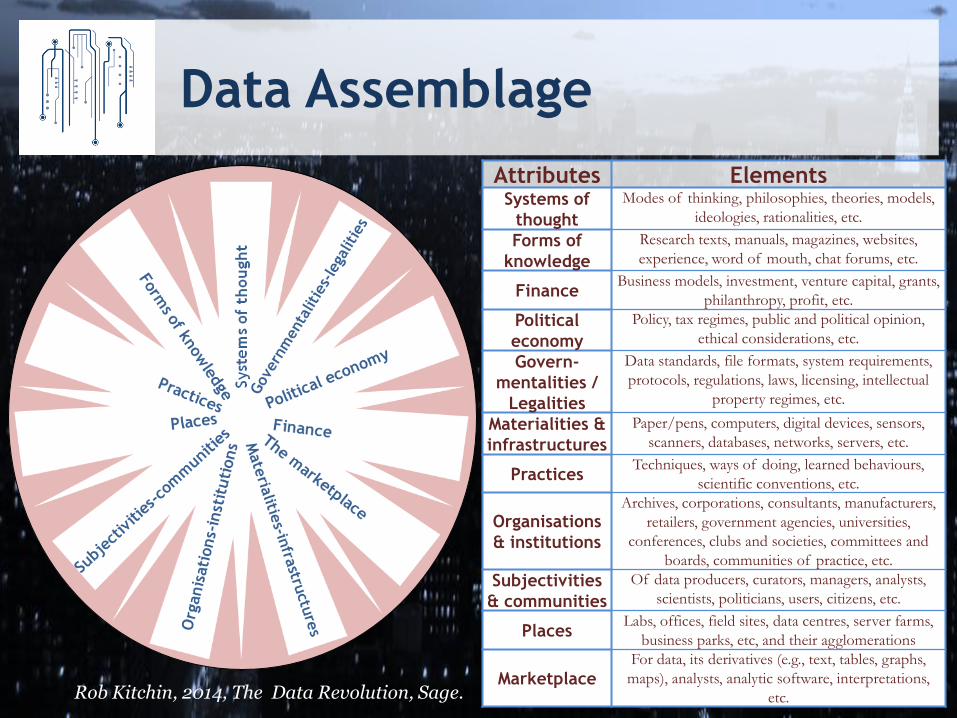
Data Assemblage
Attributes Elements Systems of
thought
Modes of thinking, philosophies, theories, models,
ideologies, rationalities, etc.
Forms of
knowledge
Research texts, manuals, magazines, websites,
experience, word of mouth, chat forums, etc.
Finance Business models, investment, venture capital, grants,
philanthropy, profit, etc.
Political
economy
Policy, tax regimes, public and political opinion,
ethical considerations, etc.
Govern-
mentalities /
Legalities
Data standards, file formats, system requirements,
protocols, regulations, laws, licensing, intellectual
property regimes, etc.
Materialities &
infrastructures
Paper/pens, computers, digital devices, sensors,
scanners, databases, networks, servers, etc.
Practices Techniques, ways of doing, learned behaviours,
scientific conventions, etc.
Organisations
& institutions
Archives, corporations, consultants, manufacturers,
retailers, government agencies, universities,
conferences, clubs and societies, committees and
boards, communities of practice, etc.
Subjectivities
& communities
Of data producers, curators, managers, analysts,
scientists, politicians, users, citizens, etc.
Places Labs, offices, field sites, data centres, server farms,
business parks, etc, and their agglomerations
Marketplace
For data, its derivatives (e.g., text, tables, graphs,
maps), analysts, analytic software, interpretations,
etc. Rob Kitchin, 2014, The Data Revolution, Sage.
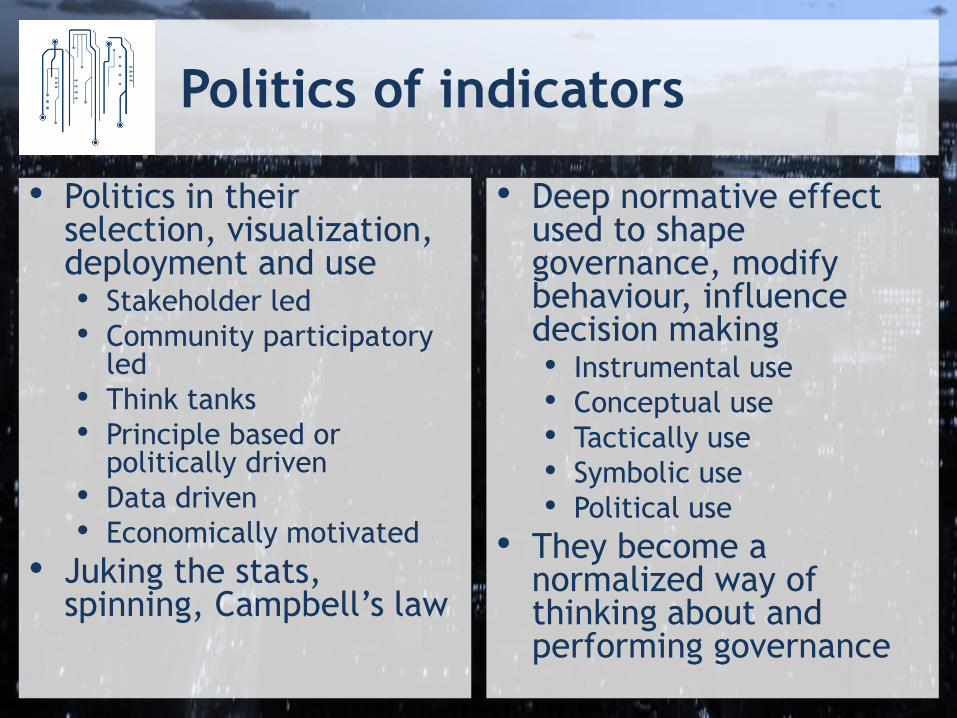
Politics of indicators
• Politics in their selection, visualization, deployment and use • Stakeholder led
• Community participatory led
• Think tanks
• Principle based or politically driven
• Data driven
• Economically motivated
• Juking the stats, spinning, Campbell’s law
• Deep normative effect used to shape governance, modify behaviour, influence decision making • Instrumental use
• Conceptual use
• Tactically use
• Symbolic use
• Political use
• They become a normalized way of thinking about and performing governance
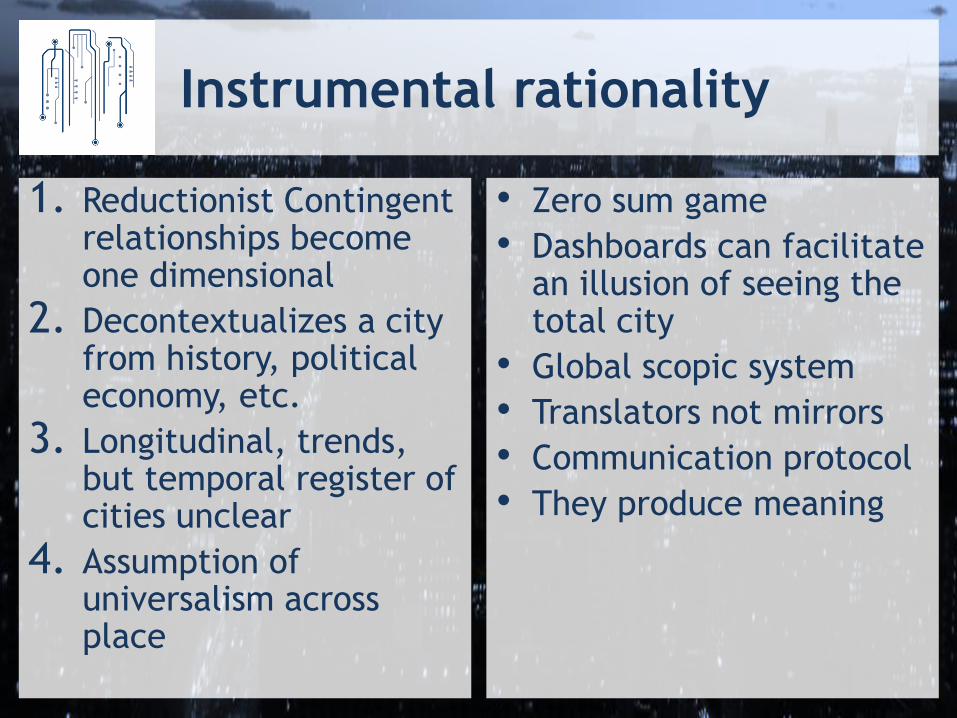
Instrumental rationality
1. Reductionist Contingent relationships become one dimensional
2. Decontextualizes a city from history, political economy, etc.
3. Longitudinal, trends, but temporal register of cities unclear
4. Assumption of universalism across place
• Zero sum game
• Dashboards can facilitate an illusion of seeing the total city
• Global scopic system
• Translators not mirrors
• Communication protocol
• They produce meaning
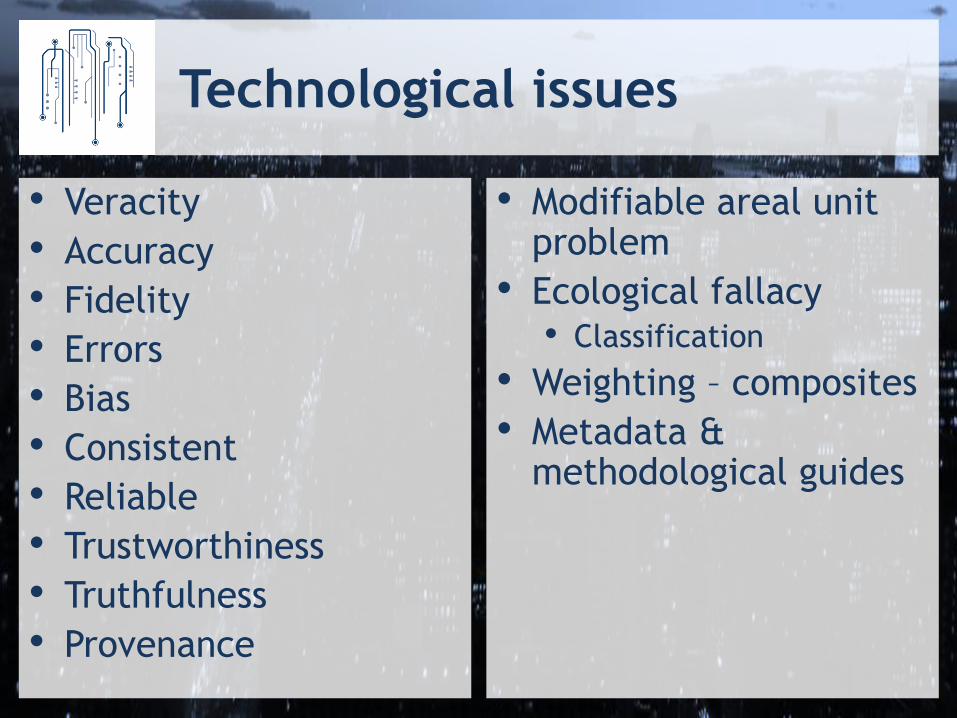
Technological issues
• Veracity
• Accuracy
• Fidelity
• Errors
• Bias
• Consistent
• Reliable
• Trustworthiness
• Truthfulness
• Provenance
• Modifiable areal unit problem
• Ecological fallacy • Classification
• Weighting – composites
• Metadata & methodological guides

Power/knowledge

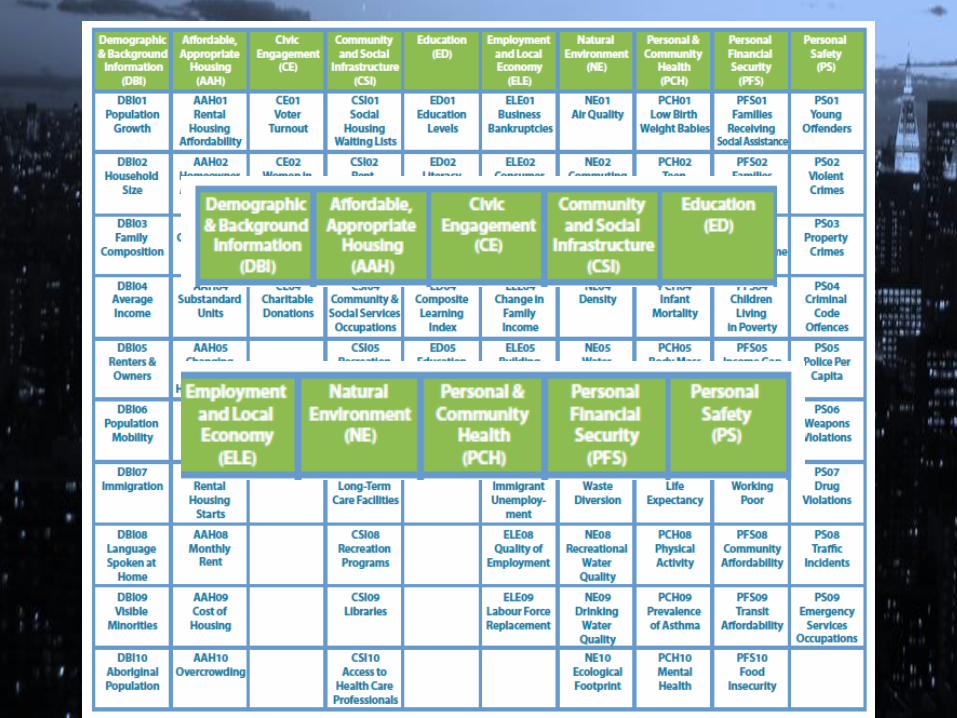
Federation of Canadian Municipalities
Quality of Life Indicator System
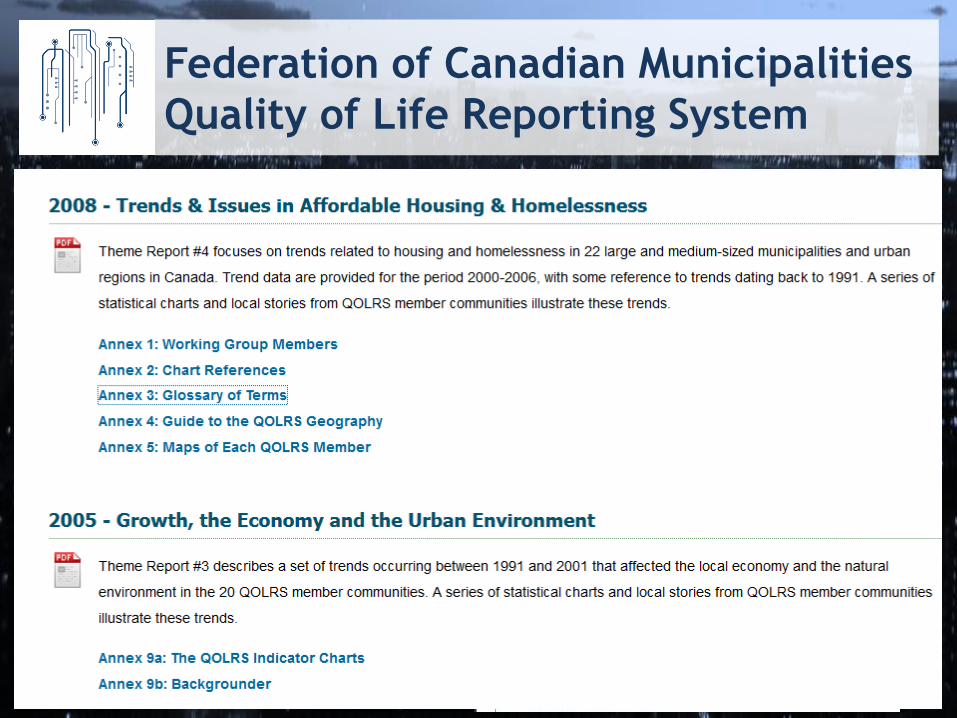
Federation of Canadian Municipalities
Quality of Life Reporting System
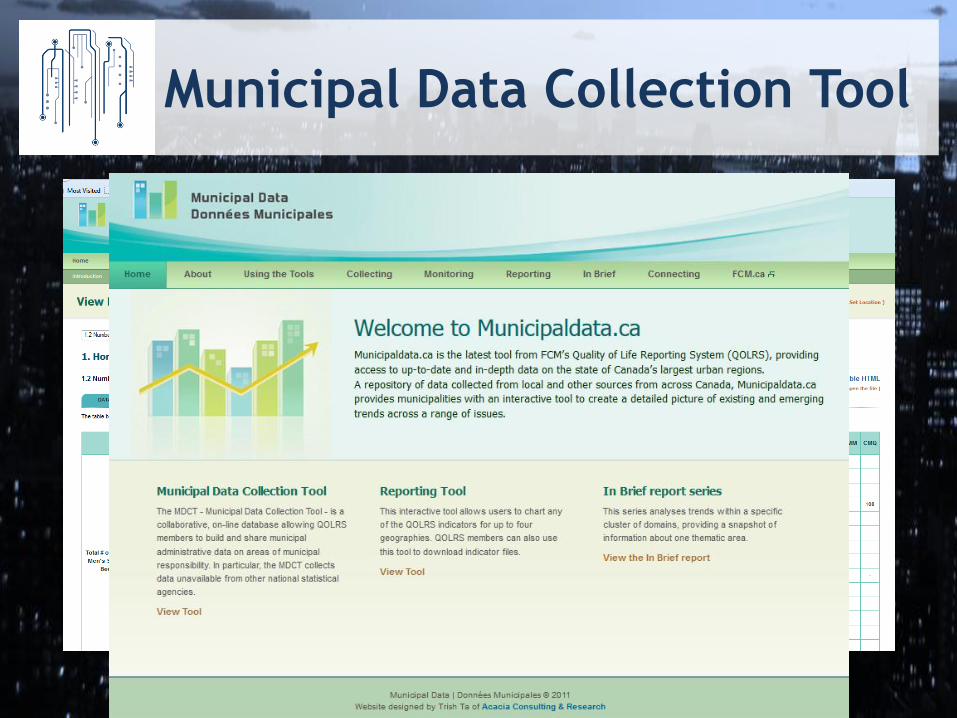
Municipal Data Collection Tool
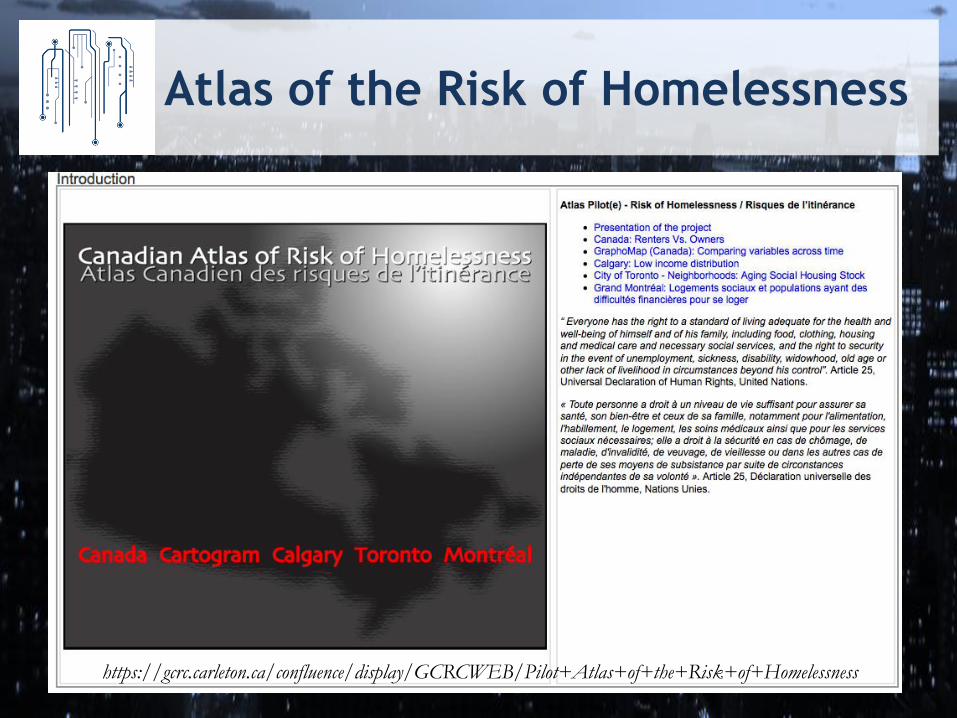
Atlas of the Risk of Homelessness
“https://gcrc.carleton.ca/confluence/display/GCRCWEB/Pilot+Atlas+of+the+Risk+of+Homelessness
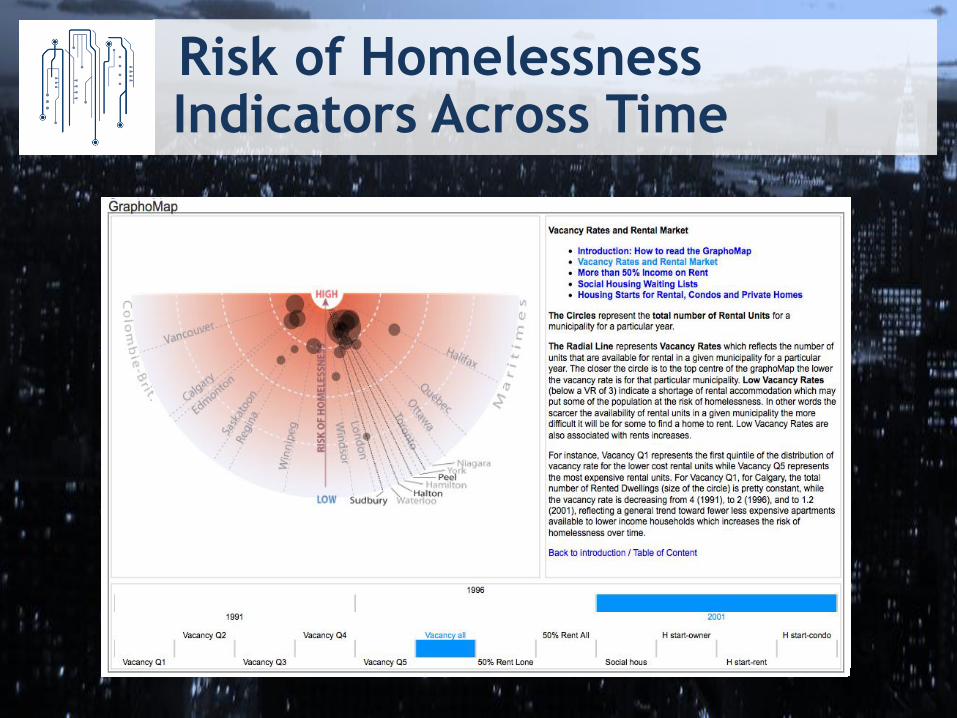
Risk of Homelessness Indicators Across Time
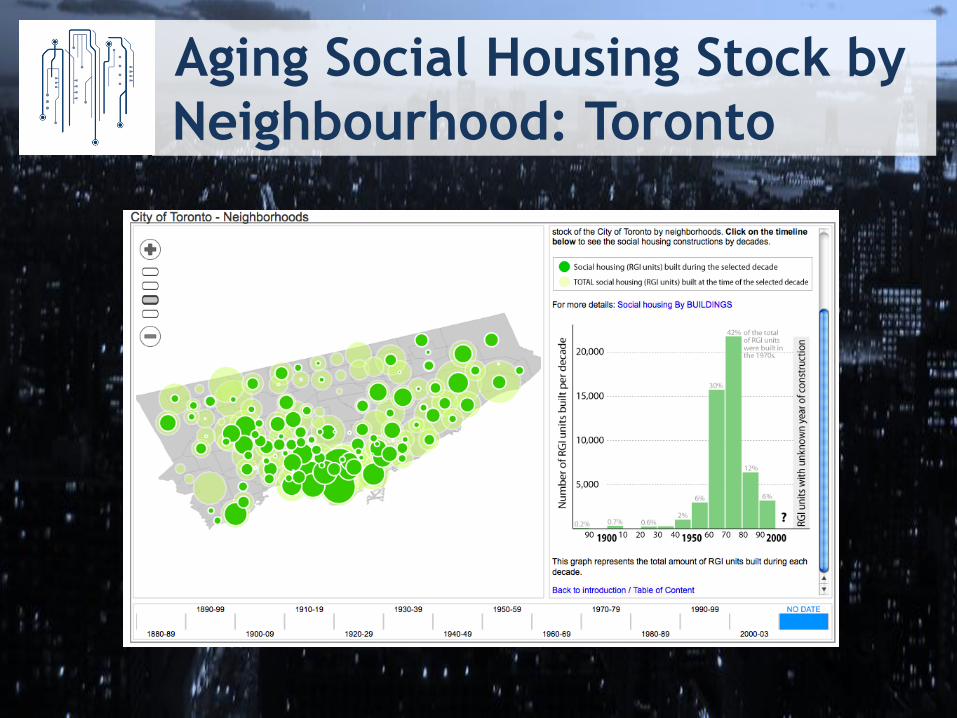
Aging Social Housing Stock by
Neighbourhood: Toronto

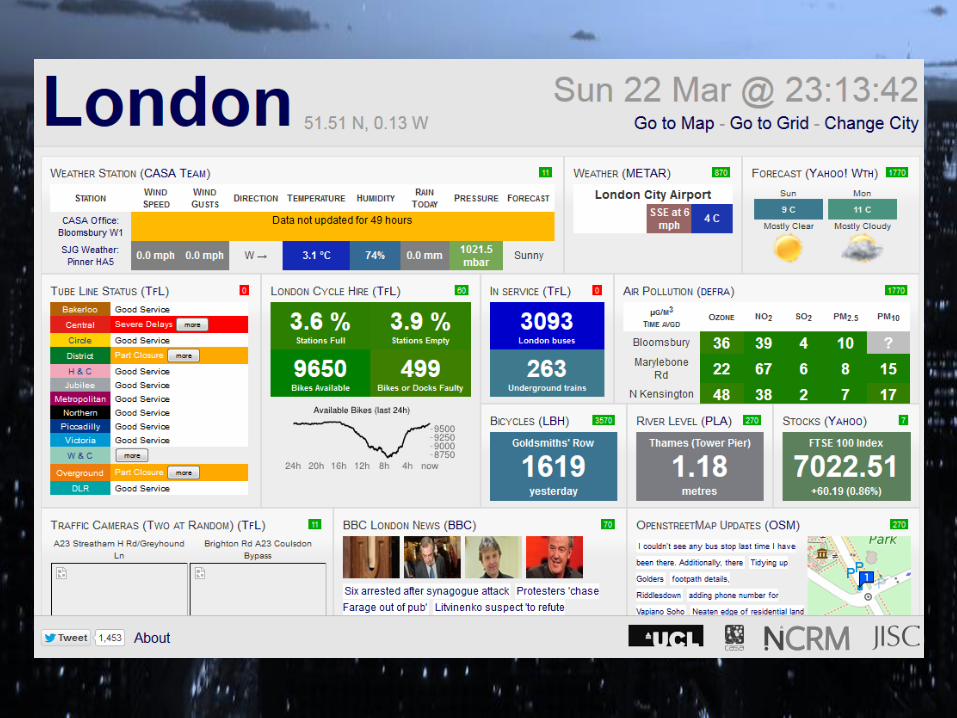
Dublin Dashboard
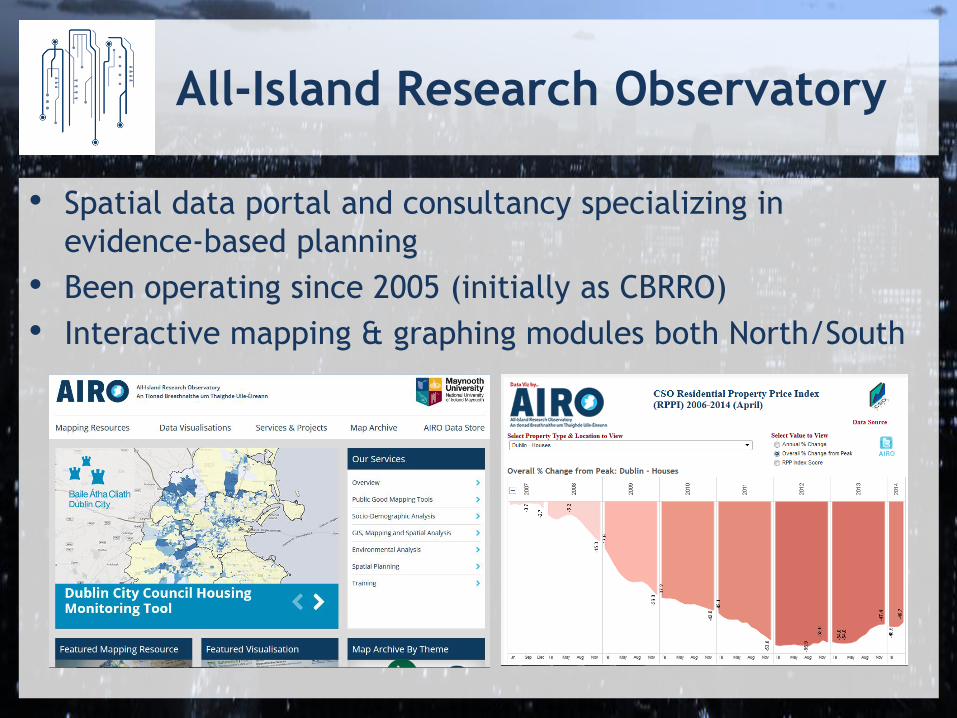
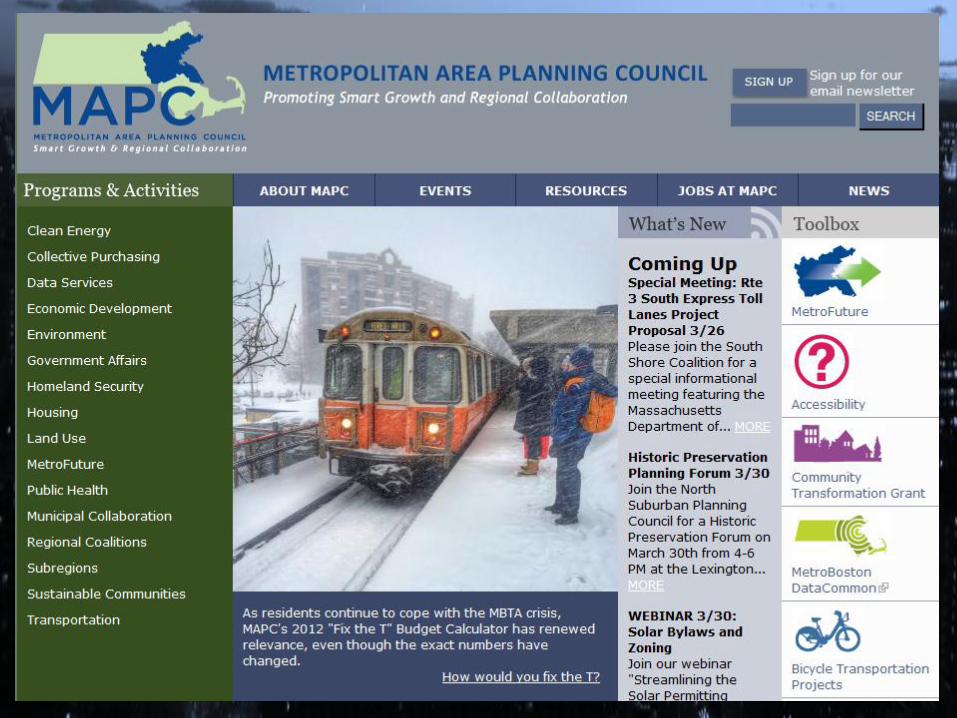
All-Island Research Observatory
• Spatial data portal and consultancy specializing in
evidence-based planning
• Been operating since 2005 (initially as CBRRO)
• Interactive mapping & graphing modules both North/South
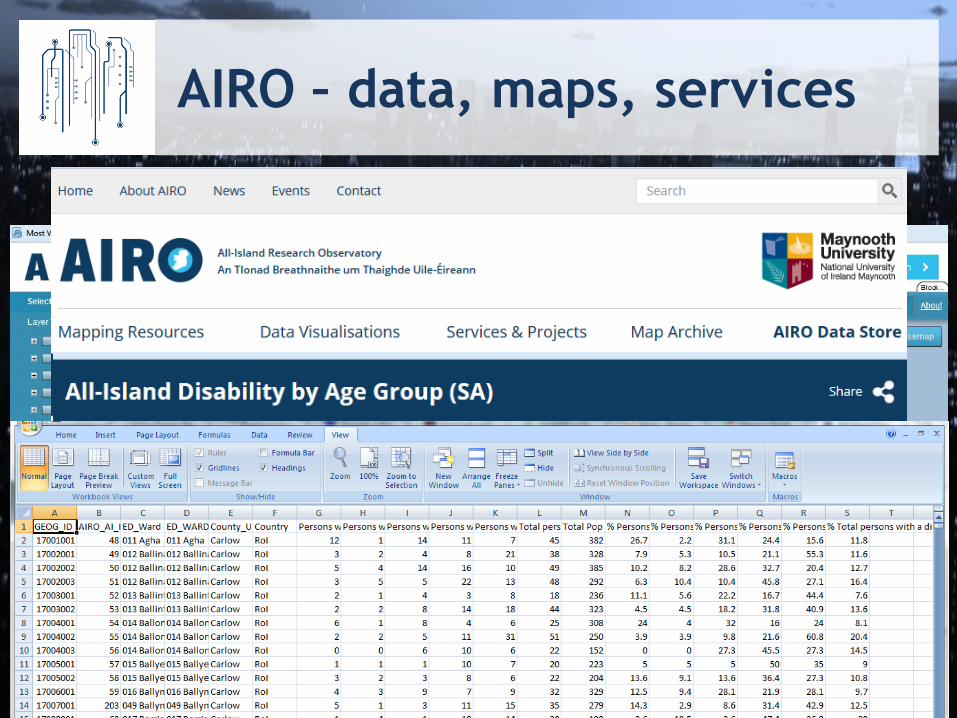
AIRO – data, maps, services
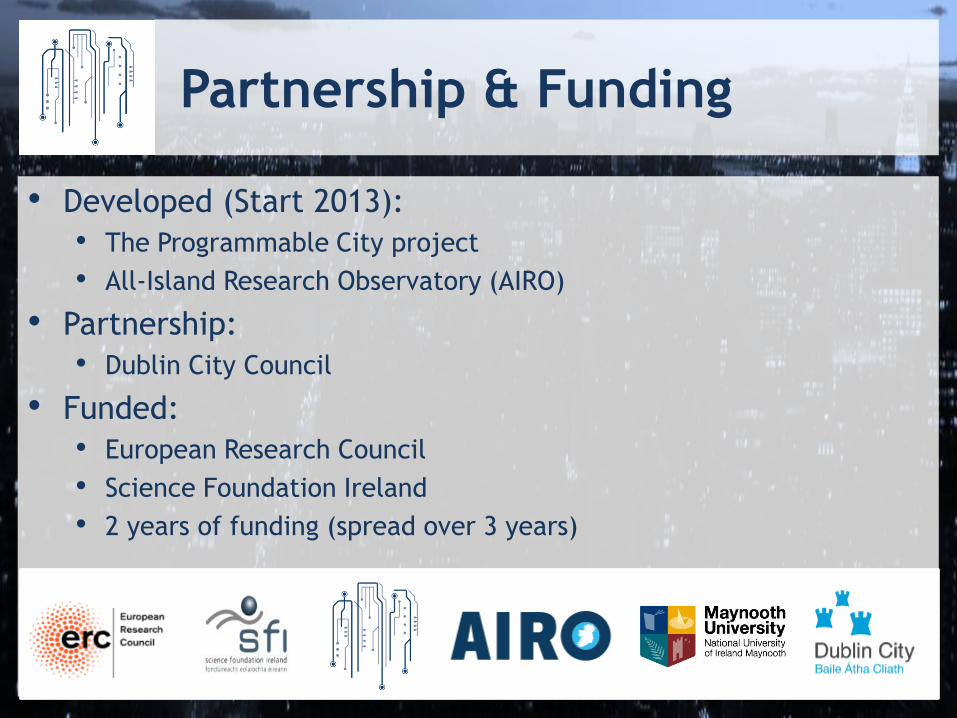
Partnership & Funding
• Developed (Start 2013):
• The Programmable City project
• All-Island Research Observatory (AIRO)
• Partnership:
• Dublin City Council
• Funded:
• European Research Council
• Science Foundation Ireland
• 2 years of funding (spread over 3 years)
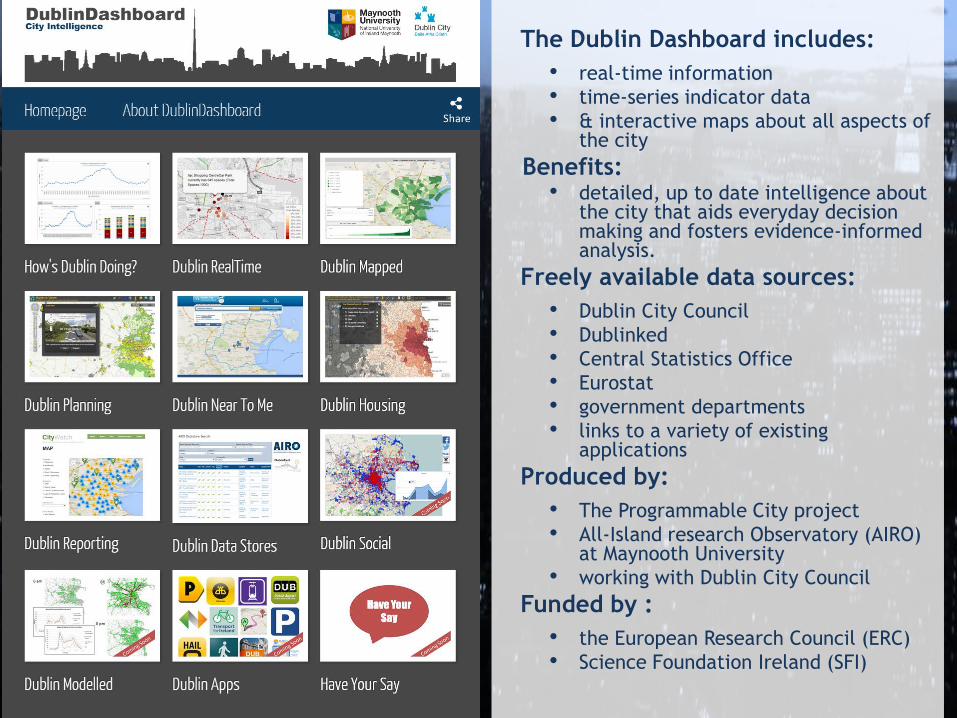
The Dublin Dashboard includes:
• real-time information
• time-series indicator data
• & interactive maps about all aspects of the city
Benefits: • detailed, up to date intelligence about
the city that aids everyday decision making and fosters evidence-informed analysis.
Freely available data sources:
• Dublin City Council
• Dublinked
• Central Statistics Office
• Eurostat
• government departments
• links to a variety of existing applications
Produced by:
• The Programmable City project
• All-Island research Observatory (AIRO) at Maynooth University
• working with Dublin City Council
Funded by :
• the European Research Council (ERC)
• Science Foundation Ireland (SFI)
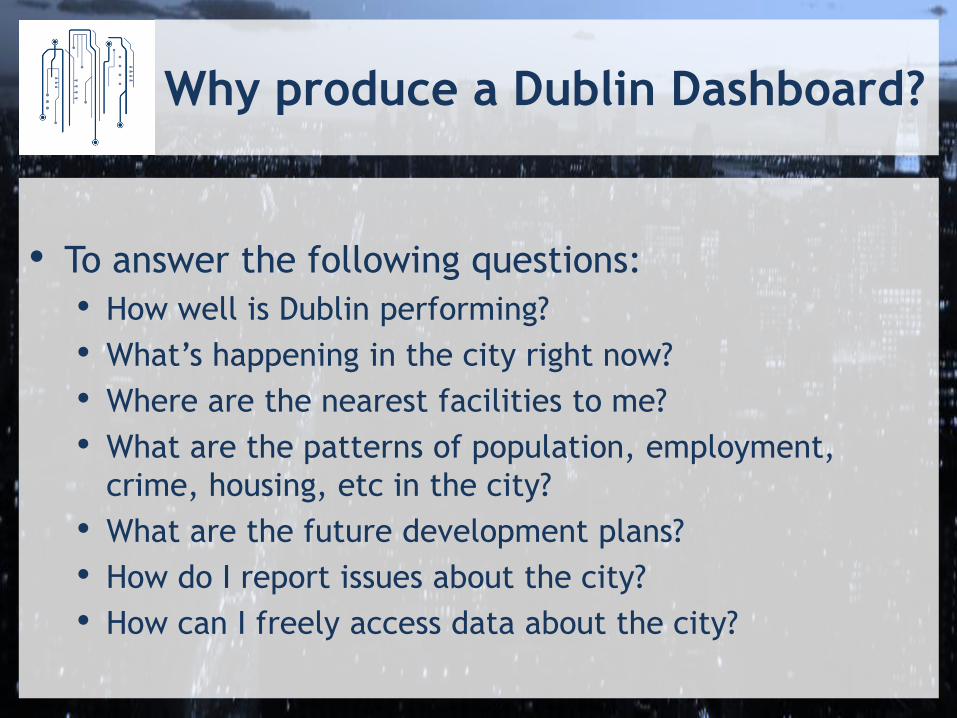
Why produce a Dublin Dashboard?
• To answer the following questions:
• How well is Dublin performing?
• What’s happening in the city right now?
• Where are the nearest facilities to me?
• What are the patterns of population, employment,
crime, housing, etc in the city?
• What are the future development plans?
• How do I report issues about the city?
• How can I freely access data about the city?
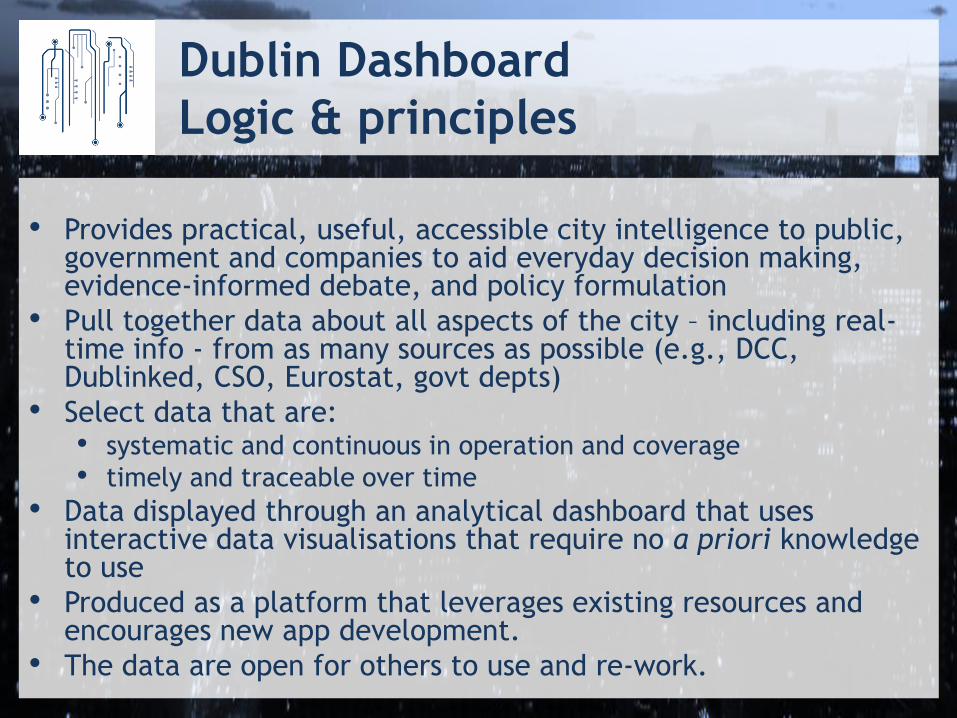
Dublin Dashboard
Logic & principles
• Provides practical, useful, accessible city intelligence to public, government and companies to aid everyday decision making, evidence-informed debate, and policy formulation
• Pull together data about all aspects of the city – including real-time info - from as many sources as possible (e.g., DCC, Dublinked, CSO, Eurostat, govt depts)
• Select data that are: • systematic and continuous in operation and coverage
• timely and traceable over time
• Data displayed through an analytical dashboard that uses interactive data visualisations that require no a priori knowledge to use
• Produced as a platform that leverages existing resources and encourages new app development.
• The data are open for others to use and re-work.
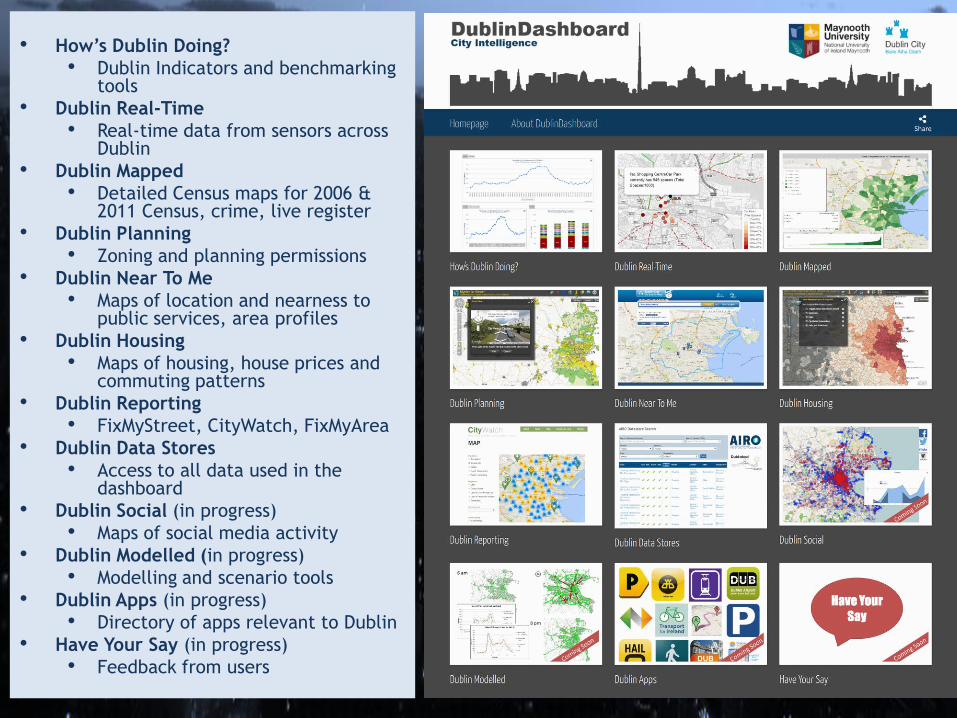
• How’s Dublin Doing?
• Dublin Indicators and benchmarking tools
• Dublin Real-Time
• Real-time data from sensors across Dublin
• Dublin Mapped
• Detailed Census maps for 2006 & 2011 Census, crime, live register
• Dublin Planning
• Zoning and planning permissions
• Dublin Near To Me
• Maps of location and nearness to public services, area profiles
• Dublin Housing
• Maps of housing, house prices and commuting patterns
• Dublin Reporting
• FixMyStreet, CityWatch, FixMyArea
• Dublin Data Stores
• Access to all data used in the dashboard
• Dublin Social (in progress)
• Maps of social media activity
• Dublin Modelled (in progress)
• Modelling and scenario tools
• Dublin Apps (in progress)
• Directory of apps relevant to Dublin
• Have Your Say (in progress)
• Feedback from users
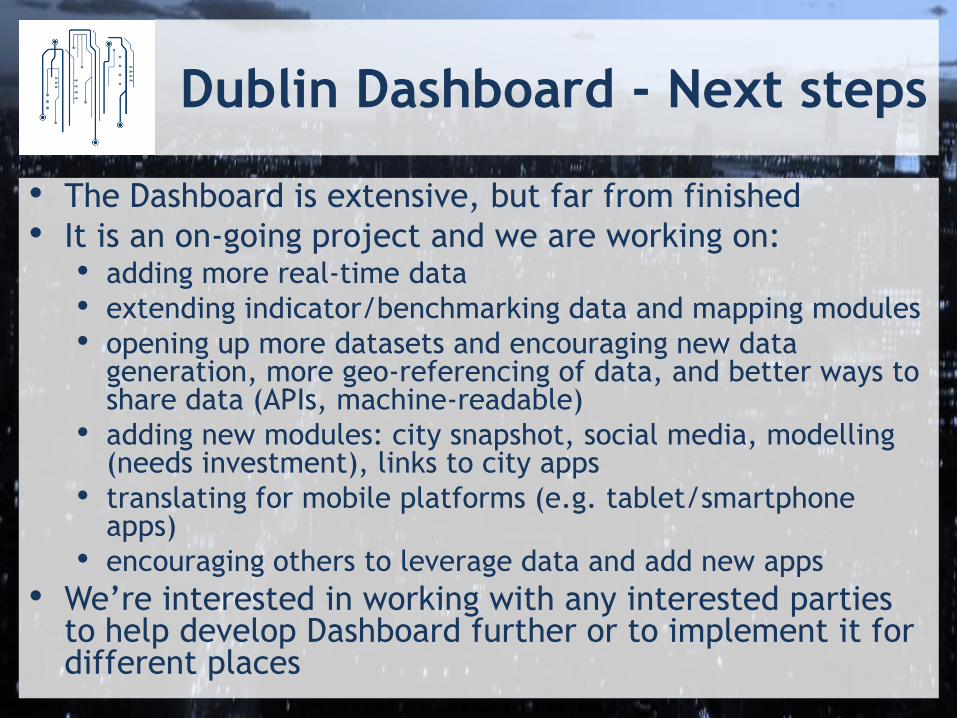
Dublin Dashboard - Next steps
• The Dashboard is extensive, but far from finished
• It is an on-going project and we are working on: • adding more real-time data
• extending indicator/benchmarking data and mapping modules
• opening up more datasets and encouraging new data generation, more geo-referencing of data, and better ways to share data (APIs, machine-readable)
• adding new modules: city snapshot, social media, modelling (needs investment), links to city apps
• translating for mobile platforms (e.g. tablet/smartphone apps)
• encouraging others to leverage data and add new apps
• We’re interested in working with any interested parties to help develop Dashboard further or to implement it for different places
Open Data Indicators
URLs
1. Federation of Canadian Municipalities (FCM) Quality of Life Indicator System - http://www.fcm.ca/home/programs/quality-of-life-reporting-system/faqs.htm
2. Municipal Data Collection Tool (MDCT) http://www.municipaldata-donneesmunicipales.ca/index.php?lang=en
3. Atlas of the Risk of Homelessness https://gcrc.carleton.ca/confluence/display/GCRCWEB/Pilot+Atlas+of+the+Risk+of+Homelessness
4. Dublin Dashboard http://www.dublindashboard.ie/pages/index
5. Open Knowledge Foundation Index http://index.okfn.org/
6. G8 Open Data Charter http://www.ogpireland.ie/2013/06/28/g8-charter-on-open-data/
Q & A
Acknowledgements Programmable City project research is funded by a European Research Council Advanced Investigator award
(ERC-2012-AdG-323636-SOFTCITY).
"Great cities embrace the data ... they are not defensive about it ... they improve" Louisville Mayor, Greg Fischer