evidence for a sal1-pap chloroplast retrograde pathway ... · pdf fileevidence for a sal1-pap...
TRANSCRIPT
Evidence for a SAL1-PAP Chloroplast Retrograde PathwayThat Functions in Drought and High Light Signalingin Arabidopsis C W OA
Gonzalo M. Estavillo,a Peter A. Crisp,a Wannarat Pornsiriwong,a Markus Wirtz,b Derek Collinge,a Chris Carrie,c
Estelle Giraud,c James Whelan,c Pascale David,d Helene Javot,d Charles Brearley,e Rudiger Hell,b Elena Marin,d
and Barry J. Pogsona,1
a Australian Research Council Centre of Excellence in Plant Energy Biology, Research School of Biology, Australian National
University Canberra, Acton, Australian Capital Territory 0200, Australiab University of Heidelberg, Heidelberg Institute for Plant Sciences, 69120 Heidelberg, Germanyc ARC Centre of Excellence in Plant Energy Biology, University of Western Australia, Crawley, Western Australia 6009, Australiad Commissariat a l’Energie Atomique, Direction des Sciences du Vivant Institut de Biologie Environnementale et de
Biotechnologie, Laboratoire de Biologie du Developpement des Plantes, Unite Mixte de Recherche 6191 Centre National de
la Recherche Scientifique, Commissariat a l’Energie Atomique, Aix-Marseille II, F-13108 Saint-Paul-lez-Durance, Francee School of Biological Sciences, University of East Anglia, Norwich NR4 7TJ, United Kingdom
Compartmentation of the eukaryotic cell requires a complex set of subcellular messages, including multiple retrograde
signals from the chloroplast and mitochondria to the nucleus, to regulate gene expression. Here, we propose that one such
signal is a phosphonucleotide (39-phosphoadenosine 59-phosphate [PAP]), which accumulates in Arabidopsis thaliana in
response to drought and high light (HL) stress and that the enzyme SAL1 regulates its levels by dephosphorylating PAP to
AMP. SAL1 accumulates in chloroplasts and mitochondria but not in the cytosol. sal1mutants accumulate 20-fold more PAP
without a marked change in inositol phosphate levels, demonstrating that PAP is a primary in vivo substrate. Significantly,
transgenic targeting of SAL1 to either the nucleus or chloroplast of sal1 mutants lowers the total PAP levels and expression
of the HL-inducible ASCORBATE PEROXIDASE2 gene. This indicates that PAP must be able to move between cellular
compartments. The mode of action for PAP could be inhibition of 59 to 39 exoribonucleases (XRNs), as SAL1 and the nuclear
XRNs modulate the expression of a similar subset of HL and drought-inducible genes, sal1 mutants accumulate XRN
substrates, and PAP can inhibit yeast (Saccharomyces cerevisiae) XRNs. We propose a SAL1-PAP retrograde pathway that
can alter nuclear gene expression during HL and drought stress.
INTRODUCTION
The evolution of the eukaryotic cell necessitated the develop-
ment of signaling between compartments or organelles to co-
ordinate cell differentiation, development, and acclimation to
altered environmental stimuli. In plants, the transcriptional and
developmental program of the chloroplast is tightly integrated
with the nuclear program (Vranova et al., 2002; Nott et al., 2006;
Pogson et al., 2008; Kleine et al., 2009; Pfannschmidt, 2010). This
is required because chloroplast multiprotein complexes, such as
ribosomes and the photosystems, are mosaics of subunits
transcribed from both the plastid and nuclear genomes. Thus,
coexpression from both genomes is essential to enable coordi-
nated assembly and maintenance of photosynthesis. For exam-
ple, if chloroplasts become damaged, they initiate retrograde
signals that are sent to the nucleus to preclude unnecessary
transcription of nuclear-encoded proteins that are targeted to
the chloroplast (Bradbeer et al., 1979). A range of signals and
pathways have been proposed and actively debated (Pogson
et al., 2008; Kleine et al., 2009; Pfannschmidt, 2010). However,
no chemical signal has been reported that moves directly from
the chloroplast to the nucleus via the cytosol to regulate gene
expression nor has a protein been reported that directly regu-
lates the levels of such a compound.
There is evidence for multiple retrograde pathways; indeed,
given the complexity and number of differentmetabolic reactions
undertaken within the plastid, that is to be expected (Pogson
et al., 2008; Pfannschmidt, 2010). Retrograde signals can be
divided into two classes: those related to chloroplast and pho-
tosystem biogenesis (biogenic control) and those related to the
operation of the chloroplast in response to changing environ-
mental stimuli (operational control) (Pogson et al., 2008). Forward
genetic screens have identified several protein components of
biogenic control signaling pathways. Examples of biogenic
1 Address correspondence to [email protected] author responsible for distribution of materials integral to thefindings presented in this article in accordance with the policy describedin the Instructions for Authors (www.plantcell.org) is: Barry J. Pogson([email protected]).CSome figures in this article are displayed in color online but in blackand white in the print edition.WOnline version contains Web-only data.OAOpen Access articles can be viewed online without a subscription.www.plantcell.org/cgi/doi/10.1105/tpc.111.091033
The Plant Cell, Vol. 23: 3992–4012, November 2011, www.plantcell.org ã 2011 American Society of Plant Biologists. All rights reserved.
control mutants include the snowy cotyledon (Albrecht et al.,
2010) and genomes uncoupled (gun) mutants (Susek et al., 1993;
Larkin et al., 2003; Strand et al., 2003; Koussevitzky et al., 2007;
Ruckle et al., 2007). With respect to biogenic control, a tetrapyr-
role was proposed tomove from the chloroplast to cytosol where
it was hypothesized it would interact with cytosolic targets such
as HSP90 (Strand et al., 2003; Kindgren et al., 2011). However,
this has been actively debated by other groups (Mochizuki et al.,
2008; Moulin et al., 2008). Recently, another tetrapyrrole, heme,
was proposed as a putative plastid biogenic signal in plants, but
no changes in heme levels or evidence for hememovement from
the chloroplast were reported nor were cytosolic/nuclear signal-
ing partners described (Woodson et al., 2011). Although there
is evidence that tetrapyrroles trigger retrograde signaling in
plants, what the actual pathways are remains an open question
(Pfannschmidt, 2010).
With respect to operational control or chloroplast-nuclear
signaling in response to environmental stimuli, considerable
detail is understood about the initiation of signaling cascades
in the chloroplast and transcriptional changes in the nucleus,
but the intervening steps are largely unknown. Environmental
stresses that perturb photosynthesis, such as high light (HL) and
drought, induce reactive oxygen species (ROS), changes in
redox state of plastoquinone, and changes in abscisic acid
(ABA) concentration that are implicated in the HL response
pathways (Karpinski et al., 1999; Vranova et al., 2002; Nott et al.,
2006; Rossel et al., 2006; Lee et al., 2007; Pogson et al., 2008;
Van Breusegem et al., 2008; Foyer and Noctor, 2009; Galvez-
Valdivieso et al., 2009; Kleine et al., 2009; Pfannschmidt et al.,
2009; Wilson et al., 2009). In the nucleus, HL alters the expres-
sion of ;700 genes (Rossel et al., 2007), including APX2
(Karpinski et al., 1999; Rossel et al., 2006) and EARLY LIGHT
INDUCIBLE PROTEIN2 (ELIP2) (Harari-Steinberg et al., 2001;
Kimura et al., 2003). A number of transcription factors are
induced by HL, including DROUGHT RESPONSE BINDING 2A
(DREB2A) and ZAT10; the latter can regulate the expression of
18% of the HL transcriptome, including APX2 (Rossel et al.,
2007). Other HL-inducible genes, such as ELIP2, are regulated
by cryptochromes (Kleine et al., 2007).
To identify steps between initiation of the signal and percep-
tion in the nucleus, screens for altered gene expression during
oxidative stress have identified a series of mutations, including
executer1 and 2, regulator of APX2, and altered APX2 expres-
sion8 (alx8) (Ball et al., 2004; Wagner et al., 2004; Rossel et al.,
2006; Wilson et al., 2009). Yet, the actual retrograde signals
regulated by the multiple biogenic and operational pathways still
remain unknown.
The alx8 mutant exhibits constitutive upregulation of 25% of
the HL-regulated transcriptome, including ZAT10, DREB2A,
ELIP2, and APX2, along with hyperexpression of these tran-
scripts upon HL stress (Rossel et al., 2006; Wilson et al., 2009).
Indeed, as 70% of HL-inducible genes are also upregulated by
drought (Kimura et al., 2002), it was not surprising that the alx8
mutant is also drought tolerant, surviving water deprivation up to
50% longer than wild-type plants. These phenotypes are caused
by a lesion in theSAL1/ALX8/FRY1 gene and implicate SAL1 as a
component of HL and drought stress signaling networks (Wilson
et al., 2009; Hirsch et al., 2011).
SAL1 is a phosphatase that hydrolyzes a phosphate group
from both phosphonucleotides and inositol polyphosphates in
vitro (Quintero et al., 1996; Xiong et al., 2001). Inositol 1,4,5-
trisphosphate (IP3) is viewed as one of themost logical targets for
SAL1 in vivo (Xiong et al., 2001; Zhang et al., 2011). However,
other findings usingmutants and transgenic plants suggest SAL1
may be degrading 39-phosphoadenosine 59-phosphosulfate(PAPS) (Rodrıguez et al., 2010) or 39-phosphoadenosine 59-phosphate (PAP) (Gy et al., 2007; Kim and von Arnim, 2009).
Moreover, the enzymatic activity of recombinant SAL1 is similar
for both phosphoadenosines (Gil-Mascarell et al., 1999), but the
phosphatase activity against IP3 is only 4% of that against PAP
(Xiong et al., 2001). The in vivo substrate is not resolved, as a
recent article proposed for IP3 (Zhang et al., 2011). SAL1 is
involved in many cellular processes, and identification of its
primary substrates is required to better understand the mode of
action of this phosphatase.
PAP is produced from PAPS during sulphation reactions
catalyzed by cytosolic sulfotransferases (Klein and Papenbrock,
2004). Although PAP was originally viewed as a byproduct with
no physiological function in plants, it can inhibit the activity of the
two yeast (Saccharomyces cerevisiae) 59 to 39 exoribonucleases(XRNs), thereby altering RNA catabolism (Dichtl et al., 1997).
Treatment of yeast with lithium (Li+), a strong inhibitor of the yeast
SAL1 homolog (Sc-SAL1), results in an increase in PAP (Murguıa
et al., 1996) sufficient to inhibit XRNs, resulting in the accumu-
lation of transcripts targeted by Xrn1 in yeast (Dichtl et al., 1997;
van Dijk et al., 2011). Moreover, a PAP concentration of 0.1 mM
inhibits the in vitro activity of the two yeast XRNs by 40 to 65%
(Dichtl et al., 1997). SAL1 has recently been linked to several
developmental and morphological processes in plants (Wilson
et al., 2009; Robles et al., 2010; Rodrıguez et al., 2010; Zhang
et al., 2011); interestingly, Arabidopsis thaliana xrnmutants have
a similar leaf and root morphology to that of sal1 mutants (Gy
et al., 2007; Hirsch et al., 2011).
Although SAL1 functions in stress signaling and other fun-
damental plant processes, the subcellular localization, the in
vivo substrate, and the mode of action of SAL1 are either
unknown or debated. For example, the SAL1 protein has been
reported to be localized in the chloroplast (Rodrıguez et al.,
2010), cytosol (Zhang et al., 2011), and nucleus (Kim and von
Arnim, 2009) by different techniques. Consequently, it is crit-
ical to resolve its cellular location, to identify the in vivo
substrates, and to investigate how the accumulation of its
substrates in the cell might function in cellular signaling. More
significantly, there is no indication in the literature whether PAP
could act as a retrograde signal linking organelle status with
nuclear gene expression. Indeed, there is no report of PAP
measurements in plants, which precluded the study of its role
in planta.
In this study, we show that SAL1 accumulates in both the
chloroplasts and the mitochondria and provide evidence that
PAP levels are modulated by SAL1. We propose that PAP
functions as a mobile signal that alters RNA metabolism by
inhibiting XRNs to affect stress and developmental gene
expression and that the chloroplastic SAL1 protein can pre-
vent its action by degrading PAP in the chloroplastic com-
partment.
SAL1-PAP–Mediated Retrograde Signaling 3993

RESULTS
SAL1 Expression Correlates Spatially with Responses to
HL Stress
We previously showed that the lack of the SAL1 protein in the
alx8 mutant promotes constitutive APX2:LUCIFERASE (LUC)
expression in the vascular tissue (Rossel et al., 2006; Wilson
et al., 2009). Here, we investigated the expression pattern of
SAL1 in mature leaf tissue by reporter gene analyses. Expres-
sion of green fluorescent protein (GFP) driven by the SAL1
promoter (pSAL1:SAL1:GFP) was stronger in the vascular tis-
sue than in the mesophyll tissue of the leaf (Figure 1A). The
vascular tissue is the primary site of production of H2O2,
especially after HL stress (Fryer et al., 2003) (Figure 1B). By
contrast, the HL induction of H2O2 in alx8 vascular tissue was
much lower, and the total H2O2 foliar level of plants grown under
normal conditions was half of that in the wild type (Figure 1C).
Thus, SAL1 expression colocalizes with APX2:LUC activity,
with the loss of SAL1 leading to increased APX2 expression
(Rossel et al., 2006; Wilson et al., 2009) and reduced H2O2
levels in the vasculature. Furthermore, it demonstrates that the
elevated expression of APX2 and other HL-regulated genes is
not due to elevated levels of H2O2.
PAPAccumulates insal1MutantsandduringDroughtStress
In vitro, SAL1 has a dual phosphatase activity against both
polyphosphoinositols, such as IP3 (Xiong et al., 2001; Zhang
et al., 2011), and 39(29),59-biphosphate nucleotides, such as PAP
or PAPS (Quintero et al., 1996). PAPS and IP3 have been reported
to be in vivo substrates (Xiong et al., 2001; Rodrıguez et al., 2010;
Zhang et al., 2011); PAP has been suggested as a substrate
based on work with transgenic plants (Kim and von Arnim, 2009;
Chen and Xiong, 2010; Hirsch et al., 2011).We used two different
approaches to investigate if the SAL1 phosphatase activity
against PAP regulated the expression of APX2 and, thus, ROS
levels. First, we tested the hypothesis that accumulation of PAP
could upregulate the APX2 promoter and induce the alx8 phe-
notype by feeding PAP to Columbia-0 (Col-0) plants transformed
with the reporter gene APX2:LUC. However, no significant
change in APX2:LUC activity was observed when feeding in-
creasing concentrations of PAP to 7-d-old plants via the roots
under either low light (LL) or HL (see Supplemental Figure
1 online). Failed root substrate uptake or impaired vasculature
transport, import into leaf cells, or perception are possible
explanations for the negative results of the feeding experiment.
Next, we directlymeasured inositol phosphates (IPs) in the sal1
mutants alx8, fry1-6, and fry1-1. The alx8mutant harbors a point
Figure 1. SAL1 Colocalizes in the Vascular Tissue with H2O2.
(A) Stable expression of the SAL1-GFP fusion protein in Arabidopsis plants. Gene expression was driven by a genomic sequence containing the
endogenous SAL1 promoter, which was fused to GFP (pSAL1:SAL1:GFP). Top panel: 8-d leaf showing a strong GFP signal in the vascular tissue and a
more moderate one in the mesophyll tissues. The bottom left image is GFP channel, middle image is chlorophyll channel, and right image shows the
overlay from a 2-week-old leaf.
(B) Visualization of H2O2 in Col-0 and alx8 leaves after 1 h HL treatment using DAB. H2O2 accumulation is visualized as a dark, brown precipitate.
(C) Quantification of leaf H2O2 in 6-week-old, soil-grown Col-0 and alx8. After extraction and incubation with the Amplex Red, the amount of H2O2 was
quantified against a standard curve and normalized to the FW. The mean and SD are shown. Asterisk indicates significant difference relative to Col-0
(t test, P < 0.05, n = 5).
3994 The Plant Cell
mutation in SAL1 that renders the recombinant protein enzy-
matically inactive (Wilson et al., 2009), whereas the fry1-6 allele is
a T-DNA insertion mutant (SALK_020882). Both mutants, in the
Col-0 background, lacked detectable SAL1 protein and showed
very similar rosette morphology (see Supplemental Figure 2
online). The third mutant, fry1-1, previously described in the C24
background, was reported to have increased IP3 (Xiong et al.,
2001), and increased IP3 by 1.5- to 2.0-foldwas recently reported
in another sal1 mutant (Zhang et al., 2011), as measured by
displacement bioassays. It was not revealed whether other IP
compounds could be affected. To test this, we grew young
seedlings in the presence of radiolabeledmyo-[2-3H]inositol and
showed that all the IP pools were similar in Col-0, alx8, fry1-6
(Figures 2A to 2C), and fry1-1 (see Supplemental Figure 3 online).
Finally, we investigated whether PAP, or PAPS, is the in vivo
substrate of SAL1 and developed a highly sensitive and specific
fluorescence labeling–based HPLC method for quantification of
these nucleotides (Figure 2D; see Supplemental Figure 4 online).
Using this technique, we could clearly quantify PAP and PAPS
based on the chromatograms of plant extracts with adenosines
derivatized to enable their detection by fluorescence spectros-
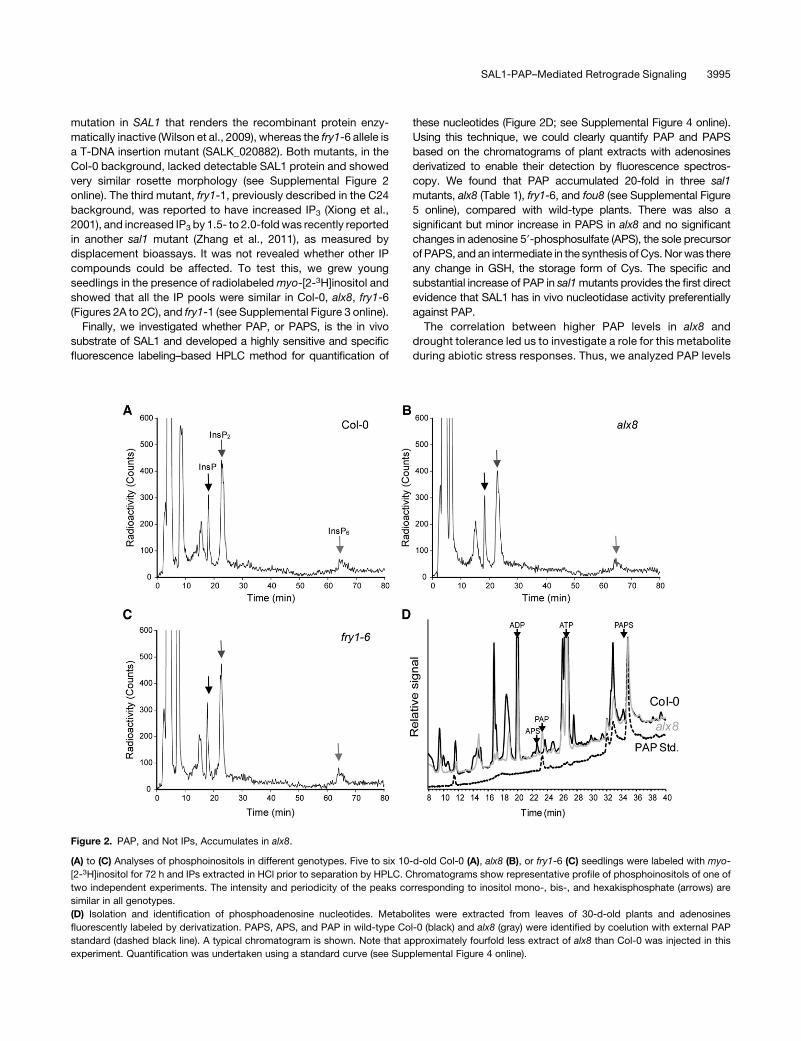
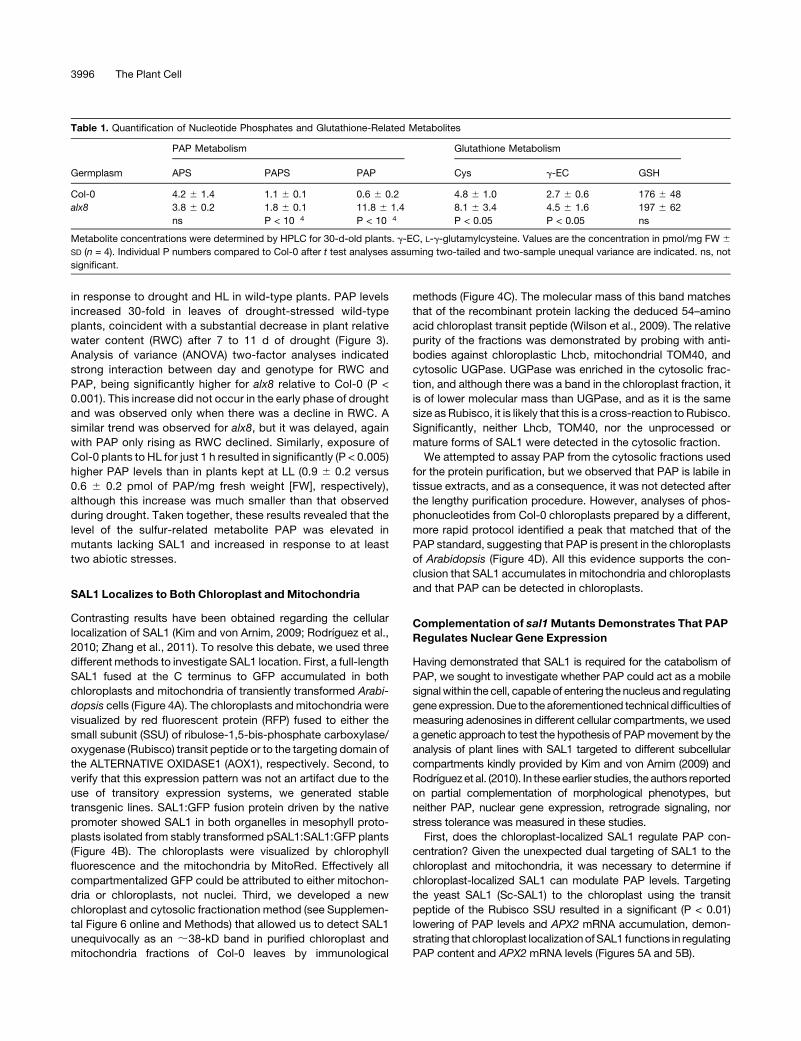
copy. We found that PAP accumulated 20-fold in three sal1
mutants, alx8 (Table 1), fry1-6, and fou8 (see Supplemental Figure
5 online), compared with wild-type plants. There was also a
significant but minor increase in PAPS in alx8 and no significant
changes in adenosine 59-phosphosulfate (APS), the sole precursorof PAPS, and an intermediate in the synthesis ofCys. Norwas there
any change in GSH, the storage form of Cys. The specific and
substantial increase of PAP in sal1mutants provides the first direct
evidence that SAL1 has in vivo nucleotidase activity preferentially
against PAP.
The correlation between higher PAP levels in alx8 and
drought tolerance led us to investigate a role for this metabolite
during abiotic stress responses. Thus, we analyzed PAP levels
Figure 2. PAP, and Not IPs, Accumulates in alx8.
(A) to (C) Analyses of phosphoinositols in different genotypes. Five to six 10-d-old Col-0 (A), alx8 (B), or fry1-6 (C) seedlings were labeled with myo-
[2-3H]inositol for 72 h and IPs extracted in HCl prior to separation by HPLC. Chromatograms show representative profile of phosphoinositols of one of
two independent experiments. The intensity and periodicity of the peaks corresponding to inositol mono-, bis-, and hexakisphosphate (arrows) are
similar in all genotypes.
(D) Isolation and identification of phosphoadenosine nucleotides. Metabolites were extracted from leaves of 30-d-old plants and adenosines
fluorescently labeled by derivatization. PAPS, APS, and PAP in wild-type Col-0 (black) and alx8 (gray) were identified by coelution with external PAP
standard (dashed black line). A typical chromatogram is shown. Note that approximately fourfold less extract of alx8 than Col-0 was injected in this
experiment. Quantification was undertaken using a standard curve (see Supplemental Figure 4 online).
SAL1-PAP–Mediated Retrograde Signaling 3995
in response to drought and HL in wild-type plants. PAP levels
increased 30-fold in leaves of drought-stressed wild-type
plants, coincident with a substantial decrease in plant relative
water content (RWC) after 7 to 11 d of drought (Figure 3).
Analysis of variance (ANOVA) two-factor analyses indicated
strong interaction between day and genotype for RWC and
PAP, being significantly higher for alx8 relative to Col-0 (P <
0.001). This increase did not occur in the early phase of drought
and was observed only when there was a decline in RWC. A
similar trend was observed for alx8, but it was delayed, again
with PAP only rising as RWC declined. Similarly, exposure of
Col-0 plants to HL for just 1 h resulted in significantly (P < 0.005)
higher PAP levels than in plants kept at LL (0.9 6 0.2 versus
0.6 6 0.2 pmol of PAP/mg fresh weight [FW], respectively),
although this increase was much smaller than that observed
during drought. Taken together, these results revealed that the
level of the sulfur-related metabolite PAP was elevated in
mutants lacking SAL1 and increased in response to at least
two abiotic stresses.
SAL1 Localizes to Both Chloroplast and Mitochondria
Contrasting results have been obtained regarding the cellular
localization of SAL1 (Kim and von Arnim, 2009; Rodrıguez et al.,
2010; Zhang et al., 2011). To resolve this debate, we used three
different methods to investigate SAL1 location. First, a full-length
SAL1 fused at the C terminus to GFP accumulated in both
chloroplasts and mitochondria of transiently transformed Arabi-
dopsis cells (Figure 4A). The chloroplasts andmitochondria were
visualized by red fluorescent protein (RFP) fused to either the
small subunit (SSU) of ribulose-1,5-bis-phosphate carboxylase/
oxygenase (Rubisco) transit peptide or to the targeting domain of
the ALTERNATIVE OXIDASE1 (AOX1), respectively. Second, to
verify that this expression pattern was not an artifact due to the
use of transitory expression systems, we generated stable
transgenic lines. SAL1:GFP fusion protein driven by the native
promoter showed SAL1 in both organelles in mesophyll proto-
plasts isolated from stably transformed pSAL1:SAL1:GFP plants
(Figure 4B). The chloroplasts were visualized by chlorophyll
fluorescence and the mitochondria by MitoRed. Effectively all
compartmentalized GFP could be attributed to either mitochon-
dria or chloroplasts, not nuclei. Third, we developed a new
chloroplast and cytosolic fractionation method (see Supplemen-
tal Figure 6 online and Methods) that allowed us to detect SAL1
unequivocally as an ;38-kD band in purified chloroplast and
mitochondria fractions of Col-0 leaves by immunological
methods (Figure 4C). The molecular mass of this band matches
that of the recombinant protein lacking the deduced 54–amino
acid chloroplast transit peptide (Wilson et al., 2009). The relative
purity of the fractions was demonstrated by probing with anti-
bodies against chloroplastic Lhcb, mitochondrial TOM40, and
cytosolic UGPase. UGPase was enriched in the cytosolic frac-
tion, and although there was a band in the chloroplast fraction, it
is of lower molecular mass than UGPase, and as it is the same
size as Rubisco, it is likely that this is a cross-reaction to Rubisco.
Significantly, neither Lhcb, TOM40, nor the unprocessed or
mature forms of SAL1 were detected in the cytosolic fraction.
We attempted to assay PAP from the cytosolic fractions used
for the protein purification, but we observed that PAP is labile in
tissue extracts, and as a consequence, it was not detected after
the lengthy purification procedure. However, analyses of phos-
phonucleotides from Col-0 chloroplasts prepared by a different,
more rapid protocol identified a peak that matched that of the
PAP standard, suggesting that PAP is present in the chloroplasts
of Arabidopsis (Figure 4D). All this evidence supports the con-
clusion that SAL1 accumulates in mitochondria and chloroplasts
and that PAP can be detected in chloroplasts.
Complementation of sal1Mutants Demonstrates That PAP
Regulates Nuclear Gene Expression
Having demonstrated that SAL1 is required for the catabolism of
PAP, we sought to investigate whether PAP could act as a mobile
signalwithin the cell, capable of entering the nucleus and regulating
geneexpression.Due to theaforementioned technical difficulties of
measuring adenosines in different cellular compartments, we used
a genetic approach to test the hypothesis of PAPmovement by the
analysis of plant lines with SAL1 targeted to different subcellular
compartments kindly provided by Kim and von Arnim (2009) and
Rodrıguezet al. (2010). In theseearlier studies, the authors reported
on partial complementation of morphological phenotypes, but
neither PAP, nuclear gene expression, retrograde signaling, nor
stress tolerance was measured in these studies.
First, does the chloroplast-localized SAL1 regulate PAP con-
centration? Given the unexpected dual targeting of SAL1 to the
chloroplast and mitochondria, it was necessary to determine if
chloroplast-localized SAL1 can modulate PAP levels. Targeting
the yeast SAL1 (Sc-SAL1) to the chloroplast using the transit
peptide of the Rubisco SSU resulted in a significant (P < 0.01)
lowering of PAP levels and APX2 mRNA accumulation, demon-
strating that chloroplast localizationofSAL1 functions in regulating
PAP content and APX2 mRNA levels (Figures 5A and 5B).
Table 1. Quantification of Nucleotide Phosphates and Glutathione-Related Metabolites
Germplasm
PAP Metabolism Glutathione Metabolism
APS PAPS PAP Cys g-EC GSH
Col-0 4.2 6 1.4 1.1 6 0.1 0.6 6 0.2 4.8 6 1.0 2.7 6 0.6 176 6 48
alx8 3.8 6 0.2 1.8 6 0.1 11.8 6 1.4 8.1 6 3.4 4.5 6 1.6 197 6 62
ns P < 10�4 P < 10�4 P < 0.05 P < 0.05 ns
Metabolite concentrations were determined by HPLC for 30-d-old plants. g-EC, L-g-glutamylcysteine. Values are the concentration in pmol/mg FW 6
SD (n = 4). Individual P numbers compared to Col-0 after t test analyses assuming two-tailed and two-sample unequal variance are indicated. ns, not
significant.
3996 The Plant Cell

Second, can PAP move between cellular compartments?
Targeting of SAL1 to the nucleus resulted in complete comple-
mentation of PAP levels (Figure 5A), APX2 mRNA abundance in
LL and drought-stressed leaves, ELIP2mRNA abundance in LL-
and HL-treated leaves, and the viability of plants in response to
terminal drought (Table 2). The combined results of the targeting
experiments indicate that the degree of complementation of PAP
levels is somewhat proportional to the degree of complementa-
tion of APX2 expression (Table 2, Figure 5). More importantly,
they show that PAP can be catabolized by either nuclear or
chloroplastic targeting of SAL1, demonstrating that PAP can
move between subcellular compartments.
SAL1andNuclearXRNsCoregulateaLargeSubsetofGenes
Given that PAP levels are elevated in sal1 mutants, and PAP is
known to inhibit the activity of the yeast XRNs (Dichtl et al., 1997;
van Dijk et al., 2011), we hypothesized that PAP could regulate
the expression of stress-responsive genes via attenuation of XRN-
mediated RNA catabolism. Although the Arabidopsis XRNs are
less well characterized than their S. cerevisiae counterparts, they
play key roles in multiple RNA processing pathways and as post-
transcriptional gene silencing suppressors (Kastenmayer and
Green, 2000; Souret et al., 2004; Gy et al., 2007; Zakrzewska-
Placzek et al., 2010). The XRNs belong to a small gene family in
Figure 3. PAP Accumulates during Drought in Arabidopsis.
(A) Correlation between RWC of plants and PAP concentration on a dry weight (DW) basis6 SD (n > 8) during drought. The day in drought is indicated in
italics. Measurements performed as in Figure 2 and Supplemental Figure 4 online. Data were fitted to exponential curves, and results are shown in the
table (R2, correlation coefficient). ANOVA two-factor analyses indicated a highly significant difference for day3 genotype for RWC and PAP (P < 0.005).
(B) Images of representative plants harvested for the PAP measurements performed in (A).
SAL1-PAP–Mediated Retrograde Signaling 3997
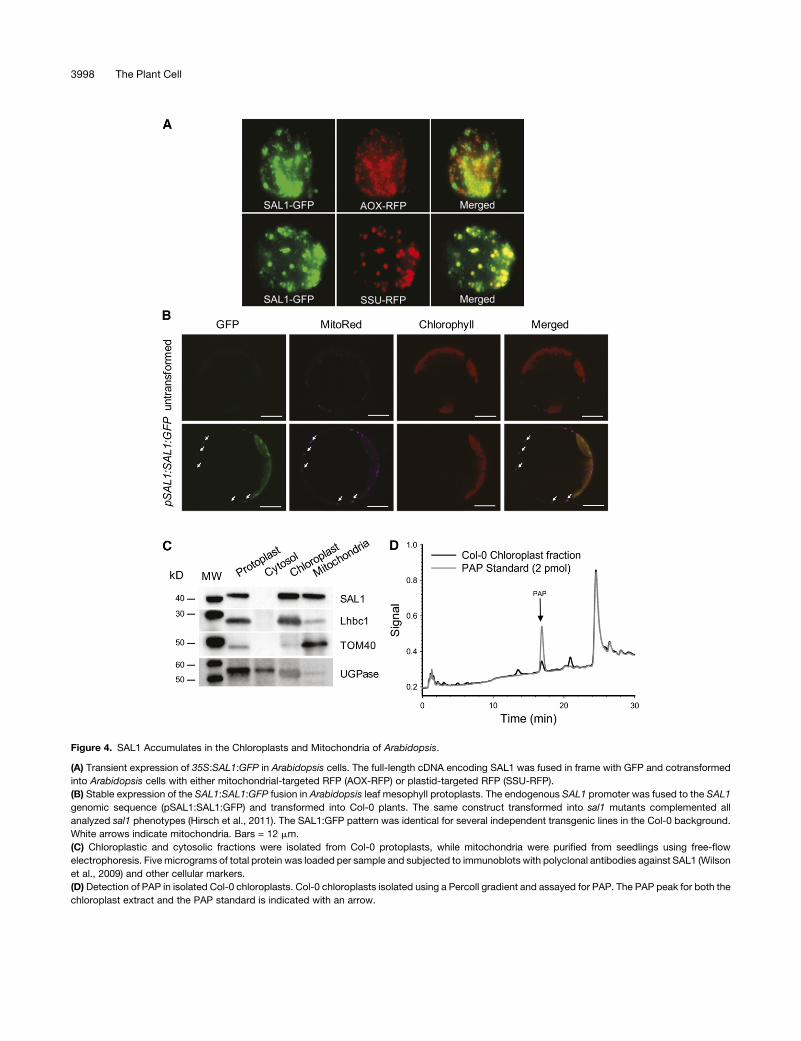
Figure 4. SAL1 Accumulates in the Chloroplasts and Mitochondria of Arabidopsis.
(A) Transient expression of 35S:SAL1:GFP in Arabidopsis cells. The full-length cDNA encoding SAL1 was fused in frame with GFP and cotransformed
into Arabidopsis cells with either mitochondrial-targeted RFP (AOX-RFP) or plastid-targeted RFP (SSU-RFP).
(B) Stable expression of the SAL1:SAL1:GFP fusion in Arabidopsis leaf mesophyll protoplasts. The endogenous SAL1 promoter was fused to the SAL1
genomic sequence (pSAL1:SAL1:GFP) and transformed into Col-0 plants. The same construct transformed into sal1 mutants complemented all
analyzed sal1 phenotypes (Hirsch et al., 2011). The SAL1:GFP pattern was identical for several independent transgenic lines in the Col-0 background.
White arrows indicate mitochondria. Bars = 12 mm.
(C) Chloroplastic and cytosolic fractions were isolated from Col-0 protoplasts, while mitochondria were purified from seedlings using free-flow
electrophoresis. Five micrograms of total protein was loaded per sample and subjected to immunoblots with polyclonal antibodies against SAL1 (Wilson
et al., 2009) and other cellular markers.
(D) Detection of PAP in isolated Col-0 chloroplasts. Col-0 chloroplasts isolated using a Percoll gradient and assayed for PAP. The PAP peak for both the
chloroplast extract and the PAP standard is indicated with an arrow.
3998 The Plant Cell
Arabidopsis with three members. XRN2 and XRN3 are homologs
of Xrn2p/Rat1p and are nuclear localized. By contrast, the cyto-
solic XRN4 is a functional homolog of S. cerevisiae Xrn1p
(Kastenmayer and Green, 2000). Identified substrates of XRN2
and XRN3 are excised hairpin loops that form part of precursor
MIRNA transcripts, which also accumulate in fry1-6 (Gy et al.,
2007). On the other hand, XRN4 is involved in mRNA decay
by degrading the resulting 39 cleavage products of microRNA
(miRNA) targets (Souret et al., 2004).
Analysis of the alx8 transcriptome revealed that transcripts for
19 genes that are confirmed targets of miRNAswere increased by
at least threefold (see Supplemental Table 1 online). As probes for
Affymetrix arrays are biased toward the 39 region of genes, we
tested whether this reflected increased abundance of full-length
mRNA or accumulation of cleaved transcripts due to inhibition of
XRN4 by increased PAP levels. We undertook quantitative real-
time PCR (qRT-PCR) of four miRNA targets using primers specific
for 39 sequences or spanning the miRNA cleavage site (see
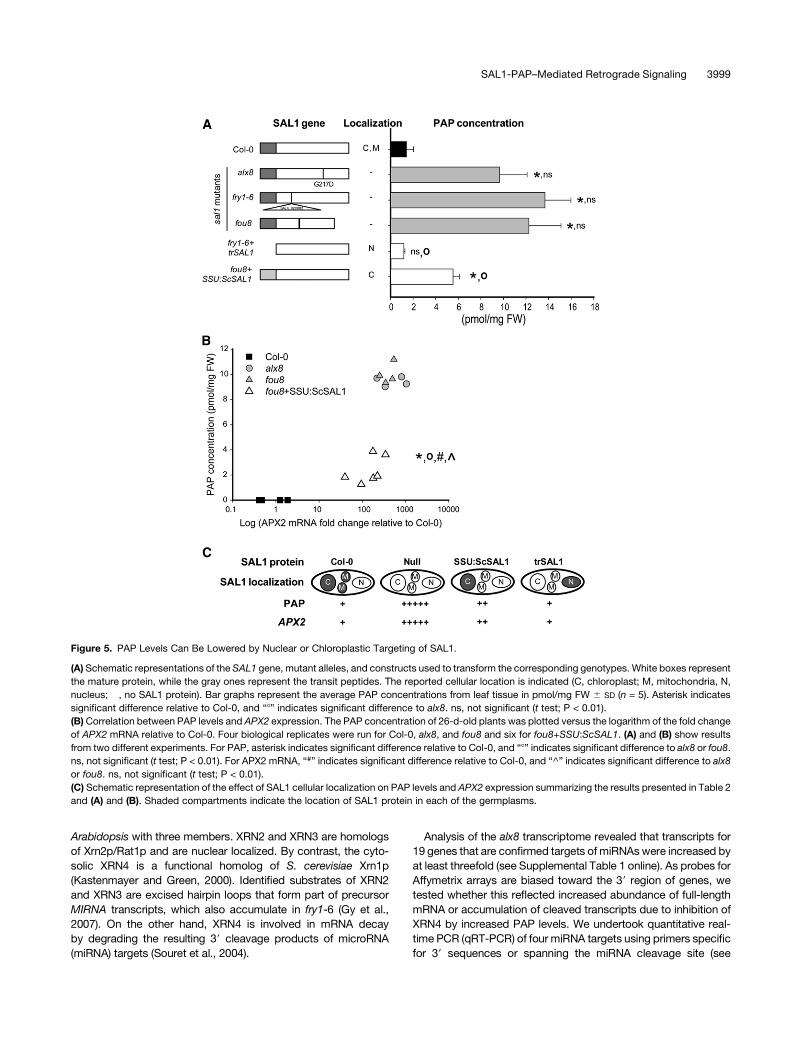
Figure 5. PAP Levels Can Be Lowered by Nuclear or Chloroplastic Targeting of SAL1.
(A) Schematic representations of the SAL1 gene, mutant alleles, and constructs used to transform the corresponding genotypes. White boxes represent
the mature protein, while the gray ones represent the transit peptides. The reported cellular location is indicated (C, chloroplast; M, mitochondria, N,
nucleus; �, no SAL1 protein). Bar graphs represent the average PAP concentrations from leaf tissue in pmol/mg FW 6 SD (n = 5). Asterisk indicates
significant difference relative to Col-0, and “8” indicates significant difference to alx8. ns, not significant (t test; P < 0.01).
(B)Correlation between PAP levels and APX2 expression. The PAP concentration of 26-d-old plants was plotted versus the logarithm of the fold change
of APX2 mRNA relative to Col-0. Four biological replicates were run for Col-0, alx8, and fou8 and six for fou8+SSU:ScSAL1. (A) and (B) show results
from two different experiments. For PAP, asterisk indicates significant difference relative to Col-0, and “8” indicates significant difference to alx8 or fou8.
ns, not significant (t test; P < 0.01). For APX2 mRNA, “#” indicates significant difference relative to Col-0, and “^” indicates significant difference to alx8
or fou8. ns, not significant (t test; P < 0.01).
(C) Schematic representation of the effect of SAL1 cellular localization on PAP levels and APX2 expression summarizing the results presented in Table 2
and (A) and (B). Shaded compartments indicate the location of SAL1 protein in each of the germplasms.
SAL1-PAP–Mediated Retrograde Signaling 3999
Supplemental Figure 7 online). The uncleaved transcripts did not
increase; rather, the 39 cleavage products for ATHB15, PHB,
MYB33, and REV accumulated to higher levels in both sal1
mutants compared with the wild type, with MYB33 showing the
highest increase (sixfold). The accumulation of 39 cleavage prod-
ucts in alx8 that should otherwise be degraded by XRNs is
consistent with XRNs being inhibited in SAL1 mutants.
To determine if XRNs and SAL1-PAP regulate a common set of
genes, we undertook gene expression profiling in the PAP-accu-
mulating alx8 mutant, xrn2 xrn3 double mutant, and xrn4 (ein5-6,
ethylene-insensitive5; Gregory et al., 2008). We used Affymetrix
GeneChip Arabidopsis ATH1 genome arrays to analyze global
changes in transcript abundance between Col-0 and the mutant
genotypes.Whole rosettes of seedlings at the 10 true leaf stage of
development were used for analysis of each genotype. We found
that for alx8 and xrn2 xrn3, there were 4038 and 2433 transcripts,
respectively, that showed a significant change in transcript abun-
dance (>1.5-fold, false discovery rate [FDR] corrected at P < 0.05)
relative to Col-0 (Figure 6A; see Supplemental Data Set 1online).
By contrast, only 156 transcripts were significantly altered in xrn4
compared with Col-0. This low level of transcriptome change in
xrn4 is consistent with previous transcriptome profiling data of
xrn4 (Souret et al., 2004; Germanet al., 2008; Gregory et al., 2008).
More importantly, there was a large and significant overlap
between thealx8and xrn2 xrn3 transcript profiles (Figure6B).Of the
1404 genes upregulated in xrn2 xrn3 (relative to Col-0), 50% (680
transcripts) were also upregulated in alx8, which is a significantly
greater overlap than would be expected by random chance (P <
0.05), while only 14 transcripts showed an antagonistic response
(i.e., were downregulated in alx8), which is statistically fewer than
would beexpectedby chance (P<0.05; seeSupplemental Figure 8
online). Similarly, in the downregulated transcript set, there was a
significant overlap of 64% (611of 954 transcripts) between the xrn2
xrn3 transcriptome and that of alx8, again with lower levels of
antagonistic change than would be expected by random chance
(24 transcripts; P < 0.05; see Supplemental Figure 8 online).
Additionally, coexpression of four highly upregulated transcripts
in the alx8microarray (Wilson et al., 2009) in alx8 and xrn2 xrn3was
confirmed by qRT-PCR (see Supplemental Table 2 online). Fur-
thermore, the fold change of all genes upregulated by more than
fivefold was also comparable for xrn2 xrn3 and alx8 (Table 3).
Transcripts encoding transferases, transporters, hormone-related
transcription factors, and starch synthase were coexpressed in
both alx8 and xrn2 xrn3 to the same extent (Table 3).
Finally, comparison of all coexpressed genes up- or down-
regulated by more than threefold against a series of microarray
experiments (Hruz et al., 2008) revealed a high degree of coex-
pression under HL, ABA, drought stress, and a combined moder-
ate HL and mild drought on a plant with a defective mitochondrial
stress-inducible protein, AOX1A (Giraud et al., 2008) (Figure 7).
This same set of genes was not differentially expressed in LL
or under different light quality and wavelengths, nor was the
set similarly coexpressed upon treatment with the plastid transla-
tional inhibitor, lincomycin, that suppressesGUN-regulatedgenes.
Both H2O2, known to induce some HL-responsive genes, and the
mitochondrial respiratory complex I inhibitor, rotenone (Clifton
et al., 2005; Garmier et al., 2008), resulted in increased expression
of some of the upregulated genes, but the converse was observed
for the downregulated genes. This suggests the coexpressed set
of SAL1- and XRN2 XRN3–regulated genes respond to specific
organelle signals, such as HL, but not translational inhibitors, such
as lincomycin.
Nuclear XRNs Regulate the Induction of HL and Drought
Stress Genes
To investigate further the potential role of PAP in stress signal
transduction pathways, we focused on the expression of the
model chloroplast stress-responsive genes ELIP2 and APX2 in
the xrn mutants. Our analysis of xrn4/ein5-6 transcriptome data
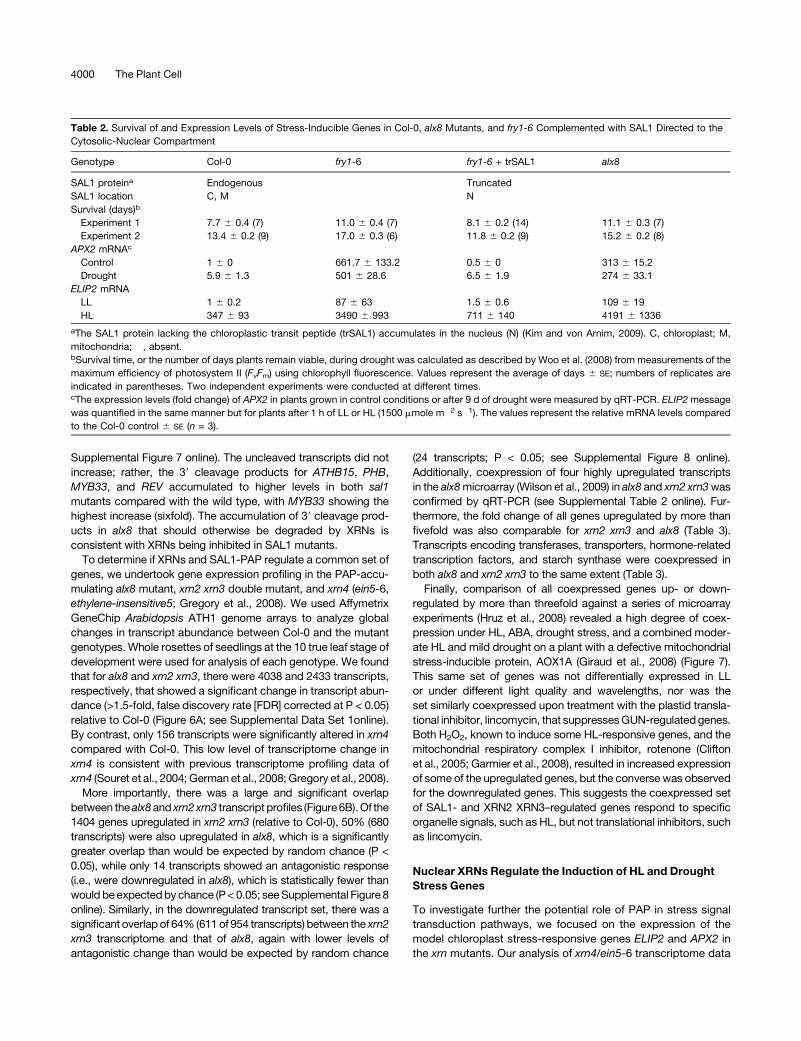
Table 2. Survival of and Expression Levels of Stress-Inducible Genes in Col-0, alx8 Mutants, and fry1-6 Complemented with SAL1 Directed to the
Cytosolic-Nuclear Compartment
Genotype Col-0 fry1-6 fry1-6 + trSAL1 alx8
SAL1 proteina Endogenous � Truncated �SAL1 location C, M � N �Survival (days)b
Experiment 1 7.7 6 0.4 (7) 11.0 6 0.4 (7) 8.1 6 0.2 (14) 11.1 6 0.3 (7)
Experiment 2 13.4 6 0.2 (9) 17.0 6 0.3 (6) 11.8 6 0.2 (9) 15.2 6 0.2 (8)
APX2 mRNAc
Control 1 6 0 661.7 6 133.2 0.5 6 0 313 6 15.2
Drought 5.9 6 1.3 501 6 28.6 6.5 6 1.9 274 6 33.1
ELIP2 mRNA
LL 1 6 0.2 87 6 63 1.5 6 0.6 109 6 19
HL 347 6 93 3490 6 993 711 6 140 4191 6 1336
aThe SAL1 protein lacking the chloroplastic transit peptide (trSAL1) accumulates in the nucleus (N) (Kim and von Arnim, 2009). C, chloroplast; M,
mitochondria; �, absent.bSurvival time, or the number of days plants remain viable, during drought was calculated as described by Woo et al. (2008) from measurements of the
maximum efficiency of photosystem II (FvFm) using chlorophyll fluorescence. Values represent the average of days 6 SE; numbers of replicates are
indicated in parentheses. Two independent experiments were conducted at different times.cThe expression levels (fold change) of APX2 in plants grown in control conditions or after 9 d of drought were measured by qRT-PCR. ELIP2message
was quantified in the same manner but for plants after 1 h of LL or HL (1500 mmole m�2 s�1). The values represent the relative mRNA levels compared
to the Col-0 control 6 SE (n = 3).
4000 The Plant Cell

(see Supplemental Data Set 1 online; Souret et al., 2004; German
et al., 2008; Gregory et al., 2008) revealed that neither ELIP2 nor
APX2 is upregulated in the xrn4 mutant. Thus, we focused on
XRN2 and XRN3.
We aimed to mimic PAP inhibition of the nuclear XRNs by
comparing the induction of stress-responsive genes between xrn2
xrn3 and the sal1 mutants under both LL and HL conditions.
Indeed,mRNA levelsofELIP2were remarkably similar inalx8, fry1-
6, and xrn2 xrn3 mutants for nonstressed leaves, with APX2
expression being induced in all three mutants but less so in xrn2
xrn3 (Figure 8). Overall, all the mutants exhibited around 100-fold
higher levels of ELIP2 and 60- to 600-fold increased APX2 com-
pared with the wild type. Under HL stress, ELIP2 was hyper-
induced to the same extent (by ;3000-fold) in alx8, fry1-6, and
xrn2 xrn3, and again this was not substantially different between
the three mutants, yet it was 10-fold higher than the induction in
Col-0 (Figure 8A). The results were comparable for APX2, with
expression changes in xrn2 xrn3 being of a similar order of
magnitude to the alx8 and fry1-6 mutants, although attenuated
(Figure 8B). This is consistent with the observations that APX2 is
regulated bymultiple signaling pathways in response toHL stress,
including H2O2, ABA, glutathione metabolism, and plastoquinone
redox state (Karpinski et al., 1997; Fryer et al., 2003; Ball et al.,
2004; Rossel et al., 2006; Pogson et al., 2008; Galvez-Valdivieso
et al., 2009) as well as PAP (Figure 5).
The results presented above clearly indicate that nuclear XRNs
are negative regulators of stress-inducible genes. Significantly, a
triple mutant in both cytosolic and nuclear XRNs was better able
to survive drought when compared with the wild type in a soil-
based experiment (Hirsch et al., 2011), indicating that XRNs are
regulators of the drought response. To elucidate whether cyto-
solic or nuclear XRNs mediate the drought response, we inves-
tigated the degree of drought tolerance of nuclear xrn2 xrn3 and
sal1mutants, and we also included a second xrn4 single mutant,
ein5-6 (Olmedo et al., 2006). Both sal1 mutants survived the
drought almost 50% longer compared with the wild type as
previously shown (Wilson et al., 2009) (Figure 8C). Interestingly,
plants with impaired nuclear XRN activity (i.e., the xrn2 xrn3
mutant), but not those in which the cytosolic homolog was
mutated (i.e., xrn4), survived longer than the wild type but not as
long as the sal1 mutants.
Taken together, these results suggest that PAP can stimulate
gene expression by repressing the activity of the nuclear XRNs.
That is, XRN2 andXRN3 negatively regulate the expression of the
stress-responsive genes APX2 and ELIP2 and the drought
response, most likely via the SAL1-PAP signaling pathway.
Figure 6. SAL1 and Nuclear XRNs Regulate a Large Subset of Genes.
(A) Summary table of transcriptome changes in xrn4, xrn2 xrn3, and alx8mutants. Total number of genes whose transcripts were significantly different in
abundance by >1.5-fold in each mutant compared with Col-0 after FDR correction at PPDE (>P) > 0.95 (95% confidence interval). Expected false
positives at this FDR cutoff level are also indicated.
(B) Venn diagrams showing the overlap of changes in gene expression relative to Col-0 (>1.5-fold) between alx8, xrn2 xrn3, and xrn4. Numbers in the
Venn diagrams indicate transcripts that are significantly (PPDE [>P] > 0.95) up- or downregulated in the mutant genotype compared with Col-0. The
percentage of genes in xrn2 xrn3 that are regulated in the same manner as in alx8 is given. The number of genes that significantly change excluding
antagonistic changes is given in parentheses (see Supplemental Figure 8 online). Asterisk indicates significantly (P < 0.02) more transcripts overlapping
than expected by chance according to a x2 test.
SAL1-PAP–Mediated Retrograde Signaling 4001

DISCUSSION
PAP Is aPrimary in Vivo Substrate of SAL1 andAccumulates
in Response to HL and Drought Stress
Chloroplasts and mitochondria can be viewed as environmental
sensors mediating cellular responses to external stimuli that
result in short- and long-term acclimation responses, ranging
from induction of stress-responsive genes to changes in leaf
thickness and petiole length. Likewise, SAL1 has been linked to
stress responses (Rossel et al., 2006; Wilson et al., 2009) and
many developmental processes (Kim and von Arnim, 2009;
Robles et al., 2010; Wilson et al., 2009; Rodrıguez et al., 2010;
Hirsch et al., 2011; Zhang et al., 2011), demonstrating that the
enzyme influences multiple biological processes. This requires
either multiple enzymatic activities or that the substrate of SAL1
can initiate multiple responses. Thus, understanding the enzy-
matic activity of SAL1 in vivo will shed light on many different
fields of plant biology.
We addressed this issue by in vivomeasurements of proposed
substrates. The results presented here clearly support the view
that PAP is a major in vivo substrate of the phosphatase SAL1
and not PAPS or IPs, as previously proposed (Xiong et al., 2001;
Rodrıguez et al., 2010; Zhang et al., 2011). First, a distinctive
peak corresponding to PAP was detected using HPLC coupled
to fluorescence detection (Figures 2D; see Supplemental Figure
4 online). This method is more sensitive and specific than the
absorbance detection used by Rodrıguez et al. (2010), which
could explain the lack of specific signal for PAP in that work,
especially as PAP is very labile. Second, we were able to show
that PAP increased by ;20-fold, whereas PAPS increased by
just 1.6-fold (Table 1) and IPs either did not change (Figure 2) or
increased by 1.5-fold to twofold (Zhang et al., 2011), which may
be direct catalysis or an indirect effect, as many metabolites
change in sal1 mutants (Wilson et al., 2009). In this study, we
measured sulfur metabolites (Cys, g-EC, and GSH), adenosines
(APS, PAPS, PAPS, SAM, Ade, AMP, ADP, and ATP), and
inositols, none of which changed significantly or to the same
degree as PAP. Thus, we consider that an indirect change in
glutathione metabolism is not a consequence of the SAL1
mutation; thus, the increase in APX2 mRNA in alx8 is not a
consequence of glutathione metabolism–mediated signaling as
proposed for rax1 (Ball et al., 2004). Furthermore, in a prior study,
we measured the alx8 metabolome using gas chromatography–
mass spectrometry and of themetabolites that changed, such as
carbohydrates and polyamines, and none could be readily
viewed as likely substrates of a nucleotide phosphatase (Wilson
Table 3. A Subset of Coregulated Genes in xrn2 xrn3 and alx8 That Are Fivefold Up- or Downregulated Compared to Col-0
AGIa Gene Description
xrn2 xrn3 versus Col alx8 versus Col
F.C.b P value F.C. P value
AT3G61630 CYTOKININ RESPONSE FACTOR6 109.3 1.48E-05 47.5 6.95E-07
AT2G04050 MATE efflux family protein 84.4 4.83E-07 19.5 6.95E-07
AT1G05680 UDP-glucuronosyl family protein 44.5 4.17E-08 7.4 6.95E-07
AT2G41730 Unknown protein 22.5 6.41E-10 10.4 6.95E-07
AT1G61800 Glc-6-phosphate transporter 19.4 4.92E-10 12.1 6.95E-07
AT2G04040 ATDTX1 transporter 18.1 3.07E-04 4.5 6.95E-07
AT2G21640 Unknown protein 16.7 1.13E-06 6.4 6.95E-07
AT3G53980 Lipid transfer protein family protein 16.0 4.58E-06 15.8 6.95E-07
AT5G08030 Glycerophosphoryl diester phosphodiesterase 15.0 3.00E-07 14.5 6.95E-07
AT2G40230 Transferase family protein 11.4 1.09E-09 11.8 6.95E-07
AT1G75580 Auxin-responsive protein, putative 9.2 6.14E-08 12.3 6.95E-07
AT5G25350 EIN3 BINDING F BOX PROTEIN2 7.5 2.42E-08 6.9 6.95E-07
AT5G27660 Ser-type peptidase/trypsin 6.9 1.67E-05 51.9 6.95E-07
AT1G56150 Auxin-responsive family protein 5.7 5.21E-09 6.5 6.95E-07
AT1G32900 Starch synthase, putative 5.1 9.05E-07 5.1 6.95E-07
AT2G22810 1-Aminocyclopropane-1-carboxylate synthase �5.1 8.47E-05 �5.8 6.95E-07
AT4G25490 CBF1 transcription factor �5.3 5.71E-06 �15.3 6.95E-07
AT5G26200 Mitochondrial substrate carrier family protein �5.4 1.89E-07 �18.5 6.95E-07
AT5G18060 Auxin-responsive protein, putative �5.5 5.30E-07 �8.9 6.95E-07
AT5G05250 Similar to unknown protein (TAIR: AT3G56360.1) �6.2 1.87E-03 �15.5 6.95E-07
AT2G17880 DNAJ heat shock protein, putative �6.5 3.31E-04 �15.4 6.95E-07
AT2G37950 Zinc finger (C3HC4-type RING finger) family �8.6 2.96E-05 �17.9 6.95E-07
AT2G26710 BAS1 (PHYB SUPPRESSOR1) �9.0 3.17E-07 �10.8 6.95E-07
AT2G44130 Kelch repeat–containing F-box family protein �9.1 2.92E-07 �9.9 6.95E-07
AT5G54610 ANKYRIN; protein binding �9.6 9.07E-05 �7.6 6.95E-07
AT1G78450 SOUL heme binding family protein �14.9 3.98E-09 �12.5 6.95E-07
aAGI, Arabidopsis Genome Initiative.bF.C., fold change compared to Col-0.
See Supplemental Data Set 1 online for the complete gene list.
4002 The Plant Cell

et al., 2009). Also, the expression of the PAP-specific phospha-
tase AHL enzyme that lacks IP3 activity complements sal1
mutants (Kim and von Arnim, 2009; Hirsch et al., 2011). This is
also consistent with IP3 not being important for drought tolerance
in Arabidopsis (Perera et al., 2008). There is also a reported in
vitro preference of the recombinant SAL1 enzyme for PAP (Gil-
Mascarell et al., 1999; Xiong et al., 2001). Additionally, the alx8
point mutation results in a recombinant SAL1 protein that cannot
dephosphorylate PAP (Wilson et al., 2009). Thus, while we
cannot preclude another as yet unknown enzymatic activity for
SAL1, we conclude PAP is a primary substrate of SAL1 in vivo.
If the basis of the altered response to HL and drought in alx8 is
mediated by increased PAP, then it might be expected that this
metabolite should increase during stress in wild-type plants.
Indeed, PAP increased 30-fold after 7 d of drought (Figure 3) and
increased significantly within 1 h of HL stress. Interestingly, there
was a tight correlation between leaf water status and PAP levels
in both Col-0 and alx8 plants.
Figure 7. Heat Map of Genes Coregulated in both alx8 and xrn2 xrn3 Mutants.
Heat map of genes upregulated (A) and downregulated (B) threefold or more in both genotypes compared with their regulation in response to abiotic
stress and chemical treatments (Hruz et al., 2008).
SAL1-PAP–Mediated Retrograde Signaling 4003

SAL1 Localizes to Both Chloroplasts and Mitochondria
Critical to understanding the function of PAP is determining the
subcellular localization of the enzyme that regulates its levels,
SAL1. Conflicting reports have suggested that SAL1 fusions are
targeted to nuclei (Kim and von Arnim, 2009), cytosol in the roots
(Zhang et al., 2011), or chloroplasts of onion epidermal peels
(Rodrıguez et al., 2010). The reported nuclear localization of
SAL1 (Kim and von Arnim, 2009) likely reflects the authors’ use of
a truncated SAL1 gene that lacked the transit peptide. To define
the subcellular location of a protein, it is necessary to usemultiple
techniques, including in vivo analyses in the species of interest
(Millar et al., 2009). Both stable and transient transformation lead
to accumulation of SAL1:GFP in the chloroplast and mitochon-
dria (Figures 4A and 4B), and the SAL1 protein was unequivocally
detected in the purified chloroplastic andmitochondrial fractions
of Col-0 leaves (Figure 4C). Significantly, no SAL1 protein was
detected in the cytosolic fraction, and effectively all SAL1:GFP
fluorescence could be attributed to either chloroplasts or mito-
chondria, not nuclei (Figure 4).
The finding of SAL1 in the chloroplast is consistent with the
chloroplastic localization of isoenzymes for the synthesis of APS
and PAPS (Mugford et al., 2009) and the detection of SAL1 by
chloroplast proteomic analysis (Peltier et al., 2006; Olinares et al.,
2010). Thus, using three different approaches, we demonstrated
that SAL1 is a dual-localized protein found in chloroplasts and
mitochondria, not the cytosol or nucleus. In addition, SAL1
inactivation results in a 20-fold increase in PAP levels.
The detection of PAP in isolated chloroplasts demonstrates it
can accumulate in this organelle. Interestingly, it is believed that
Figure 8. Light-Induced Gene Regulation and Drought Tolerance Is Similar in sal1 and xrn2 xrn3 Double Mutants.
(A) Expression levels of ELIP2 after LL and HL.
(B) Expression levels of APX2 after LL and HL.
For both (A) and (B), the transcript levels were quantified by real-time PCR for both alx8 and xrn2 xrn3 mutants plants grown under standard growth
conditions and after 1 h of HL stress (;1500 mmol m�2 s�1). The bars represent the average of the fold change compared with that of the wild type6 SD
(n = 3). For xrn2 xrn3, “8” and ns indicate significant or no significant difference, respectively, relative to sal1 mutants (t test; P < 0.05). For HL, asterisk
indicates significant difference relative to Col-0 HL (t test; P < 0.05).
(C) Survival time of plants during drought calculated as described by Woo et al. (2008). Periodic measurements of the maximum efficiency of
photosystem II (Fv/Fm) using chlorophyll fluorescence were recorded during drought and used to calculate plant survival. Bar graphs represent the
average survival time as measured in days 6 SD (n > 7). Asterisk indicates significant difference relative to Col-0 (t test; P < 0.001).
4004 The Plant Cell

PAPS is largely synthesized in the plastid but that its conversion to
PAP occurs in the cytosol. PAP could move back into the chlo-
roplast via an unknown PAP/PAPS antiporter. This same pro-
posed, but yet to be identified, transporterwould allow its exit from
the organelle back to the cytosol (Klein and Papenbrock, 2004;
Mugford et al., 2009). An alternative to the PAP/PAPS antiporter is
that movement is promoted by chloroplast damage during ex-
treme stress. However, even photobleached cells contain viable
and intact chloroplasts, as do sal1 mutants (Wilson et al., 2009).
Rather than membrane damage per se enabling movement, it is
more likely that stress can modulate the transport of proteins or
signaling molecules, such as PAP. Regardless of the mechanism
of transport, the lowering of PAP to near-wild-type levels by
targeting Sc-SAL1 to the chloroplast demonstrated that PAP can
move from the site of synthesis in the cytosol to the chloroplast.
The observation that SAL1 was also found in mitochondria was
unexpected and raises the question as to its role and enzymatic
activity in thatorganelle.Whereas it isbeyond thescopeof this study,
it is worth noting that the partial complementation observed in sal1
mutants by Sc-SAL1 targeted to the chloroplast could reflect a
reduced expression or activity of the yeast enzyme in transgenic
Arabidopsisor amitochondrial role for SAL1. Additionally, knockouts
of a nuclear gene, AOX1A, encoding a mitochondrial protein used
to study mitochondrial retrograde signaling (Giraud et al., 2008)
resulted in similar coexpression of genes in response to a moderate
drought and light as those coexpressed in alx8 and xrn2 xrn3, and a
possible, butweaker, correlationwas observed for themitochondrial
electron transporter chain inhibitor, rotenone (Figure 7).
Evidence for a SAL-PAP Retrograde Pathway
Two studies have reported on the complementation of the
morphological phenotypes of sal1 mutants by targeting SAL1
to the nucleus (Kim and von Arnim, 2009) and Sc-SAL1 to the
chloroplast (Rodrıguez et al., 2010). However, the significance of
these findings with respect to PAP acting as a retrograde signal
was not considered by the authors; rather, they concluded that
their constructs demonstrated the location of SAL1. PAP levels,
chloroplast-specific responses, and drought responses were
not measured. Furthermore, as mentioned above, the differing
reported localizations of SAL1 have prevented any systematic
analysis.
In this study, we demonstrated that total leaf PAP pools can
be significantly lowered by targeting Sc-SAL1 exclusively to the
chloroplast (Figure 5) and that induction of the nuclear gene
APX2, which is routinely used to study HL and drought stress–
induced retrograde signaling, was lowered when PAP was
lowered by chloroplastic SAL1 complementation.
There are several lines of evidence that support the notion that
PAP can move between cellular compartments, as shown in
Figure 9. First and most compelling is that nuclear targeting of
SAL1 results in the full complementation of sal1 mutant pheno-
types, including total leaf PAP levels, APX2 expression in LL and
drought, ELIP2 expression in LL and HL, and drought tolerance
(Figure 5, Table 2). Second, sal1 and xrn2 xrn3 double mutants
show a very similar molecular and morphological phenotype,
suggesting that PAP accumulation can inhibit XRN function as
originally proved in yeast (Dichtl et al., 1997) and suggested to
occur in plants (Gy et al., 2007). Indeed, it is reasonable to assume
that once in the cytosol, PAP would diffuse freely through the
nuclear pore as do other nucleotides. Thus, degradation of PAP
pools in either the chloroplast, mitochondria, or nucleus have the
potential to restore thewild-type phenotype at themolecular level.
This could be interpreted as PAP being able to move between
cellular compartments.
Figure 9. Proposed Model for a SAL1-PAP Retrograde Signaling Pathway.
PAP levels are negatively regulated by the chloroplastic SAL1 phosphatase (Figures 2 to 5). Upon environmental stresses, such as HL and drought, PAP
levels increase (Figure 3). PAP can move between cellular compartments as evidenced by the complementation studies (Figure 5). Elevated PAP levels
likely inhibit XRNs in the cytosol and nucleus. Nuclear XRN inhibition causes similar changes in expression to sal1 mutants, such as ELIP2 and APX2,
and a degree of drought tolerance (Figures 6 to 8, Table 3).
[See online article for color version of this figure.]
SAL1-PAP–Mediated Retrograde Signaling 4005
Given the effectiveness of nuclear complementation, it begs the
question as to why SAL1 is targeted to the organelles and not the
nucleus. One speculative option is that this provides the potential to
regulatePAPcontent in thecell in response toenvironmental stimuli.
How, for instance, areHL anddrought regulatingPAPaccumulation
and/or transport? The observed increase in PAP levels during
drought in alx8plants lackingSAL1suggests thatPAPpoolsmaybe
regulated at least in part by increased biosynthesis of PAP rather
than a decrease in catabolism. However, whether SAL1 activity is
directly regulated by HL and drought is not known, nor is it known if
the stress-mediated PAP accumulation precedes ABA accumula-
tion or not. Additionally, it would be worth investigating whether
there could be regulation of PAP movement between compart-
ments. Given the relatively small but significant change in PAP in
response toHL, itmight be that relocation of PAPwithin the cell also
contributes to the response.
Does the proposed retrograde pathway operate in parallel or
series with other proposed retrograde pathways? The gene ex-
pression profiles of other retrograde mutants pertain to the spe-
cific signals being studied, such as the repression of LhcbmRNA
in response to lincomycin and the chloroplast bleaching herbicide,
NFZ, in the GUN signaling cascade. LhcbmRNA does not change
in alx8, and fewof the coexpressed alx8and xrngenesare induced
or repressed by lincomycin (Figure 7; see Supplemental Data Set
1 online).Given the low levels of hydrogenperoxide in sal1mutants
(Figure 1), it is unlikely that theSAL1-PAPpathway is epistatic to or
regulated by H2O2. With respect to ABA, the increase in PAP
during drought and the induction of drought and ABA-responsive
genes in sal1 and xrn mutants would suggest some interaction
(Figures 3 and 7). Both drought and light alter chloroplasts and
initiate gene expression changes, as demonstrated by the initial
isolation of the alx8 mutant that results in changed expression of
chloroplast proteins (ELIP2) and cytosolic proteins (APX2) and
confers cellular tolerance to stress (e.g., plasma membrane dam-
age) (see Wilson et al., 2009) and lowers ROS (Figure 1). That is,
while drought is a general stress on a cell, a component of the
drought response can be viewed as chloroplast specific, namely,
inhibition of photosynthesis, leading to elevated ROS. Thus, it is
not unexpected that 70% of HL genes are drought inducible.
However, that does not preclude other drought response path-
ways operating independently or concurrently with the proposed
SAL1-PAP pathway.
Evidence for XRNs Being Targets of the SAL1-PAP Pathway
Akeyquestion is,whatare the targets of PAP?PAP is an adenosine
phosphate and thus can bind irreversibly to yeast XRNs, inhibiting
their activity (Dichtl et al., 1997). Thus, we investigated whether xrn
knockouts would phenocopy elevated PAP levels.
Whereas the single xrn mutants show a wild-type phenotype,
there is a strikingly similar expression levels of 56%of transcripts
altered in xrn2 xrn3with those in alx8, similar drought tolerance of
the xrn2 xrn3 (Figures 6 to 8, Tables 2 and 3), and similar altered
leaf morphology (Gy et al., 2007). All of this suggests that XRN2
and XRN3 are negative regulators of stress gene expression and
may function in the SAL1-PAP pathway. xrn4 is also likely to be
inhibited by elevated PAP; here, we show alx8 alters the abun-
dance of the 39 cleavage products of four miRNA targets (see
Supplemental Figure 7 online), in addition to those reported for
xrn4-5 (Souret et al., 2004) and the sal1mutants fry1-4 and fry1-5
(Gy et al., 2007). Based on gene expression analysis (Figures 6
and 7) and xrn4 phenotypes, it is unlikely that inhibition of XRN4
accounts for the majority of the phenotypes observed in alx8, as
the majority of the transcript changes, altered morphology, and
drought tolerance better correlate with the xrn2 xrn3 double mu-
tant. With respect to the drought tolerance, UDP-glucoronosyl/
UDP-glucosyl transferase family protein (AT1G05680) is signif-
icantly upregulated in both sal1 and xrn2 xrn3 mutants (see
Supplemental Data Set 1 online), and increasing its levels can
cause drought tolerance (Tognetti et al., 2010). However, xrn2
xrn3 plants are not as tolerant as alx8 plants, and ;40% of the
alx8 transcriptome changes are not found in the xrn2 xrn3 arrays.
Although it remains to be directly demonstrated that PAP inhibits
the activity of plant XRNs, the weight of evidence presented here
and byGy et al. (2007) is in favor of this interaction.Whether there
are other targets for PAP or processes altered by SAL1 is the
subject of investigation.
XRN-mediated gene regulation does not consist just of altered
mRNA degradation as for MYB33 (see Supplemental Figure 7
online) but also includes elevated transcription, as demonstrated
by APX2:LUC (Rossel et al., 2006). We envisage at least two
potentialmechanismsof action: XRNsaltermRNA levels byaltering
small and/or cleaved RNA pools, or XRNs alter gene transcription
by affecting transcription termination. With respect to the latter,
XRNs alter the release of RNA polymerases from the gene, thereby
affecting transcription in yeast and human (Kim et al., 2004; West
et al., 2004). Regarding changes to gene silencing, XRNs may
inhibit accumulation of small RNAs that target positive regulators of
stress gene expression. Alternatively, inhibition of the XRNsbyPAP
could prevent the degradation of the uncapped RNA templates
triggering post-transcriptional gene silencing (Gy et al., 2007) of
genes that repress stress responses. The determination of the
substrates and the function of the nuclear XRNs will be critical to
elucidate the underlying gene regulatory mechanisms.
In this article, we provide evidence for a previously undiscov-
ered retrograde mechanism, the SAL1-PAP pathway, which
would rely on chloroplastic SAL1 enzyme–regulating PAP levels,
thereby affecting its action on nuclear targets, most likely XRNs.
We resolve the chloroplastic localization of SAL1 and provide the
unreported finding that it also accumulates in mitochondria but
not in the cytosol or nuclei and that a primary in vivo substrate is
PAP. PAP accumulates as result of HL and drought (20-fold), and
it correlates with upregulation of 25% of the HL transcriptome.
PAP is known to inhibit yeast XRNs, and we show here that SAL1
and XRNs mediate accumulation of 39mRNA cleavage products
and expression of a common set of genes. Based on this,
together with our finding that PAP can be depleted by targeting
SAL1 to chloroplasts or nuclei, we conclude that SAL1 and PAP
function in one of the cellular retrograde signaling pathways.
METHODS
Plant Material and Growth of Plants
Plant growth and drought stress conditions were as previously described
(Wilson et al., 2009). Seeds from fry1-6 (SALK_020882) overexpressing a
4006 The Plant Cell
truncated form of SAL1 (AT5G63980) cDNA (Kim and von Arnim, 2009)
and the xrn2-1 xrn3-1 (xrn2 xrn3) double mutant (Gy et al., 2007) were
donated by A.G. von Arnim (University of Tennessee). Seeds for fou8 and
SSU:ScSAL1-complemented fou8 (Rodrıguez et al., 2010) were kindly
provided by E.E. Farmer (University of Lausanne). Survival time of plants
during drought was calculated as described by Woo et al. (2008) from
measurements of the maximum efficiency of photosystem II (FvFm) using
chlorophyll fluorescence. xrn4mutants were xrn4-6 (SALK_ 014209) and
ein5-6 (Olmedo et al., 2006). All insertion mutants were confirmed by
PCR. See the primers listed in Supplemental Table 3 online.
RNA Isolation and RT-PCR
Total RNA was extracted from;50 mg of leaf tissue using the Spectrum
Total RNA kit (Sigma-Aldrich). RNA was reversed transcribed into cDNA
using the Roche Transcriptor first-strand cDNA synthesis kit (Roche
Diagnostics) and oligo(dT) primers. Gene expression was analyzed on a
Roche LightCycler480 using hydrolysis probes from the Universal Probe
Library and applying the relative quantification method described by
Pfaffl (2001). Samples were normalized against CYCLOPHILIN5 (AT-
CYP5, AT2G29960) or GLYCERALDEHYDE-3-PHOSPHATE DEHYDRO-
GENASE C2 (GAPC2, AT1G13440). At least three biological replicates
per genotype per experiment were sampled, and each sample was run in
triplicate.
Global Transcript Analyses
Analysis of the changes in transcript abundance between Col-0, xrn4
(ein5), alx8, and xrn2 xrn3 seedlings was performed using Affymetrix
GeneChipArabidopsisATH1 genome arrays.Whole rosettes from several
seedlings at the 10 true leaf stage of development (synchronized for
development to account for the slower growth rate of alx8), grown under a
16-h photoperiod, were pooled for each biological replicate. Col-0 and
mutant tissue samples were collected in biological triplicate. For each
replicate, total RNA was isolated from the leaves using the RNeasy plant
mini protocol (Qiagen) and quality verified using a Bioanalyzer (Agilent
Technologies), and spectrophotometric analysis was performed to deter-
mine the A260:A280 and A260:A230 ratios. Preparation of labeled copy RNA
from 400 ng of total RNA (39 IVT Express kit; Affymetrix), target hybrid-
ization, as well as washing, staining, and scanning of the arrays were
performed exactly as described in the Affymetrix GeneChip expression
analysis technical manual, using an Affymetrix GeneChip Hybridization
Oven 640, an Affymetrix Fluidics Station 450, and an GeneChip Scanner
3000 7G at the appropriate steps.
Statistical Analysis
Data quality was assessed using GCOS1.4 before CEL files were exported
into AVADIS Prophetic (version 4.3; Strand Genomics) and Partek Ge-
nomicsSuite software, version 6.3, for further analysis.MAS5normalization
algorithms were performed only to generate present/absent calls across
the arrays. Probe sets that recorded absent calls over 11 or more of the
gene chips analyzed were removed. Bacterial controls were also removed,
resulting in a final data set of 16,022 probe identifiers. CEL files were also
subjected to GC-content background Robust Multi-array Average normal-
ization for computing fluorescence intensity values used in further analyses.
Correlation plots were examined between all arrays using the scatterplot
function in the Partek Genomics Suite, and in all cases r $ 0.98 (data not
shown). The values of gene expression after normalizationwith GC-content
background Robust Multi-array Average were analyzed to identify differ-
entially expressed genes by a regularized t test based on a Bayesian
statistical framework using the software programCyber-T (Baldi and Long,
2001) (http://cybert.microarray.ics.uci.edu/). Cyber-T employs a mixture
model-basedmethod described by Allison et al. (2006) for the computation
of the global false-positive and false-negative levels inherent in a DNA
microarray experiment. To accurately control for FDR and minimize false
positives within the differential expression analysis, posterior probability of
differential expression PPDE(P) values and PPDE(>P) values were calcu-
lated, as a means to measure the true discovery rate (1 – FDR). Changes in
transcript abundance were considered significant with a PPDE(>P) > 0.95
and a fold change >1.5-fold.
Overlaps in the transcript abundance responses for the different
genotypes were plotted on Venn diagrams to determine statistically
significant over- or underrepresentation in the overlap, compared with
that which is expected by random chance, using a Pearson’s x2 test for
independence.
ANOVA and t test analyses were performed using Microsoft Excel.
Cell Fractionation
Arabidopsis thaliana ecotype Col-0 was grown in 0.53 Murashige and
Skoog (MS) medium, 1% (w/v) Suc, and 0.7% (w/v) agar plates under LL
(100 mmol photon m–2 s–1) with a 12-h photoperiod at 20 6 28C for 16 d.
Approximately 13 g of seedlings were harvested in the morning before
commencement of the light period. The tissue was vacuum infiltrated in
40 mL of digestion medium (1.5% [w/v] cellulase, 0.4% [w/v] macer-
ozyme, 0.5M Suc, 20mMKCl, 10mMCaCl2, and 20mMMES) for 30min
and incubated for an additional 3 h. All incubation steps were performed
in the dark. After incubation, themixture was filtered through two layers of
miracloth presoaked in floating medium (Gardestrom and Wigge, 1988)
(0.5 M Suc, 1 mM MgCl2, and 5 mM HEPES, pH 7.0). Protoplasts were
released by passing the eluant through the slurry several times, pressing it
with a spatula after the last elution, and collecting it in a glass beaker in
ice. All subsequent steps were performed at 48C. The dark-green flow-
through was divided into 10-mL aliquots in four 30-mL Corex tubes and
topped with 5 mL of floating medium II (FMII; 0.4 M Suc, 0.1 M sorbitol,
1 mM MgCl2, and 5 mM HEPES, pH 7.0) and 3 mL of floating medium III
(FMIII; 0.5 M sorbitol, 1 mM MgCl2, and 5 mM HEPES, pH 7.0). This was
performed very carefully to avoid disrupting the interfaces between the
different solutions. The tubeswere centrifuged at 250g for 5min at 48C in a
swing-out rotor (brake off). Intact protoplasts were recovered from the
FMIII/FMII interface and the chloroplast-containing pellet further pro-
cessed (see below). The intact protoplasts were disrupted by six strokes
in a prechilled 10-mLWheaton Potter-Elvehjem tissue grinder. An;8-mL
samplewas transferred to a 15-mLCorex tube, a 500mL 85% (v/v) Percoll
cushionwas layered at the bottomwith a long glass Pasteur pipette, and a
1000-mL layer of FMIII was added on the top. The gradient was then
centrifuged at 2000g for 10 min at 48C in a swing-out rotor (brake off).
Contaminating protoplasts settled in the FMIII/sample interface, and the
remainder of the chloroplasts were on top of the 85% (v/v) Percoll cushion.
The middle phase, containing the cytosolic fraction, was carefully removed
andcentrifugedat 13,000g for 30min at 48C ina fixed-angle rotor to remove
any contaminating organelles. The supernatant was further concentrated
with 5-kD Ultrafree centrifugal filter devices (Millipore).
For the purification of chloroplasts, the pellets after the first centrifu-
gation step were resuspended in a final volume of 10 mL of chloroplast
buffer (50 mM HEPES-KOH, pH 8.0, 5 mM EDTA, 5 mM EGTA, 330 mM
sorbitol, 5 mM Cys, and 5 mM ascorbic acid) and cleared by centrifuga-
tion at 250g for 5 min at 48C in a swing-out rotor. The pellets were gently
resuspended in a minimum volume (;3 mL) of the same buffer, loaded
onto a 45/85% (v/v) Percoll gradient (Aronsson and Jarvis, 2002), and
spun at 3000g 15 min at 48C in a swing-out rotor (brake off). The intact
chloroplasts were recovered from the 45/85% (v/v) interface, washed
once with 10 volumes of chloroplast buffer, and spun at 800g for 15min in
a swing-out rotor at 48C. The clean, intact chloroplasts were resuspended
in 500 mL of chloroplast buffer.
SAL1-PAP–Mediated Retrograde Signaling 4007

Mitochondria were purified by free-flow electrophoresis as described
by Eubel et al. (2007).
Protein Gel Electrophoresis and Immunoblotting
Total protein from tissue and cell fractions were extracted in 10% (w/v)
tricarboxylic acid in cold acetone. Protein gel electrophoresis was per-
formed as described (Wilson et al., 2009). Immunoblotting was performed
using the SNAPid system (Millipore) and antibodies against SAL1 (1:1000;
Wilson et al., 2009), Lhcb2 (1:1000; Agrisera AS01-003), TOM40 (1:5000;
Carrie et al., 2009), and UGPase (1:500; Agrisera AS05-086).
GFP Fusion for Subcellular Localization
The full-length cDNA of SAL1 was cloned as a C-terminal GFP fusion by
Gateway cloning under the control of a 35S promoter (Murcha et al., 2007;
Carrie et al., 2009). Primers used were as follows: SAL1FOR, 59-GGG-
GACAAGTTTGTACAAAAAAGCAGGCTTCGAAGGAGATAGAACCATG-
ATGTCTATAAATTGTTTTCGAA-39, and SAL1REV, 59-GGGGACCAC-
TTTGTACAAGAAAGCTGGGTCTCCACCTCCGGATCCGAGAGCTGAA-
GCTTTCTCTTGC-39, where underlined sections correspond to SAL1
and the rest for homologous recombination. The PCR product was
cloned into pDonr201 (Invitrogen) and then into pDest/pGem/CGFP
(Carrie et al., 2009). The plastid localization control, Rubisco SSU, and
the mitochondrial control, AOX1, were cloned as C-terminal RFP fusions
using the same system. SAL1-GFP along with either one of the control
constructs was cotransformed into Arabidopsis cell suspension as
previously described (Thirkettle-Watts et al., 2003; Carrie et al., 2009).
Localization of GFP and RFP expression was conducted using an
Olympus BX61 fluorescence microscope and imaged using the CellR
imaging software as previously described (Carrie et al., 2007; Murcha
et al., 2007).
In Vivo SAL1:GFP Visualization
The SAL1 genomic fragment (1960 bp) and an additional 753-bp up-
stream region was PCR cloned by standard molecular techniques in the
Wassilewskija accession. Primers used were as follows: FRY1promF,
59-CACCGTTGGAGATTATCTTCTGTAGG-39, and FRY1endR, 59-GAG-
AGCTGAAGCTTTCTCTTGC-39, which amplified a product of 2713 bp
(753+1960). After sequencing in pENTR/D-TOPO, an LR clonase reaction
was used to clone the genomic fragment in the binary vector pGWB4
(Nakagawa et al., 2007) and transformed into Arabidopsis Col-0 by simpli-
fied floral dip method (Logemann et al., 2006). Primary transformants were
selected in medium containing 50 mg/L hygromycin. Their progeny were
screened for GFP expression in standard in vitro growth conditions.
Observations were made using either an upright DMR or a Leica SP2
AOBS inverted confocal microscope (Leica Microsystems). In the first case,
a 310 DRY objective lens (numerical aperture of 0.40) was mounted on an
upright DMR microscope equipped with a mercury lamp. The GFP and
chlorophyll signalswere collected using a 515-nm-long pass filter (excitation
with 450 to 490 nm). For the observations made with the Leica SP2 AOBS
inverted confocal microscope, 2-week-old plants grown in soil in short-day
conditions were used. A310 dry objective lens (numerical aperture of 0.40)
was used for all observations. GFP and chlorophyll were excited with a 488-
nm argon laser. The GFP signal was collected at 496 to 539 nm and
chlorophyll at 676 to718nm(pinhole adjusted to2.46). Followingacquisition,
brightness and contrast were adjusted using the LCS software.
Mesophyll protoplasts were prepared as described (Leonhardt et al.,
2004). Protoplasts were incubated on ice with 400 nM MitoTracker Red
CMXRos (Invitrogen) for 30 min, in the dark, before confocal observa-
tions. Observations were made using a Leica SP2 AOBS inverted con-
focal microscope (Leica Microsystems) equipped with an argon ion laser
and aDPSS 561-nm laser. A363water objective lens (numerical aperture
of 1, 20) was used for all observations. GFP was excited at 488 nm and
MitoTracker red at 561 nm. The GFP signal was collected at 500 to 530
nm, the MitoTracker Red signal was collected at 575 to 615 nm, and
chlorophyll at 653 to 731 nm. Following acquisition, brightness and
contrast were adjusted using the LCS software (identical parameters
were applied to control and GFP images).
Quantification of Phosphoadenosines
Extraction of Adenosine Derivatives
Adenosine derivatives were extracted in HCl and quantified fluorometri-
cally after specific derivatization of adenosine compounds with chlo-
roacetaldehyde (CAA) based on a method previously described
(Burstenbinder et al., 2007). Briefly, 100 mg of tissue was ground in liquid
nitrogen, extracted with 1 mL of 0.1 M HCl in ice for 15 min, and
centrifuged twice at 16,000g at 48C for 5 min. After clarification, 150 mL of
the supernatant mixed with 770 mL of CP buffer [620 mM citric acid-1-
hydrate and 760 mM (Na)2HPO4.2H2O, pH 4] was derivatized by adding
80 mL of 45% (v/v) chloroacetaldehyde for 10 min at 808C. The sample
was finally centrifuged at 16,000g for 45 min at 208C before injection into
the HPLC. The commercial standards used were as follows: adenosine
(Sigma-Aldrich; A9251), ADP sodium salt (Sigma-Aldrich; A2754), AMP
(Fluka; catalog number 1930), APS sodium salt (Sigma-Aldrich; A5508),
ATP (Sigma-Aldrich; A-5394), PAP (Sigma-Aldrich; A5763), PAPS (Sigma-
Aldrich; A1651), and S-(59-adenosyl)-L-Met chloride (Sigma-Aldrich;
A7007).
HPLC of Adenosine Derivatives
The analyses of adenosines was performed by reverse-phase HPLC on a
Gemini-NX 5-mm C18 110A column (Phenomenex) connected to Waters
600E HPLC system and Waters 474 fluorescent detector (Waters). The
gradient for separation of PAP was optimized as follows: equilibration of
column for 0.2minwith 95% (v/v) of buffer A (5.7mM [CH3(CH2)3]4NHSO4
and 30.5mMKH2PO4, pH 5.8) and 5% (v/v) buffer B (67% [v/v] acetonitrile
and 33% [v/v] buffer A), linear gradient for 53min up to 50% (v/v) of buffer
B, and re-equilibration for 7 min with 5% (v/v) buffer B. Chromatograms
were recorded and processedwith theMilenium32 software (Waters) and
edited using Adobe Illustrator (Adobe).
Analysis of IPs
Feeding of Arabidopsis Seedlings with Radiolabeled myo-Inositol
Seeds were stratified and sown on 0.53 MS agar containing vitamins
(DuchefaBiochemie) and germinated at 228C in a Sanyo light cabinet under
long-day (16 h light/8 h dark) conditions at a fluence rate of 120 mmol m22
s21 for 10 d. Five or six seedlings were subsequently placed in 0.4 mL of
0.53MSagar basal salts (Duchefa) liquidmedia towhich 1.11mBqofmyo-
[2-3H]inositol (specific activity 752 GBq/mmol; PerkinElmer) and 0.1 mM
unlabeled myo-inositol were added. Seedlings were labeled for 72 h.
Seedlingswerewashedbriefly inwater, blotted dry, transferred to a conical
Eppendorf tube, frozen in liquid N2, and ground with a plastic pestle. The
sample was extracted, with further grinding, with 0.3 mL of 0.6 M HCl after
addition of 10mL of 1mMphytic acid (Sigma-Aldrich; P8810) and left on ice
for 30 min before centrifugation at 17,000g for 15 min at 48C. The
supernatant was diluted to 1 mL with water and applied directly to HPLC.
HPLC of IPs
IP extracts were analyzed on a 25 cm 3 4.6-mm Partisphere SAX HPLC
column (Whatman) with guard cartridge of the same material. Samples,
4008 The Plant Cell
1mL, were loaded and eluted with a gradient of phosphate, generated by
mixing solvents from buffer reservoirs, A, water; B, 1.25 M NH4H2PO4,
adjusted to pH3.35withH3PO4, according to the following schedule: time
(min),% B; 0,0; 5,0; 65,100; 75,100. Radioactivity was estimated in a
Canberra Packard A515 detector fitted with a 0.5-mL flow cell after
admixture of Optima Flo AP scintillation fluid (Canberra Packard) at a flow
rate of 2 mL min21. The integration interval was 0.2 min. Data were
exported from the Flo-One software (Canberra Packard) as ASCII files
and redrawn in Delta Graph 4.0 (DeltaPoint).
Feeding of Arabidopsis Seedlings with PAP
Seven-day-old, plate-grown Col-0 seedlings were incubated with 100 mL
of 0, 0.5, 1.0, and 2.0mMPAP in 96-well plates. Theywere then incubated
at LL (150 mmol m22 s21) or HL (1500 mmol m22 s21) for 50 min. After
treatment, 1mM luciferin was added and light emitted acquired overnight
in a luminometer (FLUOStar OPTIMA).
H2O2 Detection and Quantification
Foliar H2O2 levels were visualized by 3,39-diaminobenzidine (DAB) stain-
ing. Five-week-old plants grown hydroponically were transferred to a
solution containing 25 mM DAB and incubated 1 h under HL (1000 mmol
photonsm22 s21). The leaveswere then placed into ethanol to remove the
chlorophyll and the presence of H2O2 visualized as a brown stain.
Alternatively, leaf H2O2 was quantified in 6-week-old, soil-grown plants
with the Amplex Red Hydrogen Peroxide/Peroxidase Assay Kit (Invitro-
gen). Approximately 100 mg of leaf tissue was flash frozen in liquid
nitrogen, ground, and extracted with 500 mL of 20 mM K2HPO4, pH 6.5.
The slurry was cleared by centrifugation at 16,000g for 15 min at 48C. The
supernatant was incubated with 0.1 mM Amplex Red reagent and 0.2
units mL21 horseradish peroxidase at room temperature for 30 min in the
dark (final reaction volume of 100 mL). Finally, absorbance wasmeasured
at 560 nm using a mQuant plate reader (BioTek Instruments) with Gen5
software, and the concentration of H2O2 was calculated using a standard
curve (0.5, 1, 2, and 5 mM H2O2 range).
Accession Numbers
Sequence data from this article can be found in the GenBank/EMBL data
libraries under the following accession numbers: ABI1 (At4g26080),
APX2 (At3g09640), ATHB15 (At1g52150), ATCYP5 (AT2G29960), ELIP2
(At4g14690), GNAT (At2g39030), MYB33 (At5g06100), OST1 (At4g33950),
PHB (At2g34710), REV (At5g60690), SAL1/FRY1 (At5g63980), SOT1
(At2g03760), T5C23 (At4g11710), VSP1 (At5g24780), XRN2 (At5g42540),
XRN3 (At1g75660), and XRN4 (At1g54490).
Supplemental Data
The following materials are available in the online version of this article.
Supplemental Figure 1. PAP Feeding Experiments.
Supplemental Figure 2. The sal1 Mutants alx8 and fry1-6 Lack SAL1
Protein and Have Similar Rosette Morphology.
Supplemental Figure 3. Inositol Phosphate Profile in Col-0 and the
sal1 Mutant fry1-1.
Supplemental Figure 4. Development of a Highly Sensitive Tech-
nique for Quantification of Phosphonucleotides.
Supplemental Figure 5. PAP, but Not PAPS, Accumulates in the fou8
Mutants.
Supplemental Figure 6. Development of a New Method for Simul-
taneous Isolation of Cytosolic and Chloroplastic Fractions.
Supplemental Figure 7. Accumulation of 39 Cleavage Products in
SAL1 Mutants.
Supplemental Figure 8. Antagonistic Changes in Global Gene
Expression in alx8, xrn4, and xrn2 xrn3.
Supplemental Table 1. miRNA Targets Upregulated in alx8.
Supplemental Table 2. Genes Showing Similar Transcriptional Re-
sponses in Both alx8 and xrn2 xrn3 Mutants.
Supplemental Table 3. List of Primers.
Supplemental Data Set 1. Microarray Data for alx8, xrn2 xrn3, and
xrn4 Mutants.
ACKNOWLEDGMENTS
We thank Albrecht G. von Arnim (University of Tennessee) for providing
seeds of fry1-6 (SALK_020882) overexpressing a truncated form of SAL1
and xrn2 xrn3 double mutants. Seeds of fou8 and fou8-complemented
line were kindly provided by Edward Farmer (University of Lausanne). We
thank Hayley Whitfield (Brearley lab) for plant care and technical as-
sistance. Funding to Australian researchers was provided by the Austra-
lian Research Council Centre of Excellence in Plant Energy Biology
(CE0561495).
AUTHOR CONTRIBUTIONS
G.M.E. performed cell fractionation and localization, adenosine derivative
quantification, gene expression of complemented lines for the RT-PCR
versus PAP correlations, immunoblots, and drought experiments. G.M.E.
and B.J.P. planned and coordinated the experimental work, analyzed
data, and wrote the article. P.A.C. screened and characterized fry1-6:
trSAL1 and xrn mutant lines, including drought testing, performed gene
expression analyses, and assistedwith PAP quantification andwriting the
article. W.P. performed the feeding experiments with PAP, DAB staining,
and H2O2 quantification. M.W. and R.H. developed the HPLC procedure
to quantify PAP and also performed metabolite quantification. D.C.
standardized the HPLC technique at Australian National University and
helped to quantify PAP in chloroplastic fractions. C.C., E.G., and J.W.
carried out the GFP fusion and microarray analyses. P.D., H.J., and E.M.
prepared the pSAL1:SAL1:GFP construct, transformed the plants, and
performed localization studies of the SAL1:GPF reporter gene in vivo.
C.B. quantified the IPs in seedlings and seeds of different genotypes. All
the authors discussed the results and commented on the article.
Received September 2, 2011; revised October 18, 2011; accepted
November 10, 2011; published November 29, 2011.
REFERENCES
Albrecht, V., Simkova, K., Carrie, C., Delannoy, E., Giraud, E.,
Whelan, J., Small, I.D., Apel, K., Badger, M.R., and Pogson, B.J.
(2010). The cytoskeleton and the peroxisomal-targeted snowy coty-
ledon3 protein are required for chloroplast development in Arabidop-
sis. Plant Cell 22: 3423–3438.
Allison, D.B., Cui, X., Page, G.P., and Sabripour, M. (2006). Microarray
data analysis: From disarray to consolidation and consensus. Nat.
Rev. Genet. 7: 55–65.
Aronsson, H., and Jarvis, P. (2002). A simple method for iso-
lating import-competent Arabidopsis chloroplasts. FEBS Lett. 529:
215–220.
SAL1-PAP–Mediated Retrograde Signaling 4009

Baldi, P., and Long, A.D. (2001). A Bayesian framework for the analysis
of microarray expression data: Regularized t -test and statistical
inferences of gene changes. Bioinformatics 17: 509–519.
Ball, L., Accotto, G.-P., Bechtold, U., Creissen, G., Funck, D.,
Jimenez, A., Kular, B., Leyland, N., Mejia-Carranza, J., Reynolds,
H., Karpinski, S., and Mullineaux, P.M. (2004). Evidence for a direct
link between glutathione biosynthesis and stress defense gene ex-
pression in Arabidopsis. Plant Cell 16: 2448–2462.
Bradbeer, J.W., Atkinson, Y.E., Borner, T., and Hagemann, R. (1979).
Cytoplasmic synthesis of plastid polypeptides may be controlled by
plastid-synthesized RNA. Nature 279: 816–817.
Burstenbinder, K., Rzewuski, G., Wirtz, M., Hell, R., and Sauter, M.
(2007). The role of methionine recycling for ethylene synthesis in
Arabidopsis. Plant J. 49: 238–249.
Carrie, C., Murcha, M.W., Millar, A.H., Smith, S.M., and Whelan, J.
(2007). Nine 3-ketoacyl-CoA thiolases (KATs) and acetoacetyl-CoA
thiolases (ACATs) encoded by five genes in Arabidopsis thaliana are
targeted either to peroxisomes or cytosol but not to mitochondria.
Plant Mol. Biol. 63: 97–108.
Carrie, C., Kuhn, K., Murcha, M.W., Duncan, O., Small, I.D., O’Toole,
N., and Whelan, J. (2009). Approaches to defining dual-targeted
proteins in Arabidopsis. Plant J. 57: 1128–1139.
Chen, H.A.O., and Xiong, L. (2010). The bifunctional abiotic stress
signalling regulator and endogenous RNA silencing suppressor FI-
ERY1 is required for lateral root formation. Plant Cell Environ. 33:
2180–2190.
Clifton, R., Lister, R., Parker, K.L., Sappl, P.G., Elhafez, D., Millar, A.H.,
Day, D.A., and Whelan, J. (2005). Stress-induced co-expression
of alternative respiratory chain components in Arabidopsis thaliana.
Plant Mol. Biol. 58: 193–212.
Dichtl, B., Stevens, A., and Tollervey, D. (1997). Lithium toxicity in
yeast is due to the inhibition of RNA processing enzymes. EMBO J.
16: 7184–7195.
Eubel, H., Lee, C.P., Kuo, J., Meyer, E.H., Taylor, N.L., and Millar,
A.H. (2007). Free-flow electrophoresis for purification of plant mito-
chondria by surface charge. Plant J. 52: 583–594.
Foyer, C.H., and Noctor, G. (2009). Redox regulation in photosynthetic
organisms: Signaling, acclimation, and practical implications. Antioxid.
Redox Signal. 11: 861–905.
Fryer, M.J., Ball, L., Oxborough, K., Karpinski, S., Mullineaux, P.M.,
and Baker, N.R. (2003). Control of Ascorbate Peroxidase 2 expres-
sion by hydrogen peroxide and leaf water status during excess light
stress reveals a functional organisation of Arabidopsis leaves. Plant J.
33: 691–705.
Galvez-Valdivieso, G., Fryer, M.J., Lawson, T., Slattery, K., Truman,
W., Smirnoff, N., Asami, T., Davies, W.J., Jones, A.M., Baker, N.R.,
and Mullineaux, P.M. (2009). The high light response in Arabidopsis
involves ABA signaling between vascular and bundle sheath cells.
Plant Cell 21: 2143–2162.
Gardestrom, P., and Wigge, B. (1988). Influence of photorespiration on
ATP/ADP ratios in the chloroplasts, mitochondria, and cytosol, stud-
ied by rapid fractionation of barley (Hordeum vulgare) protoplasts.
Plant Physiol. 88: 69–76.
Garmier, M., Carroll, A.J., Delannoy, E., Vallet, C., Day, D.A., Small,
I.D., and Millar, A.H. (2008). Complex I dysfunction redirects cellular
and mitochondrial metabolism in Arabidopsis. Plant Physiol. 148:
1324–1341.
German, M.A., et al. (2008). Global identification of microRNA-target RNA
pairs by parallel analysis of RNA ends. Nat. Biotechnol. 26: 941–946.
Gil-Mascarell, R., Lopez-Coronado, J.M., Belles, J.M., Serrano, R.,
and Rodrıguez, P.L. (1999). The Arabidopsis HAL2-like gene family
includes a novel sodium-sensitive phosphatase. Plant J. 17: 373–383.
Giraud, E., Ho, L.H., Clifton, R., Carroll, A., Estavillo, G., Tan, Y.F.,
Howell, K.A., Ivanova, A., Pogson, B.J., Millar, A.H., and Whelan,
J. (2008). The absence of ALTERNATIVE OXIDASE1a in Arabidopsis
results in acute sensitivity to combined light and drought stress. Plant
Physiol. 147: 595–610.
Gregory, B.D., O’Malley, R.C., Lister, R., Urich, M.A., Tonti-Filippini,
J., Chen, H., Millar, A.H., and Ecker, J.R. (2008). A link between RNA
metabolism and silencing affecting Arabidopsis development. Dev.
Cell 14: 854–866.
Gy, I., Gasciolli, V., Lauressergues, D., Morel, J.-B., Gombert, J.,
Proux, F., Proux, C., Vaucheret, H., and Mallory, A.C. (2007).
Arabidopsis FIERY1, XRN2, and XRN3 are endogenous RNA silencing
suppressors. Plant Cell 19: 3451–3461.
Harari-Steinberg, O., Ohad, I., and Chamovitz, D.A. (2001). Dissection
of the light signal transduction pathways regulating the two early light-
induced protein genes in Arabidopsis. Plant Physiol. 127: 986–997.
Hirsch, J., et al. (2011). A novel fry1 allele reveals the existence of a
mutant phenotype unrelated to 59->39 exoribonuclease (XRN) activ-
ities in Arabidopsis thaliana roots. PLoS ONE 6: e16724.
Hruz, T., Laule, O., Szabo, G., Wessendorp, F., Bleuler, S., Oertle, L.,
Widmayer, P., Gruissem, W., and Zimmermann, P. (2008). Gene-
vestigator V3: A reference expression database for the meta-analysis
of transcriptomes. Adv. Bioinformatics 2008: 420747.
Karpinski, S., Escobar, C., Karpinska, B., Creissen, G., and Mullineaux,
P.M. (1997). Photosynthetic electron transport regulates the expres-
sion of cytosolic ascorbate peroxidase genes in Arabidopsis during
excess light stress. Plant Cell 9: 627–640.
Karpinski, S., Reynolds, H., Karpinska, B., Wingsle, G., Creissen, G.,
and Mullineaux, P. (1999). Systemic signaling and acclimation in
response to excess excitation energy in Arabidopsis. Science 284:
654–657.
Kastenmayer, J.P., and Green, P.J. (2000). Novel features of the XRN-
family in Arabidopsis: Evidence that AtXRN4, one of several orthologs
of nuclear Xrn2p/Rat1p, functions in the cytoplasm. Proc. Natl. Acad.
Sci. USA 97: 13985–13990.
Kim, B.H., and von Arnim, A.G. (2009). FIERY1 regulates light-mediated
repression of cell elongation and flowering time via its 39(29),59-
bisphosphate nucleotidase activity. Plant J. 58: 208–219.
Kim, M., Krogan, N.J., Vasiljeva, L., Rando, O.J., Nedea, E., Greenblatt,
J.F., and Buratowski, S. (2004). The yeast Rat1 exonuclease pro-
motes transcription termination by RNA polymerase II. Nature 432:
517–522.
Kimura, M., Manabe, K., Abe, T., Yoshida, S., Matsui, M., and
Yamamoto, Y.Y. (2003). Analysis of hydrogen peroxide-independent
expression of the high-light-inducible ELIP2 gene with the aid of
the ELIP2 promoter-luciferase fusions. Photochem. Photobiol. 77:
668–674.
Kimura, M., Yamamoto, Y., Seki, M., Sakurai, T., Sato, M., Shinozaki,
K., Manabe, K., and Matsui, M. (2002). Identification of Arabidopsis
genes regulated by high light-stress using cDNA microarray. Plant
Cell Physiol. 43: S159.
Kindgren, P., Eriksson, M.-J., Benedict, C., Mohapatra, A., Gough,
S.P., Hansson, M., Kieselbach, T., and Strand, A. (2011). A novel
proteomic approach reveals a role for Mg-protoporphyrin IX in re-
sponse to oxidative stress. Physiol. Plant. 141: 310–320.
Klein, M., and Papenbrock, J. (2004). The multi-protein family of
Arabidopsis sulphotransferases and their relatives in other plant
species. J. Exp. Bot. 55: 1809–1820.
Kleine, T., Kindgren, P., Benedict, C., Hendrickson, L., and Strand,
A. (2007). Genome-wide gene expression analysis reveals a critical
role for CRYPTOCHROME1 in the response of Arabidopsis to high
irradiance. Plant Physiol. 144: 1391–1406.
Kleine, T., Voigt, C., and Leister, D. (2009). Plastid signalling to the
4010 The Plant Cell

nucleus: Messengers still lost in the mists? Trends Genet. 25:
185–192.
Koussevitzky, S., Nott, A., Mockler, T.C., Hong, F., Sachetto-
Martins, G., Surpin, M., Lim, J., Mittler, R., and Chory, J. (2007).
Signals from chloroplasts converge to regulate nuclear gene expres-
sion. Science 316: 715–719.
Larkin, R.M., Alonso, J.M., Ecker, J.R., and Chory, J. (2003). GUN4, a
regulator of chlorophyll synthesis and intracellular signaling. Science
299: 902–906.
Lee, K.P., Kim, C., Landgraf, F., and Apel, K. (2007). EXECUTER1-
and EXECUTER2-dependent transfer of stress-related signals from
the plastid to the nucleus of Arabidopsis thaliana. Proc. Natl. Acad.
Sci. USA 104: 10270–10275.
Leonhardt, N., Kwak, J.M., Robert, N., Waner, D., Leonhardt, G., and
Schroeder, J.I. (2004). Microarray expression analyses of Arabidop-
sis guard cells and isolation of a recessive abscisic acid hypersen-
sitive protein phosphatase 2C mutant. Plant Cell 16: 596–615.
Logemann, E., Birkenbihl, R.P., Ulker, B., and Somssich, I.E. (2006).
An improved method for preparing Agrobacterium cells that simplifies
the Arabidopsis transformation protocol. Plant Methods 2: 16.
Millar, A.H., Carrie, C., Pogson, B., and Whelan, J. (2009). Exploring the
function-location nexus: Using multiple lines of evidence in defining the
subcellular location of plant proteins. Plant Cell 21: 1625–1631.
Mochizuki, N., Tanaka, R., Tanaka, A., Masuda, T., and Nagatani, A.
(2008). The steady-state level of Mg-protoporphyrin IX is not a
determinant of plastid-to-nucleus signaling in Arabidopsis. Proc.
Natl. Acad. Sci. USA 105: 15184–15189.
Moulin, M., McCormac, A.C., Terry, M.J., and Smith, A.G. (2008).
Tetrapyrrole profiling in Arabidopsis seedlings reveals that retrograde
plastid nuclear signaling is not due to Mg-protoporphyrin IX accumu-
lation. Proc. Natl. Acad. Sci. USA 105: 15178–15183.
Mugford, S.G., et al. (2009). Disruption of adenosine-59-phosphosulfate
kinase in Arabidopsis reduces levels of sulfated secondary metabo-
lites. Plant Cell 21: 910–927.
Murcha, M.W., Elhafez, D., Lister, R., Tonti-Filippini, J., Baumgartner,
M., Philippar, K., Carrie, C., Mokranjac, D., Soll, J., and Whelan, J.
(2007). Characterization of the preprotein and amino acid transporter
gene family in Arabidopsis. Plant Physiol. 143: 199–212.
Murguıa, J.R., Belles, J.M., and Serrano, R. (1996). The yeast HAL2
nucleotidase is an in vivo target of salt toxicity. J. Biol. Chem. 271:
29029–29033.
Nakagawa, T., Kurose, T., Hino, T., Tanaka, K., Kawamukai, M.,
Niwa, Y., Toyooka, K., Matsuoka, K., Jinbo, T., and Kimura, T.
(2007). Development of series of gateway binary vectors, pGWBs, for
realizing efficient construction of fusion genes for plant transforma-
tion. J. Biosci. Bioeng. 104: 34–41.
Nott, A., Jung, H.-S., Koussevitzky, S., and Chory, J. (2006). Plastid-
to-nucleus retrograde signaling. Annu. Rev. Plant Biol. 57: 739–759.
Olinares, P.D.B., Ponnala, L., and van Wijk, K.J. (2010). Megadalton
complexes in the chloroplast stroma of Arabidopsis thaliana charac-
terized by size exclusion chromatography, mass spectrometry, and
hierarchical clustering. Mol. Cell. Proteomics 9: 1594–1615.
Olmedo, G., Guo, H., Gregory, B.D., Nourizadeh, S.D., Aguilar-
Henonin, L., Li, H., An, F., Guzman, P., and Ecker, J.R. (2006).
ETHYLENE-INSENSITIVE5 encodes a 59—>39 exoribonuclease re-
quired for regulation of the EIN3-targeting F-box proteins EBF1/2.
Proc. Natl. Acad. Sci. USA 103: 13286–13293.
Peltier, J.-B., Cai, Y., Sun, Q., Zabrouskov, V., Giacomelli, L.,
Rudella, A., Ytterberg, A.J., Rutschow, H., and van Wijk, K.J.
(2006). The oligomeric stromal proteome of Arabidopsis thaliana
chloroplasts. Mol. Cell. Proteomics 5: 114–133.
Perera, I.Y., Hung, C.-Y., Moore, C.D., Stevenson-Paulik, J., and
Boss, W.F. (2008). Transgenic Arabidopsis plants expressing the type
1 inositol 5-phosphatase exhibit increased drought tolerance and
altered abscisic acid signaling. Plant Cell 20: 2876–2893.
Pfaffl, M.W. (2001). A new mathematical model for relative quantifica-
tion in real-time RT-PCR. Nucleic Acids Res. 29: e45.
Pfannschmidt, T. (2010). Plastidial retrograde signalling—A true “plas-
tid factor” or just metabolite signatures? Trends Plant Sci. 15:
427–435.
Pfannschmidt, T., Brautigam, K., Wagner, R., Dietzel, L., Schroter, Y.,
Steiner, S., and Nykytenko, A. (2009). Potential regulation of gene
expression in photosynthetic cells by redox and energy state: Ap-
proaches towards better understanding. Ann. Bot. (Lond.) 103: 599–607.
Pogson, B.J., Woo, N.S., Forster, B., and Small, I.D. (2008). Plastid
signalling to the nucleus and beyond. Trends Plant Sci. 13: 602–609.
Quintero, F.J., Garciadeblas, B., and Rodrıguez-Navarro, A. (1996).
The SAL1 gene of Arabidopsis, encoding an enzyme with 39(29),59-
bisphosphate nucleotidase and inositol polyphosphate 1-phospha-
tase activities, increases salt tolerance in yeast. Plant Cell 8: 529–537.
Robles, P., Fleury, D., Candela, H., Cnops, G., Alonso-Peral, M.M.,
Anami, S., Falcone, A., Caldana, C., Willmitzer, L., Ponce, M.R.,
Van Lijsebettens, M., and Micol, J.L. (2010). The RON1/FRY1/SAL1
gene is required for leaf morphogenesis and venation patterning in
Arabidopsis. Plant Physiol. 152: 1357–1372.
Rodrıguez, V.M., Chetelat, A., Majcherczyk, P., and Farmer, E.E.
(2010). Chloroplastic phosphoadenosine phosphosulfate metabolism
regulates basal levels of the prohormone jasmonic acid in Arabidopsis
leaves. Plant Physiol. 152: 1335–1345.
Rossel, J.B., Walter, P.B., Hendrickson, L., Chow, W.S., Poole, A.,
Mullineaux, P.M., and Pogson, B.J. (2006). A mutation affecting
ASCORBATE PEROXIDASE 2 gene expression reveals a link between
responses to high light and drought tolerance. Plant Cell Environ. 29:
269–281.
Rossel, J.B., Wilson, P.B., Hussain, D., Woo, N.S., Gordon, M.J.,
Mewett, O.P., Howell, K.A., Whelan, J., Kazan, K., and Pogson,
B.J. (2007). Systemic and intracellular responses to photooxidative
stress in Arabidopsis. Plant Cell 19: 4091–4110.
Ruckle, M.E., DeMarco, S.M., and Larkin, R.M. (2007). Plastid signals
remodel light signaling networks and are essential for efficient chlo-
roplast biogenesis in Arabidopsis. Plant Cell 19: 3944–3960.
Souret, F.F., Kastenmayer, J.P., and Green, P.J. (2004). AtXRN4
degrades mRNA in Arabidopsis and its substrates include selected
miRNA targets. Mol. Cell 15: 173–183.
Strand, A., Asami, T., Alonso, J., Ecker, J.R., and Chory, J. (2003).
Chloroplast to nucleus communication triggered by accumulation of
Mg-protoporphyrinIX. Nature 421: 79–83.
Susek, R.E., Ausubel, F.M., and Chory, J. (1993). Signal transduction
mutants of Arabidopsis uncouple nuclear CAB and RBCS gene
expression from chloroplast development. Cell 74: 787–799.
Thirkettle-Watts, D., McCabe, T.C., Clifton, R., Moore, C., Finnegan,
P.M., Day, D.A., and Whelan, J. (2003). Analysis of the alternative
oxidase promoters from soybean. Plant Physiol. 133: 1158–1169.
Tognetti, V.B., et al. (2010). Perturbation of indole-3-butyric acid
homeostasis by the UDP-glucosyltransferase UGT74E2 modulates
Arabidopsis architecture and water stress tolerance. Plant Cell 22:
2660–2679.
Van Breusegem, F., Bailey-Serres, J., and Mittler, R. (2008). Unrav-
eling the tapestry of networks involving reactive oxygen species in
plants. Plant Physiol. 147: 978–984.
van Dijk, E.L., et al. (2011). XUTs are a class of Xrn1-sensitive antisense
regulatory non-coding RNA in yeast. Nature 475: 114–117.
Vranova, E., Inze, D., and Van Breusegem, F. (2002). Signal trans-
duction during oxidative stress. J. Exp. Bot. 53: 1227–1236.
Wagner, D., Przybyla, D., Op den Camp, R., Kim, C., Landgraf, F.,
Lee, K.P., Wursch, M., Laloi, C., Nater, M., Hideg, E., and Apel, K.
SAL1-PAP–Mediated Retrograde Signaling 4011

(2004). The genetic basis of singlet oxygen-induced stress responses
of Arabidopsis thaliana. Science 306: 1183–1185.
West, S., Gromak, N., and Proudfoot, N.J. (2004). Human 59 —> 39
exonuclease Xrn2 promotes transcription termination at co-transcrip-
tional cleavage sites. Nature 432: 522–525.
Wilson, P.B., Estavillo, G.M., Field, K.J., Pornsiriwong, W., Carroll,
A.J., Howell, K.A., Woo, N.S., Lake, J.A., Smith, S.M., Harvey
Millar, A., von Caemmerer, S., and Pogson, B.J. (2009). The
nucleotidase/phosphatase SAL1 is a negative regulator of drought
tolerance in Arabidopsis. Plant J. 58: 299–317.
Woo, N.S., Badger, M.R., and Pogson, B.J. (2008). A rapid, non-
invasive procedure for quantitative assessment of drought survival
using chlorophyll fluorescence. Plant Methods 4: 27.
Woodson, J.D., Perez-Ruiz, J.M., and Chory, J. (2011). Heme syn-
thesis by plastid ferrochelatase I regulates nuclear gene expression in
plants. Curr. Biol. 21: 897–903.
Xiong, L.M., Lee Bh, Ishitani, M., Lee, H., Zhang, C.Q., and Zhu, J.K.
(2001). FIERY1 encoding an inositol polyphosphate 1-phosphatase is
a negative regulator of abscisic acid and stress signaling in Arabi-
dopsis. Genes Dev. 15: 1971–1984.
Zakrzewska-Placzek, M., Souret, F.F., Sobczyk, G.J., Green, P.J.,
and Kufel, J. (2010). Arabidopsis thaliana XRN2 is required for
primary cleavage in the pre-ribosomal RNA. Nucleic Acids Res. 38:
4487–4502.
Zhang, J., et al. (2011). Inositol trisphosphate-induced Ca2+ signaling
modulates auxin transport and PIN polarity. Dev. Cell 20: 855–866.
4012 The Plant Cell
DOI 10.1105/tpc.111.091033; originally published online November 29, 2011; 2011;23;3992-4012Plant Cell
Elena Marin and Barry J. PogsonCarrie, Estelle Giraud, James Whelan, Pascale David, Hélène Javot, Charles Brearley, Rüdiger Hell, Gonzalo M. Estavillo, Peter A. Crisp, Wannarat Pornsiriwong, Markus Wirtz, Derek Collinge, Chris
ArabidopsisLight Signaling in Evidence for a SAL1-PAP Chloroplast Retrograde Pathway That Functions in Drought and High
This information is current as of May 14, 2018
Supplemental Data /content/suppl/2011/11/23/tpc.111.091033.DC2.html /content/suppl/2011/11/23/tpc.111.091033.DC1.html
References /content/23/11/3992.full.html#ref-list-1
This article cites 79 articles, 37 of which can be accessed free at:
Permissions https://www.copyright.com/ccc/openurl.do?sid=pd_hw1532298X&issn=1532298X&WT.mc_id=pd_hw1532298X
eTOCs http://www.plantcell.org/cgi/alerts/ctmain
Sign up for eTOCs at:
CiteTrack Alerts http://www.plantcell.org/cgi/alerts/ctmain
Sign up for CiteTrack Alerts at:
Subscription Information http://www.aspb.org/publications/subscriptions.cfm
is available at:Plant Physiology and The Plant CellSubscription Information for
ADVANCING THE SCIENCE OF PLANT BIOLOGY © American Society of Plant Biologists