evidence for a power law intensity code in the …
TRANSCRIPT

Vision Res. Vol. 30. No. 5, pp. 673482, 1990 0042-6989/90 s3.00 + 0.00
Printed in Great Britain. All rights mcrvcd cowriCt0199O~-pk
EVIDENCE FOR A POWER LAW INTENSITY CODE IN THE COUPLED CONES OF THE TURTLE
VINCENT PLUVINAGE and DANIFL G. GREEN*
From the Vision Research Laboratory, N~ttroscience Building, University of Michigan, 1103 E. Huron, Ann Arbor, MI 48109, U.S.A.
(Received 3 November 1988; in revisedfom 22 September 1989)
Abstract-The hyperpolariring responses to light were recorded intracellularly from red cones of the turtle, Pmys script0 elegum. Pairs of slit stimuli were gashed alone or together at various intensities, one slit positioned on the receptive field center and the other displaced 30 pm. The peak amplitude of the response was measured, and the results analyzed to quantify the relationship between the light intensity and the sine of the neural signal evoked prior to the spatial interactions occurring in the network of coupled cones. This signal, E, was found to be described by a compressive power law, E = R. IO.', where I is slit intensity. Evidence that the inferred excitation function describes a local me&an&m independent of the slit position was obtained by measuring the responss and the sensitivity receptive Beld pro&es. The response and the sensitivity fields both denma. expottentially, but with space constants that differed by a factor of two, indicating in still another way the existence of an early square-root transformation.
Retinal cone Phototransduction Photoreceptor
INTRODUCTION
Power law relationships which describe how visual experience varies with the magnitude of the physical stimulus (Stevens, 1970) have only occasionally been found to describe the relation- ship between the responses of retinal cells and stimulus intensity (Easter, 1968; Stone & Fabian, 1968; Grusser, 1971; Levine & Abramov, 1975; Enroth-Cugell & Harding, 1980). The physiological experiments which sug- gest power law relationships have three things in common: (a) they use a common methodology; and (b) they conclude that the exponential in the power law realtionship is about 0.5; and (c) they have been done on retinal ganglion cells. In this paper we show that the same methodology applied to turtle cones leads to the same conclu- sion (i.e. power law with 0.5 exponent). In a companion paper we show that the apparent square-root compress is due not to the relation- ship between stimulus intensity and the photo- voltage in a single cone but arises out of local saturation and recruitment of scattered light responses.
In turtle cones the hyperpolarixing responses depend on both the intensity and the spatial extent of the light stimuli. At least two
YTo whom cormspondancc should be addressed.
physiological mechanisms are involved: a local transduction mechanism and a coupling net- work mediating lateral interactions between cones. In addition, horizontal cells feed back onto cones, but their effects are noticeable only when large and bright stimuli are used and are negligible for the type of stimuli we report here (Baylor, Fuortes 8c O’Bryan, 1971; Baylor & Hodgkin, 1973; Baylor, Hodgkin & Lamb, 1974; Lamb & Simon, 1976).
In order to measure how cones in a coupled network respond to variations in stimulus inten- sity we have applied a technique called additive conjoint measurement (Debreu, 1959; Kruskal, 1965; Krantx, Lute, Suppes & Tversky, 1971; Krantz, 1973). The approach is similar in con- cept to the one used by Easter (1968) and others to study intensity coding at the ganglion cell level. When applied to cone response the tech- nique theoretically allows one to infer the local intensity coding which occurs prior to the spatial interactions between coupled cones. This local intensity coding, which we call excitu&~, is not easily measurable in an intact retina. Even when using a small stimulus focused on the impaled cell the intracellulrrly recorded hyperpolarizing response does not provide a direct measurement of the excitation signal since light always scatters to adjacent coupled recep- tors. Nonlinear-i&s such as voltage-dependent
673

674 VINCENT PLUVINAGE and DANIEL G. GREEN
conductances can also intervene between the excitation and the recorded voltage response. Excitation inferred by conjoint measurement describes the input-output relationship of a transduction process which depends solely on the local light intensity, and is independent of the light falling on other parts of the receptive field. Thus, the aim of this approach is to dissect the mechanisms occurring before the spatial interactions from those which affect the pooled signals.
The data analysis is based on the following paradigm. We assume that when two narrow slits of light are flashed at different positions in the cone receptive field a light transduction mechanism generates at each position a neural signal (excitation) which is independent of the signal at the other position. The intracellular hyperpolarizing response to light is assumed to be a unique monotonically increasing func- tion of the operationally defined excitation. For the moment the nature of the excitation will be left unspecified. It may help to think of excitation being the photocurrent generated in the cone outer segments, though as we show in the second paper it is not a photo- current. Because the cones are coupled, when two slits are flashed simultaneously the signals evoked by the two slits summate in the impaled cone. By adjusting the intensity of a slit, one can vary the amplitude of the response it evokes until it matches the response evoked by one or more other slits. When the responses are matched, equal amounts of excitation signal are assumed to have been produced in the impaled cell, even though the cones are stimu- lated differently.
By systematically varying the intensity of the slits and matching responses one can infer how transduction converts light intensity into excitation. As we will explain, it should be possible to make this inference even though other processes intervene in generating the measured voltage response (see Methods for details). The experiments presented here show that, in turtle cones, the inferred early trans- formation is well described over two log-units of intensity by a compressive power law:
E =k*I”;
where I is the light intensity, k is a constant, E is the operationally-defined excitation variable and the exponent ?n” is close to 0.5 (a “square root” law). This is consistent with the results obtained from ganglion cell studies (on goldfish:
Easter, 1968; Levine & Abramov, 1975; on cat: Stone & Fabian, 1968; Grusser, 1971; Enroth- Cugell & Harding, 1980).
Our finding that an early “square root” trans- formation occurs at the photoreceptor level is very surprising and would seem to be in conflict with the Michaelis-Menten relationship found in direct photocurrent measurements (Schnapf & McBumey, 1980) and full-field photovoltage measurements (Baylor & Hodgkin, 1973) per- formed on turtle cones. The purpose of this paper is to document this new finding. The physiological mechanisms which produce the “square root” transformation are examined in a second paper (Pluvinage & Green, 1990) where we show that our finding does not conflict with previous studies.
METHODS
Preparation
The experiments were performed on dark- adapted retinas of the red-eared turtle, Pseudemys scripta elegans. After decapitation, the eye was removed and hemisected along a frontal plane. The eye cup was placed in a recording chamber attached to a Ag/AgCl reference electrode with a drop of Ringer mixed with dissolved gelatin (5% w/v). The vitreous humor was drained away using little triangular pieces of tissue placed at the edge of the eye cup. A steady stream of moist oxygen was blown into the chamber.
Recording
The high impedance microelectrodes (200800 M42) were pulkd from glass capillary tubing on either a Livingston pulkr or a Sutter puller (Brown & Flaming, 1977) and filled with potassium acetate (2 M,
PH 7). To ensure that the light stimuli were in best
focus on the photoreceptor layer, the following procedure was used. The stimulus was foeused on the surface of the water contained in a reservoir on the cover of the experimental chamber. The microelectrode was lowered until it just touched the surface at the center of the stimulus. The depth counter of the m&i&d Kopf microdrive (Brown & Flaming, 1977) established the absolute position in space of the focal plane. The eyecup was then positioned so that the photoreceptors could be pen&rated within 25 pm above or below the focal plane.

Cone intensity coding 675
The signal was recorded on magnetic tape (frequency range d.c.-1200 Hz). After an experi- ment, the responses were digitized for later analysis.
Light stimulation
The light from a Xenon lamp (C&am 150 W) was split into two beams allowing two stimuli to be varied independently in intensity and position. After the two beams were combined with a prism, the stimuli were imaged on the retina by a Zeiss dissecting microscope (Copenhagen & Owen, 1976; Copenhagen & Green, 1985). Both the optical bench and the Faraday cage containing the microscope and the experimental chamber were mounted on an antivibration table (Newport Research Corporation).
Stimulus calibration
The optical density of the filters was measured in three ways with a calibrated photodiode (pin 10, United Technology, Inc.), a photomultiplier (American Instrument Co.), and a spectropho- tometer (Beckman). Interference filters (510 and 680 nm) were used to distinguish between red- and green-sensitive cells. The results reported here were obtained from red-sensitive cones using a 650 nm broad band (80 nm half band- width) filter. The unattenuated intensity with the broad band filter was equivalent to 1.44 - 10’ photons set-’ prnT2 at 650 nm (2.88 * lo5 pho- tons [20 msec flash]-’ prnS2). Light intensities in this paper are given in logarithmic attenuation of that value.
The distribution of light in the slit image was measured by positioning a 10 pm (dia.) pinhole aperture in the focal plane in front of the photomultiplier, and moving the slit across that aperture. The relative intensity of the photo- multiplier output for different slit positions is shown in Fig. 1. For comparisons, the calcu- lated convolution of a 5 pm wide slit with a 10 pm circle is displayed on the same plot. This function describes the magnitude of the photo- multiplier output for a diffraction-free, 5 pm wide slit moved across a 10 pm aperture (dashed line). A comparison of the measured intensity profile with the calculated function provides an estimate of the scattering. The light distribution was measured in planes 25 p above and below the focal plane. No significant blurring was found. Thus when the photoreceptors were penetrated within 25 pm of the focal plane a focused stimulus was flashed on the cones.
We should point out that in spite of these precautions the stimulus is degraded by intra- retinal scatter which is inherent to the eyecup preparation.
Experimental procedure
The microelectrode was advanced through the retina at a 45 deg angle to the vertical, in 4pm steps (nominal speed at each step: 200 pm/set) until a photoreceptor was impaled. The hyperpolarizing responses to 510 nm and 680 nm light stimuli were compared to distin- guish between middle (green) and long (red) wavelength cones. Only the responses from red- sensitive cones were analyzed.
Cones were distinguished from horizontal cells by their faster responses, larger depth of recording and smaller receptive fields (Baylor & Hodgkin, 1973). Red cones were easily distin- guished from rods by their higher sensitivity at 680 nm than at 510 nm. If a cell was identified as a cone, the receptive field space constant was measured. After the slit had been roughly centered (along two perpendicular directions) on the impaled cell, it was displaced laterally and flashed at several positions on each side of the receptive field center and the peak ampli- tudes of the evoked responses were measured. The fall-off of response amplitude with lateral displacement was adequately described by an exponential decay (A, the space constant, varied from 10 to 4Opm).
1.0
0.6
r” t 0.6
E
P 3 0.4
Ira
0.2
. 0
I 0
0 0 0 n al 0 01 II Pn_,
I -60 -40 -20 0 20 40 60
Fig. 1. Li@tt intensity diibution for the slit stimulus. ‘& slit was moved across a 10 pm pinbok placed in front of a photumultipikr. The diamonds indicate the amplitude of the photomuitiplii output at a series of slit pusitions. The da&d line indicates the thcoretkal photomultiplkr output for a per&f3 optical system (the convolution of a 5 firn wide
slit with a lOj4m circular aperture).
676 VINCENT PLUVINAGE and DANEL G. GREEN
In only six instances did the cone response remain stable (high, constant sensitivity and low noise) long enough to conduct the full set of measurements needed for the excitation analysis. Other measurements were obtained from an additional six cones and are presented in the last section of this paper.
RESULTS
The basis of the excitation analysis
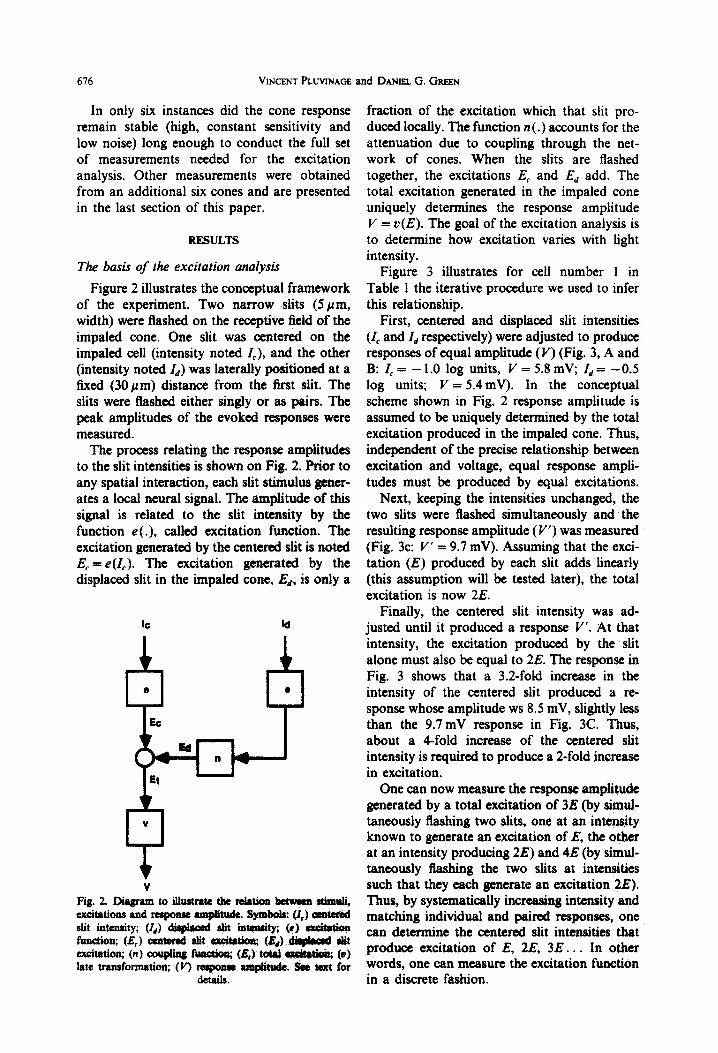
Figure 2 illustrates the conceptual framework of the experiment. Two narrow slits (Spm, width) were flashed on the receptive field of the impaled cone. One slit was centered on the impaled cell (intensity noted I,), and the other (intensity noted 1,) was laterally positioned at a fixed (30pm) distance from the first slit. The slits were flashed either singly or as pairs. The peak amplitudes of the evoked responses were measured.
The process relating the response amphtudes to the slit intensities is shown on Fig. 2. Prior to any spatial interaction, each slit stimulus gener- ates a local neural signal. The amplitude of this signal is related to the slit intensity by the function e(.), called excitation function. The excitation generated by the centered dit is noted EC = e(Z,). The excitation generated by the displaced slit in the impaled cone, Ed, is only a
b
V
Fig. 2. Diagram to illustrate tbc &tion bctwmtt stimuli, excitations and mpostm uaplittide. SyfAois: (JJ mtWu! slit itltmity; (I,) d&la& slit intaadty; (r) twwion funchn; (E,) centered slit wita* (E,) d&p&d alit excitation; (n) couplino fiJtl&o& (A&) toi @sskth& (0) late tranafommion; (V) reqmse atsphde. Se text for
details.
fraction of the excitation which that slit pro- duced locally. The function n( .) accounts for the attenuation due to coupling through the net- work of cones. When the slits are flashed together, the excitations EC and E,, add. The total excitation generated in the impaled cone uniquely determines the response amplitude V = v(E). The goal of the excitation analysis is to determine how excitation varies with light intensity.
Figure 3 illustrates for cell number 1 in Table 1 the iterative procedure we used to infer this relationship.
First, centered and displaced slit intensities (1, and 1, respectively) were adjusted to produce responses of equal amplitude (V) (Fig. 3, A and B: I,= - 1 .O log units, V = 5.8 mV; Id = -0.5 log units; V = 5.4mV). In the conceptual scheme shown in Fig. 2 response amplitude is assumed to be uniquely determined by the total excitation produced in the impaled cone. Thus, independent of the precise relationship between excitation and voltage, equal response ampli- tudes must be produced by equal excitations.
Next, keeping the intensities unchanged, the two slits were flashed simultaneously and the resulting response amplitude (V’) was measured (Fig. 3c: Y’ = 9.7 mV). Assuming that the exci- tation (E) produced by each slit adds linearly (this assumption will be tested later), the total excitation is now 2E.
Finally, the centered slit intensity was ad- justed until it produced a response Y’. At that intensity, the excitation produced by the slit alone must also be equal to 2E. The response in Fig. 3 shows that a 3.2-fold increase in the intensity of the centered slit produced a re- sponse whose amplitude ws 8.5 mV, slightly less than the 9.7 mV response in Fig. 3C. Thus, about a Cfold increase of the centered slit intensity is required to produce a 2-fold increase in excitation.
One can now measure the response amphtude generated by a total excitation of 3E (by simuI- taneously flashing two slits, one at an intensity known to generate an excitation of E, the other at an intensity producing 2E) and 4E (by simul- taneously flashing the two slits at intensities such that they each generate an excitation 2E). Thus, by systematically increasing intensity and matching individual and paired responses, one can determine the centered slit intensities that produce excitation of E, 2E, 3E. . . In other words, one can measure the excitation function in a discrete fashion.

Cone intensity coding 677
n Fig. 3. Slit responses from a cone to illustrate the procedure uwd to infer how excitation varies with light intensity. (A) Rcspoiwc to a centered slit, I, - -1.01ogunits.(B)Rqonsetoadisplaaddit,3O~maway from the reccptiw ikld center, I,- -0.5 log units. Note the response. is about equal to that in A. (C) The two stimuli “A and B” iIashcd tog&k so as to prod= an excitation of 2E. (D) Centered slit increased in intensity to approximately doubk excitation, I, = -0.5 log units @ame cell as in Table 1,
cdl no. 1).
Inferring the excitation function from the inten- sity-response curves
Adjusting intensities to match response amplitudes can be tedious and impractical given the short lifetime of the intracellular penetration. Instead we first measured inten- sity-response curves separately for the centered and the displaced slit (Fig. 4A). Next, both slits were flashed simultaneously. While the intensity of the centered slit was kept constant, the intensity of the other was systematically in- creased over the full intensity range. The process was then repeated, with the intensity of the centered slit fixed at another value, and so on until responses to a complete set of intensity pairs were obtained (Fig. 4A). During this pro- cess, the response to a 6xed-intensity center stimulus was periodically measured in order to ensure that the sensitivity of the cell had remained constant.
Response amplitudes for any combination of intensities were obtained from the intensity- response curves by linear interpolation between points. The first iteration of the procedure is illustrated by the dashed lines in Fig. 4. Since
the excitation variable is operationally defined, it is measured on an arbitrary scale. The data point marked “A” in Fig. 4A is arbitrarily chosen to define Z,, , , the centered slit intensity which evokes an excitation E = 1. (The sub- scripts indicate the slit position and the evoked excitation.) The corresponding response ampli- tude is V, = 1.6 mV. The intensity of the dis- placed slit Id, which evokes the same excitation E = 1 is determined by the intersection “B” of the constant amplitude passing through “A” and the linear interpolation line joining the displaced slit data points. From Fig. 4B, we can find “c”, the response amplitude V, to the pair of slits gashed at intensities I,,, = -2.0 and I dl = - 1.4 log units (for some other pairs of intensities an additional interpolation between two curves of constant centered slit intensity was required). This response amplitude corre- sponds to an excitation E = 2 and therefore, the intensity ZC,2 can now be obtained from Fig. 4A (point “D”). By following the same procedure iteratively, the intensities Z,, , I,, , Z,,, , . . . and I*, , Idq2, ld3, . . . producing E = 1, 2, 3 , . . . (respectively) were measured from the intensity-response curves.

678 VINCENT PLUVINAGE and DANEL G. GREEN
-3 -2.5 -2 45 -1 -03 0 -3 -2.3 -2 -1.5 -1 -0.5 0
Log SFt htensity Log Id
Fig. 4. (A) Response peak amptitudea for the centered and tbc displaced slit tlaslxd singly. (B) Raponr amplitude for the two tits hsbed aimultawwaly. The absch indicatap the displacwl siit intensity. Each setofdatacomesfrompriringa~~tofvarioMcrnttnsitywithafUredeentmd~toffixcd
intensity. See the text for an ~x~tion of the dashed tines (same all as in Fig. 3).
Thus the excitation function E - e(l,) was measumd for integer vahnzs of E. As seen in Fig. 5, when plotted on logarithmic coordinates, it is well &ted by a straight line over approx. 2 log units of intensity (slope = 0.45, relptssion CoefMent r* = 0.995). As ~bp~l in Table 1, other cells produced ahnost identical reaalhs. The range over which the excitation function was measumd varied from 1.5 to 2.0 log units of inter&y. Over that range, excitation is a compressive power law of the sIit intensity (average exponent: 0.48, n - 5):
t+ , I 1 f
-2 4.5
Logsiit-by
-0.5 0
Fig. 5. Excitation function obtthd from tlw cone in Figs 3 and 4 with slit stimuli. m 8bstku indicittaa the Wty Of~~~~~~~~~~~~~ excitation. TlIc solid dr&a wav hifwed From the &ta shown in Fig. 4. The straight line is a rqpqioa be littad to the discrete excitation v&es (slope - 0.18, r2 - 0.995) on
the logarithmic axes.
E =k*P5. (1)
To test whether this result was depe&ent on the shape of the stimulus, the +xperigaMlt was aioo conducted using two small spots (7jrm in dia.). The excitation function for these stimuli was also well fitted by a compressive power law (see Fig. 6).
Tesr of the hear aaliition of the excilatians
In order to compute the excitation function, the procedure presented above assumes that the excitations add linearly so that the total excitation produced by two slits Bashed sin&- taneously is simply the a&ebraic sum of the excitations they produce alone. It is test the vaiidity of this assumption. The -reason- ing goes as follows: when the intensity 1, and displaced slit individually produce a RI the excitation evok equal (say E, ). Likewise, if &’ and Ii produce a response of amplitude R2 the ach&m is assumed to be E2. Linear addition requires
Table 1. Summary of the cxcitation.anaiyat~, m @mans
cat no. 1* @m) .I- (pm) lqil m r2
I 27 2.0 0.45 %.pps
; E z 0%
t :: 0.5 z 4 29 :; ok &9 5 32 23 ::;: 0.46 096

Cone intensity coding 679
s11t IWnSlty log-lnlts
Fig. 6. Excitation function obtained from a cone by using two small spot (Spm dia.) stimuli. The stmight line was fitted to the inferred excitation points (0) (slope = 0.51,
regression r2 = 0.995).
equal responses from combinations of spatially separated stimuli having the same total exci- tation. That is, (E, + Ez) is the excitation from both (Z, + I,,‘) and (Z,l+ Z,,) and consequently these stimuli should produce responses of the same amplitude. This should be true, indepen- dent of the form of the transduction function. (The excitations resulting from the stimuli (Z, + I,‘) and (Z,, + Ii) would be (E, + E2) only if the transduction function itself were linear.)
Centered slit intensities and displaced slit intensities that produce the same excitation were obtained from data such as shown in Fig. 4A. Horizontal lines were drawn through the data points and the pair of intensities corresponding to the same excitation (since by construction the response amplitudes were equal) were formed. Linear interpolation was used when data points for the two stimuli did not correspond to equal response amplitude. Using Fig. 4B, we deter- mined the response amplitudes for the pairs of composite stimuli leading to the same excitation (again linear interpolation was used when neces- sary). For each composite excitation, we thus measured two response amplitudes, which according to the assumption of the excitation analysis, should be equal. We plotted one against the other and looked for deviation from a line of unit slope through origin. This analysis was performed on the data from 5 units. In each case, results similar to those in Fig. 7 were obtained. The deviations from the 45 deg line were small and thus support the excitation
Fig. 7. Test of linear addition of the excitations. Each point shows responsea from combitutions of intensities which produce the s8me total excitation. The m8pone amplitudes were measured from the intcnaity+eqonse ClUVC8ShOWllin
Fig. 4. The oldinatc axis cormaponds to m!J$Wnse ampli- tudes obtained when the displaced slit intensity was higher thanthatofthccentcredrlitandviccvcmaforthcabscissa axis. Linear addition rapires that equal reapon6a will be evoked by identical amounts of total excitation. Thus the extent to which the points fall on a 45 deg line is a
verification of the hypothesis of linear addition.
analysis. In four of the six cells analyxed, we noticed a slight bias of the data points toward the upper side of the 45 deg line. We do not know whether such a small bias is of any significance.
Response and sensitivity receptive jielth
From the excitation analysis, we concluded that the excitation generated locally by a small stimulus is proportional to the square root of its intensity. If the excitation function truly de- scribes a local mechanism, the results from the excitation anlaysis should be valid for other slit displacements. For small responses both u(.) and n(.) (not shown here; see Pluvinage & Green, 1990) are reasonably linear. The follow- ing approximation should then hold:
V(x) z k(x).Z”; (2)
where x is the distance between the slit and the center of the receptive field.
Equation (2) can be tested experimentally. The spatial weighting function k(x) is measured by flashing a slit of fixed intensity at several positions on the receptive field. Since the ampli- tude of the response decays exponentially with distance:
k(x) x e-lXl/i,;
where 1, is the response space constant.
(3)

680 VINCENT PLUVINAGE and DANIEL G. GREEN
-I cl00
0.0s ! 1 I I I I- -00 -40 SLITmA -20 0 40 60’
Fig. 8. Comparison between raponae and sensitivity tamp- tive field pro!% (ceil no. 9). (0) Raaponae amplitude to a fixed intensity slit (- 1.8 log units). The solid lines WUB fitted by regression (spaces constants: A,_ = 26pm. I = 28 pm). (m) ssnsitivity Ir#luunmartr(fi*cd~ &plitude: 3 mv). Sensitivity is d&tad to be the ratio of the threshold intensity (3 mV c&&m) to the fufl inter&y. ‘fire tines, fitted by mgmaaion, correqmnd to aenaitivity apace
constants of A,_ = 14.5 pm and A,+ 3: 15.5 pm.
Next, the intensity needed to produce a given response amplitude (fixed v) is measured at several positions. Adjusting the slit intensity to produce a given response amplitude V should lead to (using equations 2 and 3):
S(X) = l/Z(x) = V-‘lm.[k(x)]“m a e-~x~~(ms); (4)
where S(x) is the sensitivity and Z(x) is the intensity needed at position x to evoke a criterion response amplitude V. Thus A,, the space constant for the fall-off in sensitivity, and the response space constant should be related by:
I, = 1; m. (9
Figure 8 presents typical results from a cone on which the receptive &old pro&e was obtained by measuring V(x) and S(x) at several sht positions. The response receptive field p&k [V(x), .] was fitted by exponential decays with the space constants ,I,- P 26pm for negative displacements and I,, = 28 pm for positive sIit displacements (the inverse of t4e shp’ rqp sion lines). The sensitivity recoptiv6 iMd pro& P(x), ml also decays wtpontntielfy, but the space constants are A,- = 14.5 pm and A,+ = 15.5 pm. The average ratio, &/A,, of the sensitivity to response space constant on eaoh side of the receptive field center is 054.
Table 2 gives the response and sensitivity space constants measured on six c&s. Thus, for
Table 2. Comparison between response and sensitivity space constants from the receptive fields of six cells. The superscripts “ - ” and “ + ” indicate the side of the receptive field (negative or positive displacements respectivdy). The subscripts “r” and “s” relate to response and sensitivity measurements respectively. The entries in the last cohunn are the averages of the ratios A,/%, for each side of the
receptive field
Cell no. I.; A: I; 1: W,
1 27 34 15 18 0.55 6 18
:: 12 14 0.64
7 25 14 13 0.58 8 36 26 19 13 0.52 9 26 28 14 15 0.54
10 29 33 17 15 0.52
the cell in Fig. 8 and five others sensitivity decreases with slit displacement twice as fast as the response to a fixed intensity slit, a result consistent with an early square-root transfor- mation. One cell (not shown in Table 2) had a very steep receptive f&l, which was not adequately fitted by exponential fall-off, and the response and sensitivity receptive fields were similar. The results for this cell are presented and analyxed in detail in the second paper (Pluvinage & Green, 1990).
DISCUSSION
The experiments presented here give support to the notion that a square root transformption occurs at the photoreceptor level. How can this occur given that previous studies have shown that both photocurrent and full-6dd photo- voltage are Michaeh*Menten functions of tight intensity? One possibility is that one of the assumptions underlying the excitation anaiysis is incorrect. These assumptions are: (1) the inferred excitation function describes mech- anisms before the spatial integration of the excitatory signals; (2) the slits stimulate inde- pendent sets of receptors; (3) the excitatory signals add linearly; (4) the responses are adequateiy charactcrizod by their peak ampli- tude.Letusexamineeachofthemin&tail.
To satisfy assumption (1) small spots might seem to be the best stimuli, but we usu&y used long narrow slits. Each slit must actually stimu- late a row of photoreceptors. Could the square root transformation we inferred result from the integration of the signals produced along the slit? Results from previous studies (Lamb & Simon, 1976) are consistent with the notion that, with a slit stimulus, there is no gradient i-n the longitudinal direction. That is, a slit “iso- lates” the effect of coupling along the direction

Cone intensity coding 681
perpendicular to the slit, which allows us to measure the local transformation prior to the spatial integration of signals. Direct evidence of that point comes from the excitation analysis conducted using two small spots of light. As shown in Fig. 6, a square root function also describes the small spot data, a result consistent with the assumption that we are probing a transduction mechanism prior to the spatial integration of excitatory signal.
One of the basic assumptions of the excitation analysis, as illustrated in Fig. 2, is that the slits act on independent sets of photoreceptors. What about light scatter? If the peripheral slit acted solely through scattered light then the procedure used to infer the excitation function should always lead to the conclusion that exci-
1 120
i! 100 0
c 60 v v
49
% 60
lie J lb 15 - it
0
0 0 5 10 15 20
Fig. 9. (A) The rrletionship between response time-to-peak and the peak amplitude is indicated for stimuli of ditkent intensities and positions for one cone: (0) full-tIcid; slit, (A) position +23gm; (0) position +IOpm; (0) position - 5 j4m; (V) position - 17 pm. (B) The reM.kmship be twecn the initial slope and the peak amplitude is indicated
for various stimuli for the same cone.
tation grows linearly with light intensity. This is because: (a) equating the responses to slits should equate the quantum catch in the impaled cone; (b) flashing the two slits simultaneously should result in a linear addition of the light intensities prior to the transduction function; and (c) the response produced by equated slits flashed as a pair should be matched by flashing either slit at twice the intensity. Thus, whenever one infers a highly nonlinear transduction func- tion as we do the two slits must to a large degree be acting independently. Further evidence against scatter comes from the excitation experi- ments. The total excitation due to two slits would not be equal to the sum of the individual excitations unless the transduction function was also linear, an unlikely possibility over the wide range of intensities we tested. Thus the test for linear addition (Fig. 7) should have failed and it did not. On the basis of the linear addition shown in Fig. 7 one can conclude that the images of 30flm separated slit stimuli are largely nonoverlapping. Any overlap must be so slight that it is insufIicient to lead to a clear failure of the excitation addition test.
For the simplicity of our analysis the responses were characterized using a single parameter, the peak amplitude. However, the dynamics of the response depends on both the position and the intensity of the stimulus. Could neglecting this be the problem? Figures 9A and B show data obtained in an attempt to address this issue. To a reasonable approximation, inde- pendent of the stimulus sixe, position or inten- sity, responses of similar amplitude have similar time-to-peak and initial slope. Thus, when the peak amplitude of two responses are equal, the early part of the responses (up to the peak) should also coincide. But when two slits that evoke very different response amplitudes are flashed simultaneously, the excitatory signals from each slit are likely to peak at different times, a complexity not included in our analysis. Moreover, responses to intense stimuli typically exhibit a “plateau” after the peak which is absent from weak responses. Nonetheless, the inferred power law excitation function correctly predicted that, with slits, the sensitivity and the response receptive field would decay exponentially with space constants in a ratio 1:2.
In this regard it should be noted that there were small but consistent discrepancies between the data and the predictions of equations (2-5). For example, the excitation analysis inferred an

682 VINCENT PLWINAGE and DA-L G. GREEN
average power law exponent of m = 0.51 but the average ratio of sensitivity to response space constant is &/A, = 0.56. This probably repre- sents more than experimental error since on cell no. 1 (the only cell on which both experiments were conducted) there was a similar difference (m = 0.45, &/A, = 0.55). This second order etibct is examined by the model presented in the paper which follows (Pluvinage & Green, 1990).
What about the apparent conflict between Mi~haeli~Menten relations~ps and the in- ferred square root law? Suction electrode photo- current measurements predominantly reflect the properties of a single cell (Baylor, Lamb & Yau, 1979). Full-field stimuli should functionally un- couple the impaled cone from its neighbors since no current flows between identically responding cones. Thus, in both cases, the physiological responses are measured in absence of interrecep tor coupling. On the other hand, in our experi- ments with slit and spot stimuli cone coupling significantly affects response amplitudes. In Pluvinage and Green (1990) experimental evi- dence is presented which shows that the square root law depends on coupling between cones and that it arises because of local saturation and recruitment of scattered light responses.
Acknowk&menrs--This study was supported by NIH grant EYO0379. The authors are indebted to David Rrantz and Stephen Easter for helpful discussion6 and to Marilyn @over for her assistance in the analysis of data and in the preparation of the manuscript.
REFERENCES
Baylor, D. A. Br Hodgkin, A. L. (1973). Deter&n and resolution of visual 6timuli by turtle photoreceptors. Journal of Physiology, London, 234, 163-198.
Baylor, D. A., Fuortes, M 0. F. & O’Bryan, P. M. (1971). Receptive fitlds of cones in the retina of the turtle. Journaf of Physi&gy, London, 214, 265-294.
Baylor, D. A., Hodgkin, A. L. Br Lamb, T. D. (1974). Ihe ckfkd mponsc of turtle cones to Baahea and steps of light. Joumal of Physiolugy, London, 242, M-727.
Baylor, D. A., Lamb, T. D. & Yau. K.-W. (1979). The membrane cmrent of single rod outer semgents. Journal of Physiology, Lone&i, 2&?, 589611.
Brown, K. T. & Flaming, D. G. (1977). New microeiectrode techniques for intracellular work in small cells. Npuro- science, 2, 813-827.
Copenhagen, D. R. & Green, D. G. (1985). The absence of spread of adaptation between rod photoreceptors in turtle retina. Joumd of Physiology, London, 369, 161-181.
Copenhagen, D. R. Br Gwen, W. G. (1976). Functional characteristics of lateral &cmctions between rod6 in the retina of the snapping turtle. Journul of Ph,vsiology, London, 259, 251-282.
Debreu, G. (1959). “Topological methods in cardinal utility theory.” In Arrow, K. J., Karliu, S. & Suppes, P. @ds.), ~~r~~ar~~ methoak in the social sciences. Stanford, C. A.: Stanford University press.
Baster, S. S. (1968). Excitation in the goldfish retina evidence: for a non-linear intensity code. Joumal of Physiology, London, 195, 253-27 1.
Enroth-Cugell, C. 8t Harding, T. H. (1980). S~tion of rod signals within the receptive 8eld centre of cat tetinal ganglion cells. Journal of Physiology, London, 29& 235-250.
Grusser, 0. J. (1971). A quantitative analysis of spatial summation of excitation and inhibition within the recep- tive field of retinal ganglion cells of oats. Vision Research, 3, 103-127.
Krantz, D. H. (1973). Measutement-free tests of linearity in biological systems. IEEE Trunsactiom on Systems, Mm & Cybernetics, 3, 266-27 1,
Krantx, D. H., Lute, R. D., Suppes, P. & Tversky, A. (1971). In ~o~t~~ of metsswemeat (Vol. 1). London: Academic Press.
Kruskal, J. B. (l%S). Analysis of factorial sxp&nents by estimating monotone transformations of the data. Journal of the Roya/ Statistics Society (Series B), 27, 251-263.
Lamb, T. 0. 8 Simon, E. 3. (1976). The relation between intercellular coupling and electrical noise in turtle photo- receptors. Journal of Physidogy, London, 263, 257-286.
Levine, M. W. & Abramov, 1. A. (1975). An analysis of spatial summation in the receptive 8elds of gold&h retinal ganglion ails. Vision Research, 15, 777-789.
Pluvinage, V. 8c Green, D. G. (1990). Square root intensity coding in turtle cones: Physiological me&a&ns. Yijion Research, 30, 683-691.
Schnapf, J. L. & McBumey, R. N. (1980). Light-induced changes in membrane current in cone outer mgmenta of tiger salamander and turtle. Nature, Z.m&n, 287, 239-241.
Stevens, S. S. (1970). Neural events and the psychophysical law. Science, New York, 170, 1043-1050.
Stone, J. & Fabian, M. (1968). Summing properties of the cat’s retinal ganglion all Vision Remarch, S. 1023-1040.