every student succeeds act (essa) maryland ... - eoc.sc.gov for educators/focus on...
TRANSCRIPT

South Carolina School Accountability Overview: Merging Act 94 and Every Student Succeeds Act (ESSA) to create a single
accountability system for South Carolina
REVISED BASED ON FULL EOC DECISIONS APPROVED ON 12/11/2017
ESSA

TRANSFORMATIONAL GOALS & THE NEED FOR TRANSFORMATION
2
Act 94 and ESSA SC Draft Plan
Goals
Revised based on EOC decisions approved on December 11, 2017

EOC Transformational Goals
By 2035, on-time graduation rate of state, each district and each high school should be at least 90%.
Beginning with graduating class of 2020, state must increase annually by 5% the percentage of students who graduate ready to enter postsecondary education to pursue a degree or national industry credential without the need for remediation.
3
Act 94 and ESSA SC Draft Plan
Revised based on EOC decisions approved on December 11, 2017

ESSA Goals in SC State PlanESSA requires states to set a long-term goal for academic achievement, graduation rate, and progress toward English language proficiency that is the same for all schools. ESSA also requiresstates to set annual measurements of interim progress to ensure that all students and studentgroups, where applicable, are making progress toward attaining these long-term goals.
4
Act 94 and ESSA SC Draft Plan
By 2035, 90 percent of students will score at Level 2 or higher (Approaches and above on SC READY) and a D or higher on end-of-course assessments) in English language arts and mathematics.
By 2035, 70 percent of students will score at Level 3 or higher (Meets and above on SC READY and a C or higher on end-of-course assessments) in English language arts and mathematics. ESSA Plan submitted to Governor McMaster August 4, 2017
Revised based on EOC decisions approved on December 11, 2017

ESSA Goals in SC State PlanESSA requires states to set a long-term goal for academic achievement, graduation rate, and progress toward English language proficiency that is the same for all schools. ESSA also requiresstates to set annual measurements of interim progress to ensure that all students and studentgroups, where applicable, are making progress toward attaining these long-term goals.
Act 94 and ESSA SC Draft Plan
By 2035, 90 percent of students will graduate “college, career, and citizenship ready.” Goal One in ESSA Plan submitted to Governor McMaster August 4, 2017
Revised based on EOC decisions approved on December 11, 2017

OverviewRequired Indicators Definition of Measures
ACCOUNTABILITY
6
Act 94 and ESSA SC Draft Plan
Revised based on EOC decisions approved on December 11, 2017

ESSA requires states to use a set of indicators to measure the performance of all schools. The academic progress, progress towards English language proficiency, and school quality/student success indicators are all newunder ESSA.
• Academic Achievement
• Academic Progress
• English Language Proficiency
• School Quality/Student Success
HighSchoolElementarySchool
Middle School
ALL ACCOUNTABILITY MEASURES MUST:
• Be supported by research showing that performance and/or progress are likely to increase• Allow for meaningful differentiation of schools• Be disaggregated by student group• Be valid and reliable across all schools
ESSA School Accountability: Required Indicators
• Academic Achievement
• Academic Progress
• English Language Proficiency
• School Quality/Student Success
• Academic Achievement
• Graduation Rate
• English Language Proficiency
• School Quality/Student Success
Act 94 and ESSA SC Draft Plan
Revised based on EOC decisions approved on December 11, 2017

8
Rating for Schools Defined in state law
Excellent – School performance substantially exceeds the criteria to ensure all students meet the Profile of the South Carolina Graduate;
Good – School performance exceeds the criteria to ensure all students meet the Profile of the South Carolina Graduate;
Average – School performance meets the criteria to ensure all students meet the Profile of the South Carolina Graduate;
Below Average – School performance is in jeopardy of not meeting the criteriato ensure all students meet the Profile of the South Carolina Graduate; and
Unsatisfactory – School performance fails to meet the criteria to ensure all students meet the Profile of the South Carolina Graduate.
Act 94 and ESSA SC Draft Plan
Revised based on EOC decisions approved on December 11, 2017

ELEMENTARY SCHOOLSwith 20 or more English Language Learners
FRAMEWORK OF INDICATORS
9
Act 94 and ESSA SC Draft Plan
80% 20%
EnglishLanguageAcademicAchievement AcademicProgress Proficiency
35% Performance Composite 17.5% Growth in English 10% Progress in Achieving for English Language Language Arts and EnglishLanguage Arts and Math Math among all students Proficiency targets
17.5% Growth in English Language Arts and Math among lowest performing 20% of students in a school
School Quality/Student Success
10% Preparing for Success (Science/Social Studies)
10% Student Survey measuring learning environment
Revised based on EOC decisions approved on December 11, 2017

ELEMENTARY SCHOOLSwith fewer than 20 English Language Learners
FRAMEWORK OF INDICATORS
Act 94 and ESSA SC Draft Plan
80% 20%
AcademicAchievement AcademicProgress
40% Performance Composite 20% Growth in English 10% Progress in Achieving for English Language Language Arts and EnglishLanguage Arts and Math Math among all students Proficiency
20% Growth in English Language Arts and Math among lowest performing 20% of students in a school
School Quality/Student Success
10% Preparing for Success (Science and Social Studies)
10% Student Survey measuring learning environment
Revised based on EOC decisions approved on December 11, 2017

MIDDLE SCHOOLSwith 20 or more English Language Learners
FRAMEWORK OF INDICATORS
Act 94 and ESSA SC Draft Plan
80% 20%
EnglishLanguageAcademicAchievement AcademicProgress Proficiency
35% Performance Composite 17.5% Growth in English 10% Progress in Achieving for English Language Language Arts and EnglishLanguage Arts and Math Math among all students Proficiency targets
17.5% Growth in English Language Arts and Math among lowest performing 20% of students in a school
School Quality/Student Success
10% Preparing for Success (Science and Social Studies)
10% Student Survey measuring learning environment
Revised based on EOC decisions approved on December 11, 2017

MIDDLE SCHOOLSwith fewer than 20 English Language Learners
FRAMEWORK OF INDICATORS
Act 94 and ESSA SC Draft Plan
80% 20%
AcademicAchievement AcademicProgress
40% Performance Composite 20% Growth in English 10% Progress in Achieving for English Language Language Arts and EnglishLanguage Arts and Math Math among all students Proficiency
20% Growth in English Language Arts and Math among lowest performing 20% of students in a school
School Quality/Student Success
10% Preparing for Success (Science and Social Studies)
10% Student Survey measuring learning environment
Revised based on EOC decisions approved on December 11, 2017

60% 40%
AcademicAchievement
25% PerformanceComposite for English LanguageArts and Math
GraduationRate
25% AdjustedCohortGraduation Rate Composite
English Language Proficiency
College/Career ReadinessIndicator
Student Survey measuring learning environment
Preparing for Success: Science and Social Studies
Act 94 and ESSA SC Draft Plan
HIGH SCHOOLSwith 20 or more English Language Learners
FRAMEWORK OF INDICATORS
10%
School Quality / Student Success
Progress in AchievingEnglish Language Proficiency 5%
25%
10%
Revised based on EOC decisions approved on December 11, 2017

60% 40%
AcademicAchievement
30% PerformanceComposite for English LanguageArts and Math
GraduationRate
30% AdjustedCohortGraduation Rate Composite
English Language Proficiency
College/Career Readiness IndicatorIndicator
Student Survey measuring learning environment
Preparing for Success: Science & Social Studies
Act 94 and ESSA SC Draft Plan
HIGH SCHOOLSwith fewer than 20 English Language Learners
FRAMEWORK OF INDICATORS
10%
School Quality / Student Success
Progress in AchievingEnglish Language Proficiency 5%
25%
10%
Revised based on EOC decisions approved on December 11, 2017

Definitions of Measures for each Indicator
Act 94 and ESSA SC Draft Plan
Revised based on EOC decisions approved on December 11, 2017

Definition of Measures: Academic AchievementBelow are the definitions of AcademicAchievement measures for Elementary and Middle Schools
Measures:
Points are achieved based on converting student assessment results on SCReady and SC-ALT in only English Language Arts and Mathematics. Test score to points conversion is as follows:
ELEMENTARYSCHOOL MIDDLESCHOOLAcademic
Achievement
Performance Composite for English Language Arts (ELA) andMathematics
Points
35
16 ESSA
40
with ELP
without ELP
Points SCReady Level SC-ALT Level
0 Does Not Meet Expectations Emerging
1 Approaches Expectations Foundational
2 Meets Expectations Increasing
3 Exceeds Expectations Applied
This measure focuses on the performance of all students, not just students who are lower performing. The performance index givesschools partial credit for getting students to the “Approaches” category.
Act 94 and ESSA SC Draft Plan
Revised based on EOC decisions approved on December 11, 2017

SC READY Performance Level Definitions
ESSA
Act 94 and ESSA SC Draft Plan
Performance Level Definition
Exceeds Expectations The student exceeds expectations as defined by the grade-level content standards
Meets Expectations The student meets expectationsas defined by the grade-level content standards
Approaches Expectations The student approaches expectations as defined by the grade-level content standards
Does Not Meet Expectations
The student does not meet expectations as defined by the grade-level content standards
Revised based on EOC decisions approved on December 11, 2017

Rating Target % for Simulations
Excellent 10%Good 15%
Average 40%Below Average 25%Unsatisfactory 10%
Academic Achievement IndicatorElementary and Middle Schools
ESSA
Act 94 and ESSA SC Draft Plan
Target % for Simulations
Revised based on EOC decisions approved on December 11, 2017

61.3
%
44.3
%
30.3
%
17.3
%
9.2%
88.6
%
77.5
%
66.0
%
50.9
%
36.6
%
0%
10%
20%
30%
40%
50%
60%
70%
80%
90%
100%
Excellent Good Average Below Average Unsatisfactory
Avg. Percent of Students in Schools scoring Meets or Above
Avg. Percent of Students in Schools scoring Approaches and Above
What does student performance look like using the Target % for the Ratings in the Academic Achievement Indicator?
*Based on 2016-17 SC READY data (ELA and Math) for Elementary and Middle Schools
ESSA
Act 94 and ESSA SC Draft Plan
The SC READY test items are aligned to the standards for each subject and grade level. Standards specify what schools are expected to teach and what students are expected to learn. Educators established cut scores for SC READY based on grade level expectations.
Revised based on EOC decisions approved on December 11, 2017

Definition of Measures: Academic AchievementBelow are the definitions of AcademicAchievement measures for High Schools
Measures:
Points are achieved based on converting student assessment results on End-of-Course assessments in English I and Algebra I.
Test score to points conversion are in the table.
HIGH SCHOOLAcademic
Achievement
Performance Composite for English Language Arts (ELA) andMathematics
Points
25
ESSA
30
with ELP
without ELP
Points End-of-Course Scores
0 F
1 D
2 C
3 B
4 A
This measure focuses on the performance of all students, not just students who are lower performing.
Act 94 and ESSA SC Draft Plan
Revised based on EOC decisions approved on December 11, 2017

Rating Target % for Simulations
Excellent 10%Good 15%
Average 40%Below Average 25%Unsatisfactory 10%
Academic Achievement IndicatorHigh Schools
ESSA
Act 94 and ESSA SC Draft Plan
Target % for Simulations
Revised based on EOC decisions approved on December 11, 2017

80.5
%
61.7
%
47.2
%
30.0
%
14.9
%
93.5
%
83.4
%
73.7
%
59.3
%
39.4
%
0%
10%
20%
30%
40%
50%
60%
70%
80%
90%
100%
Excellent Good Average Below Average Unsatisfactory
Avg. Percent of Students in Schools scoring "C" or higher on both EOCs
Avg. Percent of Students in Schools scoring "D" or higher on both EOCs
What does student performance look like using the Target % for the Ratings in the Academic Achievement Indicator?
*Based on 2015-16 End-of-Course (EOC) data for Algebra I and English I in High Schools
ESSA
Act 94 and ESSA SC Draft Plan
• “A”: The student exceeds the expectations of the course content standards
• “B” and “C”: The student meets the expectations of the course content standards
• “D”: The student minimally meets the expectations of the course content standards
• “F”: The student does not meet the expectations of the course content standards
Performance Level Descriptors for Algebra I and English I adopted following the Revised SC Uniform Grading Scale (2016)
Revised based on EOC decisions approved on December 11, 2017

Definition of Measures: Academic ProgressBelow are the definitions of Student Progress or Growth measures for Elementary and Middle Schools
Measures:
Half of the Academic Progress Indicator will measure the academic progress in English Language Arts and Mathematics made by ALL students in a school statewide who initially scored at the same level.
Weighted equally in this indicator is the academic progress of the lowest performing 20 percent of students in a school taking relative to students statewide who initially scored at the same level.
ELEMENTARYSCHOOL MIDDLESCHOOLAcademic Progress
Calculation of the academic growth of all students in a school in ELA and math as well as the growth of the lowest 20 percent of students in each elementary and middle school.
Points
35
40
with ELP
without ELP
Unlike measures of achievement, academic growth measures quantify changes in achievement over time, and they are less correlated with poverty. Per Act 94 of 2017, student progress or academic growth must be measured using a value-added system. Half of the points will measure the academic growth of all students in a school, which is an indicator of the impact of instruction relative to all students across the state. The other half of the points will look at the academic growth of just the lowest performing students (lowest 20%) in a school relative to their academic peers in the state who score at the same level initially.
Act 94 and ESSA SC Draft Plan
Revised based on EOC decisions approved on December 11, 2017

Academic Progress Indicator (Growth)Target percentages for simulations: Elementary and Middle Schools
ESSA
Rating Targets % for Simulations
Excellent 15%Good 20%
Average 35%Below Average 20%Unsatisfactory 10%
Act 94 and ESSA SC Draft Plan
Will use value-added growth index of each school for all students and value-added growth index for lowest performing 20%. New progress
indices will be created by adding 17.5 points to each.
Slide updated 10/3/2017
Revised based on EOC decisions approved on December 11, 2017

10.9
%
18.2
% 27.2
%
20.8
%
22.9
%
20.0
%
20.0
%
20.0
%
20.0
%
20.0
%
0%
10%
20%
30%
40%
50%
60%
70%
80%
90%
100%
Excellent Good Average Below Average Unsatisfactory
Avg. Percent of Schools by Growth Rating, 2002-2014
Avg. Percent of Schools by Rating Using Quintiles
Historical Growth Ratings vs. Quintiles Approach
ESSA
Act 94 and ESSA SC Draft Plan
Revised based on EOC decisions approved on December 11, 2017

Definition of Measure:English Language ProficiencyBelow is the definition of the English Language Proficiency measure for Elementary,
Middle, and High Schools
ELEMENTARYSCHOOL MIDDLESCHOOL HIGHSCHOOLPoints
ESSA
EnglishLanguage Proficiency
Progress in Achieving English Language Proficiency 10%
Measures:
Percent of English learner students progress toward proficiency on the ACCESS for ELLs 2.0 summativeassessment. Proficiency is defined as achieving an ACCESS score of 4.4.
Act 94 and ESSA SC Draft Plan
Revised based on EOC decisions approved on December 11, 2017

English Language Proficiency Simulations Elementary, Middle, and High Schools
Points
Act 94 and ESSA SC Draft Plan
% Schools
Rating % Students Meeting ELP Proficiency
Targets
Elementary Schools
Middle Schools
High Schools
Excellent 80 to 100% 66.4 4.0 8.8
Good 70 to 79% 24.2 18.4 29.7
Average 60 to 69% 7.4 29.6 35.2
Below Average 50 to 59% 1.6 23.2 15.4
Unsatisfactory Less than 50% 0.4 24.8 11.0
Revised based on EOC decisions approved on December 11, 2017

Definition of Measure:School QualityBelow is the definition of the School Quality measure for
Elementary, Middle, and High Schools
Act 94 and ESSA SC Draft Plan
Measure:
The survey of student engagement is currently being procured by the SC Dept. of Education.
School Quality
Student Climate Study:Elementary and Middle Schools
Points
10
5
Student Climate Study:High Schools
Measure:
The survey of student engagement is currently being procured by the SC Dept. of Education.
Revised based on EOC decisions approved on December 11, 2017

School Quality Indicator (Student Survey) Target Simulations Elementary, Middle, and High Schools
Points
Act 94 and ESSA SC Draft Plan
Rating Percentile Elementary and Middle
(Points out of 10)
High Schools(Points out of 5.0)
Excellent Above 95th 10 5.0
90th to 95th 9 4.5
Good 80th 8 4.0
70th 7 3.5
Average 60th 6 3.0
50th 5 2.5
Below Average 40th 4 2.0
30th 3 1.5
Unsatisfactory 20th 2 1
10th 1 .5
Revised based on EOC decisions approved on December 11, 2017
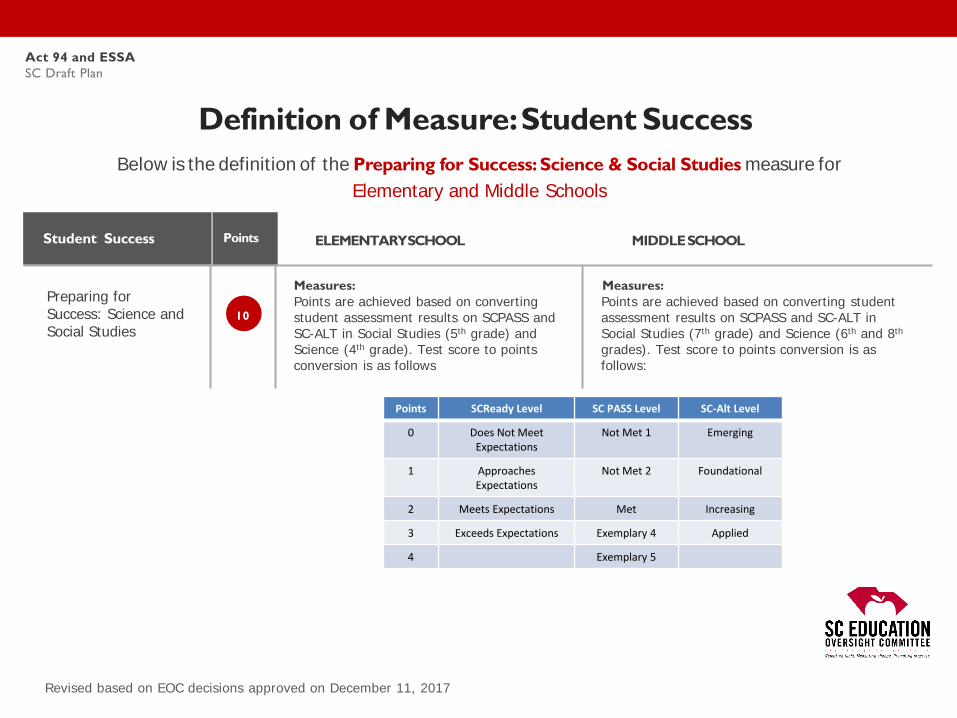
Definition of Measure:Student SuccessBelow is the definition of the Preparing for Success: Science & Social Studies measure for
Elementary and Middle Schools
Student Success ELEMENTARYSCHOOL MIDDLESCHOOLPoints
Preparing for Success: Science and Social Studies
Measures:Points are achieved based on converting student assessment results on SCPASS and SC-ALT in Social Studies (5th grade) and Science (4th grade). Test score to points conversion is as follows
Measures:Points are achieved based on converting student assessment results on SCPASS and SC-ALT in Social Studies (7th grade) and Science (6th and 8th
grades). Test score to points conversion is as follows:
10
Points SCReady Level SC PASS Level SC-Alt Level
0 Does Not Meet Expectations
Not Met 1 Emerging
1 Approaches Expectations
Not Met 2 Foundational
2 Meets Expectations Met Increasing
3 Exceeds Expectations Exemplary 4 Applied
4 Exemplary 5
Act 94 and ESSA SC Draft Plan
Revised based on EOC decisions approved on December 11, 2017

Preparing for Success: Science & Social Studies IndicatorElementary and Middle Schools
Points
ESSA
Rating Target % for Simulations
Excellent 10%Good 15%
Average 40%Below Average 25%Unsatisfactory 10%
Act 94 and ESSA SC Draft Plan
Target % for Simulations
Revised based on EOC decisions approved on December 11, 2017

Percent of Elementary and Middle schools in each Ratings category based on 2015-16 SC PASS Scores in Social Studies and Science
Points
ESSA
Act 94 and ESSA SC Draft Plan
10.1
%
15.0
%
40.0
%
24.9
%
9.9%
0%
10%
20%
30%
40%
50%
60%
70%
80%
90%
100%
Excellent Good Average Below Average Unsatisfactory
Percent of schools receiving rating based on proposed targets
Revised based on EOC decisions approved on December 11, 2017

College/Career Readiness Indicator
Measures:Percent of students graduating receiving anyof the following:
College Readiness Measures
• Scores a composite score of 20 or higher on the ACT composite;
• Scores a composite score of 1020 or higher on the SAT composite;
• Scores a 3 or higher on an Advanced Placement (AP) exam;
• Scores a 4 or higher on an International Baccalaureate (IB) assessment; or
• Completes at least six (6) credit hours in dual enrollment course.
Career Readiness Measures
• Is a CATE completer and, earns a national or state industry credential as determined by the business community; or
• Earns a Silver, Gold or Platinum National Career Readiness Certificate on the WorkKeys exam (or comparable levels on another career readiness test); or
• Earns a scale score of 31 or higher on the ASVAB; or
• Completes a state-approved work-based learning experience.
Definition of Measure:Student SuccessBelow is the definition of the Student Success: College/Career Readiness measure for
High Schools
SchoolQuality/Student Success HIGHSCHOOLPoints
25
Act 94 and ESSA SC Draft Plan
Revised based on EOC decisions approved on December 11, 2017

Results of Simulations using ONLY ACT and WorkKeys for 2016 Graduating Cohort
Act 94 and ESSA SC Draft Plan
Rating % of High School Graduates who are
college or career ready
Number of High Schools (based on
simulations using ONLY ACT and WorkKeys for
2016 Graduating Cohort
% of High Schools
Excellent 80% or greater 27 12%
Good 70.0% to 79.9% 49 23%
Average 60.0% to 69.9% 60 28%
Below Average 50.0% to 59.9% 35 16%
Unsatisfactory Less than 50.0% 46 21%
Not included: SAT scores, Advanced Placement scores, International Baccalaureate, industry credentials, dual enrollment/dual credit, nationally-recognized apprenticeships and ASVAB.
Revised based on EOC decisions approved on December 11, 2017

Definition of Measure:Student SuccessBelow is the definition of the Preparing for Success: Science and Social Studies measure for
High Schools
Student Success HIGH SCHOOLS Points
Preparing for Success: Science and Social Studies
Measures:Points are achieved based on converting student assessment results on the Biology End-of-Course assessment and the U.S. History and Constitution End-of-Course assessments taken in high school. Test score to points conversion is as follows
10
Points End-of-Course Grade
0 F
1 D
2 C
3 B
4 A
Act 94 and ESSA SC Draft Plan
Revised based on EOC decisions approved on December 11, 2017

Student Success: Preparing for Success: Science/Social Studies Indicator
High Schools
Points
ESSA
Rating Target % for Simulations
Excellent 10%Good 15%
Average 40%Below Average 25%Unsatisfactory 10%
Act 94 and ESSA SC Draft Plan
Target % for Simulations
Revised based on EOC decisions approved on December 11, 2017

Percent of High schools in each Ratings category based on 2015-16 End-of-Course Test Results in English I and Algebra I
Points
ESSA
Act 94 and ESSA SC Draft Plan
9.5%
15.5
%
39.2
%
24.6
%
11.2
%
0%
10%
20%
30%
40%
50%
60%
70%
80%
90%
100%
Excellent Good Average Below Average Unsatisfactory
Percent of schools receiving rating based on proposed targets
Revised based on EOC decisions approved on December 11, 2017

Definition of Measures:Graduation RateBelow are the definitions of Graduation Rate measures for High School.
HIGHSCHOOLGraduation Rate Points
with ELP
withoutELP
Adjusted CohortGraduation RateComposite
Measure:
Four-year adjusted cohort graduation rate:Percent ofaschool’scohort of first-time 9th grade students in a particular school year, adjusted for studentswho transfer in or out of the cohort after 9th grade, who graduate within four years. Graduates transferringto adult education are counted in a school’s cohort.
25
30
Act 94 and ESSA SC Draft Plan
Revised based on EOC decisions approved on December 11, 2017

Rating Target % for Simulations
Excellent 25%Good 30%
Average 25%Below Average 15%Unsatisfactory 5%
Graduation Rate IndicatorHigh Schools
ESSA
Act 94 and ESSA SC Draft Plan
Target % for Simulations
Excellent has Graduation Rate of 90% or greater.Unsatisfactory has Graduation Rate of less than 70%.
Revised based on EOC decisions approved on December 11, 2017

25.2
%
30.2
%
24.8
%
14.4
%
5.4%
0%
10%
20%
30%
40%
50%
60%
70%
80%
90%
100%
Excellent Good Average Below Average Unsatisfactory
Percent of schools receiving rating based on proposed targets
Percent of schools in each Ratings category based on 2015-16 Graduation Rates
ESSA
Act 94 and ESSA SC Draft Plan
Revised based on EOC decisions approved on December 11, 2017

2015 NAEP Performance in SC
% of SC Schools and Ratings for 2017-18*
25 to 37% Proficient and Advanced
Excellent – 15%Good – 20%
31 to 44% Basic Average – 35%
21 to 35% Below Basic Below Average – 20%Unsatisfactory – 10%
Overall School RatingsElementary, Middle, and High Schools
ESSA
Act 94 and ESSA SC Draft Plan
*EOC recommends these target percentages stay in place for at least 5 years to allow schools to improve within a consistent system.
Based on the 2016-17 school year data (assessment results, graduation rate, college/career readiness, etc.,), the total number of points needed for a school to earn a rating of Excellent, Good, Average, Below Average, and Unsatisfactory will be determined based on the following percentages.
Revised based on EOC decisions approved on December 11, 2017