every cloud has a silver lining: fast ... - bank of canada · fast trading, microwave connectivity...
TRANSCRIPT
Every cloud has a silver lining: Fast trading, microwave connectivity
and trading costs
Andriy Shkilko & Konstantin Sokolov Wilfrid Laurier University
Bank of Canada Market Structure Workshop Ottawa 2017

What we do, in a nutshell
2/25
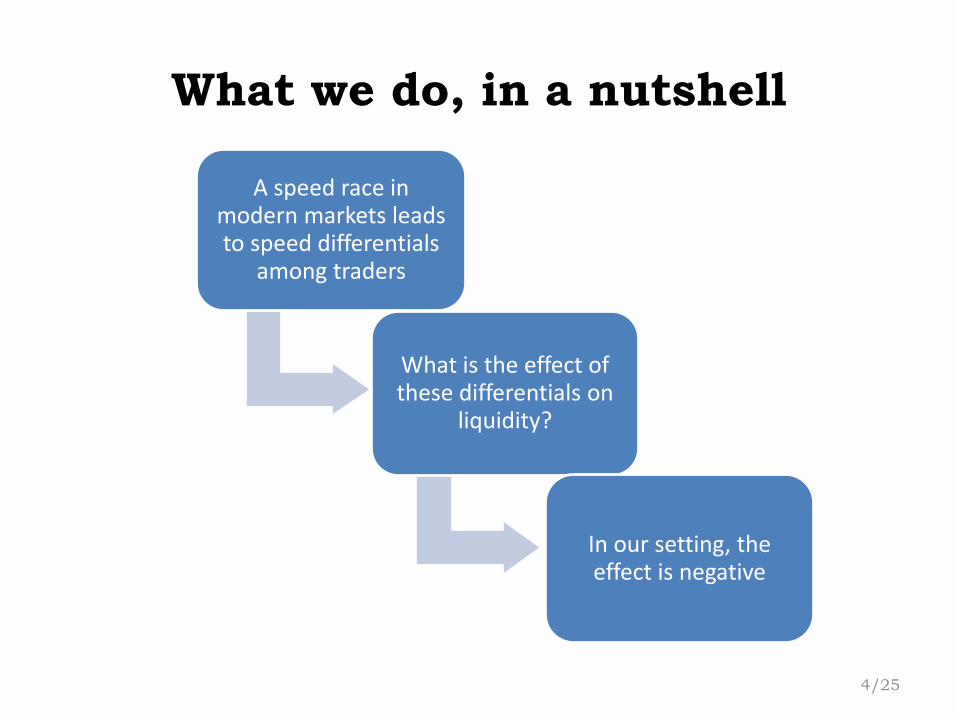
A speed race in modern markets leads to speed differentials
among traders
What is the effect of these differentials on
liquidity?
In our setting, the effect is negative
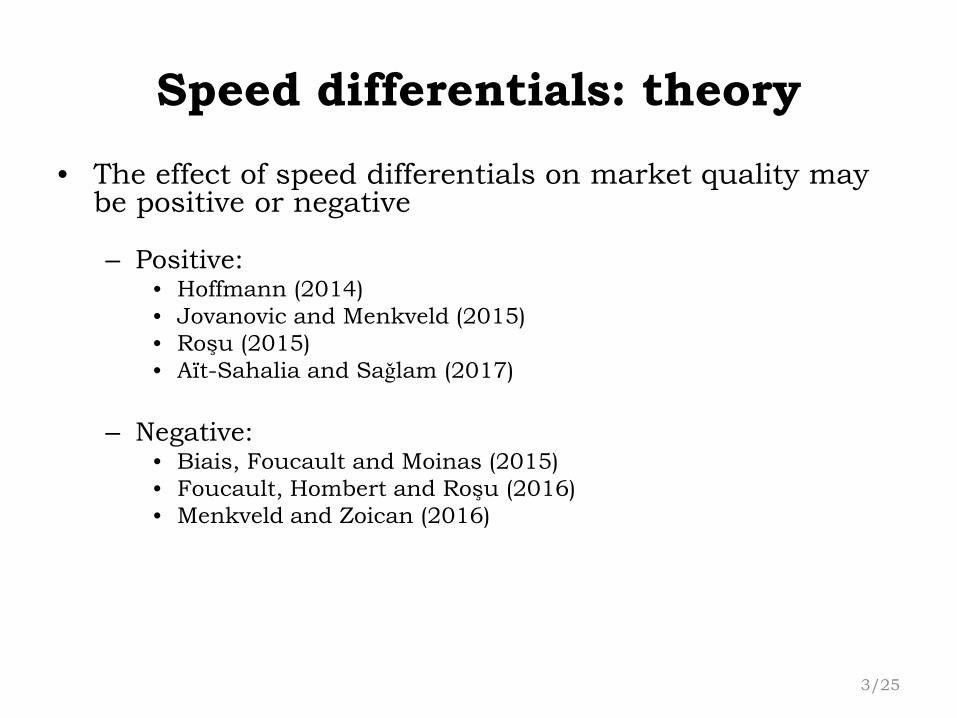
Speed differentials: theory • The effect of speed differentials on market quality may
be positive or negative – Positive:
• Hoffmann (2014) • Jovanovic and Menkveld (2015) • Roşu (2015) • Aït-Sahalia and Saǧlam (2017)
– Negative:
• Biais, Foucault and Moinas (2015) • Foucault, Hombert and Roşu (2016) • Menkveld and Zoican (2016)
3/25
What we do, in a nutshell
4/25
A speed race in modern markets leads to speed differentials
among traders
What is the effect of these differentials on
liquidity?
In our setting, the effect is negative

Our setting
5/25
Chicago New York

Speed differentials: theory • The effect of speed differentials on market quality may
be positive or negative – Positive:
• Hoffmann (2014) • Jovanovic and Menkveld (2015) • Roşu (2015) • Aït-Sahalia and Saǧlam (2017)
– Negative:
• Biais, Foucault and Moinas (2015) • Foucault, Hombert and Roşu (2016) • Menkveld and Zoican (2016)
6/25
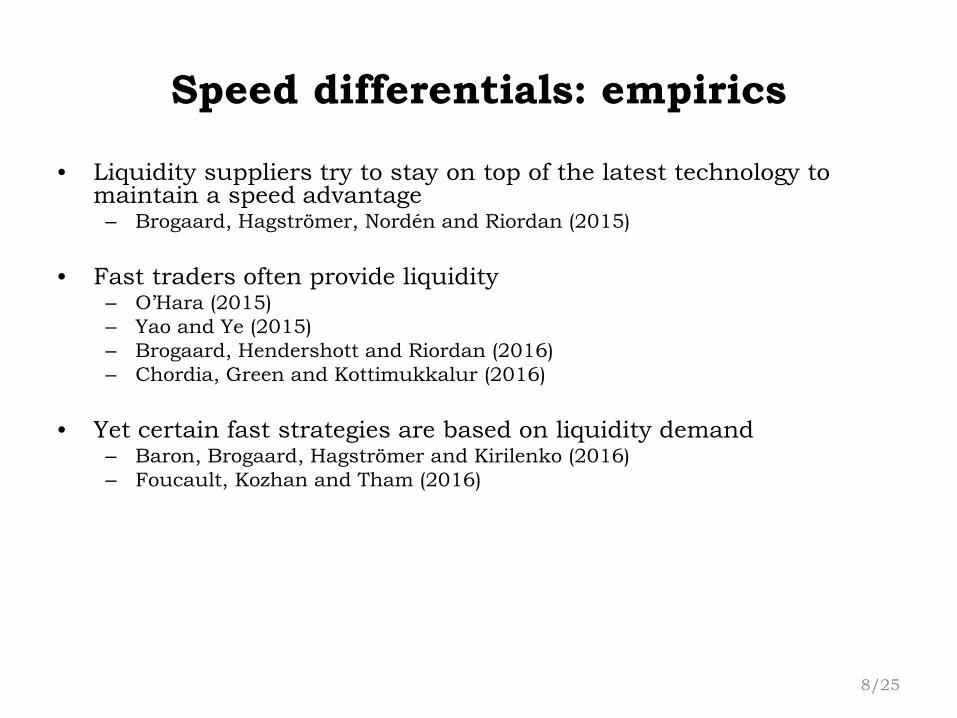
Speed differentials: empirics
• Liquidity suppliers try to stay on top of the latest technology to maintain a speed advantage
– Brogaard, Hagströmer, Nordén and Riordan (2015)
• Fast traders often use limit orders – O’Hara (2015) – Yao and Ye (2015) – Brogaard, Hendershott and Riordan (2016) – Chordia, Green and Kottimukkalur (2016)
• Yet certain strategies require them to use marketable orders
– Baron, Brogaard, Hagströmer and Kirilenko (2016) – Foucault, Kozhan and Tham (2016)
7/25
Speed differentials: empirics
• Liquidity suppliers try to stay on top of the latest technology to maintain a speed advantage
– Brogaard, Hagströmer, Nordén and Riordan (2015)
• Fast traders often provide liquidity – O’Hara (2015) – Yao and Ye (2015) – Brogaard, Hendershott and Riordan (2016) – Chordia, Green and Kottimukkalur (2016)
• Yet certain fast strategies are based on liquidity demand
– Baron, Brogaard, Hagströmer and Kirilenko (2016) – Foucault, Kozhan and Tham (2016)
8/25
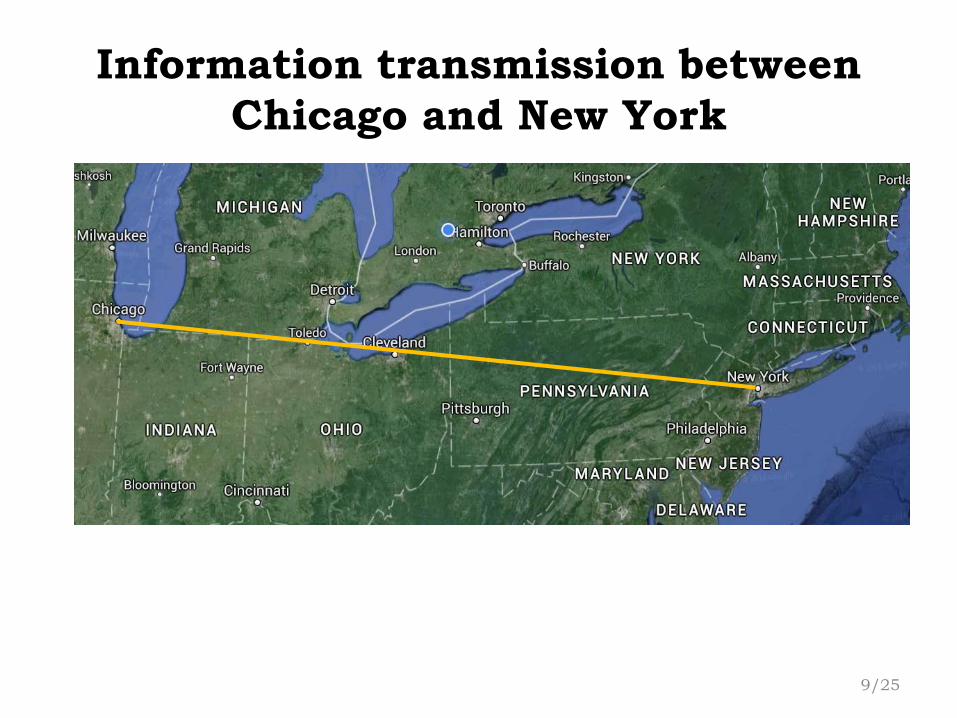
Information transmission between Chicago and New York
9/25
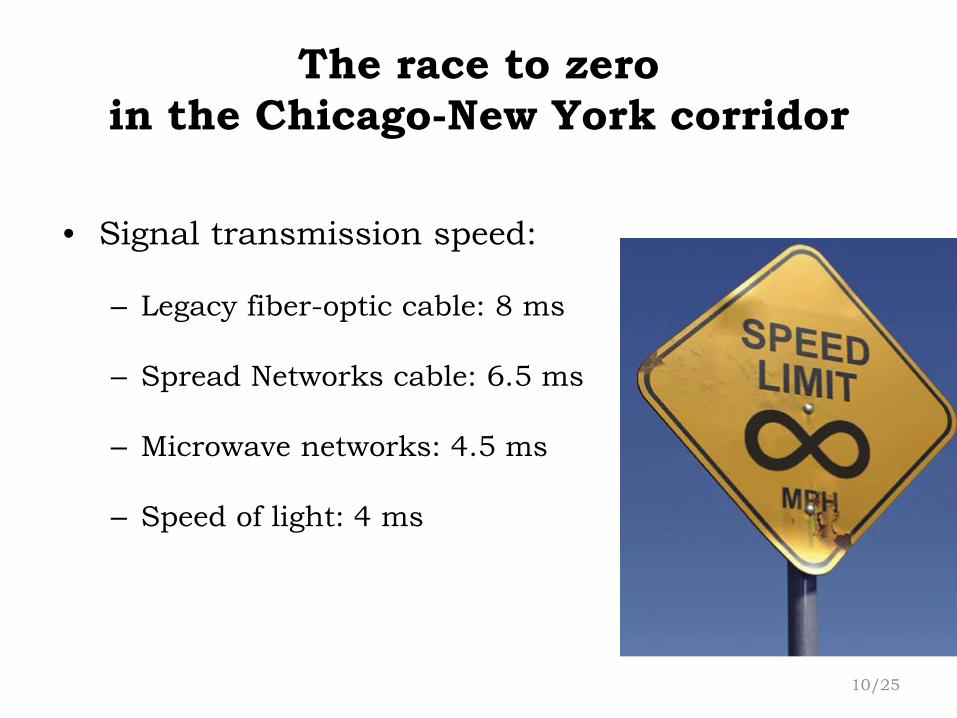
The race to zero in the Chicago-New York corridor
• Signal transmission speed:
– Legacy fiber-optic cable: 8 ms
– Spread Networks cable: 6.5 ms
– Microwave networks: 4.5 ms
– Speed of light: 4 ms
10/25
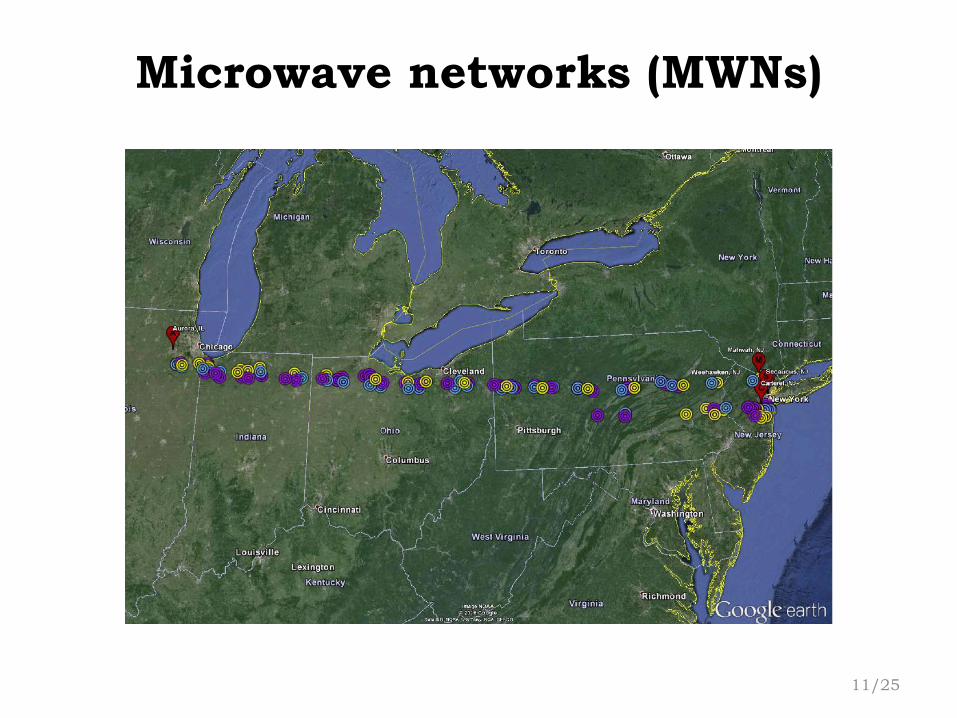
Microwave networks (MWNs)
11/25
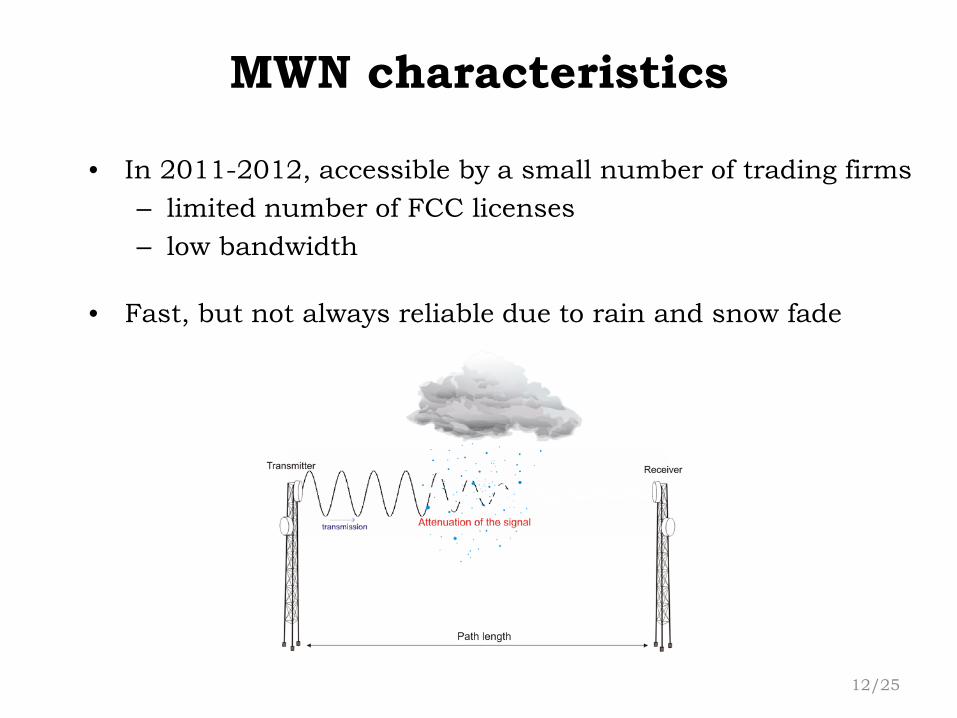
MWN characteristics
• In 2011-2012, accessible by a small number of trading firms – limited number of FСС licenses – low bandwidth
• Fast, but not always reliable due to rain and snow fade
12/25
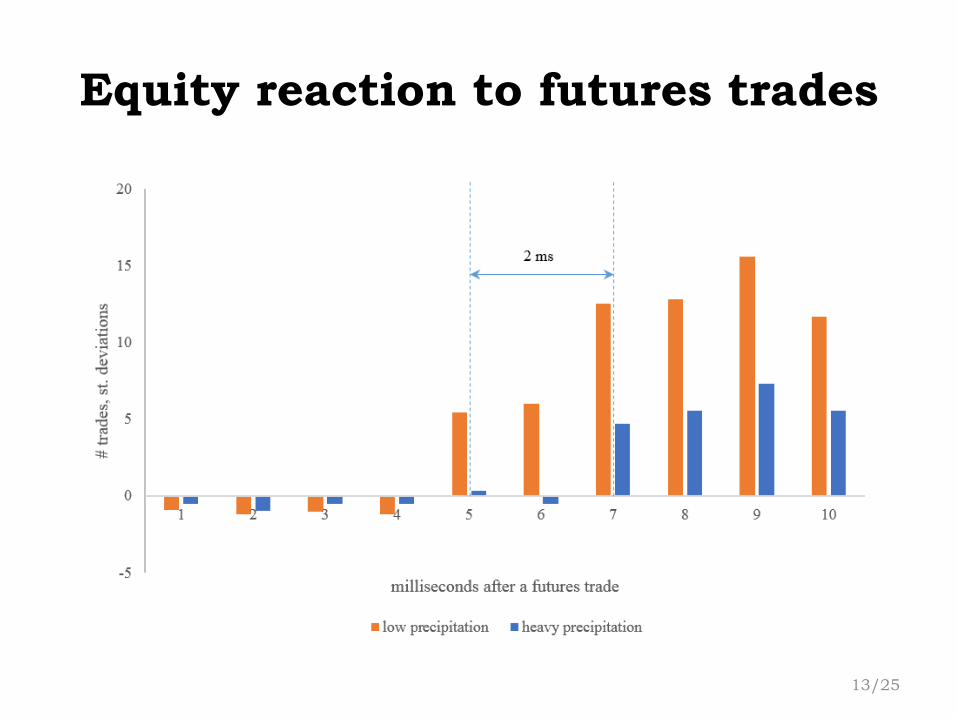
Equity reaction to futures trades
13/25
What we find
• When speed differentials are eliminated due to precipitation – price impacts decline – trading costs decline, in part due to the emergence of
latent liquidity – volatility declines
14/25
2013 democratization
• In early 2013, Quincy Data starts selling futures pricing information to everyone on a subscription basis – effectively democratizing information transmission
• The results of this move are similar to those of
precipitation disruptions
15/25
Data and samples
• Trade and quote data for equities (DTAQ) • Order book data for select futures from the CME • Order book data from Nasdaq’s ITCH
• Precipitation data from the National Oceanic and
Atmospheric Administration (NOAA)
• Sample period I: 2011-2012 • Sample period II: 2013-2014
• Sample: 100 ETFs
16/25
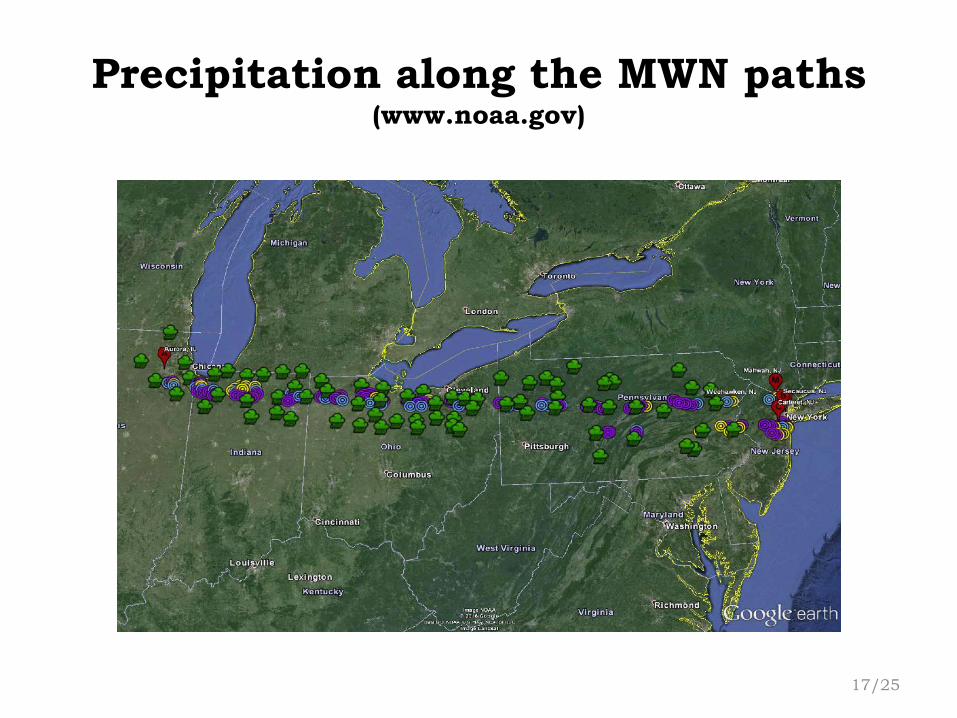
Precipitation along the MWN paths (www.noaa.gov)
17/25

Data and samples
• Trade and quote data for equities (DTAQ) • Order book data for select futures from the CME • Order book data from Nasdaq’s ITCH
• Precipitation data from the National Oceanic and
Atmospheric Administration (NOAA)
• Sample period I: 2011-2012 • Sample period II: 2013-2014
• Sample: 100 ETFs
18/25
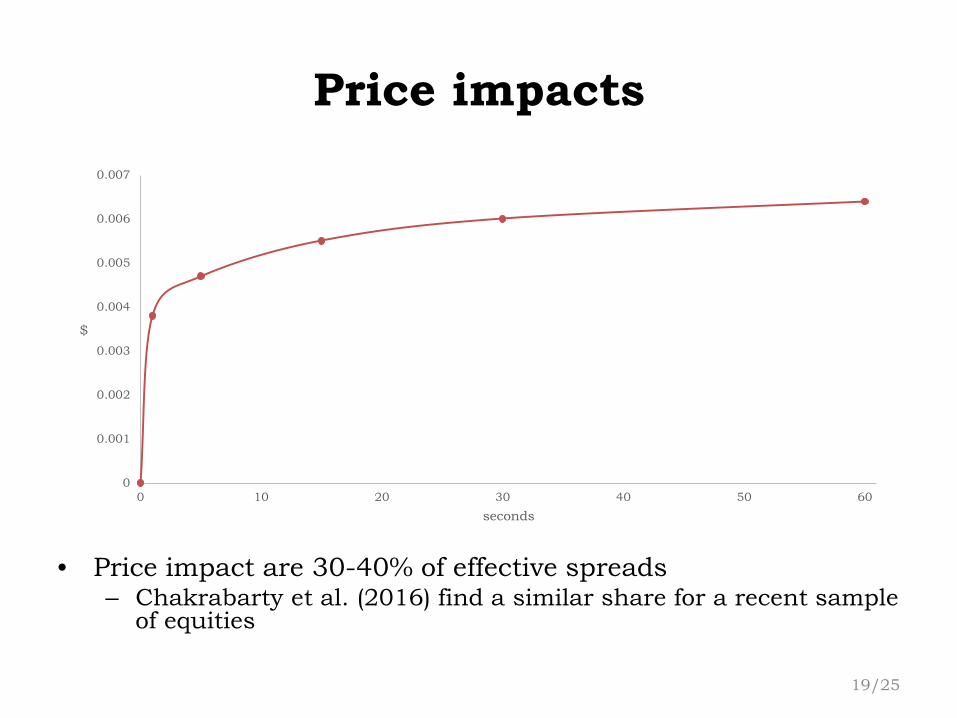
Price impacts
• Price impact are 30-40% of effective spreads – Chakrabarty et al. (2016) find a similar share for a recent sample
of equities
19/25
0
0.001
0.002
0.003
0.004
0.005
0.006
0.007
0 10 20 30 40 50 60
$
seconds
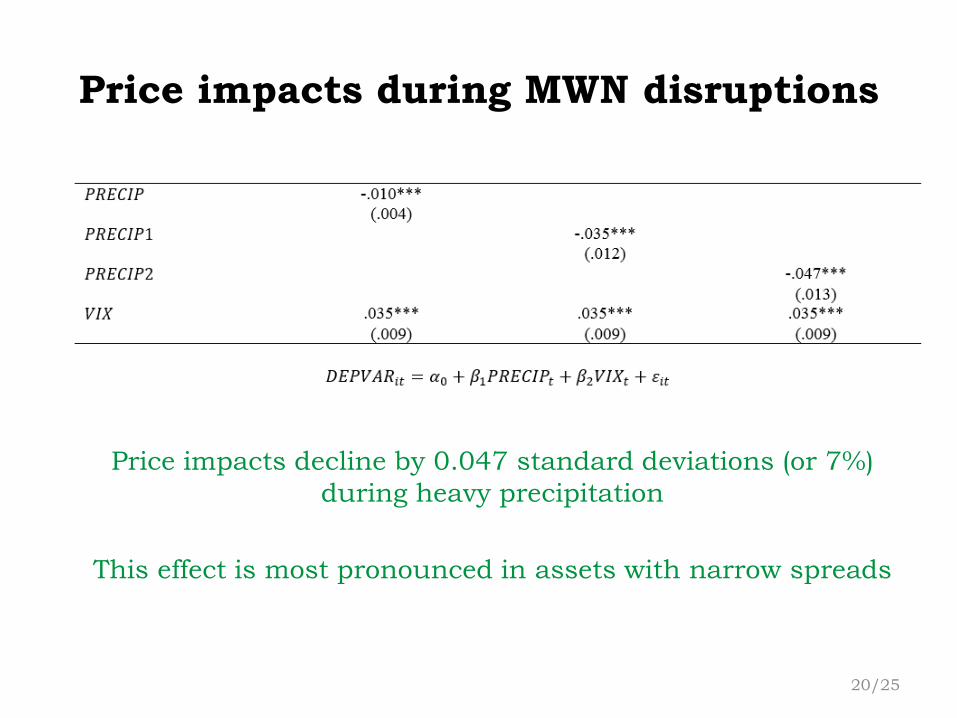
Price impacts during MWN disruptions
Price impacts decline by 0.047 standard deviations (or 7%) during heavy precipitation
This effect is most pronounced in assets with narrow spreads
20/25

Effective and realized spreads
Effective and realized spreads decline by, respectively,
7% and 5%
21/25
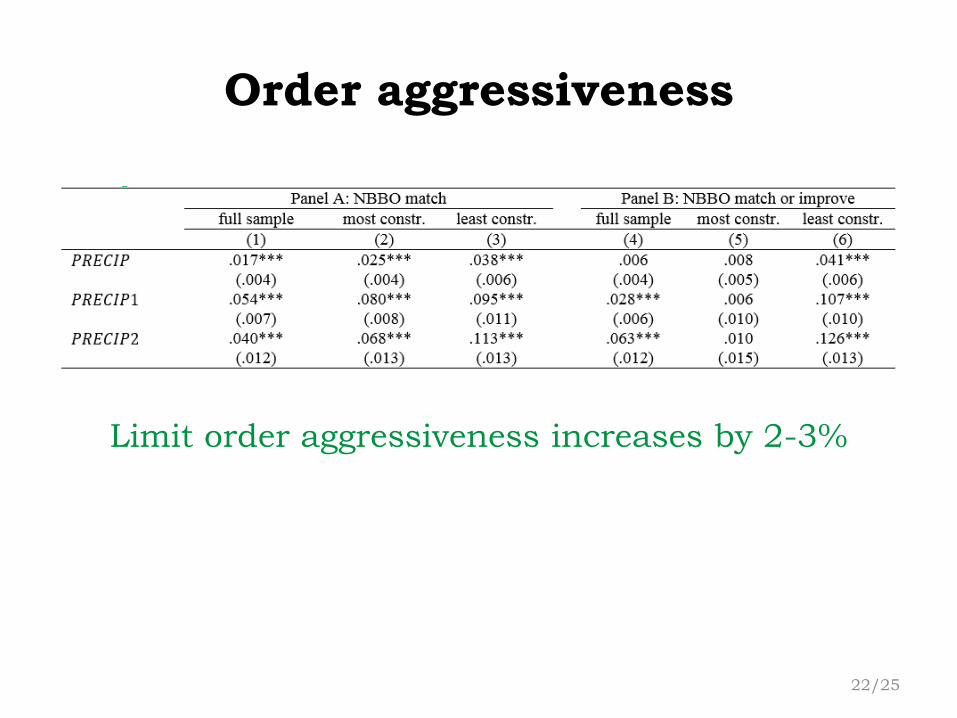
Order aggressiveness
Limit order aggressiveness increases by 2-3%
22/25
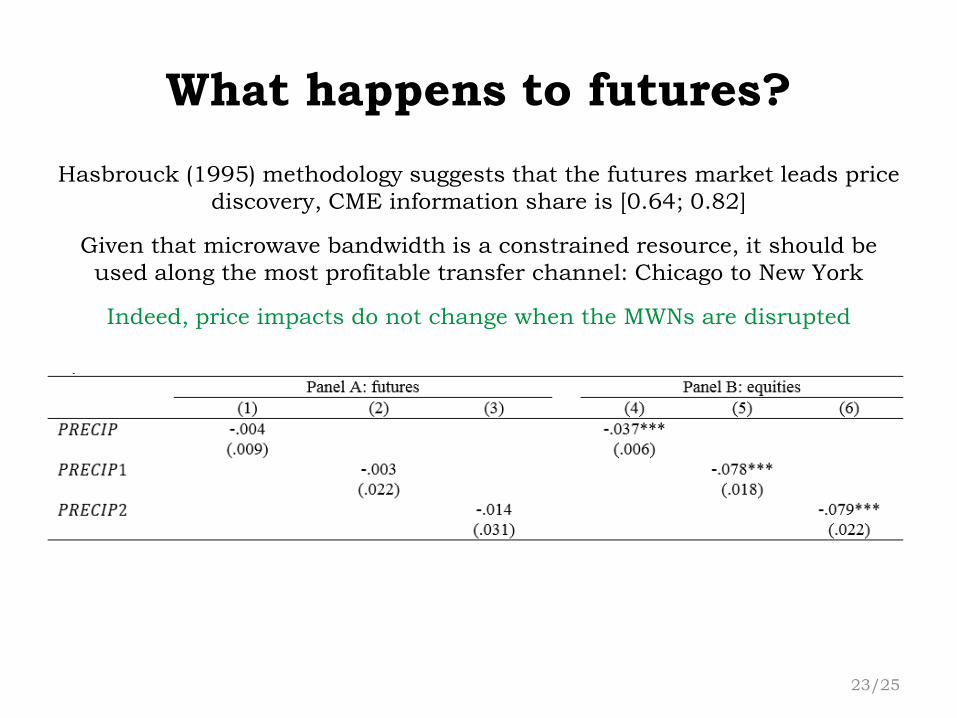
What happens to futures? Hasbrouck (1995) methodology suggests that the futures market leads price
discovery, CME information share is [0.64; 0.82]
Given that microwave bandwidth is a constrained resource, it should be used along the most profitable transfer channel: Chicago to New York
Indeed, price impacts do not change when the MWNs are disrupted
23/25
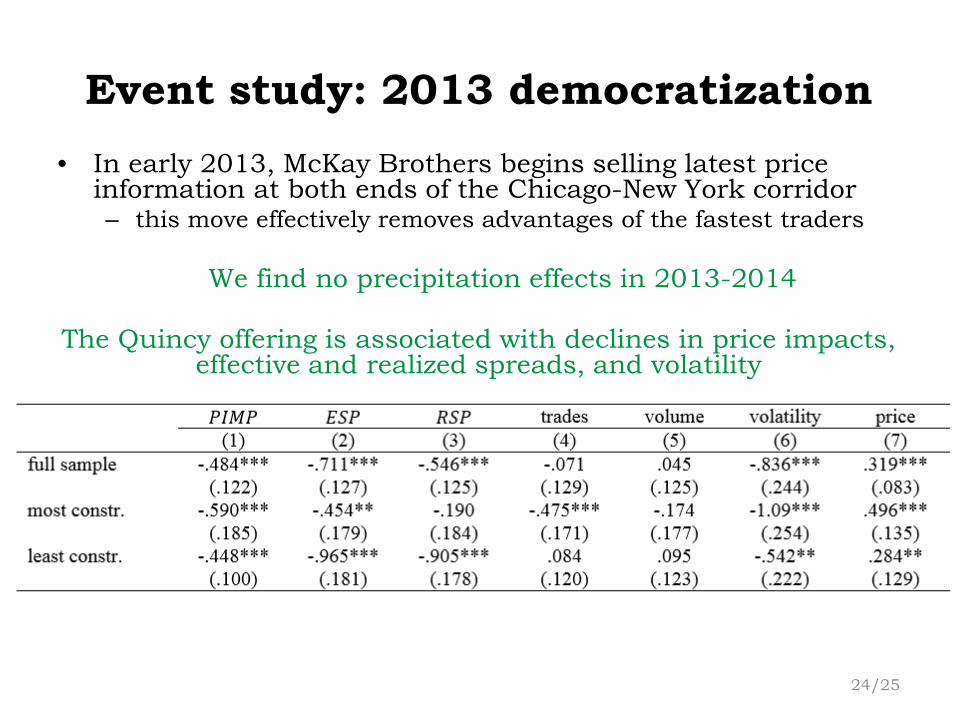
Event study: 2013 democratization • In early 2013, McKay Brothers begins selling latest price
information at both ends of the Chicago-New York corridor – this move effectively removes advantages of the fastest traders
We find no precipitation effects in 2013-2014
The Quincy offering is associated with declines in price impacts,
effective and realized spreads, and volatility
24/25
Conclusions
• In our setting, speed differentials lead to higher adverse selection, trading costs and volatility as the fastest traders choose to take liquidity
• Elimination of speed differentials not only reduces trading costs via the adverse selection channel, but also by strengthening liquidity supply
Thank you
25/25
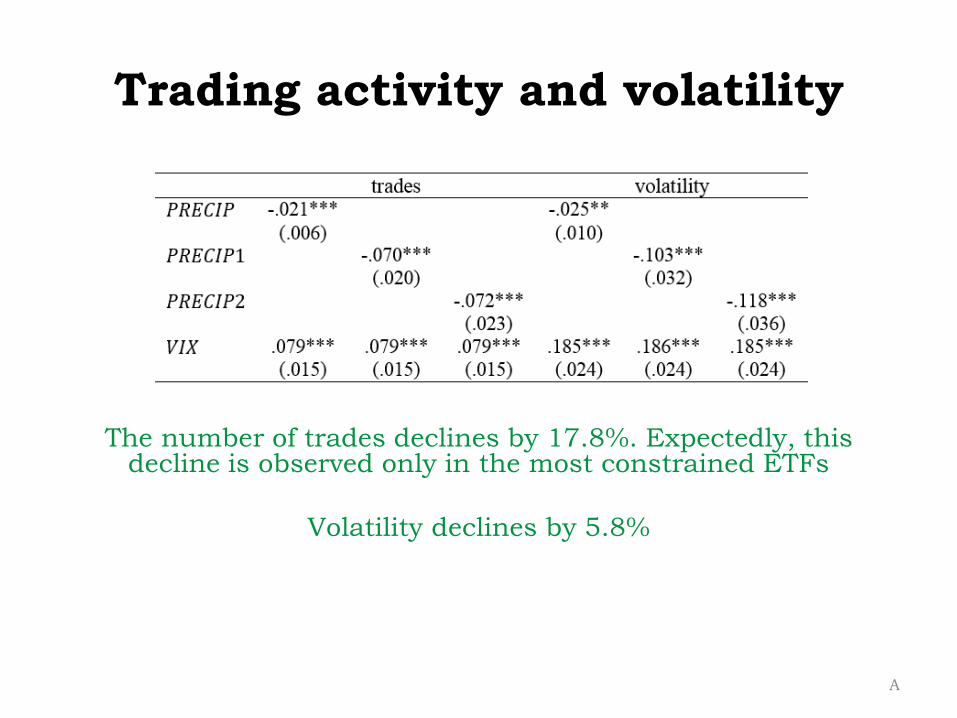
Trading activity and volatility
The number of trades declines by 17.8%. Expectedly, this decline is observed only in the most constrained ETFs
Volatility declines by 5.8%
A
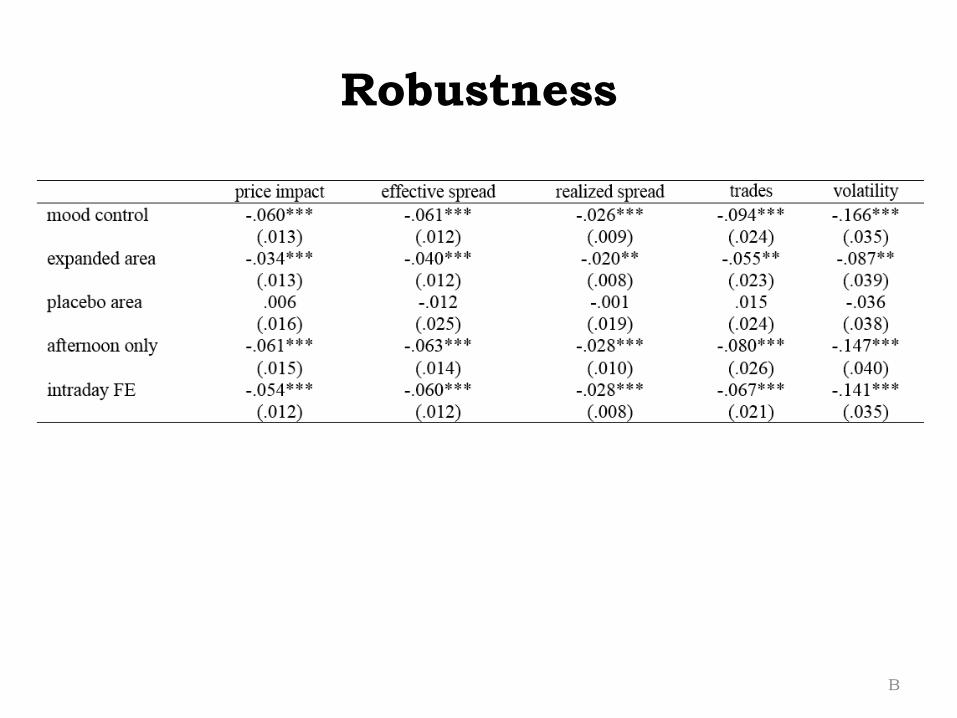
Robustness
B
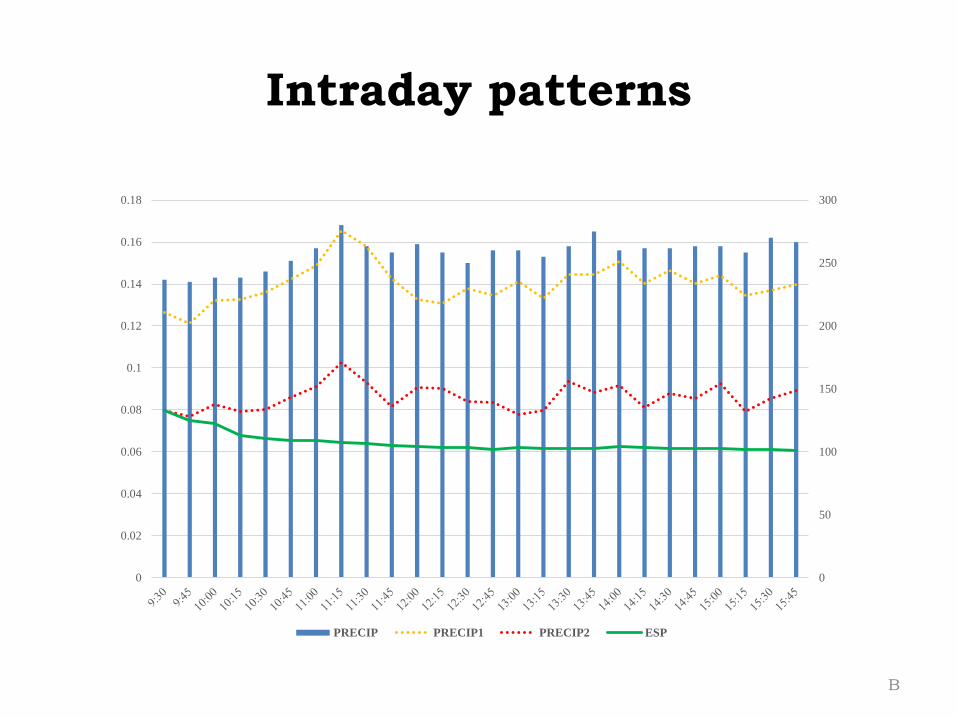
Intraday patterns
B
0
50
100
150
200
250
300
0
0.02
0.04
0.06
0.08
0.1
0.12
0.14
0.16
0.18
PRECIP PRECIP1 PRECIP2 ESP
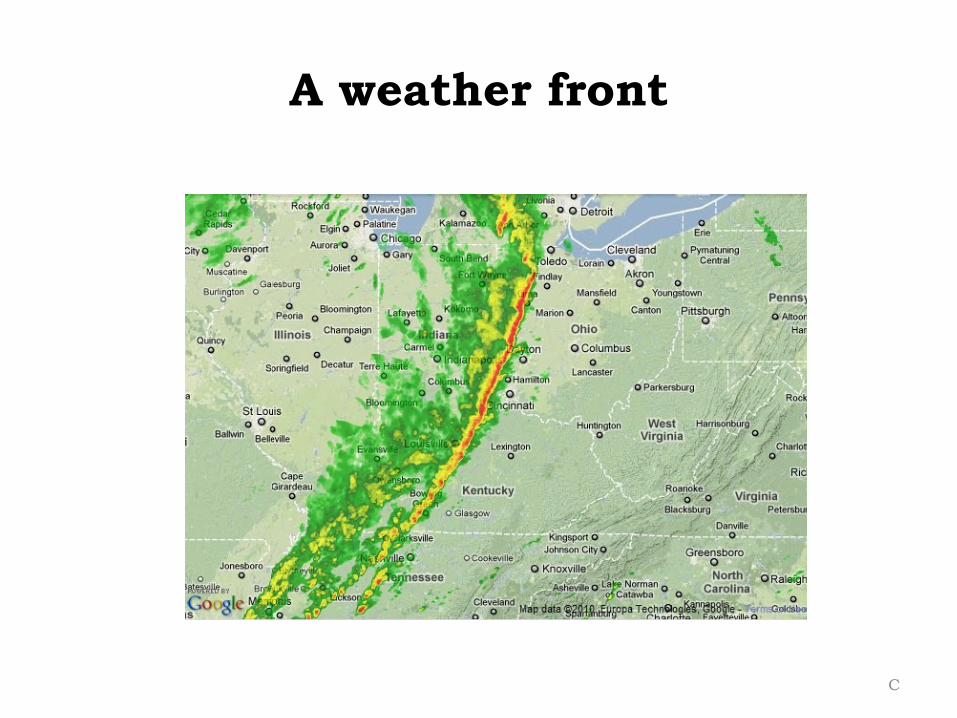
A weather front
C
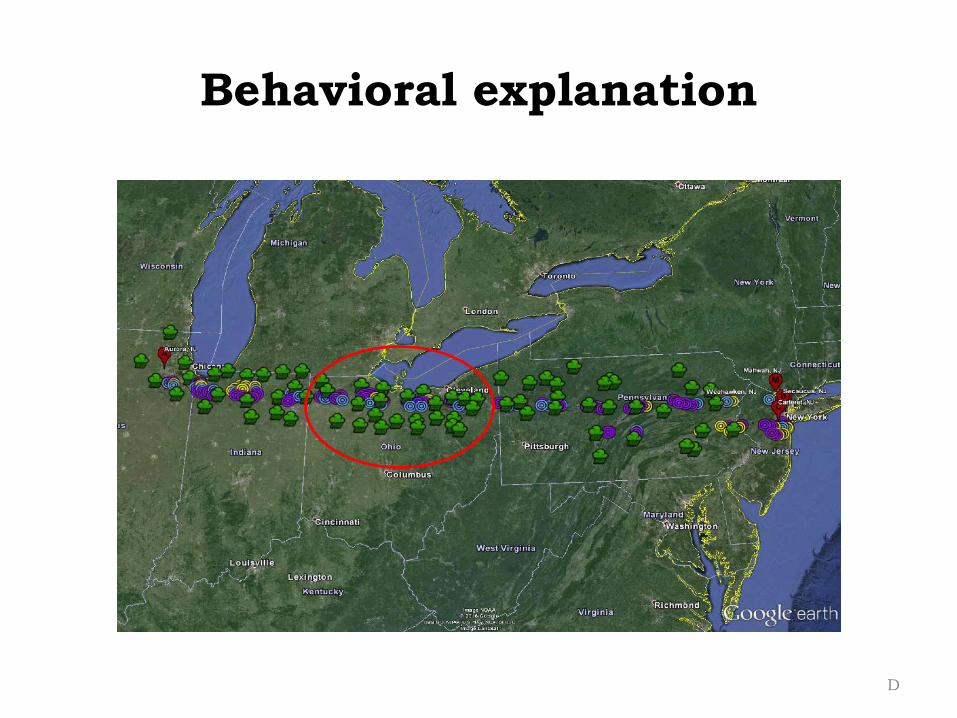
Behavioral explanation
D