everest group’s peak matrix™ for capital markets ao ... · of excellence (coes) ... knowledge...
TRANSCRIPT

Copyright © 2016 Everest Global, Inc.
This document has been licensed for exclusive use and distribution by TCS
EGR-2016-11-R-1997
Everest Group’s PEAK Matrix™ for Global Insurance AO
Service Providers
Focus on TCS
December 2016

Copyright © 2016, Everest Global, Inc.
EGR-2016-11-R-19972
Background and scope of the research
Background of the research
Heightened customer expectations, stagnant growth, limited product differentiation, increasing threat from new entrants, and
the stringent regulatory environment are the key challenges faced by insurers today. Amongst these industry headwinds,
insurers are feeling the pressure from investors and competitors to increase efficiency and effectiveness in processes and
delivery. In order to grow in such a non-conducive environment, insurers are aligning their technology priorities around
business agility and embracing digital technologies that can help them to contain costs, shift from a product-centric play to a
customer-centric play, and also defend their business from emerging disruptive models at the same time
With the insurers shifting towards establishing efficient/agile operations and increasingly adopting digital technology themes, IT
service providers are aggressively looking to tap the opportunity by tailoring their offerings with next-generation technologies,
developing in-house solution frameworks and accelerators, partnering with buyers to co-innovate, setting up labs and Centers
of Excellence (CoEs) to demonstrate and evaluate proof-of-concepts, and forming alliances with leading platform providers to
strengthen their value proposition
In this research, we analyze the capabilities of 24 leading AO service providers, specific to the global insurance sector. These
providers were mapped on the Everest Group Performance | Experience | Ability | Knowledge (PEAK) Matrix, which is a
composite index of a range of distinct metrics related to each provider’s capability and market success. Additionally, Everest
Group has also profiled the capabilities of these 24 service providers in detail including a comprehensive picture of their
service suite, scale of operations, scope, domain expertise & innovation, delivery footprint, and buyer satisfaction specific to
insurance AO services
This document focuses on TCS’ insurance AO experience and includes:
Overview of the insurance AO service provider landscape
Everest Group’s assessment of TCS’ delivery capability and market success on PEAK Matrix
Detailed insurance AO profile for TCS

Copyright © 2016, Everest Global, Inc.
EGR-2016-11-R-19973
This report examines the service provider landscape for large
(TCV > US$25 million), annuity-based, multi-year ( >3 years) application
services relationships in the global insurance sectorNOT EXHAUSTIVE
1 Business-to-consumer relationships
2 Business-to-business relationships
3 Includes other capital markets functions such as structured finance, treasury, FX, and horizontal functions including risk management
Retail banking (B2C1)
Lending
Cards and payments
Commercial banking (B2B2)
Banking
Investment banking
Asset management
Custody and funds administration
Brokerage
Others3
Capital markets
Life and pensions
Property and casualty
Others
Insurance
BFSI
Traditional IO
Remote Infrastructure
Management (RIM)
Infrastructure Management
Services (IMS)
Cloud
IT Infrastructure Outsourcing
(IO)
Application development
Application maintenance
Independent testing
Package implementation
ERP services
Business intelligence / data
warehousing
IT Application Outsourcing
(AO)
BFSI-specific BPO
HRO
FAO
PO
Contact center
Knowledge services
Business Process Outsourcing
(BPO)
IT strategy / operations
consulting
Business consulting
Infrastructure consulting
Infrastructure rollouts
Consulting
Focus of report
Services industry
Digital Services
Services in next-generation technologies leveraged by enterprises to enable transformation including social, mobility, analytics, cloud, and others (Artificial
Intelligence (AI), Robotics Process Automation (RPA), Internet of Things (IoT), Machine-to-Machine (M2M), etc.)

Copyright © 2016, Everest Global, Inc.
EGR-2016-11-R-19974
This report is a part of Everest Group’s series of reports
focused on ITO in BFSI in 2016
Each report provides:
An overview of the application services market for the BFSI vertical, capturing key trends in
market size, growth, drivers & inhibitors, adoption trends, regional/functional break-outs of the
market, emerging themes, key areas of investment, and implications
Key movements in volumes/values of AO transactions, evolving trends, market dynamics, and
emerging priorities of buyers in the last 12 months
IT Outsourcing in BFSI – Annual Report Global Banking
Global Capital Markets
Global Insurance
APEX Matrix for Digital
in U.S. retail banks
APEX Matrix for Digital
in Europe retail banks
Enterprise Digital Effectiveness with APEX Matrix
Two reports as part of an "open source" evaluation of the digital effectiveness of the largest retail
banks in Europe and United States and mapping them on Everest Group’s APEX Matrix – as
Leaders, Optimizers, Innovators, and Aspirants
Global Banking
Global Capital Markets
Global Insurance
Mobility in Banking
Mobility in Insurance
Analytics in Banking
Analytics in Insurance
IT Outsourcing in BFSI – Service Provider Landscape and Profiles Compendium
Each report provides:
Assessment of service provider landscape in AO services and mapping of providers on Everest
Group’s PEAK MatrixTM – as Leaders, Major Contenders, and Aspirants
Benchmarking scale, scope, domain investments, and delivery footprint of each provider’s
BFSI-AO practice along with comparative evaluation of their BFSI-AO capabilities
The 2016 BFSI-AO PEAK Matrix analyses focus on identifying the “Star Performers”, i.e.,
providers with the strongest forward movement over time – both in terms of market success and
capability advancements
Capability profiles of service providers capturing their AO services experience in specific
subverticals including details such as AO services capabilities, key investments, proprietary
solutions, and technological expertise

Copyright © 2016, Everest Global, Inc.
EGR-2016-11-R-19975
Everest Group’s BFSI research is based on two key sources of
proprietary information
Everest Group’s proprietary database of 400+ large, active, multi-year AO contracts within
insurance (updated annually). The database tracks the following elements of each large
AO relationship:
– Buyer details including industry, size, and signing region
– Contract details including TCV, ACV, term, start date, service provider FTEs, and pricing
structure
– Activity broken down separately for banking, capital markets, insurance, and by lines of
business (for example, investment banking, asset management, custody, fund
administration, and brokerage)
– Scope includes coverage of buyer’s geography as well as functional activities
– Global sourcing including delivery locations and level of offshoring
1
Everest Group’s proprietary database of operational capability of 25+ insurance AO
service providers (updated annually)
The database tracks the following capability elements for each service provider:
– Major insurance AO clients and recent wins
– Overall revenue
– Recent insurance-related developments
– Insurance AO delivery locations
– Insurance AO service suite
– Domain capabilities, proprietary solutions, and intellectual property investments
2
Service providers covered in the analysis
1
1 Assessment for Accenture, HPE, IBM, and Mphasis excludes service provider inputs, and is based on Everest Group’s proprietary Transaction Intelligence (TI)
database, service provider public disclosures, and Everest Group’s interactions with insurance buyers
2 Analysis based on capabilities before the merger of CSC and HPE Services
3 Analysis for NTT DATA is based on its capabilities before acquiring Dell Services
4 RFI submitted by Dell Services before completion of acquisition by NTT DATA. New entity is known as NTT DATA Services
Note: We continuously monitor market developments and track additional service providers beyond those included in the analysis
Confidentiality: Everest Group takes its confidentiality pledge very seriously. Any information, that is contract-specific, will be presented back to the industry only in an
aggregated fashion
2
1,2
1
3
1
4

Copyright © 2016, Everest Global, Inc.
EGR-2016-11-R-19976
TCS is positioned as a Leader on Everest Group PEAK
MatrixTM for insurance AO – 2016
Leaders
Major Contenders
Aspirants
Star Performers
Everest Group Performance | Experience | Ability | Knowledge (PEAK) Matrix for large insurance AO relationships1,2,3
High
High
Major Contenders
Leaders
Low
Low
Aspirants
Accenture
TCSCognizant
Capgemini
Infosys
HCL TechnologiesCGI
HPENTT DATA
NIIT TechnologiesMindtree
VirtusaPolaris
CSC L&T Infotech
Wipro
MphasiS
Tech Mahindra SyntelHexaware
GenpactZensar
NTT DATA Services
Birlasoft
Insurance AO delivery capability
(Scale, scope, domain expertise & innovation, delivery footprint, and buyer satisfaction)
25th percentile
25
thp
erc
en
tile
75th percentile
75
thp
erc
en
tile
IBM
Mark
et
su
ccess
(Insura
nce A
O r
evenue, gro
wth
,
and n
um
ber
of la
rge a
ctive d
eals
)
1 PEAK Matrix specific to large (>US$25 million TCV), multi-year (>3 years) application outsourcing relationships for the insurance sector (life & pensions,
property & casualty, others including reinsurance and takaful Islamic insurance); excludes banking and capital markets
2 Analysis for NTT DATA is based on its capabilities before acquiring Dell Services; analysis of CSC and HPE is based on capabilities of individual entities before
the HPE-CSC merger
3 RFI submitted by Dell Services before completion of acquisition by NTT DATA. New entity is known as NTT DATA Services
Note: Assessment for Accenture, HPE, IBM, and Mphasis excludes service provider inputs and is based on Everest Group’s proprietary Transaction Intelligence (TI)
database, service provider public disclosures, and Everest Group’s interactions with insurance buyers
Source: Everest Group (2016)

Copyright © 2016, Everest Global, Inc.
EGR-2016-11-R-19977
TCS | Insurance AO profile (page 1 of 2)
Insurance AO services overview
>US$1 billionUS$200-
US$500 million<US$200 million
US$500 million-
US$1 billion
Insurance AO revenue1
TCS offers an attractive value proposition to insurance clients with a broad portfolio of industry-specific platforms, accelerators, and off-the-shelf frameworks. Extensive
domain expertise coupled with a large delivery scale & global delivery footprint has helped TCS to establish and grow multiple long-term relationships with strategic
insurance accounts. Going forward, TCS should focus on improving its market perception of being viewed as primarily an offshore-centric player and enhance its domain
consulting capabilities in order to partner with clients on their large scale transformational journey.
Strengths
Well-balanced comprehensive portfolio comprising domain-focused integrated
platforms and targeted accelerators, coupled with a global delivery presence
Multiple strategic relationships with global insurers across all insurance segments
and geographies
Established credibility for domain knowledge, large scale, and agility across key
engagements
Areas of improvement
Invest in thought leadership and consulting capabilities to enhance its market
positioning for winning large scale business transformational engagements
Complement its value proposition centered around cost-savings and delivery
excellence with strong market messaging around driving “change-the-
business” initiatives
Adoption by value chain1
Product
development
Sales & distribution
channel management
Claims
management
Underwriting &
policy administration
Application services scope1
Development Maintenance Testing SI/Consulting
North America EMEA Latin America APAC
Adoption by geographic focus1
Digital services scope1
Big data / analytics Cloud Mobility Social / IoT
AO services revenue by buyer size1
Small (annual revenue < US$1 billion)
Large (annual revenue = US$5-10 billion)
Medium (annual revenue = US$1-5 billion)
Mega (annual revenue > US$20 billion)
Very large (annual revenue = US$10-20 billion)
(>20%) (10-20%) (<10%)Revenue contribution
1 As per Everest Group estimates
Source: Everest Group (2016)

Copyright © 2016, Everest Global, Inc.
EGR-2016-11-R-19978
TCS | Insurance AO profile (page 2 of 2)
Insurance AO services offerings
Key alliances/partnerships/M&As
Investment name Type of investment Details
Apigee Partnership (2015) To leverage Apigee’s platforms in the areas of API management, IoT, and predictive analytics to drive
digital business transformation for enterprises
Tableau Partnership (2015) To enable customers implement and integrate rapid analytics as well as visualize multi-structured data in
the form of patterns, trends, and visual insights for real-time decision making
Key proprietary solutions
Solution Details
TCS Connected Home A comprehensive solution that leverages IoT and digital technologies to help the insurer connect the internal and external customer
data, home monitors, etc., for developing customized products and for better risk assessment
Intelligent Remote Inspection
System (IRIS)
Enables insurers to integrate Unmanned Aerial Systems (UAS) into their claims/underwriting inspection processes, helping them to
remotely assess risk and reduce operational costs
TCS NextGen Underwriting
Workbench
Delivers an end-to-end unified process to manage submissions, evaluate risk, and underwrite commercial property, general liability,
and commercial package exposures
Predictive Underwriting Framework
for Life Insurance
A framework for using predictive analytics in complex scenarios to help underwriters get insights into factors – such as claims
history, previous decisions, and social information – for making underwriting decisions
Other key investments
Development Details
Digital Reimagination Studio Launched a Digital Reimagination Studio in Santa Clara, United States, to help customers and partners rapidly ideate bold new
innovations and build transformational POCs
CoE for IoT solutions Set up a CoE in collaboration with Intel at the TCS Hyderabad, India campus; the lab focuses on developing new use cases for
multiple industries and creates solution accelerators around Intel technologies
NOT EXHAUSTIVE
Source: Everest Group (2016)
Copyright © 2016, Everest Global, Inc.
EGR-2016-11-R-19979
Appendix

Copyright © 2016, Everest Global, Inc.
EGR-2016-11-R-199710
Everest Group’s PEAK MatrixTM is a composite index of a range of distinct metrics related to a service provider’s scale, scope,
technology/domain expertise & innovation, delivery footprint, buyer satisfaction, and resultant market success in the context of a given
outsourcing function.
Everest Group Performance | Experience | Ability | Knowledge (PEAK) Matrix for Application Outsourcing
Top quartile performance
across market success
and capability2nd or 3rd quartile
performance across market
success and capability
4th quartile performance
across market success and
capability
High
Low
25
thp
erc
en
tile
75
thp
erc
en
tile
75th percentile
Low High25th percentile
Ma
rke
t s
uc
ce
ss
AO capability
(Scale, scope, domain expertise & innovation, delivery footprint, and buyer satisfaction)
Aspirants
Leaders
Major Contenders
The service providers were mapped on Everest Group’s
Performance | Experience | Ability | Knowledge
(PEAK) Matrix

Copyright © 2016, Everest Global, Inc.
EGR-2016-11-R-199711
Dimensions of service providers’ capability and market
success underlying the PEAK MatrixTM for insurance
AO services
Yearly insurance specific
AO revenue growth
Insurance AO revenue in
CY2015
Number of large, active
insurance AO deals
Ma
rke
t s
uc
ce
ss
Everest Group PEAK Matrix
Aspirants
Major Contenders
Delivery capability
Total company
revenue
Contribution of
insurance specific AO
revenue to the total
company revenue
Innovation / IP/
proprietary solutions
M&A, alliances, and
other investments
Lines of Business
(LoBs) served
AO subfunctions
served
Geographies served
Delivery mix
Number of delivery
centers and regions
covered
Buyer perception
score
Leaders
ScaleDomain expertise
& innovationScope Delivery footprint Buyer satisfaction
Copyright © 2016, Everest Global, Inc.
EGR-2016-11-R-199712
FAQs (page 1 of 2)
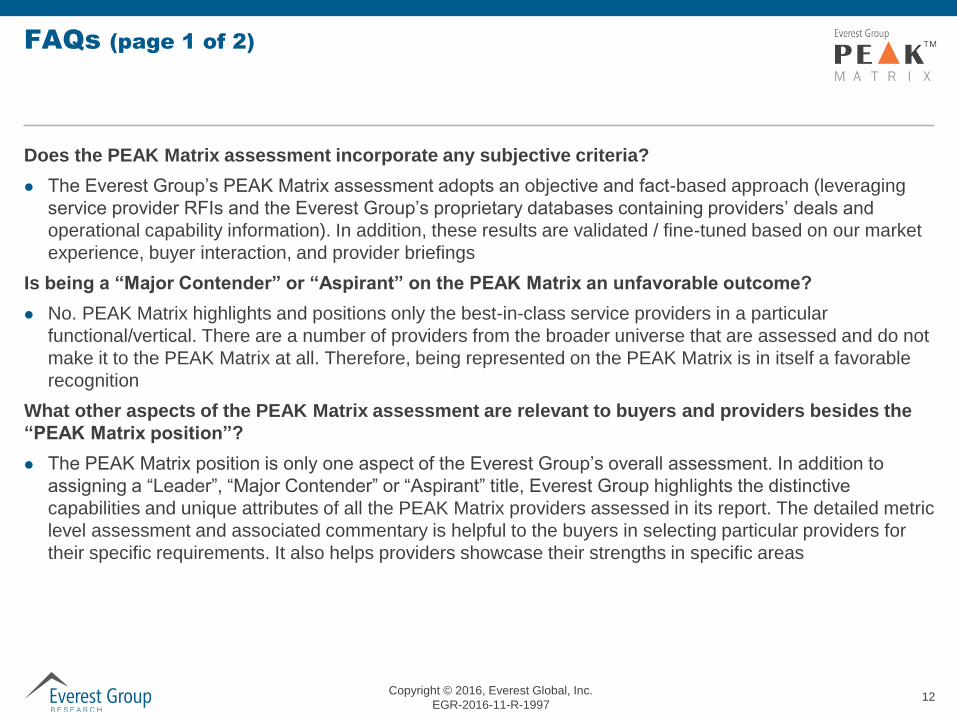
Does the PEAK Matrix assessment incorporate any subjective criteria?
The Everest Group’s PEAK Matrix assessment adopts an objective and fact-based approach (leveraging
service provider RFIs and the Everest Group’s proprietary databases containing providers’ deals and
operational capability information). In addition, these results are validated / fine-tuned based on our market
experience, buyer interaction, and provider briefings
Is being a “Major Contender” or “Aspirant” on the PEAK Matrix an unfavorable outcome?
No. PEAK Matrix highlights and positions only the best-in-class service providers in a particular
functional/vertical. There are a number of providers from the broader universe that are assessed and do not
make it to the PEAK Matrix at all. Therefore, being represented on the PEAK Matrix is in itself a favorable
recognition
What other aspects of the PEAK Matrix assessment are relevant to buyers and providers besides the
“PEAK Matrix position”?
The PEAK Matrix position is only one aspect of the Everest Group’s overall assessment. In addition to
assigning a “Leader”, “Major Contender” or “Aspirant” title, Everest Group highlights the distinctive
capabilities and unique attributes of all the PEAK Matrix providers assessed in its report. The detailed metric
level assessment and associated commentary is helpful to the buyers in selecting particular providers for
their specific requirements. It also helps providers showcase their strengths in specific areas

Copyright © 2016, Everest Global, Inc.
EGR-2016-11-R-199713
FAQs (page 2 of 2)
What are the incentives for buyers and providers to participate / provide input to the PEAK Matrix
research?
Participation incentives for buyers include a summary of key findings from the PEAK Matrix assessment
Participation incentives for providers include adequate representation and recognition of their
capabilities/success in the market place, and a copy of their own “profile” that is published by Everest Group
as part of the “compendium of PEAK Matrix providers” profiles
What is the process for a service provider to leverage their PEAK Matrix positioning status ?
Providers can use their PEAK Matrix positioning in multiple ways including:
– Issue a press release declaring their positioning/rating
– Customized PEAK Matrix profile for circulation (with clients, prospects, etc.)
– Quotes from the Everest Group’s analysts could be disseminated to the media
– Leverage the PEAK Matrix branding across communications (e-mail signatures, marketing brochures,
credential packs, client presentations, etc.)
The provider must obtain the requisite licensing and distribution rights for the above activities
through an agreement with the designated PoC at Everest Group

About Everest Group
Everest Group is a consulting and research firm focused on strategic IT, business
services, and sourcing. We are trusted advisors to senior executives of leading
enterprises, providers, and investors. Our firm helps clients improve operational
and financial performance through a hands-on process that supports them in
making well-informed decisions that deliver high-impact results and achieve
sustained value. Our insight and guidance empowers clients to improve
organizational efficiency, effectiveness, agility, and responsiveness. What sets
Everest Group apart is the integration of deep sourcing knowledge, problem-
solving skills and original research. Details and in-depth content are available at
www.everestgrp.com.
Dallas (Headquarters)
+1-214-451-3000
Bangalore
+91-804-276-4533
Delhi
+91-124-496-1000
London
+44-207-129-1318
New York
+1-646-805-4000
Toronto
+1-647-557-3475
Social Media
@EverestGroup
@Everest Group
Stay connected
Website
www.everestgrp.com
Blog
www.sherpasinblueshirts.com
Sherpas In Blue Shirts