ever decreasing circles david g smithard md frcp ricr clinical director kent and medway clrn
TRANSCRIPT

Ever Decreasing Circles
David G Smithard MD FRCP RICRClinical Director Kent and Medway
CLRN


FY2007/8 FY2008/9 FY2009/10 FY2010/11 FY2011/12 FY2012/13 FY2013/14 (to date)
0
50
100
150
200
250
300
350
KMPT Recruitment since April 2007
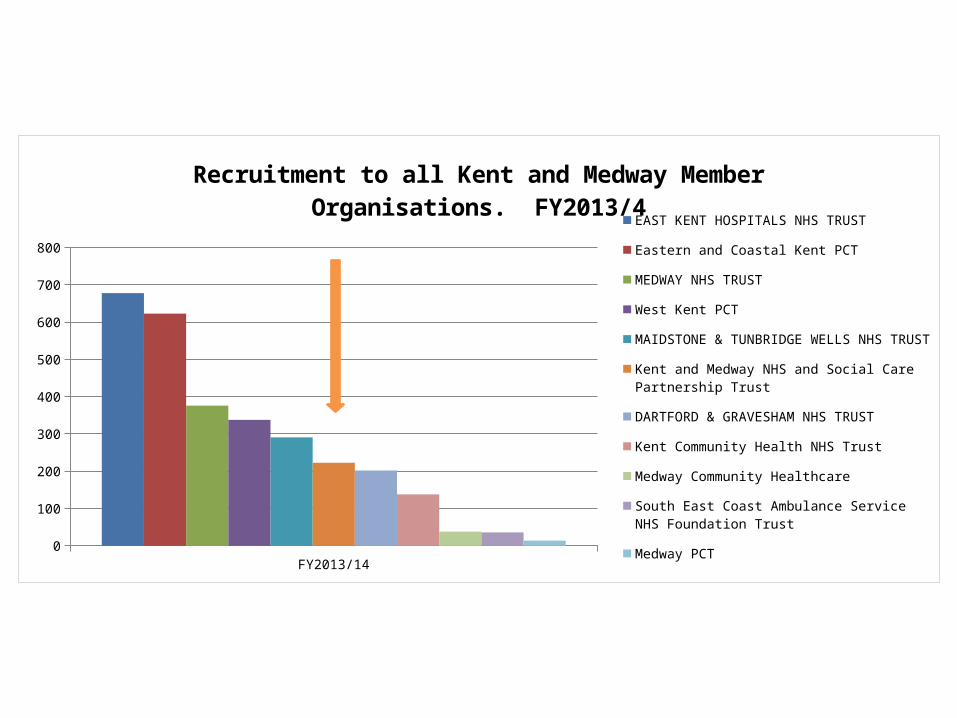
FY2013/140
100
200
300
400
500
600
700
800
Recruitment to all Kent and Medway Member Organisations. FY2013/4
EAST KENT HOSPITALS NHS TRUST
Eastern and Coastal Kent PCT
MEDWAY NHS TRUST
West Kent PCT
MAIDSTONE & TUNBRIDGE WELLS NHS TRUST
Kent and Medway NHS and Social Care Partnership Trust
DARTFORD & GRAVESHAM NHS TRUST
Kent Community Health NHS Trust
Medway Community Healthcare
South East Coast Ambulance Service NHS Foundation Trust
Medway PCT
EAST
KENT H
OSPITA
LS NHS T
RUST
MAIDSTONE &
TUNBRIDGE W
ELLS N
HS TRUST
West
Kent P
CT
MEDW
AY NHS T
RUST
Easte
rn an
d Coastal
Kent P
CT
DARTFORD &
GRAVESHAM NHS T
RUST
Kent a
nd Med
way NHS a
nd Socia
l Care
Partners
hip Trust
Medway
PCT
Kent C
ommunity Hea
lth NHS T
rust
South Ea
st Coast
Ambulance
Servi
ce NHS F
oundation Tr
ust
Medway
Community Hea
lthcar
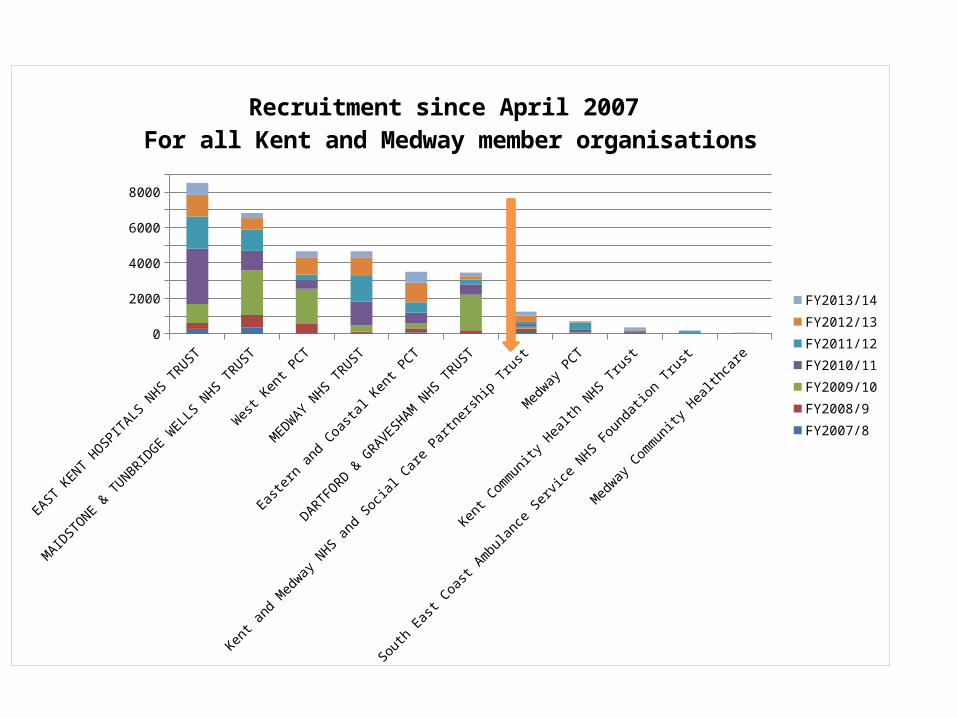
e0
1000
2000
3000
4000
5000
6000
7000
8000
9000
Recruitment since April 2007 For all Kent and Medway member organisations
FY2013/14FY2012/13FY2011/12FY2010/11FY2009/10FY2008/9FY2007/8
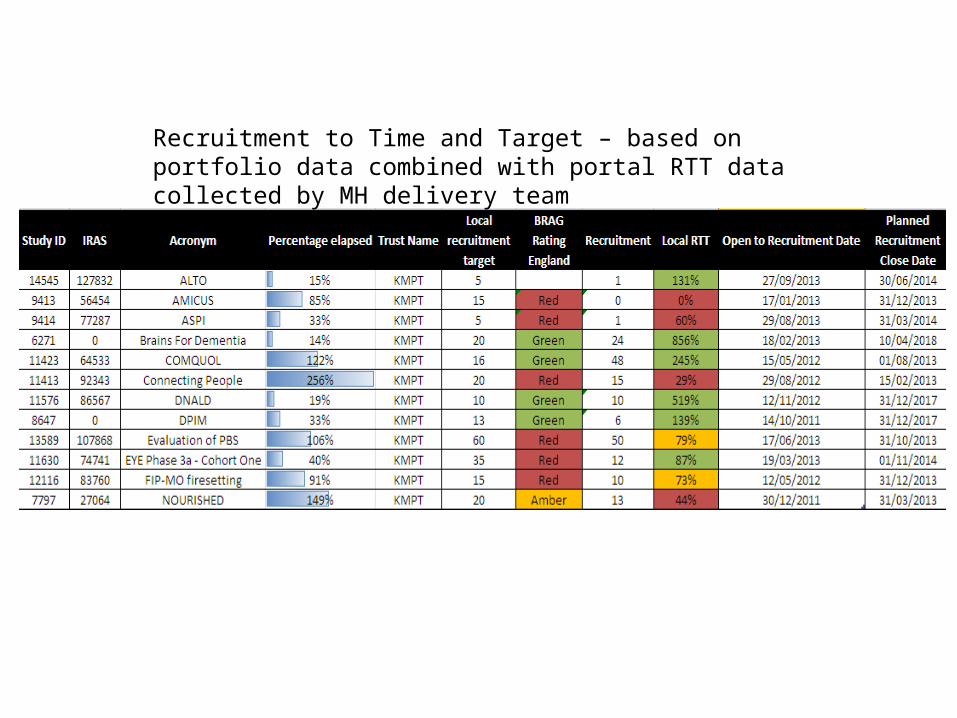
Recruitment to Time and Target – based on portfolio data combined with portal RTT data collected by MH delivery team

97
126
FY2013/4 Recruitment by Study Design
InterventionalObservational
23
59
141
FY2013/4 Recruitment by Topic Category
CCRNCommercial TOPICTOPIC

FY2007/8 FY2008/9 FY2009/10 FY2010/11 FY2011/12 FY2012/13 FY2013/140
5
10
15
20
25
30
KMPT - Number of Recruiting Studies by FY

CLRN
• Support for– Portfolio Dr Ian Akers– Industry James Porecca
• Research Governance – Hazel Crawford
• Delivery Team– MHRN– DeNDRoN


Back to The Future

Set-up phase is over! Shift towardsperformance management• Management through the CoordinatingCentres/Teams• “With performance comes autonomy” –light touch for those who deliver• “Special measures” for those who don’t
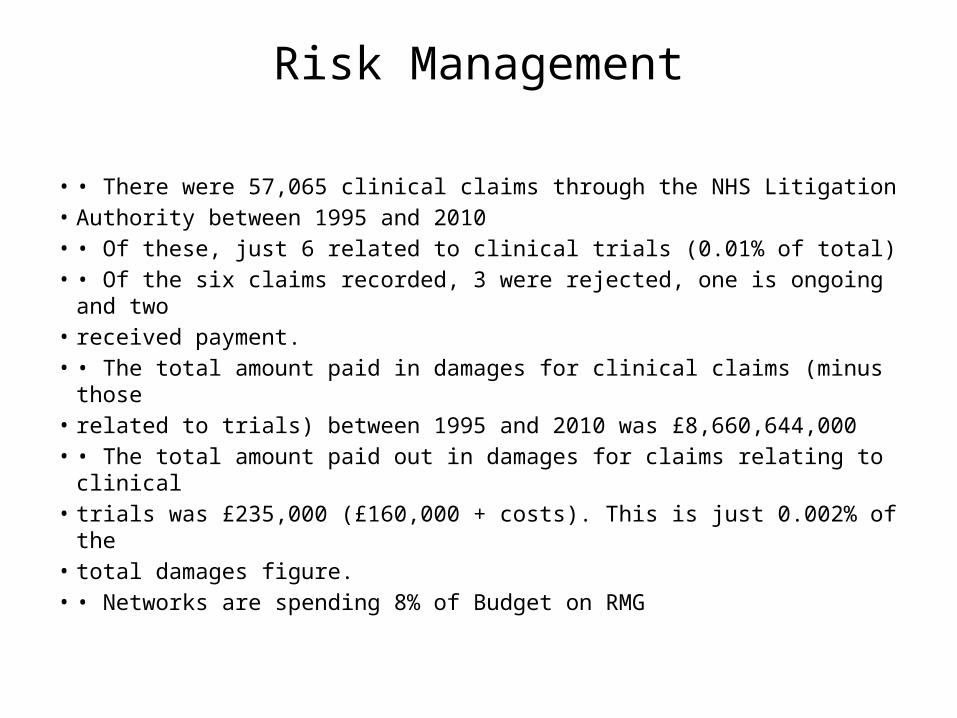
Risk Management
• • There were 57,065 clinical claims through the NHS Litigation• Authority between 1995 and 2010• • Of these, just 6 related to clinical trials (0.01% of total)• • Of the six claims recorded, 3 were rejected, one is ongoing and
two• received payment.• • The total amount paid in damages for clinical claims (minus those• related to trials) between 1995 and 2010 was £8,660,644,000• • The total amount paid out in damages for claims relating to clinical• trials was £235,000 (£160,000 + costs). This is just 0.002% of the• total damages figure.• • Networks are spending 8% of Budget on RMG