evapo-transpiration landfill covers (veg caps) - …evapo-transpiration landfill covers (veg caps)...
TRANSCRIPT
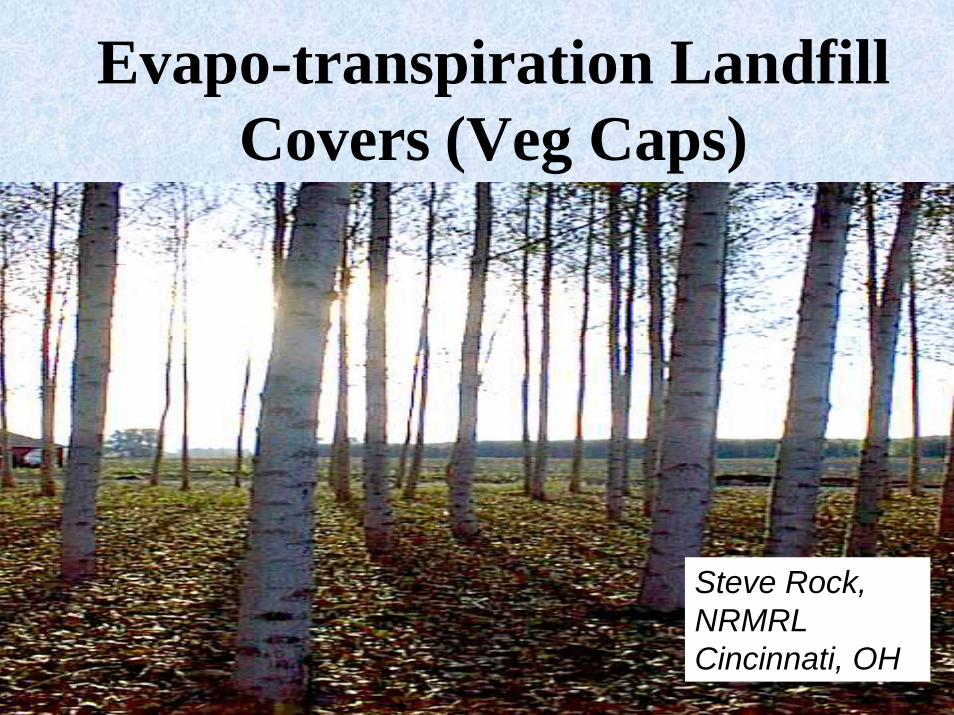
Evapo-transpiration Landfill Covers (Veg Caps)
Steve Rock,NRMRL Cincinnati, OH

Trees, soil and grassesas cover system
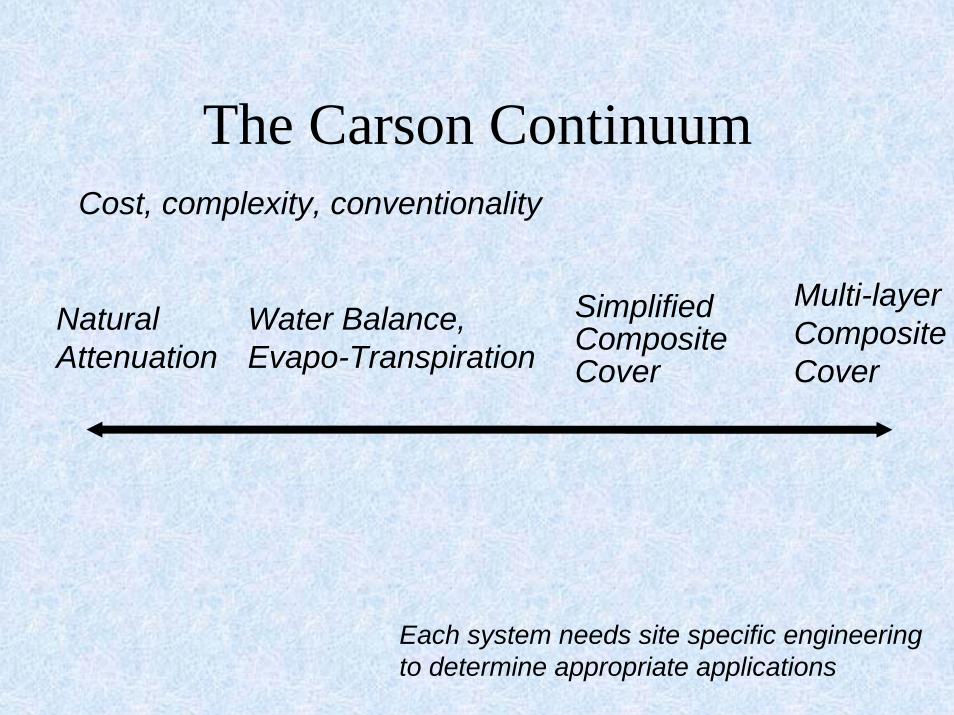
The Carson Continuum Cost, complexity, conventionality
Multi-layerCompositeCover
Simplified Composite Cover
Water Balance, Evapo-Transpiration
NaturalAttenuation
Each system needs site specific engineeringto determine appropriate applications

Regulator Concerns• Prevent:
– physical contact with waste; – GW contamination; – gas escape
• Legal Equivalent to RCRA covers - ARARs• Durability

VEGETATIVE COVER SYSTEMS
DEFINITION
• Long-term, self-sustaining cover of plants growing in and/or over contaminated materials
• Reduces risk to acceptable level• Requires minimal maintenance
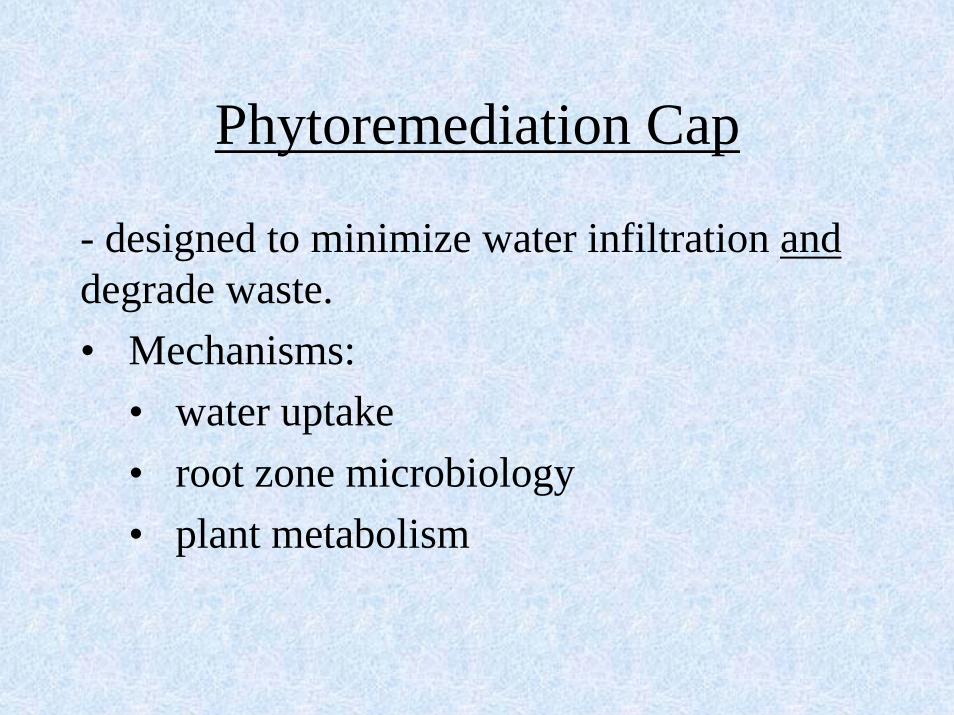
Phytoremediation Cap
- designed to minimize water infiltration anddegrade waste.• Mechanisms:
• water uptake• root zone microbiology• plant metabolism
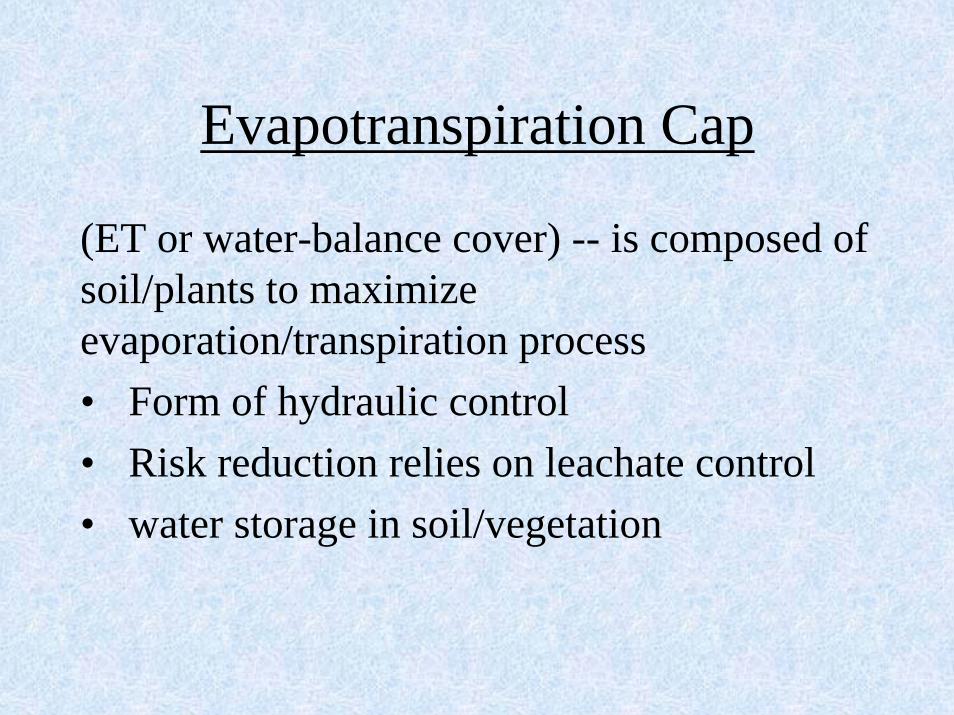
Evapotranspiration Cap
(ET or water-balance cover) -- is composed of soil/plants to maximize evaporation/transpiration process• Form of hydraulic control• Risk reduction relies on leachate control• water storage in soil/vegetation

Infiltration Control from a Vegetative Cover.DURING RAIN
EVENTAFTER RAIN
EVENTSTART OF RAIN
EVENT
Run-Off
Shallow Infiltration
Evapotranspiration
Root-Zone
Water storage in soil
InterceptionCapacity
ExceededInterceptedRain

Tree Root Penetration Over Time
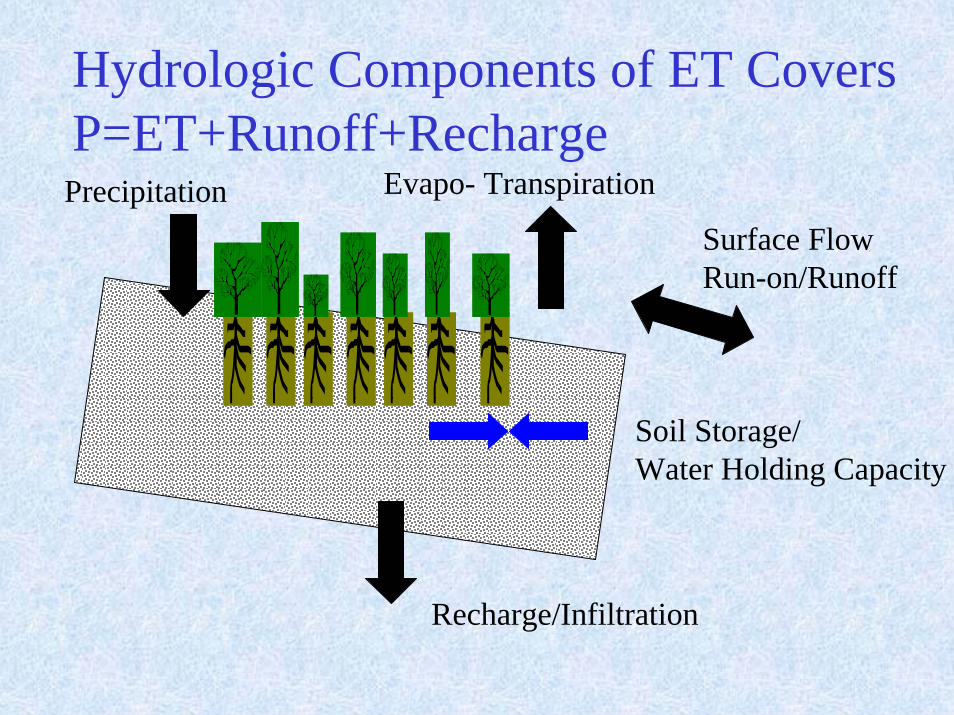
Hydrologic Components of ET CoversP=ET+Runoff+Recharge
Evapo- TranspirationPrecipitationSurface FlowRun-on/Runoff
Soil Storage/Water Holding Capacity
Recharge/Infiltration

What should you look for in a Veg Cover Design Plan?
• Soil• Climate• Plant selection• Planting Plan• O and M, and Contingencies• Modeling

Soil
• Water Holding Capacity (Inches or %)
• Grain Size• Organic Content• Nutrient analysis

Climate
• Precipitation– annual total– monthly distribution
• Growing Season• Potential Evapo-
transpiration– sun– humidity– wind

Annual Precipitation in Inches
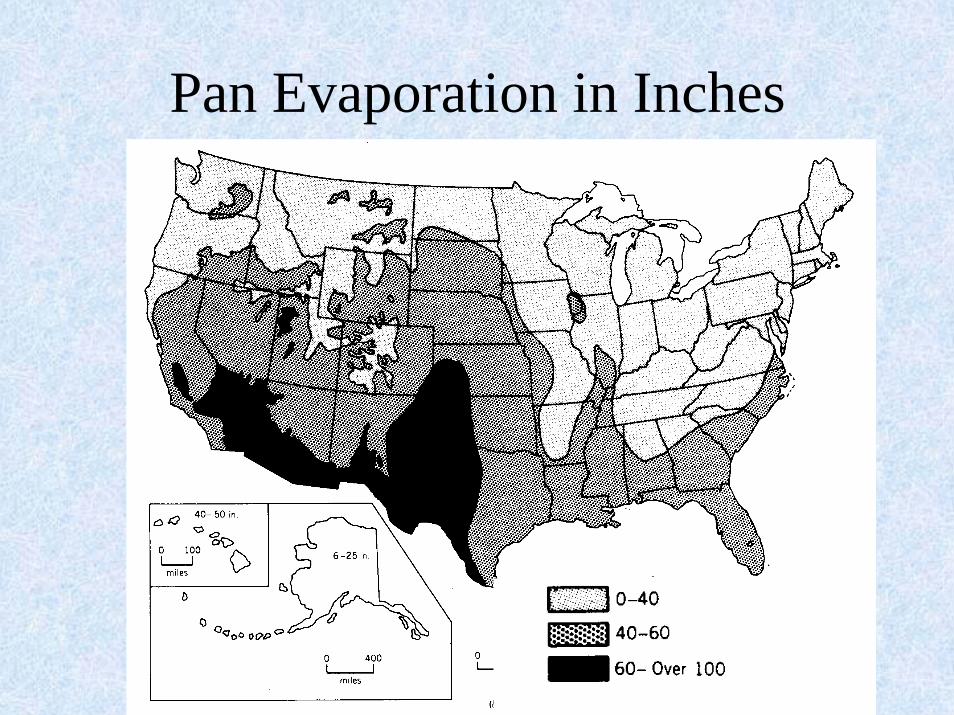
Pan Evaporation in Inches

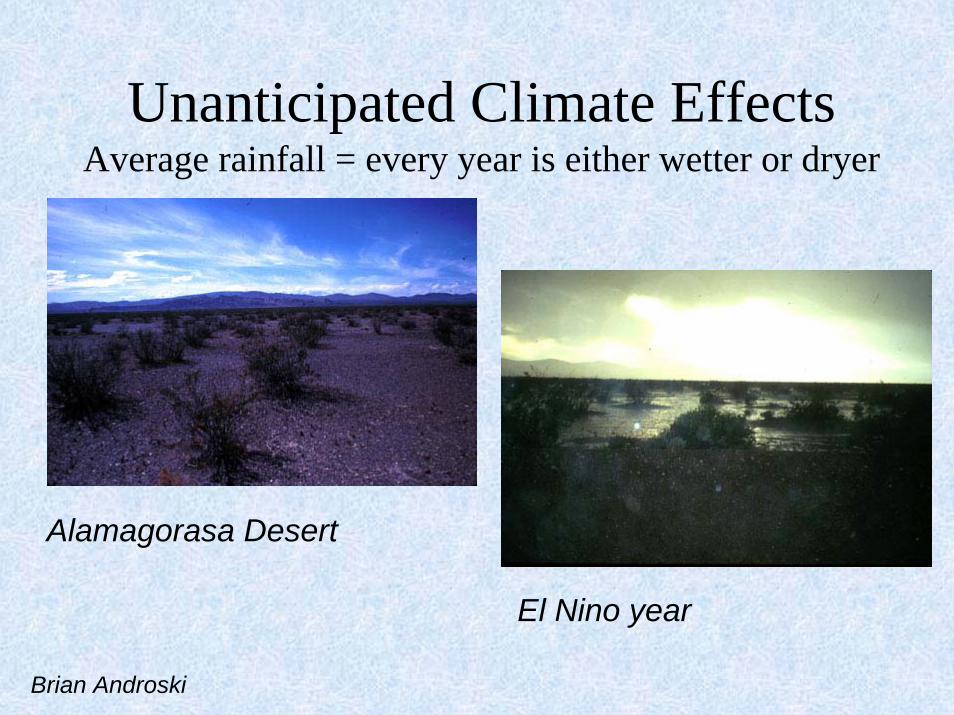
Unanticipated Climate EffectsAverage rainfall = every year is either wetter or dryer
Alamagorasa Desert
El Nino year
Brian Androski
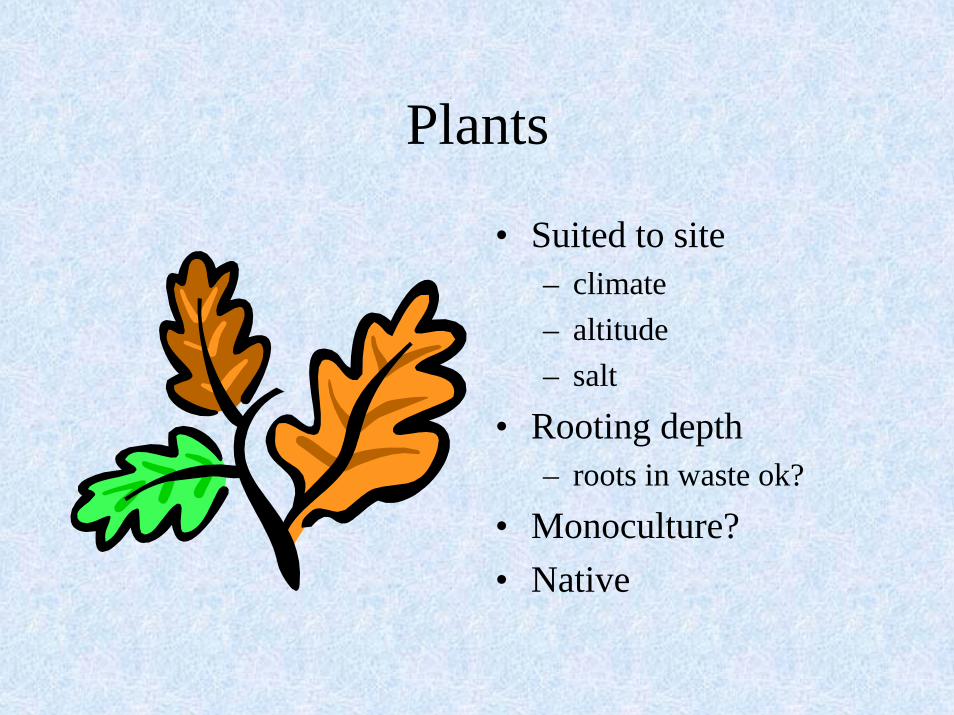
Plants
• Suited to site– climate– altitude– salt
• Rooting depth– roots in waste ok?
• Monoculture?• Native

Design for Arid and Semi-Arid Climates (<20”)
• Unconsolidated native soil to frost line
• Mixed Local plants: Prairie grasses
• Shallow root zone; 70% in top three feet
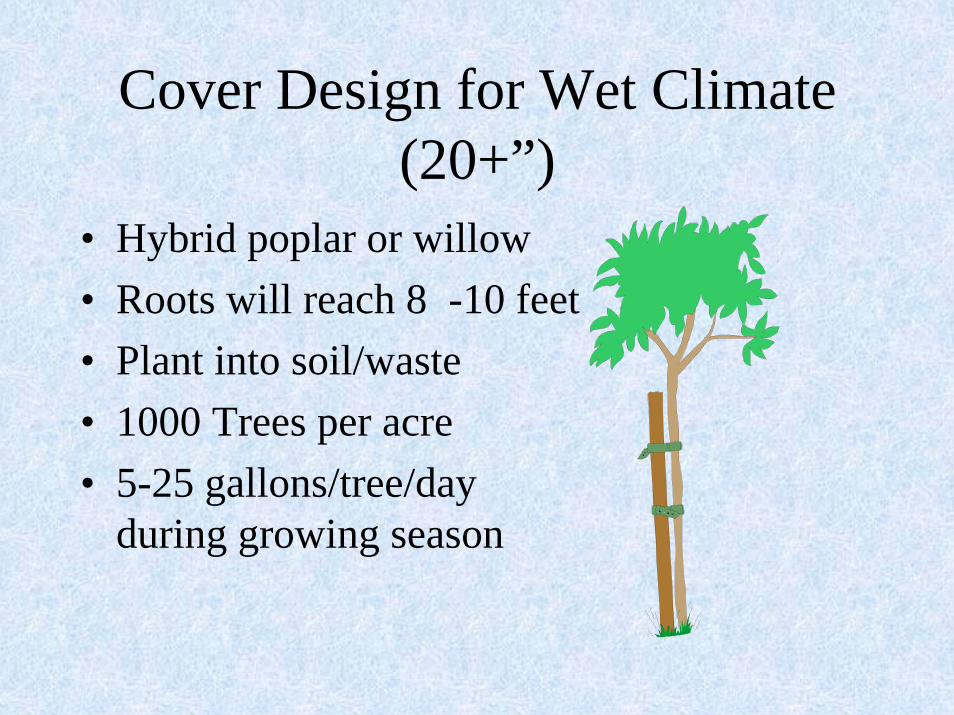
Cover Design for Wet Climate (20+”)
• Hybrid poplar or willow• Roots will reach 8 -10 feet• Plant into soil/waste• 1000 Trees per acre • 5-25 gallons/tree/day
during growing season

Planting Plan• Timing• Soil Amendments• Technique• First Season TLC
– irrigation– weed control– Herbivore Control
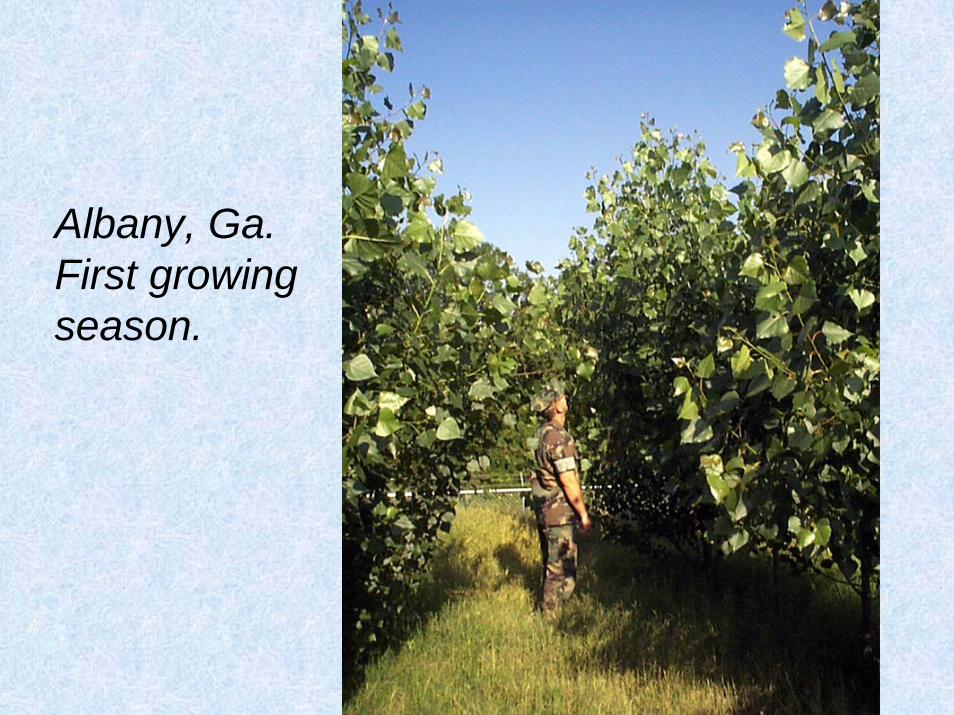
Albany, Ga.First growing season.

O & M, Contingencies
• Replacement (10-20%)• Inspections
– animals– insects– nutrient, water stress
• Thinning/pruning• Mowing
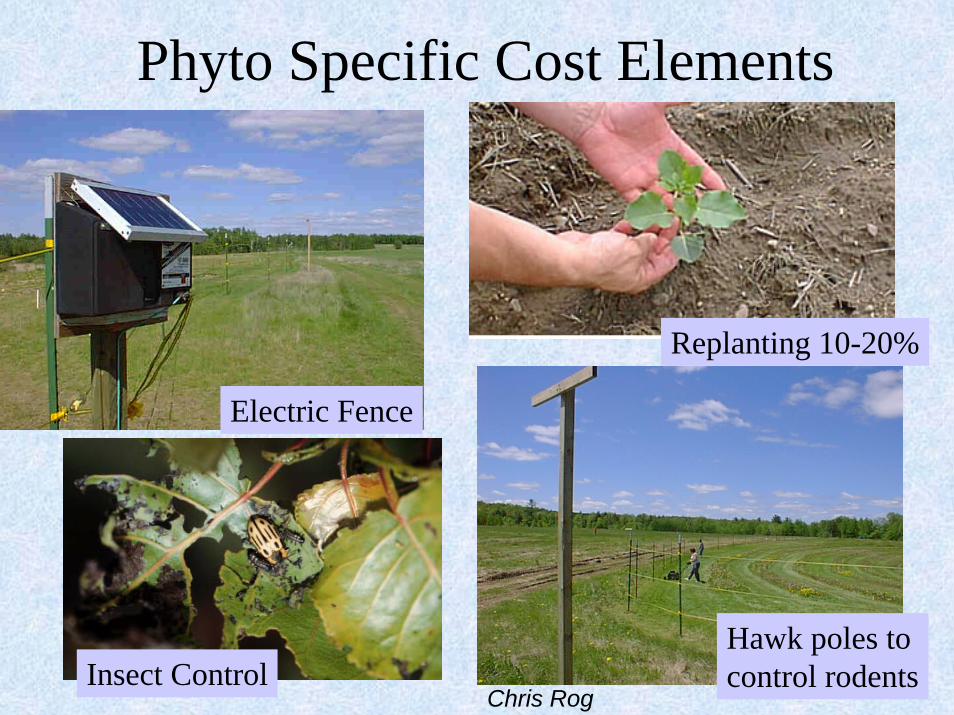
Phyto Specific Cost Elements
Replanting 10-20%
Electric Fence
Hawk poles to control rodents
Chris RogInsect Control

Models
• HELP• EPIC• UnSat-H• Hydrus 2d
• Home-grown

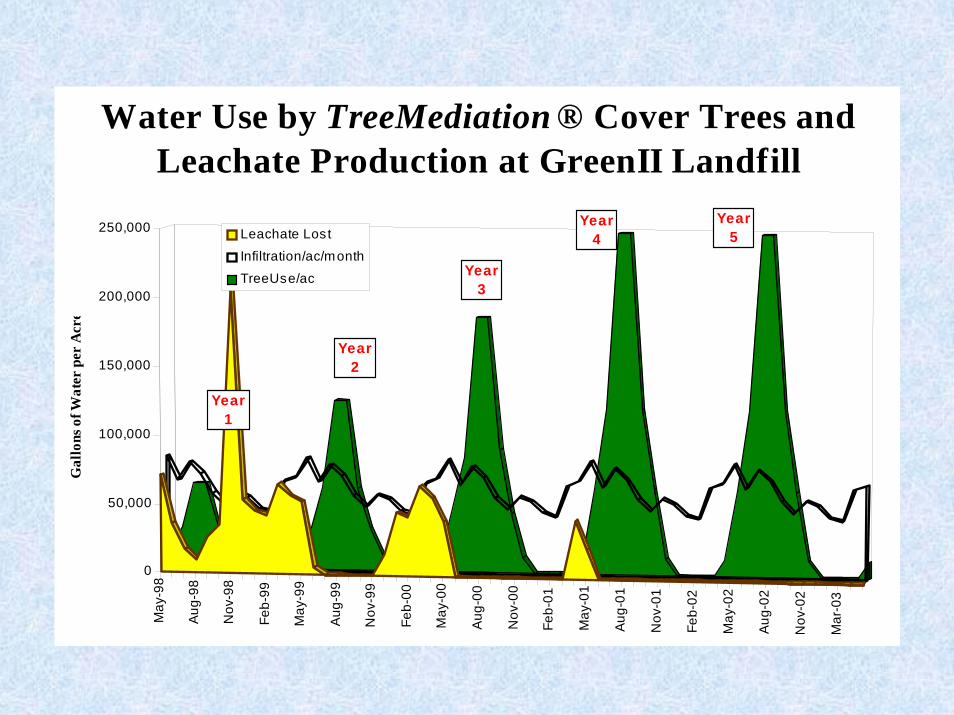
Third Growing Season Water Use by TreeMediation® Cover Treeand Leachate Production at GreenII Landfill
Month/Yr May-00 Jun-00 Jul-00 Aug-00 Sep-00 Oct-00 Nov-00 Dec-00 Jan-01 Feb-01 Mar-01 Apr-01Inches Rain 4.61 3.62 4.37 3.92 3.14 2.67 3.17 2.98 2.52 2.37 3.63 3.82
Rain/ac/month 125,180 98,297 118,663 106,444 85,264 72,501 86,078 80,919 68,428 64,355 98,569 103,728Runoff/ac/month 41,727 32,766 39,554 35,481 28,421 24,167 28,693 26,973 22,809 21,452 32,856 34,576
Infiltration/ac/month 83,453 65,532 79,109 70,962 56,842 48,334 57,385 53,946 45,619 42,903 65,713 69,152TreeUse/ac 43,400 84,000 186,000 186,000 90,000 43,400 12,000 0 0 0 0 12,000
Leachate Stored/month 40,053 -18,468 -106,891 -115,038 -33,158 4,934 45,385 53,946 45,619 42,903 65,713 57,152Potential Water stored 474,517 415,996 309,104 194,067 160,909 165,843 211,229 265,175 310,793 353,697 419,409 476,562
Water Stored 434,464 415,996 309,104 194,067 160,909 165,843 211,229 265,175 310,793 353,697 419,409 434,464Leachate Lost 40,053 0 0 0 0 0 0 0 0 0 0 42,098
20 0 0 030 15 7 2Gallons/day/tree @200_trees/ac
7 14 30
May
-98
Aug-
98
Nov
-98
Feb-
99
May
-99
Aug
-99
Nov
-99
Feb-
00
May
-00
Aug
-00
Nov
-00
Feb-
01
May
-01
Aug-
01
Nov
-01
Feb-
02
May
-02
Aug-
02
Nov
-02
Mar
-03
0
50,000
100,000
150,000
200,000
250,000
Gal
lons
of W
ater
per
Acr
e
Water Use by TreeMediation ® Cover Trees and Leachate Production at GreenII Landfill
Leachate Lost
Infiltration/ac/month
TreeUse/ac
Year1
Year2
Year3
Year4
Year5
When is an ET Cap Appropriate?
• A) Where Water Balance is protective of groundwater.
• B) When Gas Capture is not an issue.• C) Where conventional covers may not be
feasible.• E) All of the above.

Monitoring ET Covers
Recharge/Infiltration=lysimeter bottom drain tipping bucket
Soil Storage/Water Holding Capacity=soil moisture probes
Precipitation=Rain gauge
Evapo- Transpiration=Weather Station w Penman Equation
Surface FlowRun-on/Runoff=weir collection

Vadose Zone Monitoring Station
DataloggerMinirhizotronAccess Tube
GeosyntheticRoot Barrier
Soil WaterPressureSensor
Soil Moisture Probe
Soil Temperature Sensor


Checking grade of the subgrade near sump.
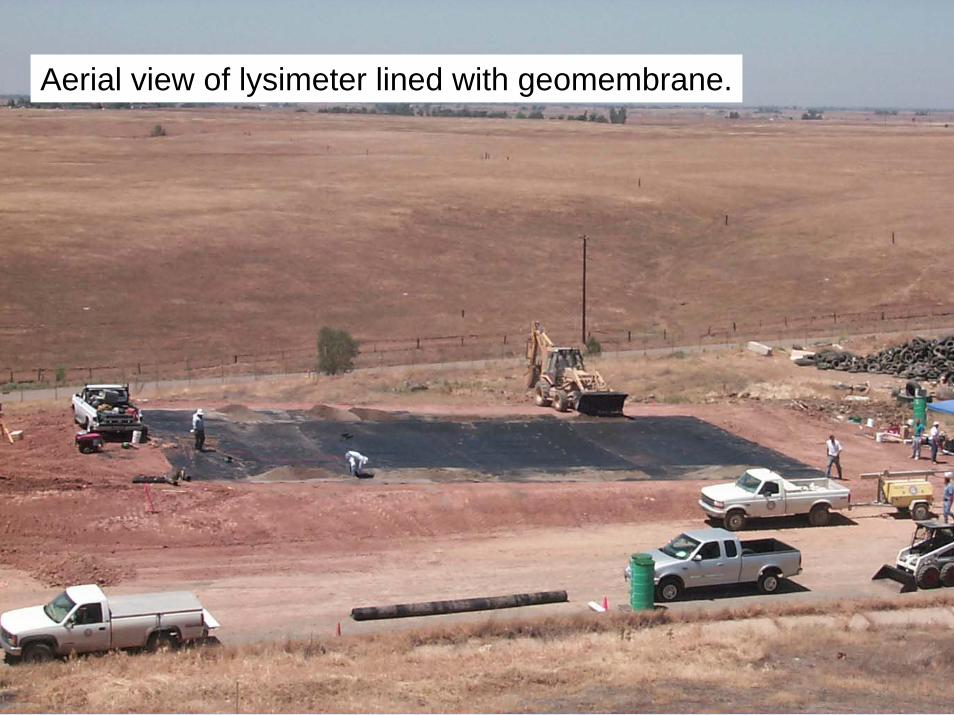
Aerial view of lysimeter lined with geomembrane.
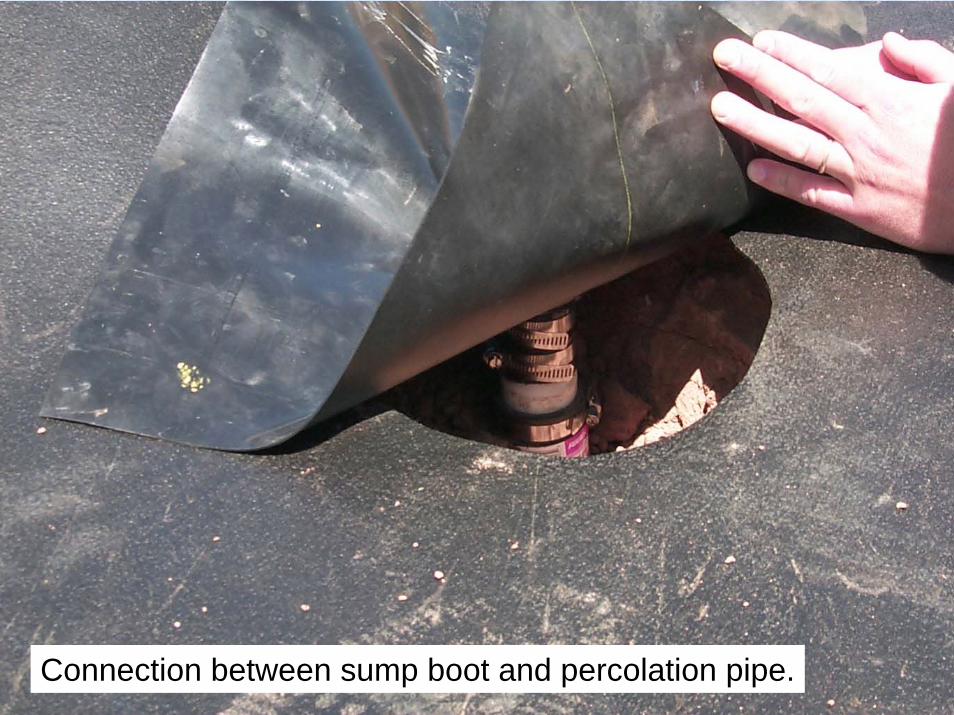
Connection between sump boot and percolation pipe.
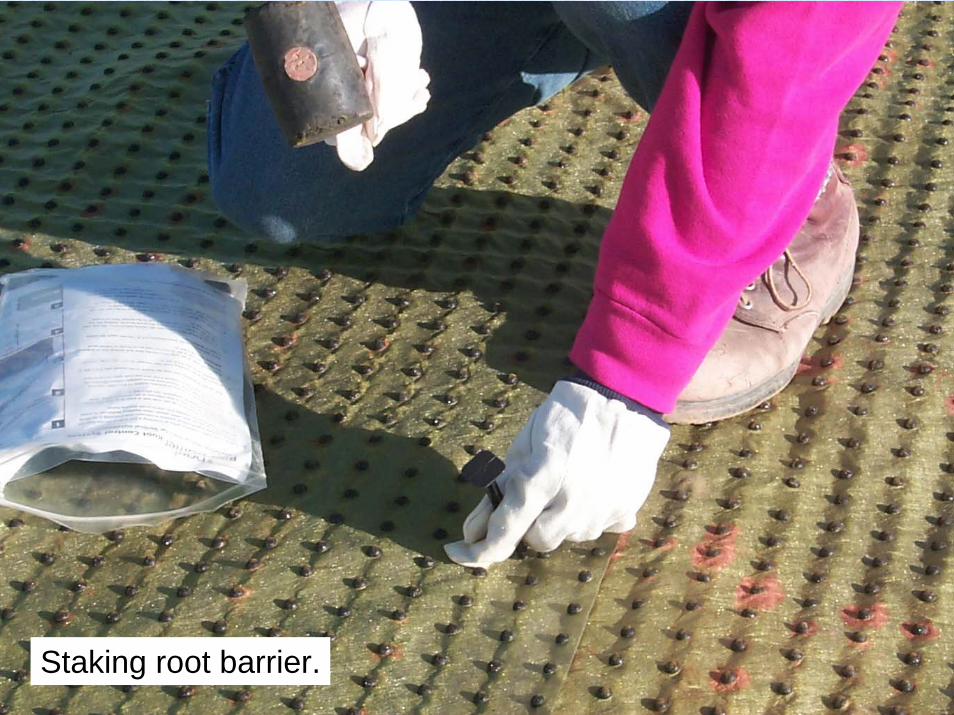
Staking root barrier.
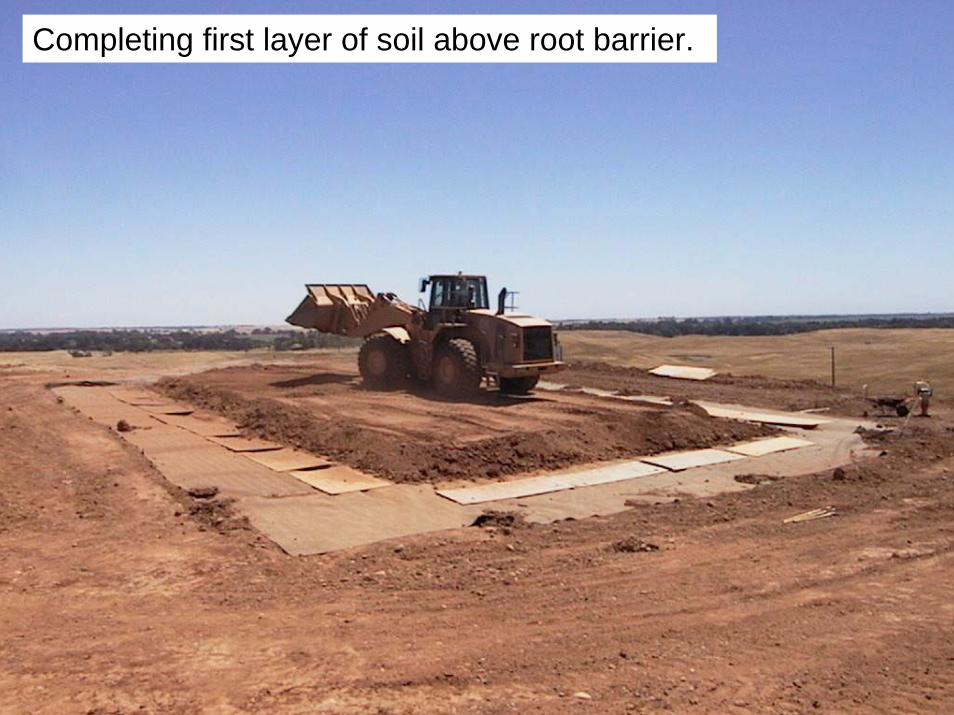
Completing first layer of soil above root barrier.

Placing soil along braced sidewall geomembrane.


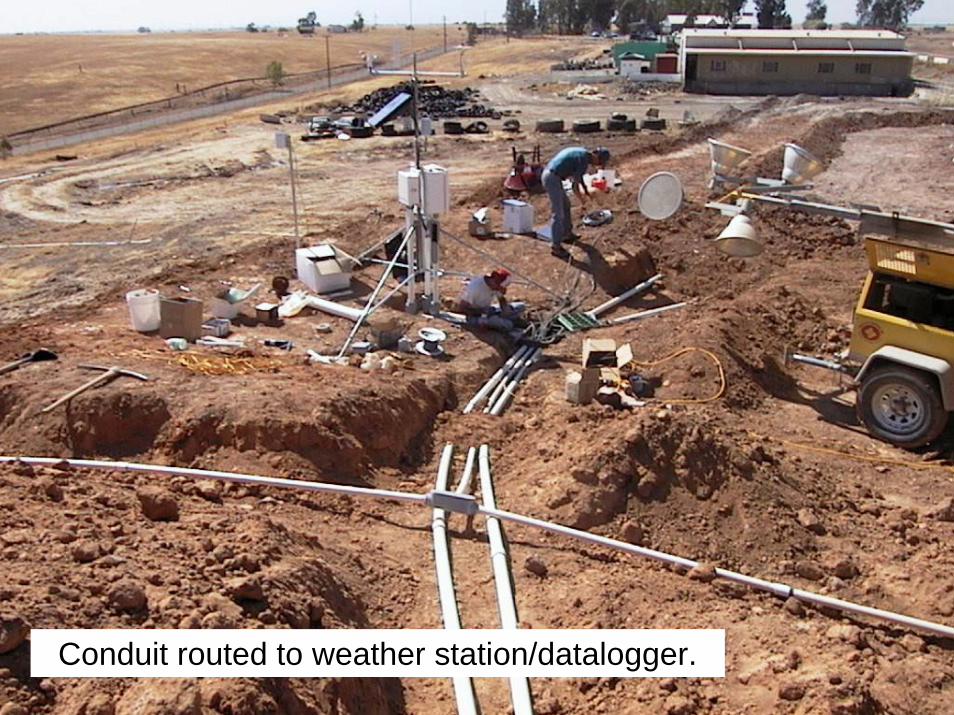
Conduit routed to weather station/datalogger.


Complete
ACAP SITES
By Others
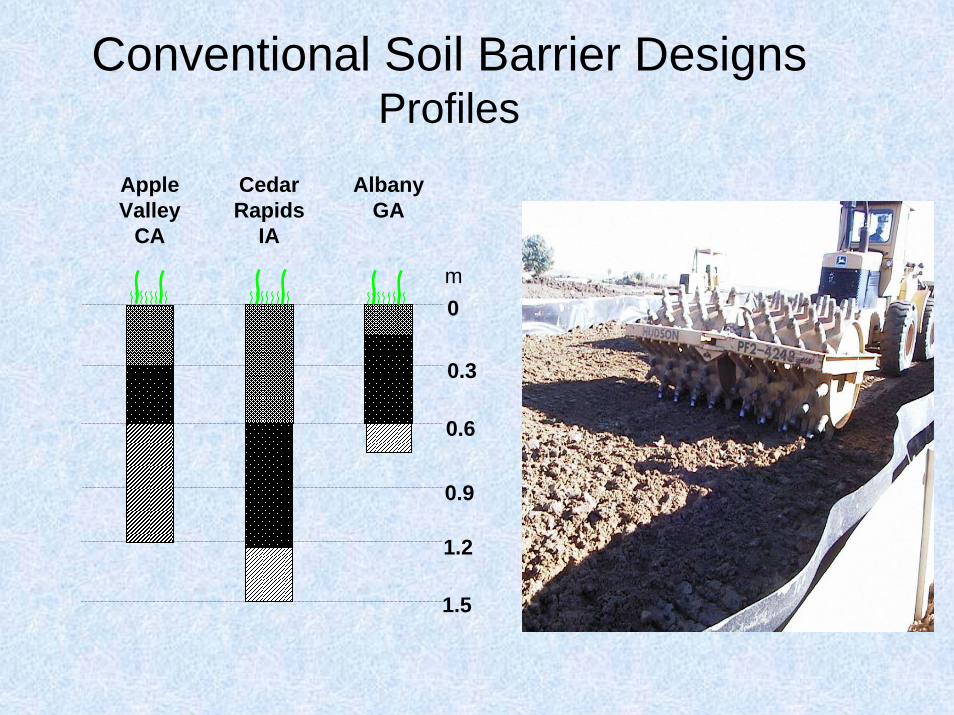
Conventional Soil Barrier DesignsProfiles
0
0.3
0.6
0.9
1.2
1.5
m
Cedar Rapids
IA
AlbanyGA
Apple Valley
CA
2.4
2.7
0
0.3
0.6
0.9
1.2
1.5
1.8
2.1
m
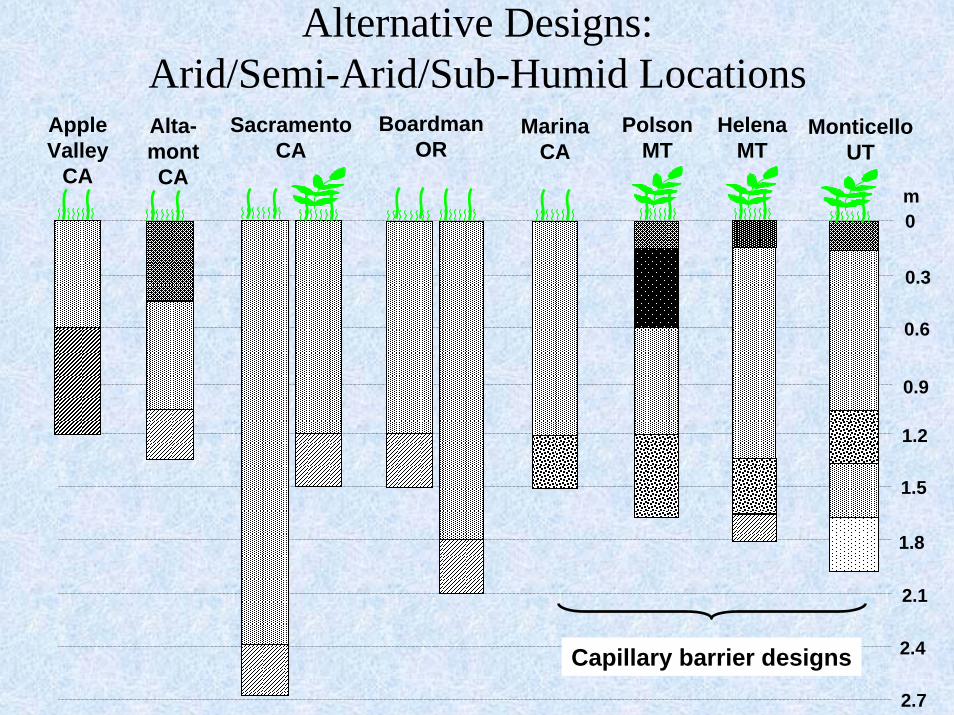
SacramentoCA
BoardmanOR
PolsonMT
MonticelloUT
Alta-montCA
HelenaMT
Apple Valley
CA
MarinaCA
Alternative Designs: Arid/Semi-Arid/Sub-Humid Locations
Capillary barrier designs

Water Balance ComponentsAlternative Cover, Marina CA
0
250
500
750
1000
1/2/00 1/1/01 1/1/02 1/1/03 1/1/04
(mm
wat
er)
0
100
200
300
400
Percolation
Soil Moisture
Precipitation
•• Water storage Water storage capacity lower than capacity lower than expectedexpected
•• Effective storage Effective storage capacity (300 mm) capacity (300 mm) lower than calculated lower than calculated (385 mm) (385 mm)
•• Drainage when Drainage when storage capacity storage capacity exceededexceeded
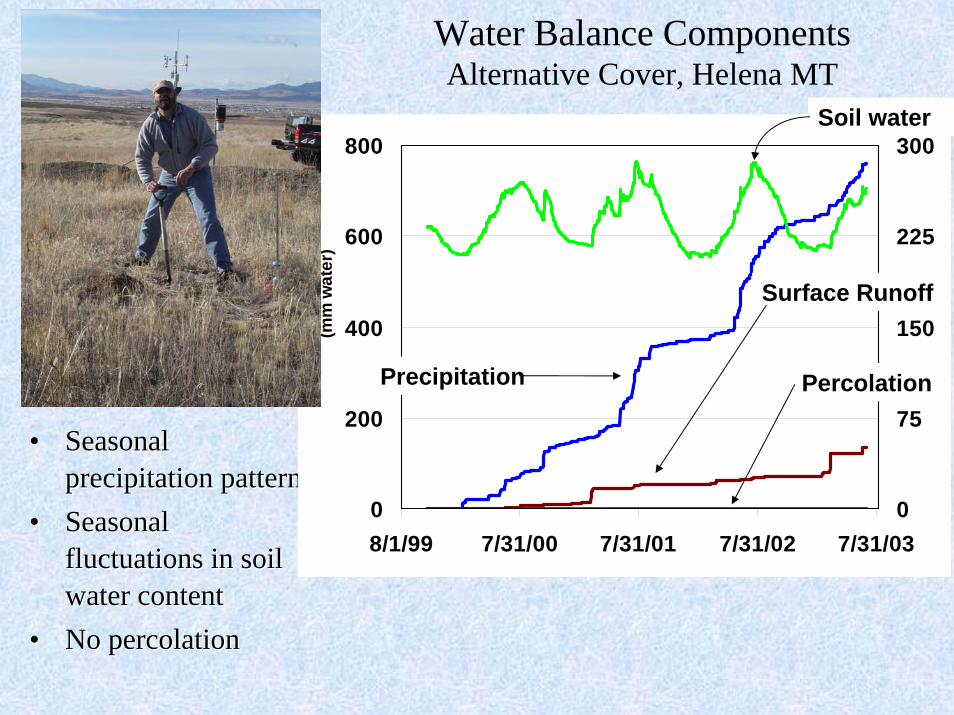
Water Balance ComponentsAlternative Cover, Helena MT
•• Seasonal Seasonal precipitation patternprecipitation pattern
•• Seasonal Seasonal fluctuations in soil fluctuations in soil water contentwater content
•• No percolationNo percolation
0
200
400
600
800
8/1/99 7/31/00 7/31/01 7/31/02 7/31/03
(mm
wat
er)
0
75
150
225
300
Precipitation
Soil water
Percolation
Surface Runoff

Alternative Designs: Humid Locations
0
0.3
0.6
0.9
1.2
1.5
m
OmahaNE
Cedar Rapids
IA
AlbanyGA

Alternative Cover PerformanceHumid Locations
Site Percolation (mm/yr)
Albany GA 123(10%)
Cedar Rapids IA 160(18%)
Omaha NE(thin cover)
57(10%)
Omaha NE(thick cover)
33(6%)
(% = percent of precipitation)

Georgia Compacted Clay Cap

Water Balance ComponentsAlternative Cover, Omaha NE
0
400
800
1200
1600
10/1/00 10/1/01 10/1/02
(mm
wat
er)
0
150
300
450
600
Precipitation
Soil water
Percolation
•• Moderate Moderate precipitationprecipitation
•• Percolation occurs Percolation occurs late springlate spring
•• Improvements in Improvements in design and factordesign and factor--ofof--safety considerations safety considerations may provide may provide acceptable acceptable performanceperformance

Equivalency ClauseRCRA requirements “or equivalent”
Equivalent to 10-5 or 10-7 materials, or Equivalent performance.
Paradigm problems. How do you translate a percolation standard into a performance standard?
Where do you measure for equivalence- top of waste or under waste?
What is baseline- or How well do RCRA covers work?
ET Cover/Phyto Web Resources
www.clu-in.org. search for “phytoremediation”; Introductionto Phytoremediation and 12 other documents
www.dri.edu information on ACAP sites
www.itrcweb.org Veg Cap Team, case studies and Technical and Regulatory guidance document in development
www.rdtf.org bibliography and searchable database of sites