evaluation of tv power measurements client: panasonic ... · evaluation of tv power measurements...
TRANSCRIPT

Evaluation of TV Power MeasurementsClient: Panasonic Marketing Europe GmbH 1
Evaluation of TV Power Measurements Client: Panasonic Europe GmbH Final Report
Dr. Lutz Stobbe
Dr.-Ing. Nils F. Nissen
Dipl.-Ing. Andreas Middendorf
Berlin, October 17th, 2008
Fraunhofer IZM Dept. Environmental Engineering Gustav-Meyer-Allee 25, 13355 Berlin, Germany Contact: Dr. Stobbe Tel.: +49.30.46403-139 Fax: +49.30.46403-131 E-mail: [email protected]

Evaluation of TV Power MeasurementsClient: Panasonic Marketing Europe GmbH 2
Table of Contents
1 Introduction 3 1.1 Power Consumption of TVs 3 1.2 Objective and Tasks 6
2 PART I – Compilation of Input Data 7 2.1 Power Consumption Test Data 7 2.2 Energy Mix and Electricity Costs in the European Union 9 2.2.1 Energy Mix 9 2.2.2 Electricity Price 10 2.2.3 Emission factors 12
3 PART II – Analysis of Test Results 14 3.1 Calculation of the annual power consumption of the tested
TVs 14 3.2 Comparison of annual power consumption per screen size
and test procedure 15 3.3 Annual TV-related electricity costs in EU-27 20 3.4 Evaluation of TV related electricity costs per segment and
region 21
4 Part III: Special Analysis of Eco-Mode measurement results for Panasonic TH-42PX80E 26
4.1 Eco Mode power consumption data 26 4.2 Comparative analysis of Eco Mode power consumption 26 4.3 Comparative analysis of Eco Mode electricity costs 28
5 References 31

Evaluation of TV Power MeasurementsClient: Panasonic Marketing Europe GmbH 3
1 Introduction
1.1 Power Consumption of TVs
According to recent scientific studies television (TV) is a growing contributor to the overall energy consumption in European households. 1 This energy consumption is related to a couple of factors including:
• The increasing number of new TVs in primary use and older TVs in secondary use (household penetration approx. 1.8)
• The shift of viewing IP-Video/TV not on PC-Monitors but TVs, which also increases the overall viewing time in primary and secondary use
• New flat panel display technologies, which enable larger screens sizes but also consume more electricity
• Consumers buying decision, with a strong preference of now available larger screens due to lowering sales prices (average 36” to 50” FPDs)
• Necessary improvement of larger screen size flat panel picture quality based on higher resolution 2 and brightness, better contrast ratio, colour reproduction, and viewing angle
The almost parallel introduction of Liquid Crystal Displays (LCD) and Plasma Display Panels (PDP or Plasma) in the TV market has been a positive situation from an economical point of view. The competition of LCD and Plasma has lead to a fast maturing of both technologies. As a result not only the product quality improved dynamically, the economy of scale improved productivity leading to lower prices with a strong benefit on the consumer side.
The main purchasing criterion of the consumer is the price-performance ratio according to the size, form factor, and resolution of the screen. The picture quality is highly subjective depending on the individual consumer. On a scientific level, a proven methodology for assessing the picture quality is nonexistent, although some research on picture quality has been done by the
1 Lutz Stobbe et al (2007): Final Reports on EuP Lot 5 Televisions for DG TREN; Sanaee Iyama et al (2008): Final Report on ICT Energy
Efficiency for DG INFSO; 2 Market shift is ongoing from Standard Definition (PAL 720x576), HD-Ready (HDTV 1280x720), to Full HD (HDTV 1920X1080).
Evaluation of TV Power MeasurementsClient: Panasonic Marketing Europe GmbH 4
Advanced PDP Development Centre Corporation (APDC) which was established by leading Japanese PDP manufacturers in July 2003.3
The same lack applies to the problem of correlating power consumption or energy efficiency to the performance (including screen size) and picture quality on flat panel displays. The current debate on climate change, rising energy costs, and growing environmental awareness is placing the issue of power consumption however on the same level at the point of sales. Thus power consumption becomes an important purchasing criterion for consumers when it comes to selecting a Flat Panel TV in Europe. This development will be further increased by upcoming eco-design requirements under the EuP-Directive, which may include an energy efficiency requirement and labelling for TVs.
Not only against that background have manufacturers individually been addressing power consumption and energy efficiency already in technology development and product design. However, it is important to take a holistic approach to this topic. This means that not only the power consumption in the use phase needs to be reduced. The energy and resource efficiency over the whole product life cycle – from materials and manufacturing, distribution and use, to take back and recycling – needs proper consideration.
An energy efficiency benchmark requires in that respect a product performance and quality correlation. Televisions are still products with a considerably high investment factor for the consumer. This relates to the 10 to 15 years average use duration in European households. Over this long period of time the picture quality should not deteriorate and the overall reliability should be assured. Furthermore, the functionality or growing convergence of functionality is a benchmark factor. Although the main part of the power consumption is related to the actual screen size of the TV, the integrated functionality such as digital tuners and video recording capabilities has to be considered as well.
Finally, the power consumption of TVs must be measured under realistic and equal conditions. An important step in that direction was the revision of the IEC test standard 62087. For the first time the revised test standard considers fluctuating power consumption of self-emissive display technologies such as CRT and PDP according to the Average Picture Level (APL). The APL is the average luma (Y) level of the video signal during active scanning time integrated over a frame period; defined as a percentage of the range between reference black and reference white level. In other words, the power consumption increases with brighter and decreases with darker video images (content). Under the revised IEC 62087 test standard the average “out-of-the-box” power consumption should be measured with a standardized dynamic
3 APDC Website: http://www.advanced –pdp.jp/fpd/english.html

Evaluation of TV Power MeasurementsClient: Panasonic Marketing Europe GmbH 5
test signal (video clip) which features 34% APL on average. The test video clip has been developed through multiple user and broadcast profiles. 4 It is assumed that this represents a typical TV content.
With respect to Plasma TVs, the power consumption of the PDP can drop by more than half from its peak value at a high 60% APL, if a low 20% APL video image is displayed.5 This means that on the one hand movies, which might have darker scenes over a prolonged time period, result in less power consumption, and on the other hand sports of news programs, which are usually brighter, result in somewhat higher power consumption.
Against that background Panasonic Marketing Europe GmbH contracted the German VDE Testing and Certification Institute for an independent measurement of power consumption of Panasonic PDP and LCD TVs and similar products of brand name competitors. These test results have been given to Fraunhofer IZM, Department Environmental Engineering, for an evaluation. The following report is presenting the results of this evaluation and discusses the main observations form an independent scientific point of view.
Disclaimer: The evaluation and conclusions in this report are based on the product data – power consumption test measurements of individual TVs – provided by the client to Fraunhofer IZM. The robustness of these product data is assumed.
4 Larry F. Weber (2005): Challenges of Measuring Annual Energy Consumption of TV sets, IDW/AD#05, p. 1430. 5 Lutz Stobbe et al (2007): Final Task 1 Report on EuP Lot 5 Televisions for DG TREN. p. 48.

Evaluation of TV Power MeasurementsClient: Panasonic Marketing Europe GmbH 6
1.2 Objective and Tasks
Panasonic Marketing Europe GmbH has contracted the German VDE Testing and Certification Institute in Offenbach for an independent power consumption measurement of various LCD and PDP televisions. Fraunhofer IZM has been tasked to compile theses measurement results, calculate and evaluate the respective annual consumption in terms of electricity and costs.
The report is divided into two parts and consists of the following tasks.
Part I:
1. Compilation of VDE measurement results in Excel tables and calculation of annual energy consumption based on 4h active (on-mode) and 20h standby (standby-mode) per day with 365 days per year. Provision of diagrams.
2. Compilation of electricity end-user prices in Germany, UK, France, Italy, Spain as well as EU-27 on average for the reference year 2007. In this respect, the energy mix and tax situation and current price development in each of the countries and EU-27 will be shortly analyzed and respective tables of regional cost structure provided.
Part II:
3. Analysis of the calculated annual power consumption data and comparative discussion of the energy performance of LCD and PDP televisions in the same screen size segment, different screen size segments and their order of magnitude.
4. Allocation of electricity costs to tested products. Transferring the test results into a cost based calculation of EU-5 and EU-27 (average) and comparative discussion of results. Consideration of price differences due to different energy mix, tax structure etc.
Part III:
5. Comparison of Eco-Mode measurement results for the Panasonic reference plasma television TH-42PX80E

Evaluation of TV Power MeasurementsClient: Panasonic Marketing Europe GmbH 7
2 PART I – Compilation of Input Data
2.1 Power Consumption Test Data
Panasonic Europe provided Fraunhofer IZM with the VDE test report for the measurement of 9 TV-sets structured in two main groups. The VDE test report included power consumption test data for:
• 3 TVs x 32”- Full HD LCD
• 6 TVs x 40/42”- HD Ready LCD and PDP
Table 1 below provides a structured overview of the basic product data according to manufacturer, product designation, display type, size and resolution. Please note that Fraunhofer IZM could not verify the exact visible screen surface area (in Inch²), and resolution (pixel) of the tested products. For the purpose of the study we allocated a product code to the actual product type designation.
Table 1: Basic Product Data
No Product
Manufacturer Product Name
Type Designation Display
Type & Size6 Display
Resolution Product Code
Report Designation
1 Panasonic TX‐32LZD85F 32" LCD (438in²) 1920x1080p 32 LCD FHD [A]
2 Samsung LE‐32A659 32" LCD (438in²) 1920x1080p 32 LCD FHD [B]
3 Sony KDL‐32W4000E 32" LCD (438in²) 1920x1080p 32 LCD FHD [C]
4 Samsung LE‐40A456 C2D 40" LCD (684in²) 1366x768 40 LCD HDR [B]
5 Panasonic TH‐42PX80E 42" PDP (754in²) 1024x768 42 PDP HDR [A]
6 Samsung PS‐42A457 P1D 42" PDP (754in²) 1024x768 42 PDP HDR [B]
7 LG 42PG6000 42" PDP (754in²) 1024x768 42 PDP HDR [D]
8 LG 42LG3000 42" LCD (754in²) 1366x768 42 LCD HDR [D]
9 JVC 42DA9BU 42" LCD (754in²) 1366x768 42 LCD HDR [E]
The power consumption test measurements differentiated two general operation modes – standby and on-mode – and various test conditions.
6 The screen size of the display is one reference factor for energy consumption requirements under the EuP-Directive. The screen
surface area is usually calculated in Inch² or dm²: 32“TV-display in format 16:9 equals 438 in² or 28.26 dm²; 40”TV-display in format 16:9 equals 684 in² or 44.13 dm²; 42”TV-display in format 16:9 equals 754 in² or 48.65 dm² respectively.

Evaluation of TV Power MeasurementsClient: Panasonic Marketing Europe GmbH 8
The standby-mode measurements have been made based on static test video signal (colour bars or black-white level video signal) with the product in standard mode setting (out-of-the-box). The video signal determines the uniform mode before the standby-mode is activated and measured.
Two on-mode measurements have been made with standard picture setting “out-of-the-box”:
• On-mode 1: Standard TV setting, out-of-the-box, IEC 62087 Ed. 2.07 applying a dynamic video signal (10 minutes test video clip broadcast content 11.6)
• On-mode 2: Standard TV setting, out-of-the-box, Harry Potter movie video clip (60 minutes movie video clip “Harry Potter und der Orden des Phönix”).
Table 2 shows the test measurement results for the power consumption per mode that have been taken from the VDE documentation and compiled in ascending order according to screen size.
Table 2: Power consumption per mode (VDE test results)
Mode Standby‐mode On‐Mode 1 On‐mode 2 Test Standard colour bar IEC 62087 video Harry Potter video Setting out‐of‐the‐box out‐of‐the‐box out‐of‐the‐box No Product Code Average in Watts Average in Watts Average in Watts 1 32 LCD FHD [A] 0.35 120.00 121.00 2 32 LCD FHD [B] 0.77 137.00 135.00 3 32 LCD FHD [C] 0.23 133.00 124.00 4 40 LCD HDR [B] 1.01 191.00 189.00 5 42 PDP HDR [A] 0.59 214.00 120.00 6 42 PDP HDR [B] 0.89 248.00 166.00 7 42 PDP HDR [D] 0.84 255.00 161.00 8 42 LCD HDR [D] 0.76 203.00 202.00 9 42 LCD HDR [E] 0.71 193.00 194.00
7 IEC 62087 (100/1331/CDV 2008-04): Methods of measurement for the power consumption of audio, video and related equipment
Evaluation of TV Power MeasurementsClient: Panasonic Marketing Europe GmbH 9
2.2 Energy Mix and Electricity Costs in the European Union
Fraunhofer IZM has been tasked to compile current data on the energy mix and related electricity prices for the main European Union member states (Germany [DE], France [FR], Italy [IT], Spain [ES], and the United Kingdom [UK]) as well as on average for EU-27.
2.2.1 Energy Mix
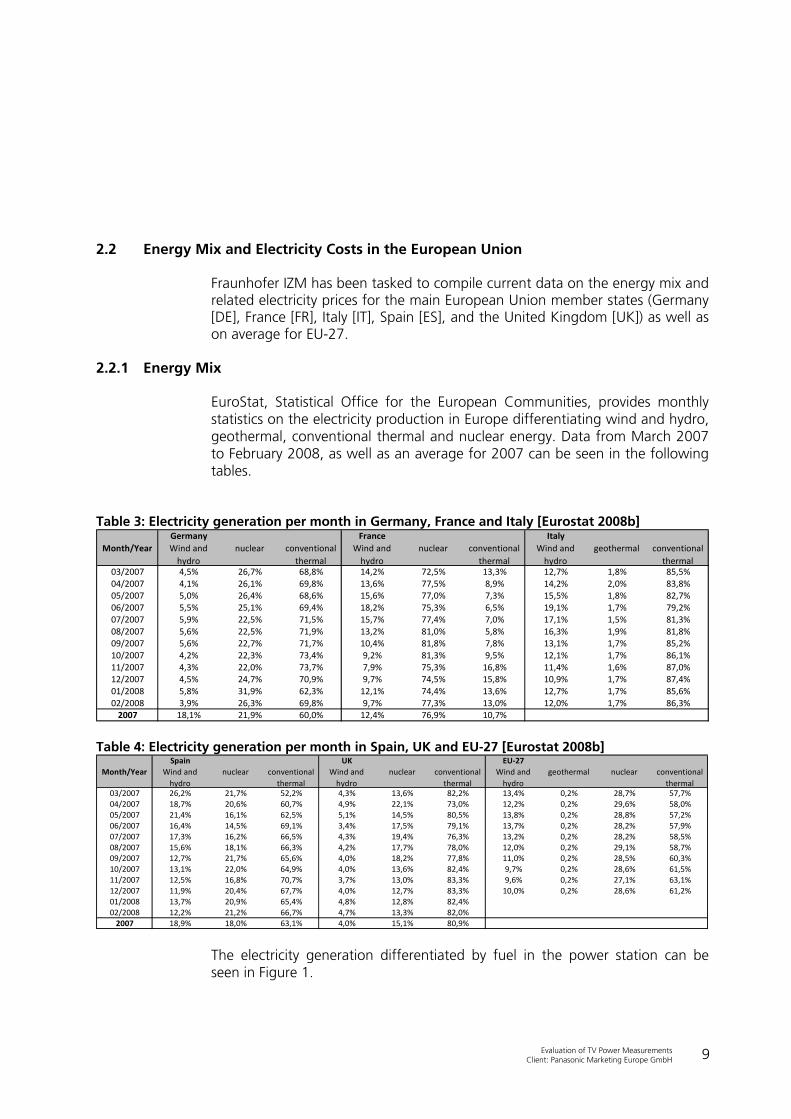
EuroStat, Statistical Office for the European Communities, provides monthly statistics on the electricity production in Europe differentiating wind and hydro, geothermal, conventional thermal and nuclear energy. Data from March 2007 to February 2008, as well as an average for 2007 can be seen in the following tables.
Table 3: Electricity generation per month in Germany, France and Italy [Eurostat 2008b] Germany France Italy
Month/Year Wind and hydro
nuclear conventional thermal
Wind and hydro
nuclear conventional thermal
Wind and hydro
geothermal conventional thermal
03/2007 4,5% 26,7% 68,8% 14,2% 72,5% 13,3% 12,7% 1,8% 85,5%04/2007 4,1% 26,1% 69,8% 13,6% 77,5% 8,9% 14,2% 2,0% 83,8%05/2007 5,0% 26,4% 68,6% 15,6% 77,0% 7,3% 15,5% 1,8% 82,7%06/2007 5,5% 25,1% 69,4% 18,2% 75,3% 6,5% 19,1% 1,7% 79,2%07/2007 5,9% 22,5% 71,5% 15,7% 77,4% 7,0% 17,1% 1,5% 81,3%08/2007 5,6% 22,5% 71,9% 13,2% 81,0% 5,8% 16,3% 1,9% 81,8%09/2007 5,6% 22,7% 71,7% 10,4% 81,8% 7,8% 13,1% 1,7% 85,2%10/2007 4,2% 22,3% 73,4% 9,2% 81,3% 9,5% 12,1% 1,7% 86,1%11/2007 4,3% 22,0% 73,7% 7,9% 75,3% 16,8% 11,4% 1,6% 87,0%12/2007 4,5% 24,7% 70,9% 9,7% 74,5% 15,8% 10,9% 1,7% 87,4%01/2008 5,8% 31,9% 62,3% 12,1% 74,4% 13,6% 12,7% 1,7% 85,6%02/2008 3,9% 26,3% 69,8% 9,7% 77,3% 13,0% 12,0% 1,7% 86,3%2007 18,1% 21,9% 60,0% 12,4% 76,9% 10,7%
Table 4: Electricity generation per month in Spain, UK and EU-27 [Eurostat 2008b]
Spain UK EU‐27Month/Year Wind and
hydronuclear conventional
thermalWind and hydro
nuclear conventional thermal
Wind and hydro
geothermal nuclear conventional thermal
03/2007 26,2% 21,7% 52,2% 4,3% 13,6% 82,2% 13,4% 0,2% 28,7% 57,7%04/2007 18,7% 20,6% 60,7% 4,9% 22,1% 73,0% 12,2% 0,2% 29,6% 58,0%05/2007 21,4% 16,1% 62,5% 5,1% 14,5% 80,5% 13,8% 0,2% 28,8% 57,2%06/2007 16,4% 14,5% 69,1% 3,4% 17,5% 79,1% 13,7% 0,2% 28,2% 57,9%07/2007 17,3% 16,2% 66,5% 4,3% 19,4% 76,3% 13,2% 0,2% 28,2% 58,5%08/2007 15,6% 18,1% 66,3% 4,2% 17,7% 78,0% 12,0% 0,2% 29,1% 58,7%09/2007 12,7% 21,7% 65,6% 4,0% 18,2% 77,8% 11,0% 0,2% 28,5% 60,3%10/2007 13,1% 22,0% 64,9% 4,0% 13,6% 82,4% 9,7% 0,2% 28,6% 61,5%11/2007 12,5% 16,8% 70,7% 3,7% 13,0% 83,3% 9,6% 0,2% 27,1% 63,1%12/2007 11,9% 20,4% 67,7% 4,0% 12,7% 83,3% 10,0% 0,2% 28,6% 61,2%01/2008 13,7% 20,9% 65,4% 4,8% 12,8% 82,4%02/2008 12,2% 21,2% 66,7% 4,7% 13,3% 82,0%2007 18,9% 18,0% 63,1% 4,0% 15,1% 80,9%
The electricity generation differentiated by fuel in the power station can be seen in Figure 1.

Evaluation of TV Power MeasurementsClient: Panasonic Marketing Europe GmbH 10
Figure 1: Electricity generation in EU-27 by fuel used in power stations, 2005 [EuroStat 2008a]
The regional difference in the energy mix and respective prices is a complex topic. Take the example of renewable energy. The amount of wind or sun depends not only on the location, but on the season as well. Other renewable energy sources such as biomass are not (in the same amount) available over the whole year. The price for renewable energy sources is also influenced by certain commissions (fixed refunds or remuneration), which vary from member state to member state.
2.2.2 Electricity Price
The electricity price across the European Union varies to a large extent. There is also a price difference between commercial and industrial clients on the one hand and private and households on the other hand. The price difference per regional or EU member state depends amongst others on:
• Energy production and respective energy mix (individual member state costs of energy source as input factor)
• Level of taxation or commissions differentiated also by energy source (individual member state’s environmental and economical consideration)
• Climatic and seasonal differences per member state (the actual consumption factor or demand)
The related electricity price normally changes with differences in the energy mix, but as private households and most industries do not buy electricity on the stock market, but from energy providers with long term contracts, these

Evaluation of TV Power MeasurementsClient: Panasonic Marketing Europe GmbH 11
seasonal changes do not affect the prices for the end-user. On the other hand, increasing prices for fossil fuels, especially oil, do affect the prices for electricity quite quickly, even though oil-fired power stations made up only 4.2% of the electricity generation in 2005 (Figure 1). The following Table 5 and Table 6 show the electricity price development for EU-5 member states and average EU-27 private households (with and without taxes) for the reference years 2001 until 2007 in Cent/kWh.
Table 5: Electricity price for private households, without taxes [Cent/kWh] [Eurostat 2007]
Year Germany France Italy Spain UK EU‐272001 12,20 9,14 15,67 8,59 9,962002 12,61 9,23 13,90 8,59 10,312003 12,67 8,90 14,49 8,72 9,592004 12,59 9,05 14,34 8,85 8,372005 13,34 9,05 14,40 9,00 8,36 10,132006 13,74 9,05 15,48 9,40 9,71 10,682007 14,33 9,21 16,58 10,04 12,54 11,72
Table 6: Electricity price for private households, including taxes [Cent/kWh] [Eurostat 2007]
Year Germany France Italy Spain UK EU‐272001 15,99 11,54 20,21 10,48 10,442002 16,70 11,65 19,01 10,47 10,832003 17,08 11,62 19,84 10,63 10,062004 16,98 11,94 19,50 10,79 8,782005 17,85 11,94 19,70 10,97 8,77 13,362006 18,32 12,05 21,08 11,47 10,20 13,972007 19,49 12,11 23,29 12,25 13,16 15,28
For comparison, the Table 7 shows electricity prices for industry in the same time period.
Table 7: Electricity prices for industry, including taxes (without VAT) [Cent/kWh] [Eurostat 2007]
Year Germany France Italy Spain UK EU‐272001 7,17 5,57 10,87 5,78 6,612002 7,21 5,62 10,12 5,47 6,402003 8,20 5,62 10,78 5,55 5,632004 8,63 5,78 10,26 5,66 5,012005 9,03 5,78 10,93 7,21 5,93 7,562006 9,94 5,78 12,08 7,57 8,22 8,422007 10,69 5,87 13,87 8,51 9,74 9,20

Evaluation of TV Power MeasurementsClient: Panasonic Marketing Europe GmbH 12
2.2.3 Emission factors
To quantify the impact of electricity generation, the emission factors for lignite, coal, natural gas and other fuel sources are needed. Thereby the emission factor depends not only on the fuel, but also on the technology and the efficiency of the power plant. Emission factors describe the amount of CO2 emitted per generated kWh and are often used to quantify the impact of electricity generation and consumption on the climate. Thereby the emission factors differ a lot over the wide range of fuels and energy generation technologies. A recent publication from the German Federal Environment Agency [UBA 2007] provides the following emission factors for different fuel incinerations for German power plants in 2002.
Table 8: Emission Factors for German Power plant in 2002 Fuel source Germany 2002
Emission value in grams CO2/kWh
Share of total fuel in %
Gas 202 9.6 Coal 338 22.9
Lignite 404 26.9 Nuclear 0 28.1 Renewable 0 11.0 Oil - 1.5
However, if the incineration efficiency (energy conversion efficiency of 36%) is taken into consideration, the average emission values are much higher. Based on this consideration the overall emission factor for the German energy mix in 2006 was 596 grams CO2/kWh. This somewhat higher level is indicated in respective figures for the electricity production e.g. provided by BP. According to the Carbon Footprint Calculator of BP’s German webpage 8 the respective emission value for gas produced electricity is 920 grams CO2/kWh and for coal 520 grams CO2/kWh. Other sources such as Eurosolar, European Association for Renewable Energies, provide a medium level emission value for gas of 480 grams CO2/kWh. According to a report of the US Department of Energy and Environmental Protection Agency (DoE 2000) 9 on Carbon Dioxide Emissions from the
8 http://www.deutschebp.de/sectiongenericarticle.do?categoryId=9008680&contentId=7016041 9 http://www.eia.doe.gov/cneaf/electricity/page/co2_report/co2emiss.pdf

Evaluation of TV Power MeasurementsClient: Panasonic Marketing Europe GmbH 13
Generation of Electric Power in the United States the emission value for natural gas was 594 grams CO2/kWh. Regarding nuclear and renewable (wind, hydropower, photovoltaic, biomass) energy sources the CO2 emission during incineration is zero. Not included in this assumption is the energy of fossil fuels used for generation, transport, storage and disposal of nuclear materials, or – to take the example of a renewable energy source – during cultivation, harvesting and transport of the biomass. According to a German language Newsletter Article of Eurosolar10 the carbon emission value for electricity made of renewable and nuclear energy sources are:
• Wind: 12 g CO2/kWh • Photovoltaic: 60 g CO2/kWh • Nuclear: 65 g CO2/kWh
10 Solarzeitalter 1/2007 (March 2007): Das Märchen vom CO2-freien Atomstrom, in the internet:
http://www.eurosolar.de/de/index.php?option=com_content&task=view&id=725&Itemid=187

Evaluation of TV Power MeasurementsClient: Panasonic Marketing Europe GmbH 14
3 PART II – Analysis of Test Results
3.1 Calculation of the annual power consumption of the tested TVs
The annual power consumption of the tested TVs is calculated by the following assumption:
• 4h on-mode per day
• 20h standby-mode per day
• 365 days per year
This daily/annual use pattern for calculating the annual power consumption of TVs is commonly accepted in industry and was applied in the EuP TREN Lot 5. Table 9 shows the calculated annual electricity consumption in kWh per year.
Table 9: Calculated annual power consumption (based on VDE test results) Mode On‐Mode 1 On‐mode 2 Test Standard IEC 62087 video Harry Potter video Setting out‐of‐the‐box out‐of‐the‐box No Product Code Average in kWh/a Average in kWh/a1 32 LCD FHD [A] 177.76 179.22 2 32 LCD FHD [B] 205.64 202.72 3 32 LCD FHD [C] 195.86 182.72 4 40 LCD HDR [B] 286.23 283.31 5 42 PDP HDR [A] 316.75 179.51 6 42 PDP HDR [B] 368.58 248.86 7 42 PDP HDR [D] 378.43 241.19 8 42 LCD HDR [D] 301.93 300.47 9 42 LCD HDR [E] 286.96 288.42
Following Figure 2 shows the same results in a diagram. The markings indicate the different products by screen size segment as well as results of the two different test methods IEC 62087 dynamic (on-mode 1) in blue and the Harry Potter video clip (on-mode 2) in red. This diagram provides a visual impression of the difference between the power consumption of LCD-TVs and PDP-TVs according to test procedures.

Evaluation of TV Power MeasurementsClient: Panasonic Marketing Europe GmbH 15
Figure 2: Comparison of the annual power consumption of tested TVs
3.2 Comparison of annual power consumption per screen size and test procedure
A first comparison of the annual power consumption data of the single products (in the same screen size segment) is based on the deviation to the group’s average.
Table 10 shows this comparison for the first group of 32” LCD-TVs. The data-set is calculated based on the “On-Mode 1” measurement results.
Table 10: Comparison of 32" TVs annual power (on-mode 1) On‐Mode 1 On‐Mode 1 No Product Code Average in kWh/a Average in % Deviation 1 32" LCD FHD [A] 177.8 92 ‐8 2 32" LCD FHD [B] 205.6 107 7 3 32" LCD FHD [C] 195.9 101 1
32" Totals 193.1 100 0
The deviation of the three LCD TV models is under ± 10%, which shows the competitiveness of this product group. For Full HD LCD-TVs, an average 193

Evaluation of TV Power MeasurementsClient: Panasonic Marketing Europe GmbH 16
kWh per year is a good result, if compared to previous models of the same size HD-ready TVs.11 The average standby-mode is 0.38 Watts and the average on-mode is 130 Watts.
Table 11 shows the same comparison for the first group of 32” LCD-TVs, however this time for the data-set of the “On-Mode 2” measurement results.
Table 11: Comparison of 32" TVs annual power (on-mode 2) On‐Mode 2 On‐Mode 2 No Product Code Average in kWh/a Average in % Deviation 1 32" LCD FHD [A] 179.2 95 ‐5 2 32" LCD FHD [B] 202.7 108 8 3 32" LCD FHD [C] 182.7 97 ‐3
32" Totals 188.2 100 0
The “On-mode 2” annual power consumption result for the three 32” LCD-TVs are not exactly the same as for the “On-mode 1”measurement results. We could expect actually the same results due to the fact that all three models are equipped with conventional CCFL backlight systems, which in theory consume a constant level of power. In reality slight fluctuations of a couple of Watts are common, due to thermal and electrical power losses. The first two products show this result with a maximum fluctuation of 3 Watt in on-mode power consumption. The third product however shows in comparison to the “on-mode 1” a much larger difference of 9 Watt lower average on-mode power consumption. Over an annual period this difference accumulates to 13 kWh. This is not a big difference, however noticeable in direct comparison of both results. The reason for the difference is unknown. The longer duration of measurement (10 minutes for “on-mode 1” and 60 minutes for “on-mode 2”) could influence the average power consumption. A partial automatic dimming could also be the reason although not likely because the trade-off would be higher. More likely is a slight shift in luminance efficacy through the warming up of the electrical and photonic components over the longer test period in the case of “on-mode 2”.
Table 12 shows the same comparison for the second product group of 40”/42” TVs. The data-set is calculated again first based on the “On-Mode 1” measurement results.
11 This assessment refers to the EuP Preparatory Study TREN Lot 5 which listed power consumption values according to catalogue data
of the year 2006.

Evaluation of TV Power MeasurementsClient: Panasonic Marketing Europe GmbH 17
Table 12: Comparison of 40"/42 TVs annual power (on-mode 1) On‐Mode 1 On‐Mode 1 Product Code Average in kWh/a Average in % Deviation 4 40" LCD HDR [B] 286.2 89 ‐11 5 42" PDP HDR [A] 316.7 98 ‐2 6 42" PDP HDR [B] 368.6 114 14 7 42" PDP HDR [D] 378.4 117 17 8 42" LCD HDR [D] 301.9 93 ‐7 9 42" LCD HDR [E] 287.0 89 ‐11
40"/42" Totals 323.1 100 0
The deviation of the six models is under ± 20%, which shows a larger span of product’s energy performance in this product group. The average 323 kWh per year correlates with the former 32” product group to some extent, if we take the increase of the screen surface area (factor 1.7) into consideration. 12 However, the 42” product group display resolution is only HD-ready, which could be considered a quality difference. The average standby-mode is 0.8 Watts and the average on-mode is 172 Watts. The contribution of standby to total annual energy consumption is less than 2%, despite the higher absolute average.
The direct comparison of LCD and PDP in this particular product group indicates a higher average power consumption of the Plasma TVs. Based on the deviation factor the 42” PDP-TVs of manufacturer [B] at "+14%", and manufacturer [D] at "+17%", power consumption is considerably higher by roughly 50 kWh/a in comparison to the 42” LCD-TVs in this test. The Panasonic product, 42” PDP HDR [A], performs considerably well with a deviation factor of -2% compared to the group’s average.
The results are changing considerably in the case of the “on-mode 2” measurement data. They are shown in the following Table 13. Whereas the comparison of the “on-mode 1” and “on-mode 2” data for the three LCD-TVs show only slight differences, obviously due to the use of a constantly operating backlight, the three PDP-TVs show not only in comparison to the “on-mode 1” measurement data but also in comparison to the LCD-TV data a considerably lower power consumption. The reduction factor of PDP-TVs average energy consumption (on-mode 2) in comparison to 42” total’s average (on-mode 1) is factor 0.75.
12 The 32“display has (at 16:9) a screen surface area of 438in² and the 42“display a surface area of 754in² (factor 1.7 difference).

Evaluation of TV Power MeasurementsClient: Panasonic Marketing Europe GmbH 18
Table 13: Power consumption of 40"/42" TVs annual power (on-mode 2) On‐Mode 2 On‐Mode 2 Product Code Average in kWh/a Average in % Deviation 4 40" LCD HDR [B] 283.3 110 10 5 42" PDP HDR [A] 179.5 70 ‐30 6 42" PDP HDR [B] 248.9 97 ‐3 7 42" PDP HDR [D] 241.2 94 ‐6 8 42" LCD HDR [D] 300.5 117 17 9 42" LCD HDR [E] 288.4 112 12
40"/42" Totals 257.0 100 0
The individual performance of the tested PDP-TVs in “on-mode 2” should be observed as well. The performance of the 42 PDP HDR [B] and 42 PDP HDR [D] are quite similar which indicates a comparable technology level. The power consumption according to the IEC 62087 standard (on-mode 1) is quite high and accumulates to an average 370 kWh per year. This figure drops to an average of 245 kWh per year in the second test (on-mode 2). The reduction in overall energy consumption indicates a factor 0.65. Through that the two PDP-TVs perform even better than the LCD-TVs in the same segment.
The Panasonic reference 42 PDP HDR [A] is the best performing product according to the “on-mode 2” data. If compared to the “on-mode 1” product group’s average (323 kWh/a) the 179.5 kWh per year of the Panasonic PDP-TV in “on-mode 2” is a considerable reduction of factor 0.55. This considerably lower power consumption of the PDP-TVs in “on-mode 2” is in general related to the darker picture content of the 60 minutes Harry Potter movie video clip.
The “on-mode 2” measurement reflects the content-specific power consumption of self-emitting displays – in this case the PDP – and the respective fluctuation according to changing APL, a gamma-corrected video signal that represents brightness. In other words, the power consumption increases with brighter (white) and decreases with darker (black) video images.13
In conclusion, the power consumption of self-emitting displays (PDP-TVs) is changing according to the brightness level of a video image. This relationship is considered in the newly revised test standard IEC 62087 Ed. 2.0 (on-mode 1) where a dynamic broadcast video clip is used to imitate an average TV programme.
13 According to the IEC 62087 Ed. 2.0 the APL’ – gamma-corrected Average Picture Level – is defined as: The average luma (Y') level of
the external video input signal applied to the television set. APL' is measured during the active scanning time integrated over a frame period; defined as a percentage of the range between reference black and reference white level.

Evaluation of TV Power MeasurementsClient: Panasonic Marketing Europe GmbH 19
The APL' of the dynamic broadcast-content video signal was chosen to best model actual APL' measured internationally. The project members measured at least 40 hours of typical broadcast content, including a variety of genres from a variety of broadcast stations in Australia, Japan, the Netherlands, the United Kingdom and the United States. The captured APL' curves were averaged in order to create a target APL' curve, known as the master histogram. The mean of the APL' histogram is 34 %. At 34% APL a PDP-TV is usually already in the top range of their power consumption. According to industry data provided for the TREN Lot 5 EuP Preparatory Study on Televisions, PDP-TVs reach 90% of their maximum on-mode power consumption at approximately 40% APL. The power consumption drops however sharply under 40% APL to almost half at 20% APL. This means that at low APL the PDP-TV’s power consumption is considerably reduced by up to 50%. This situation is indicated by the measurement results.

Evaluation of TV Power MeasurementsClient: Panasonic Marketing Europe GmbH 20
3.3 Annual TV-related electricity costs in EU-27
Table 14 provides the calculated annual electricity costs for the tested TVs. The calculation is based on the test results for “standby” as well as “on-mode 1” and “on-mode 2”. A typical daily use pattern of 4h on-mode and 20h standby-mode was assumed. The average electricity price per kWh is 15.28 Cent. This was average electricity price (including taxes) for private customers in EU-27 in the year 2007.
Table 14: EU-27 annual electricity costs per TV in 2007 EU‐27 Mode On‐Mode 1 On‐mode 2 2007 Test Standard IEC 62087 video Harry Potter video15.28 Setting out‐of‐the‐box out‐of‐the‐box No Product Code EU‐27 (in €/a) EU‐27 (in €/a) 1 32" LCD FHD [A] 27.16 27.38 2 32" LCD FHD [B] 31.42 30.98 3 32" LCD FHD [C] 29.93 27.92 4 40" LCD HDR [B] 43.74 43.29 5 42" PDP HDR [A] 48.40 27.43 6 42" PDP HDR [B] 56.32 38.03 7 42" PDP HDR [D] 57.82 36.85 8 42" LCD HDR [D] 46.13 45.91 9 42" LCD HDR [E] 43.85 44.07
The TV-related electricity costs obviously correlate with the energy consumption per product and test standard. Figure 3 below shows the same results in a diagram. Again we can notice that the technical similarity of the LCD-TVs show only marginal differences. The average annual costs for television is ranging in the 32” segment from 27.16 € to a maximum of 31.42 € with an average of 30 Euro. In the 40”/42”segment the costs ranges from 43.74 € to 46.13 €. The content related power consumption (on-mode 2) has only am marginal effect on the costs in both segments.
For the PDP-TVs the picture is somewhat different due to the explained effect of the test procedure on the power consumption. Against this background the annual electricity costs for the 42” PDP-TVs are in the “on-mode 1” considerably higher ranging from 48.40 € to 57.82 €. The 42” PDP-TVs are in direct comparison to the 42” LCD-TVs roughly 10 € or 20% more expensive. Over a typical use period of 10 to 15 years this would equal 100 to 150 €.
A different situation is visible for the “on-mode 2” results. Assuming that the PDP-TVs are utilized for watching movies (similar to the Harry Potter Video) the

Evaluation of TV Power MeasurementsClient: Panasonic Marketing Europe GmbH 21
annual costs would be lower and almost in the range of the 32” LCD-TVs. However, it seems justified to assume that PDP-TVs are used for the full spectrum of broadcasting and video and that the average power consumption is somewhat higher, which means similar to the tested 42” LCD-TVs.
Figure 3: Annual electricity costs of TVs in EU-27 (2007)
3.4 Evaluation of TV related electricity costs per segment and region
The average electricity prices for end consumers in 2007 for the EU-5 member states are in ascending order:
• France (FR): 12.11 Cent/kWh
• Spain (ES): 12.25 Cent/kWh
• United Kingdom (UK): 13.16 Cent/kWh
• Germany (DE): 19.49 Cent/kWh
• Italy (IT): 23.29 Cent/kWh

Evaluation of TV Power MeasurementsClient: Panasonic Marketing Europe GmbH 22
The individual electricity cost for the tested TVs has been calculated according to the average kWh price in the five EU member states (year 2007). The results are shown in Table 15 to Table 19 below.
Table 15: France (annual electricity costs per TV) FR Mode On‐Mode 1 On‐mode 2 2007 Test Standard IEC 62087 video Harry Potter video12.11 Setting out‐of‐the‐box out‐of‐the‐box No Product Code France (in €/a) France (in €/a) 1 32" LCD FHD [A] 21.53 21.70 2 32" LCD FHD [B] 24.90 24.55 3 32" LCD FHD [C] 23.72 22.13 4 40" LCD HDR [B] 34.66 34.31 5 42" PDP HDR [A] 38.36 21.74 6 42" PDP HDR [B] 44.63 30.14 7 42" PDP HDR [D] 45.83 29.21 8 42" LCD HDR [D] 36.56 36.39 9 42" LCD HDR [E] 34.75 34.93
Table 16: Spain (annual electricity costs per TV) ES Mode On‐Mode 1 On‐mode 2
2007 Test Standard IEC 62087 video Harry Potter video12.25 Setting out‐of‐the‐box out‐of‐the‐box No Product Code Spain (in €/a) Spain (in €/a) 1 32" LCD FHD [A] 21.77 21.95 2 32" LCD FHD [B] 25.19 24.83 3 32" LCD FHD [C] 23.99 22.38 4 40" LCD HDR [B] 35.06 34.71 5 42" PDP HDR [A] 38.80 21.99 6 42" PDP HDR [B] 45.15 30.48 7 42" PDP HDR [D] 46.36 29.55 8 42" LCD HDR [D] 36.99 36.81 9 42" LCD HDR [E] 35.15 35.33

Evaluation of TV Power MeasurementsClient: Panasonic Marketing Europe GmbH 23
Table 17: United Kingdom (annual electricity costs per TV) UK Mode On‐Mode 1 On‐mode 2 2007 Test Standard IEC 62087 video Harry Potter video13.16 Setting out‐of‐the‐box out‐of‐the‐box No Product Code UK (in €/a) UK (in €/a) 1 32" LCD FHD [A] 23.39 23.58 2 32" LCD FHD [B] 27.06 26.68 3 32" LCD FHD [C] 25.78 24.05 4 40" LCD HDR [B] 37.67 37.28 5 42" PDP HDR [A] 41.68 23.62 6 42" PDP HDR [B] 48.50 32.75 7 42" PDP HDR [D] 49.80 31.74 8 42" LCD HDR [D] 39.73 39.54 9 42" LCD HDR [E] 37.76 37.96
Table 18: Germany (annual electricity costs per TV) DE Mode On‐Mode 1 On‐mode 2 2007 Test Standard IEC 62087 video Harry Potter video19.49 Setting out‐of‐the‐box out‐of‐the‐box No Product Code Germany (in €/a) Germany (in €/a) 1 32" LCD FHD [A] 34.64 34.93 2 32" LCD FHD [B] 40.08 39.51 3 32" LCD FHD [C] 38.17 35.61 4 40" LCD HDR [B] 55.79 55.22 5 42" PDP HDR [A] 61.73 34.99 6 42" PDP HDR [B] 71.84 48.50 7 42" PDP HDR [D] 73.76 47.01 8 42" LCD HDR [D] 58.85 58.56 9 42" LCD HDR [E] 55.93 56.21
Table 19: Italy (annual electricity costs per TV)
IT Mode On‐Mode 1 On‐mode 2 2007 Test Standard IEC 62087 video Harry Potter video23.29 Setting out‐of‐the‐box out‐of‐the‐box No Product Code Italy (in €/a) Italy (in €/a) 1 32" LCD FHD [A] 41.40 41.74 2 32" LCD FHD [B] 47.89 47.21 3 32" LCD FHD [C] 45.62 42.56 4 40" LCD HDR [B] 66.66 65.98 5 42" PDP HDR [A] 73.77 41.81 6 42" PDP HDR [B] 85.84 57.96 7 42" PDP HDR [D] 88.14 56.17 8 42" LCD HDR [D] 70.32 69.98 9 42" LCD HDR [E] 66.83 67.17

Evaluation of TV Power MeasurementsClient: Panasonic Marketing Europe GmbH 24
The following comparison includes the electricity costs in France (lowest price level of EU-5)14, the EU-27 (average price level) and Italy (highest price level of EU-5)15. The comparison also distinguishes the power consumption test results according to IEC 62087 (on-mode 1) and Movie Clip (on-mode 2). Figure 4 indicates the order of magnitude of difference between single member states.
Figure 4: Cost comparison between France, EU-27 and Italy for on-mode 1 and on-mode 2
The combination of the regional cost factors and the power consumption according to the applied test standard shows the order of magnitude in which the electricity costs related to TVs can fluctuate in the European Union. The electricity consumption costs related to television is ranging from 20 Euros in the best case to almost 90 Euros per year in the worst case. The average costs factor is in a range of 30 to 60 Euros.
14 France has with 9.11 €/kWh a low price factor before taxes and with about 24% tax also a low tax factor. 15 Italy has with 16.58 €/kWh a high price factor and with about 30% also a high tax factor.
Evaluation of TV Power MeasurementsClient: Panasonic Marketing Europe GmbH 25
Whereas the power consumption is influenced by the display technology and the test procedure, the related electricity costs are a reflection of regional differences in terms of energy generation and taxation policy. Through the combination of these factors, the related annual electricity costs can fluctuate more than 50 Euros for a single 42” PDP-TV. This combination of factors can make for instance the Panasonics reference model 42” PDP HDR [A] (measured in on-mode 2 and with the lowest electricity cost factor in France) comparable to the Panasonic 32” LCD FHD [A] in terms of annual electricity costs of about 22 Euros. Basically this is a direct result of the reduced power consumption at the lower APL level for the PDP and the lowest electricity price.
However, the relations between the measured power consumption and the energy costs are of course the same for the smaller LCD and the larger PDP televisions. Costs are therefore not a good indicator for energy efficiency. Only transparent and comparative cost calculations are helpful, when indicating total cost of ownership. That means, calculating the electricity costs of the expected use cycle (e.g. 10 years). If, for example, the sales price of a TV-set is 1.000 Euro and the average annual electricity costs are 40 Euro the total cost of ownership would be 1.400 Euro. Now, if the annual use of the same priced TV would cost 80 Euro than the total cost of ownership would increase to 1.800 Euro, which is a considerable cost factor with a potential effect on the buying decision.
In conclusion, energy consumption and respective costs in the use phase is most significantly determined by the screen size of the TV. The display technology is a considerable factor in terms electricity consumption due to principle correlation between the average picture level and power consumption of self-emitting displays such as PDP. The new edition of the IEC 62087 test standard is reflecting this technical issue by providing the option for a dynamic power measurement based on an average broadcast APL. Against the obvious trend towards higher end-user electricity prices in Europe, the annual electricity consumption and more over the total cost of ownership is becoming an increasingly important sales argument. Nevertheless, there are other factors to be considered such as the quality of the picture, the reliability and a long-term efficiency of the display technology. Finally, it will be important in future to consider the overall environmental impact of the TV from production to end-of-life. The power consumption in the use phase is absolutely significant and a main focus of optimization the technology development. But in the mid-term a holistic benchmark is needed to determine the overall life cycle eco-impact of TVs.

Evaluation of TV Power MeasurementsClient: Panasonic Marketing Europe GmbH 26
4 Part III: Special Analysis of Eco-Mode measurement results for Panasonic TH-42PX80E
4.1 Eco Mode power consumption data
Special power consumption measurements have been conducted by VDE regarding the Eco-Mode option of the Panasonic reference plasma television-set TH-42PX80E. To our knowledge this Eco-Mode option features a light sensor which automatically adjusts the display luminance (cd/m²) in accordance to the illuminance level (lux) of the ambient light conditions. For the purpose of this comparative analysis the results for two Eco-Mode measurements have been provided:
• Eco-mode 1 (IEC 62087 clip) at 0 lux ambient illuminance: 96.9 Watt
• Eco-mode 2 (Harry Potter clip) at 0 lux ambient illuminance: 67.9 Watt
In order to put these values into perspective we compare them with results from the “out-of-the-box” settings:
• On-mode 1 (IEC 62087 test clip) out of the box setting: 214.0 Watt
• On-mode 2 (Harry Potter clip) out of the box setting: 120.0 Watt
Note: It is assumed that the Eco-Mode ambient light sensor regulates, under dark room conditions of zero lux, the display luminance to a very low level. The particular luminance setting specifications are unknown to Fraunhofer IZM. However, we assume that the video image is sufficiently visible. Regarding the low level of respective power consumption, which is indicated by the measurement results, they are not likely to occur under real life conditions very often. Nevertheless these Eco-Mode values show the theoretical potential for low average power consumption of this particular plasma television.
4.2 Comparative analysis of Eco Mode power consumption
Figure 5 below shows the Standard and Eco-Mode measurement results of the Panasonic reference model TH-42PX80E in comparison to the other tested TVs. In direct comparison, not only to the other 42-inch TVs, shows the Panasonic

Evaluation of TV Power MeasurementsClient: Panasonic Marketing Europe GmbH 27
TH-42PX80E considerably lower energy consumption. According to the VDE measurement results, the measured average power consumption in the Eco-Mode under zero lux ambient light condition is even below the average power consumption level of the 32-inch LCD-TVs.
Figure 5: Power Consumption in Eco Mode for Panasonic Reference TV
A noticeable aspect of the Panasonic TH-42PX80E is the almost 150 Watt wide range of average power consumption from 214 Watt in On-Mode-1 to 67.9 Watt in Eco-Mode-2. In order to indicate the magnitude of this range a theoretical comparison of the individual mode setting to the maximum power consumption (static white level power consumption value which is assumed 100% APL) has been made.
The comparison of the IEC 62087 test results for On-Mode-1 (out-of-the-box) with the Eco-Mode-1 (zero lux condition) shows a considerable reduction in average power consumption from over 200 Watt to below 100 Watt. The power consumption drops from 214 Watt to 96.9 Watt. This equals a reduction by factor 2.2. The comparison of the Harry Potter video clip test results for On-Mode-2 and Eco-Mode-2 with the first set of results show even lower values. The average power consumption drops from 120 Watt to very low 67.9 Watt. Assuming that the receiver and picture processing consumes

Evaluation of TV Power MeasurementsClient: Panasonic Marketing Europe GmbH 28
approximately 40 Watt (according to the EuP studies Lot 5) this result indicates that a visible video image is achieved with only 30 Watt. The 67.9 Watt in Eco-Mode-2 is surprisingly low and should be checked again in order to make sure that the result is genuine.
Nevertheless, the result shows the low power capability that can be achieved for this Plasma TV under certain conditions. The result exemplifies not only the theoretical potential for low average power consumption of the Panasonic TH-42PX80E. The result also indicates the influencing factors for real life power consumption of Plasma TVs in general. These factors are:
• The luminescence efficacy of the specific plasma technology (lm/W)
• The video image or average luminance level of the video content (APL)
• The display luminance according to brightness/contrast setting (cd/m²)
• The ambient illuminance conditions in the room (lux) when an Eco-Mode option with automatic luminance adjustment is provided
In conclusion, there is certainly a technical potential for energy efficiency for Plasma-TVs as the Panasonic TH-42PX80E shows. The example indicates that it is the combination of multiple factors that will determine the real life energy consumption of Plasma TVs throughout the use life. In this particular case it seems that the automatic adjustment (reduction) of the displays luminance in the Eco Mode is only one aspect. In order to achieve a video image of adequate quality for the 42-Inch HD-ready television screen with only 67.9 Watt we conclude that the specific plasma technology and its advanced luminescence efficacy is the more important factor in this respect.
4.3 Comparative analysis of Eco Mode electricity costs
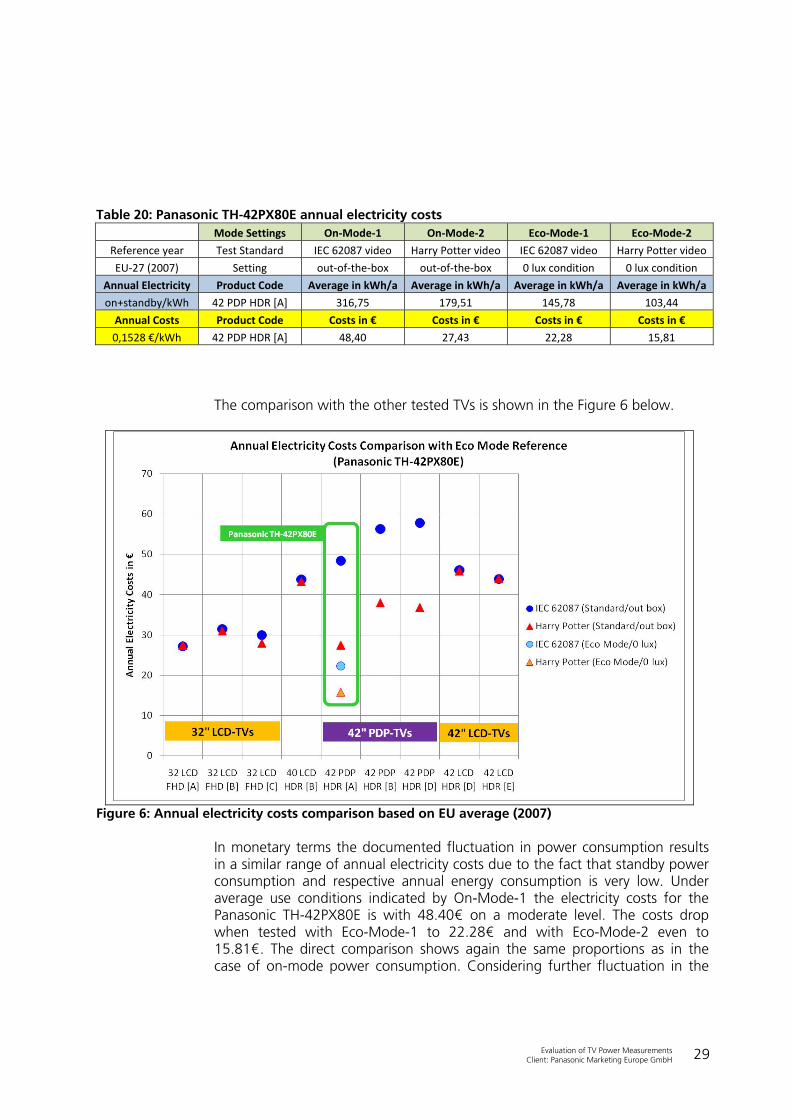
For the purpose of comparison the annual electricity consumption according to 4 hours on-mode and 20 hours standby per day/365 has been calculated. The annual electricity costs correlate again with the calculated annual power consumption under the individual test conditions and settings. The electricity costs are calculated on the base of the 2007 European Union average of 15.28 cent per kWh. The results of this calculation are shown in Table 20 below.
Evaluation of TV Power MeasurementsClient: Panasonic Marketing Europe GmbH 29
Table 20: Panasonic TH-42PX80E annual electricity costs Mode Settings On‐Mode‐1 On‐Mode‐2 Eco‐Mode‐1 Eco‐Mode‐2
Reference year Test Standard IEC 62087 video Harry Potter video IEC 62087 video Harry Potter video
EU‐27 (2007) Setting out‐of‐the‐box out‐of‐the‐box 0 lux condition 0 lux condition
Annual Electricity Product Code Average in kWh/a Average in kWh/a Average in kWh/a Average in kWh/a
on+standby/kWh 42 PDP HDR [A] 316,75 179,51 145,78 103,44
Annual Costs Product Code Costs in € Costs in € Costs in € Costs in €
0,1528 €/kWh 42 PDP HDR [A] 48,40 27,43 22,28 15,81
The comparison with the other tested TVs is shown in the Figure 6 below.
Figure 6: Annual electricity costs comparison based on EU average (2007)
In monetary terms the documented fluctuation in power consumption results in a similar range of annual electricity costs due to the fact that standby power consumption and respective annual energy consumption is very low. Under average use conditions indicated by On-Mode-1 the electricity costs for the Panasonic TH-42PX80E is with 48.40€ on a moderate level. The costs drop when tested with Eco-Mode-1 to 22.28€ and with Eco-Mode-2 even to 15.81€. The direct comparison shows again the same proportions as in the case of on-mode power consumption. Considering further fluctuation in the
Evaluation of TV Power MeasurementsClient: Panasonic Marketing Europe GmbH 30
electricity costs (€/kWh) according to the conditions in single European Union member states it is difficult to postulate a typical annual cost level. Depending on the test conditions and regional cost factors the annual electricity costs for the Panasonic TH-42PX80E could vary between 12.53€ and 73.77€.

Evaluation of TV Power MeasurementsClient: Panasonic Marketing Europe GmbH 31
5 References
[Eurostat 2007] Eurostat: Gas and electricity market statistics, 2007 edition, Eurostat statistical books, Environment and energy, Luxembourg 2007
[EuroStat 2008a] Eurostat: Europe in figures – Eurostat yearbook 2008,
Eurostat statistical books, General and regional statistics, Luxembourg 2008
[Eurostat 2008b] Eurostat: Energy - Monthly statistics — Issue number 6 /2008,
2008 edition, Eurostat statistical books, Environment and energy, Luxembourg 2008
[UBA 2007] Marcus Machat, Kathrin Werner: Entwicklung der
spezifischen Kohlendioxid-Emissionen des deutschen Strommix (Development of specific CO2-Emissions of the German Energy Mix), Umweltbundesamt, Dessau, Germany, April 2007
[MEEuP, 2005] R. Kemna et. al: Methodology Study Eco-design of Energy-using Products, Methodology Report, Delft, 2005
[Nissen, 2000] Nissen, N.; Griese, H.; Müller, J.; Middendorf A.; Stobbe, I.; Reichl, H.; Funk, T.: Environmental Assessment Using the IZM/EE Toolbox, in: Electronics Goes Green 2000+, Berlin, 11.-13. September 2000
[EuP Lot 5, 2007] Stobbe, L. et al: Final Reports of EuP Preparatory Study TREN Lot 5 on Televisions. 2. August 2007, http://www.ecotelevision.org