evaluation of turkish olive oil quality: some quality
TRANSCRIPT

1Food Engineering Department of Istanbul Aydın University, Istanbul/Turkey 2Nutrition and Dietetic Department of Istanbul Esenyurt University, Istanbul /Turkey
EVALUATION OF TURKISH OLIVE OIL QUALITY: SOME QUALITY
CHARACTERISTICS AND TURKISH FOOD CODEX
G. TÜRK1, Z. Tacer-CABA1, Burcu ÇAKMAK2, H. ÖZPINAR1
Abstract
Olive oil is a significant food product that is directly consumed and highly recommended for
health. Therefore it must be produced at right and hygienic conditions. This study aimed to
evaluate some quality and purity criteria of olive oil samples from different regions and different
olive types around Turkey according to regulations of Turkish Food Codex. Free acidity, peroxide
number and oil acid compositions of samples were studied for evaluation of quality and purity.
According to the results, although free acidity results of all Riviera olive oil samples were in
conformity to those in standards; 46% of extra virgin olive oil samples were out of the acceptable
limits. Peroxide values of both types (22% of virgin olive oil and 15% of Riviera oil samples) were
above the limits given in standards. Fatty acid compositions of linolenic, heptadecanoic and
heptadecenoic acid values were not within the legal limits. According to overall results; 46%, 20%
and 9% of all samples were out of the standard limits, for free acidity, peroxide value and
distribution of fatty acids, respectively. These data provide evidence of the variation in olive oil
quality around Turkish olive oil samples.
Keyword: ?
Introduction
Olive oil is extracted from olive tree Olea
europaea L. fruits and consumed directly. It is
nutritionally beneficial for health, comprising
nutritional compounds of oil acids, vitamins,
sterols and phenolic compounds. Since it has
some unique antioxidant compounds
(phenolic compounds, tocopherol, other
aromatic components), high amount of mono-
unsaturated fatty acid (oleic acid), high
oxidative stability and it is processed only
physically (press, centrifugation, percolation),
it is considered as a natural fruit oil or oily
International Journal of Food Engineering Research (IJFER) Year 2 Num 2 - 2016 (1-17)
1

EVALUATION OF TURKISH OLIVE OIL QUALITY: SOME QUALITY CHARACTERISTICS AND TURKISH FOOD CODEX
2
fruit juice and has numerous different
properties in comparison to other edible
vegetable oils [1,2]. It is one of the most
significant crops in Mediteranean countries
and a very important contributor of the
Mediterranean diet [3].
Positive effects of extra virgin olive oil on
health comprise cardiovascular health, and
cancer [4]. Previous studies clearly revealed
the antioxidant, inflammatory, and
chemotherapic effects as well [5].
Epidemiological and nutritional studies
mainly focused on PUFAs [6], phenolic
compounds and tocopherols [6, 7]. Other
clinical studies presented the positive effets of
contiunuos olive oil consumption and its
effects on coronary heart diseases, [8],
oxidative damage on DNA and RNA [9] and
risk of Alzheimer disease [10, 11].
Global olive production has been made
mainly around Mediterranean region (90% of
all global production). Annual olive
production is around 17 million tons and
countries of Spain, Italy, Greece, Tunisia,
Portugal, and Turkey are among the olive
produces. Annual amount of olive production
in Turkey was around 1 676 000 tons for the
season 2013-2014, with more than 167
millions of trees. Production of olives is quite
common for manty different regions of
Turkey such as; AydÕn, øzmir, Mu÷la,
BalÕkesir, Bursa, Manisa, Çanakkale,
Gaziantep and øçel; in the Aegean, the
Marmara, the Mediterranean and the
Southeast regions [12]. In Spain, world leader
olive oil producer, total amount of oli oil
produced was around 825.7 thousand ton in
season 2014-2015, while in Turkey it was
around 190 thousand ton. USA and European
Unioun member countries are significant
world olive oil traders [12].
Olive oil that is unable to be consumed
directly is processed into as refined olive oil.
Refining may comprise processes such as
removal of aroma and resin, blanching, in
addition to decreasing the free acidity level to
below 0.3%. This type of olive oil is so called
as refined olive oil. Although undesired
properties are eliminated, the specific aroma
and flavor of oil is also lost during refining
process. Riviera type oil is a mixture of
refined olive oil having changing ratios (5-
20%) and virgin olive oil [13].
Legal status of olive oil in Turkey is
determined according to the rules specified by
the Turkish Food Codex standard [14]. High
quality olive oil is hard to produce and
expensive and the high costs related to olive
trees growing, olive harvest and oil extraction
are among the main reasons behind this fact.
Therefore adulteration of this valuable
product in such approach as blending
changing quality olive oil types and marketing
them as extra virgin olive oil, quite commonly
exists [14]. For prevention of adulteration, it
is significant to determine the quality and
purity properties of olive oil samples.
Olive oil quality is related to many different
factors such as olive variety, geographic
region, climate conditions, tree properties,
olive fruit maturity and harvest time, way of
olive collecting, storage conditions, oil
processing methods, and mechanical
properties of press machines [15]. This study
aimed to investigate the quality and purity
criteria of some common olive oil samples of
extra virgin olive oil and Riviera type olive oil
according to Turkish Food legistations.
Materia s
50 different extra virgin olive oil and 20
different rafined type samples from producers
at 4 different growing regions of Turkey
comprising the Marmara region, the Aegean
region, the Mediterranean region and the
Southeast region, in two consecutive harvest
years of seasons 2012-2013 and 2013-2014.
Different regions and provinces were depicted
in Table 1. The predominant olive varieties of
Gemlik, AyvalÕk and Memecik which are
grown in a number of regions were chosen as
monovarietal types whereas Karma (mixed)
types were made by blanching different
varieties. List of all olive oil samples used in
the study was given in Table 2.
Tab e 1. Provinces at different growing
regions
Gro in
Re ion
Pro inces
The Marmara
region
Çanakkale (Küçükkuyu),
BalÕkesir (Burhaniye,
Edremit, AyvalÕk) ve
Bursa (Orhangazi,
Mudanya, Gemlik)
The Aegean
region
øzmir (Ödemiú, Bornova),
AydÕn (Nazilli, Karacasu,
Köúk), Manisa (Akhisar)
The
Mediterranean
region
Mu÷la (Fethiye), Hatay
(Samanda÷), Kilis
The Southeast
region
Gaziantep

G. TÜRK, Z. Tacer-CABA, Burcu ÇAKMAK, H. ÖZPINAR
International Journal of Food Engineering Research (IJFER) Year 2 Num 2 - 2016 (1-17) 3
fruit juice and has numerous different
properties in comparison to other edible
vegetable oils [1,2]. It is one of the most
significant crops in Mediteranean countries
and a very important contributor of the
Mediterranean diet [3].
Positive effects of extra virgin olive oil on
health comprise cardiovascular health, and
cancer [4]. Previous studies clearly revealed
the antioxidant, inflammatory, and
chemotherapic effects as well [5].
Epidemiological and nutritional studies
mainly focused on PUFAs [6], phenolic
compounds and tocopherols [6, 7]. Other
clinical studies presented the positive effets of
contiunuos olive oil consumption and its
effects on coronary heart diseases, [8],
oxidative damage on DNA and RNA [9] and
risk of Alzheimer disease [10, 11].
Global olive production has been made
mainly around Mediterranean region (90% of
all global production). Annual olive
production is around 17 million tons and
countries of Spain, Italy, Greece, Tunisia,
Portugal, and Turkey are among the olive
produces. Annual amount of olive production
in Turkey was around 1 676 000 tons for the
season 2013-2014, with more than 167
millions of trees. Production of olives is quite
common for manty different regions of
Turkey such as; AydÕn, øzmir, Mu÷la,
BalÕkesir, Bursa, Manisa, Çanakkale,
Gaziantep and øçel; in the Aegean, the
Marmara, the Mediterranean and the
Southeast regions [12]. In Spain, world leader
olive oil producer, total amount of oli oil
produced was around 825.7 thousand ton in
season 2014-2015, while in Turkey it was
around 190 thousand ton. USA and European
Unioun member countries are significant
world olive oil traders [12].
Olive oil that is unable to be consumed
directly is processed into as refined olive oil.
Refining may comprise processes such as
removal of aroma and resin, blanching, in
addition to decreasing the free acidity level to
below 0.3%. This type of olive oil is so called
as refined olive oil. Although undesired
properties are eliminated, the specific aroma
and flavor of oil is also lost during refining
process. Riviera type oil is a mixture of
refined olive oil having changing ratios (5-
20%) and virgin olive oil [13].
Legal status of olive oil in Turkey is
determined according to the rules specified by
the Turkish Food Codex standard [14]. High
quality olive oil is hard to produce and
expensive and the high costs related to olive
trees growing, olive harvest and oil extraction
are among the main reasons behind this fact.
Therefore adulteration of this valuable
product in such approach as blending
changing quality olive oil types and marketing
them as extra virgin olive oil, quite commonly
exists [14]. For prevention of adulteration, it
is significant to determine the quality and
purity properties of olive oil samples.
Olive oil quality is related to many different
factors such as olive variety, geographic
region, climate conditions, tree properties,
olive fruit maturity and harvest time, way of
olive collecting, storage conditions, oil
processing methods, and mechanical
properties of press machines [15]. This study
aimed to investigate the quality and purity
criteria of some common olive oil samples of
extra virgin olive oil and Riviera type olive oil
according to Turkish Food legistations.
Materia s
50 different extra virgin olive oil and 20
different rafined type samples from producers
at 4 different growing regions of Turkey
comprising the Marmara region, the Aegean
region, the Mediterranean region and the
Southeast region, in two consecutive harvest
years of seasons 2012-2013 and 2013-2014.
Different regions and provinces were depicted
in Table 1. The predominant olive varieties of
Gemlik, AyvalÕk and Memecik which are
grown in a number of regions were chosen as
monovarietal types whereas Karma (mixed)
types were made by blanching different
varieties. List of all olive oil samples used in
the study was given in Table 2.
Tab e 1. Provinces at different growing
regions
Gro in
Re ion
Pro inces
The Marmara
region
Çanakkale (Küçükkuyu),
BalÕkesir (Burhaniye,
Edremit, AyvalÕk) ve
Bursa (Orhangazi,
Mudanya, Gemlik)
The Aegean
region
øzmir (Ödemiú, Bornova),
AydÕn (Nazilli, Karacasu,
Köúk), Manisa (Akhisar)
The
Mediterranean
region
Mu÷la (Fethiye), Hatay
(Samanda÷), Kilis
The Southeast
region
Gaziantep

EVALUATION OF TURKISH OLIVE OIL QUALITY: SOME QUALITY CHARACTERISTICS AND TURKISH FOOD CODEX
4
Tab e 2. Olive oil samples used in the study
O i e Oi
Sa e Pro inces T e Variet Season
N1 Kilis Extra Mixed 2012-2013 N2 Kilis Extra Mixed 2013-2014 N3 Samanda÷/Hatay Extra Gemlik 2012-2013 N4 Samanda÷/Hatay Extra Gemlik 2013-2014 N5 Samanda÷/Hatay Extra Mixed 2012-2013 N6 Samanda÷/Hatay Extra Mixed 2013-2014 N7 Küçükkuyu/Çanakkale Extra Ayvalık 2012-2013 N8 Küçükkuyu/Çanakkale Extra Ayvalık 2013-2014 N9 AltÕnoluk/Edremit/BalÕkesir Extra Ayvalık 2012-2013 N10 AltÕnoluk/Edremit/BalÕkesir Extra Ayvalık 2013-2014 N11 Nazilli/AydÕn Extra Memecik 2012-2013 N12 Nazilli/AydÕn Extra Memecik 2013-2014 N13 Nazilli/AydÕn Extra Mixed 2012-2013 N14 Nazilli/AydÕn Extra Mixed 2013-2014 N15 Burhaniye/BalÕkesir Extra Ayvalık 2012-2013 N16 Burhaniye/BalÕkesir Extra Ayvalık 2013-2014 N17 Tarsus/Mersin Extra Mixed 2012-2013 N18 Tarsus/Mersin Extra Mixed 2013-2014 N19 Ödemiú/øzmir Extra Memecik 2012-2013 N20 Ödemiú/øzmir Extra Memecik 2013-2014 N21 Köúk/AydÕn Extra Memecik 2012-2013 N22 Köúk/AydÕn Extra Memecik 2013-2014 N23 AydÕn Extra Memecik 2012-2013 N24 AydÕn Extra Memecik 2013-2014 N25 AydÕn Extra Memecik 2012-2013 N26 AydÕn Extra Memecik 2013-2014 N27 Gemlik/Bursa Extra Gemlik 2012-2013 N28 Gemlik/Bursa Extra Gemlik 2013-2014 N29 Bornova/øzmir Extra Mixed 2012-2013 N30 Bornova/øzmir Extra Mixed 2013-2014 N31 AyvalÕk/BalÕkesir Extra Ayvalık 2012-2013
N32 AyvalÕk/BalÕkesir Extra Virgin Ayvalık 2013-2014 N33 Mudanya/Bursa Extra Virgin Gemlik 2012-2013 N34 Mudanya/Bursa Extra Virgin Gemlik 2013-2014 N35 Küçükkuyu/Çanakkale Extra Virgin Ayvalık 2012-2013 N36 Küçükkuyu/Çanakkale Extra Virgin Ayvalık 2013-2014 N37 AyvalÕk/BalÕkesir Extra Virgin Ayvalık 2012-2013 N38 AyvalÕk/BalÕkesir Extra Virgin Ayvalık 2013-2014 N39 AyvalÕk/BalÕkesir Extra Virgin Ayvalık 2012-2013 N40 AyvalÕk/BalÕkesir Extra Virgin Ayvalık 2013-2014 N41 AydÕn Extra Virgin Memecik 2012-2013 N42 AydÕn Extra Virgin Memecik 2013-2014 N43 Fethiye/Mu÷la Extra Virgin Memecik 2012-2013 N44 Fethiye/Mu÷la Extra Virgin Memecik 2013-2014 N45 Karacasu/AydÕn Extra Virgin Memecik 2012-2013 N46 Karacasu/AydÕn Extra Virgin Memecik 2013-2014 N47 Küçükkuyu/Çanakkale Extra Virgin Ayvalık 2012-2013 N48 Küçükkuyu/Çanakkale Extra Virgin Ayvalık 2013-2014 N49 Orhangazi/Bursa Extra Virgin Gemlik 2012-2013 N50 Orhangazi/Bursa Extra Virgin Gemlik 2013-2014 R1 Bornova/øzmir Riviera Mixed 2012-2013 R2 Bornova/øzmir Riviera Mixed 2013-2014 R3 Gemlik/Bursa Riviera Mixed 2012-2013 R4 Gemlik/Bursa Riviera Mixed 2013-2014 R5 Akhisar/Manisa Riviera Mixed 2012-2013 R6 Akhisar/Manisa Riviera Mixed 2013-2014 R7 Akhisar/Manisa Riviera Mixed 2012-2013 R8 Akhisar/Manisa Riviera Mixed 2013-2014 R9 Gaziantep Riviera Mixed 2012-2013 R10 Gaziantep Riviera Mixed 2013-2014 R11 Nizip/Gaziantep Riviera Mixed 2012-2013 R12 Nizip/Gaziantep Riviera Mixed 2013-2014 R13 Bursa Riviera Mixed 2012-2013 R14 Bursa Riviera Mixed 2013-2014 R15 Bornova/øzmir Riviera Mixed 2012-2013 R16 Bornova/øzmir Riviera Mixed 2013-2014 R17 Bornova/øzmir Riviera Mixed 2012-2013

G. TÜRK, Z. Tacer-CABA, Burcu ÇAKMAK, H. ÖZPINAR
International Journal of Food Engineering Research (IJFER) Year 2 Num 2 - 2016 (1-17) 5
Tab e 2. Olive oil samples used in the study
O i e Oi
Sa e Pro inces T e Variet Season
N1 Kilis Extra Mixed 2012-2013 N2 Kilis Extra Mixed 2013-2014 N3 Samanda÷/Hatay Extra Gemlik 2012-2013 N4 Samanda÷/Hatay Extra Gemlik 2013-2014 N5 Samanda÷/Hatay Extra Mixed 2012-2013 N6 Samanda÷/Hatay Extra Mixed 2013-2014 N7 Küçükkuyu/Çanakkale Extra Ayvalık 2012-2013 N8 Küçükkuyu/Çanakkale Extra Ayvalık 2013-2014 N9 AltÕnoluk/Edremit/BalÕkesir Extra Ayvalık 2012-2013 N10 AltÕnoluk/Edremit/BalÕkesir Extra Ayvalık 2013-2014 N11 Nazilli/AydÕn Extra Memecik 2012-2013 N12 Nazilli/AydÕn Extra Memecik 2013-2014 N13 Nazilli/AydÕn Extra Mixed 2012-2013 N14 Nazilli/AydÕn Extra Mixed 2013-2014 N15 Burhaniye/BalÕkesir Extra Ayvalık 2012-2013 N16 Burhaniye/BalÕkesir Extra Ayvalık 2013-2014 N17 Tarsus/Mersin Extra Mixed 2012-2013 N18 Tarsus/Mersin Extra Mixed 2013-2014 N19 Ödemiú/øzmir Extra Memecik 2012-2013 N20 Ödemiú/øzmir Extra Memecik 2013-2014 N21 Köúk/AydÕn Extra Memecik 2012-2013 N22 Köúk/AydÕn Extra Memecik 2013-2014 N23 AydÕn Extra Memecik 2012-2013 N24 AydÕn Extra Memecik 2013-2014 N25 AydÕn Extra Memecik 2012-2013 N26 AydÕn Extra Memecik 2013-2014 N27 Gemlik/Bursa Extra Gemlik 2012-2013 N28 Gemlik/Bursa Extra Gemlik 2013-2014 N29 Bornova/øzmir Extra Mixed 2012-2013 N30 Bornova/øzmir Extra Mixed 2013-2014 N31 AyvalÕk/BalÕkesir Extra Ayvalık 2012-2013
N32 AyvalÕk/BalÕkesir Extra Virgin Ayvalık 2013-2014 N33 Mudanya/Bursa Extra Virgin Gemlik 2012-2013 N34 Mudanya/Bursa Extra Virgin Gemlik 2013-2014 N35 Küçükkuyu/Çanakkale Extra Virgin Ayvalık 2012-2013 N36 Küçükkuyu/Çanakkale Extra Virgin Ayvalık 2013-2014 N37 AyvalÕk/BalÕkesir Extra Virgin Ayvalık 2012-2013 N38 AyvalÕk/BalÕkesir Extra Virgin Ayvalık 2013-2014 N39 AyvalÕk/BalÕkesir Extra Virgin Ayvalık 2012-2013 N40 AyvalÕk/BalÕkesir Extra Virgin Ayvalık 2013-2014 N41 AydÕn Extra Virgin Memecik 2012-2013 N42 AydÕn Extra Virgin Memecik 2013-2014 N43 Fethiye/Mu÷la Extra Virgin Memecik 2012-2013 N44 Fethiye/Mu÷la Extra Virgin Memecik 2013-2014 N45 Karacasu/AydÕn Extra Virgin Memecik 2012-2013 N46 Karacasu/AydÕn Extra Virgin Memecik 2013-2014 N47 Küçükkuyu/Çanakkale Extra Virgin Ayvalık 2012-2013 N48 Küçükkuyu/Çanakkale Extra Virgin Ayvalık 2013-2014 N49 Orhangazi/Bursa Extra Virgin Gemlik 2012-2013 N50 Orhangazi/Bursa Extra Virgin Gemlik 2013-2014 R1 Bornova/øzmir Riviera Mixed 2012-2013 R2 Bornova/øzmir Riviera Mixed 2013-2014 R3 Gemlik/Bursa Riviera Mixed 2012-2013 R4 Gemlik/Bursa Riviera Mixed 2013-2014 R5 Akhisar/Manisa Riviera Mixed 2012-2013 R6 Akhisar/Manisa Riviera Mixed 2013-2014 R7 Akhisar/Manisa Riviera Mixed 2012-2013 R8 Akhisar/Manisa Riviera Mixed 2013-2014 R9 Gaziantep Riviera Mixed 2012-2013 R10 Gaziantep Riviera Mixed 2013-2014 R11 Nizip/Gaziantep Riviera Mixed 2012-2013 R12 Nizip/Gaziantep Riviera Mixed 2013-2014 R13 Bursa Riviera Mixed 2012-2013 R14 Bursa Riviera Mixed 2013-2014 R15 Bornova/øzmir Riviera Mixed 2012-2013 R16 Bornova/øzmir Riviera Mixed 2013-2014 R17 Bornova/øzmir Riviera Mixed 2012-2013

EVALUATION OF TURKISH OLIVE OIL QUALITY: SOME QUALITY CHARACTERISTICS AND TURKISH FOOD CODEX
6
Met ods
.2.1 O i e Oi Qua it Tests
.2.1.1 Free acidit o eic acid,
Method of Turkish Standards Institute
(Number: TS EN ISO 660) [16] was used to
determine the free acidity of the olive oil
samples. Free acidity is defined as percent free
fatty acid (FFA) content and given as a
percentage of oleic acid in Eq. 1.
wFFA= mMcV
mMcV
uuu
uuu10
1001000
(1)
Where;
V = Amount of potassium hydroxide with
ethanol consumed (mL)
c = Normality of potassium hydroxide
solution with ethanol (N),
M = Molecular weight of oleic acid (=
282g/mol);
m = Sample weight (g)
.2.1.2 Pero ide a ue
Determination of Peroxide Number was made
according to TS EN ISO 3960 [16] and result
given as mili equivalent weight of active
O2/kg oil [16]. The equation used is given in
Eq. 2.This value is accepted as a real indicator
for oil oxidation [17]. Sample dissolved in
acetic acid- isooctane solution is mixed with
potassium iodine solution to form iodine
which is titrated with sodium thiosulfate [16].
mcVV
PVu�u
)(1000 0
(Eq. 2)
Where;
V = Sodium thiosulfate solution volume
consumed, (mL)
V0 = Sodium thiosulfate solution volume
consumed for blank, (mL)
c = Exact molarity of sodium thiosulfate
solution consumed;
m = Sample weight, (g)
R18 Bornova/øzmir Riviera Mixed 2013-2014 R19 AyvalÕk/BalÕkesir Riviera Mixed 2012-2013 R20 AyvalÕk/BalÕkesir Riviera Mixed 2013-2014
.2.2 O i e oi urit ana ses
.2.2.1 Ana sis o att acids and iso ers
Measurements were made using gas
chromatography (GC) according to the
conditions given standard [18]. GC details
were depicted in Table 3. Results were given
as methy ester %.
Tab e . GC conditions
Instrument: Agilent 6890 GC
Detector: FID (Flame Ionization Dedector)
Coloumn: 100 m x 0.25 mm ID, 0.2 µm HP-
88
Split Ratio: 1:50
Injector Temperature: 250 °C
Oven Temperature: 120 °C 230 °C
Detector Tempearture: 280 °C
Detector Gases: Hydrogen (40 ml/min.),
Air (450 ml/min.), Helium (30 ml/min.)
.2. Statistica Ana ses
The differences among extra virgn olive oil
and among Riviera type samples were
investigated by one-way analysis of variance
(ANOVA) (p<0.05). Detailed examinations
for significant differences were made using
Duncan’s New Multiple Range Test. SPSS
16.0 statistical software (SPSS, Inc., Chicago,
IL, USA) was used in all statistical analyses.
. RESULTS and DISCUSSION
.1 O i e Oi Qua it Tests
.1.1 Free acidit and ero ide a ue
Overall results showed that 23 of all extra
virgin olive oil samples were above the legal
limit for free acidity given in Turkish Food
Codex (0.8%, oleic acid). On the other hand,
Riviera type olive oil samples were within the
legal limits. Free acidity values of extra virgin
olive oil and Riviera olive oil samples
according to their growing regions were given
in Tables 4 and 5, respectively. he free acidity
values among extra virgin olive oil samples
changed between 0.28 and 12.69 % oleic acid,
while for Riviera type samples the results
ranged between 0.11 and 0.96 %. Present
findigns were slightly higher than the findings
of a previous study [19], in which 10 samples
of extra virgin olive oil and 8 samples of
Riviera type olive oil had the free acidity
levels of changing between 0.41 and 0.93%;
and 0.14 and 0.69%, respectively.
Differences among the growing regions were
only significant for extra virgin olive oil
samples from The Mediterranean region
(p<0.05). The Mediterranean region was
previously determined as having the highest
free acidity levels in a study comprising
different growing regions of the North and

G. TÜRK, Z. Tacer-CABA, Burcu ÇAKMAK, H. ÖZPINAR
International Journal of Food Engineering Research (IJFER) Year 2 Num 2 - 2016 (1-17) 7
Met ods
.2.1 O i e Oi Qua it Tests
.2.1.1 Free acidit o eic acid,
Method of Turkish Standards Institute
(Number: TS EN ISO 660) [16] was used to
determine the free acidity of the olive oil
samples. Free acidity is defined as percent free
fatty acid (FFA) content and given as a
percentage of oleic acid in Eq. 1.
wFFA= mMcV
mMcV
uuu
uuu10
1001000
(1)
Where;
V = Amount of potassium hydroxide with
ethanol consumed (mL)
c = Normality of potassium hydroxide
solution with ethanol (N),
M = Molecular weight of oleic acid (=
282g/mol);
m = Sample weight (g)
.2.1.2 Pero ide a ue
Determination of Peroxide Number was made
according to TS EN ISO 3960 [16] and result
given as mili equivalent weight of active
O2/kg oil [16]. The equation used is given in
Eq. 2.This value is accepted as a real indicator
for oil oxidation [17]. Sample dissolved in
acetic acid- isooctane solution is mixed with
potassium iodine solution to form iodine
which is titrated with sodium thiosulfate [16].
mcVV
PVu�u
)(1000 0
(Eq. 2)
Where;
V = Sodium thiosulfate solution volume
consumed, (mL)
V0 = Sodium thiosulfate solution volume
consumed for blank, (mL)
c = Exact molarity of sodium thiosulfate
solution consumed;
m = Sample weight, (g)
R18 Bornova/øzmir Riviera Mixed 2013-2014 R19 AyvalÕk/BalÕkesir Riviera Mixed 2012-2013 R20 AyvalÕk/BalÕkesir Riviera Mixed 2013-2014
.2.2 O i e oi urit ana ses
.2.2.1 Ana sis o att acids and iso ers
Measurements were made using gas
chromatography (GC) according to the
conditions given standard [18]. GC details
were depicted in Table 3. Results were given
as methy ester %.
Tab e . GC conditions
Instrument: Agilent 6890 GC
Detector: FID (Flame Ionization Dedector)
Coloumn: 100 m x 0.25 mm ID, 0.2 µm HP-
88
Split Ratio: 1:50
Injector Temperature: 250 °C
Oven Temperature: 120 °C 230 °C
Detector Tempearture: 280 °C
Detector Gases: Hydrogen (40 ml/min.),
Air (450 ml/min.), Helium (30 ml/min.)
.2. Statistica Ana ses
The differences among extra virgn olive oil
and among Riviera type samples were
investigated by one-way analysis of variance
(ANOVA) (p<0.05). Detailed examinations
for significant differences were made using
Duncan’s New Multiple Range Test. SPSS
16.0 statistical software (SPSS, Inc., Chicago,
IL, USA) was used in all statistical analyses.
. RESULTS and DISCUSSION
.1 O i e Oi Qua it Tests
.1.1 Free acidit and ero ide a ue
Overall results showed that 23 of all extra
virgin olive oil samples were above the legal
limit for free acidity given in Turkish Food
Codex (0.8%, oleic acid). On the other hand,
Riviera type olive oil samples were within the
legal limits. Free acidity values of extra virgin
olive oil and Riviera olive oil samples
according to their growing regions were given
in Tables 4 and 5, respectively. he free acidity
values among extra virgin olive oil samples
changed between 0.28 and 12.69 % oleic acid,
while for Riviera type samples the results
ranged between 0.11 and 0.96 %. Present
findigns were slightly higher than the findings
of a previous study [19], in which 10 samples
of extra virgin olive oil and 8 samples of
Riviera type olive oil had the free acidity
levels of changing between 0.41 and 0.93%;
and 0.14 and 0.69%, respectively.
Differences among the growing regions were
only significant for extra virgin olive oil
samples from The Mediterranean region
(p<0.05). The Mediterranean region was
previously determined as having the highest
free acidity levels in a study comprising
different growing regions of the North and
EVALUATION OF TURKISH OLIVE OIL QUALITY: SOME QUALITY CHARACTERISTICS AND TURKISH FOOD CODEX
8
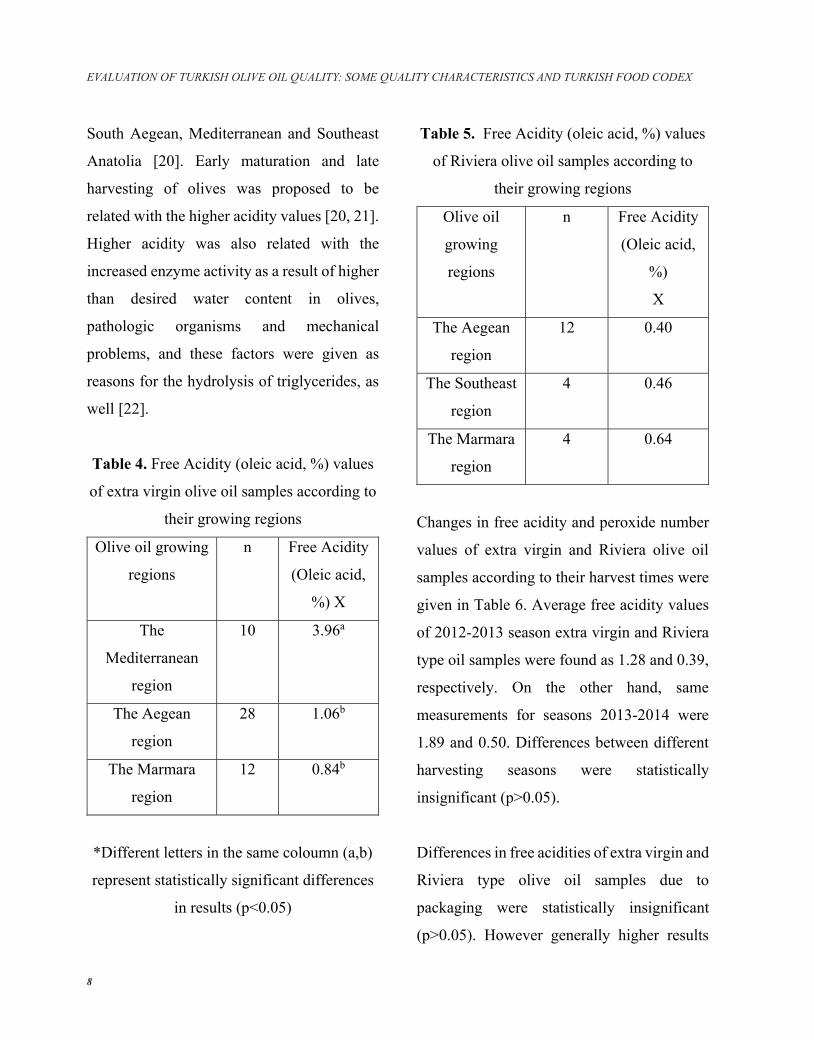
South Aegean, Mediterranean and Southeast
Anatolia [20]. Early maturation and late
harvesting of olives was proposed to be
related with the higher acidity values [20, 21].
Higher acidity was also related with the
increased enzyme activity as a result of higher
than desired water content in olives,
pathologic organisms and mechanical
problems, and these factors were given as
reasons for the hydrolysis of triglycerides, as
well [22].
Tab e . Free Acidity (oleic acid, %) values
of extra virgin olive oil samples according to
their growing regions
Olive oil growing
regions
n Free Acidity
(Oleic acid,
%) X
The
Mediterranean
region
10 3.96a
The Aegean
region
28 1.06b
The Marmara
region
12 0.84b
*Different letters in the same coloumn (a,b)
represent statistically significant differences
in results (p<0.05)
Tab e . Free Acidity (oleic acid, %) values
of Riviera olive oil samples according to
their growing regions
Olive oil
growing
regions
n Free Acidity
(Oleic acid,
%)
X
The Aegean
region
12 0.40
The Southeast
region
4 0.46
The Marmara
region
4 0.64
Changes in free acidity and peroxide number
values of extra virgin and Riviera olive oil
samples according to their harvest times were
given in Table 6. Average free acidity values
of 2012-2013 season extra virgin and Riviera
type oil samples were found as 1.28 and 0.39,
respectively. On the other hand, same
measurements for seasons 2013-2014 were
1.89 and 0.50. Differences between different
harvesting seasons were statistically
insignificant (p>0.05).
Differences in free acidities of extra virgin and
Riviera type olive oil samples due to
packaging were statistically insignificant
(p>0.05). However generally higher results
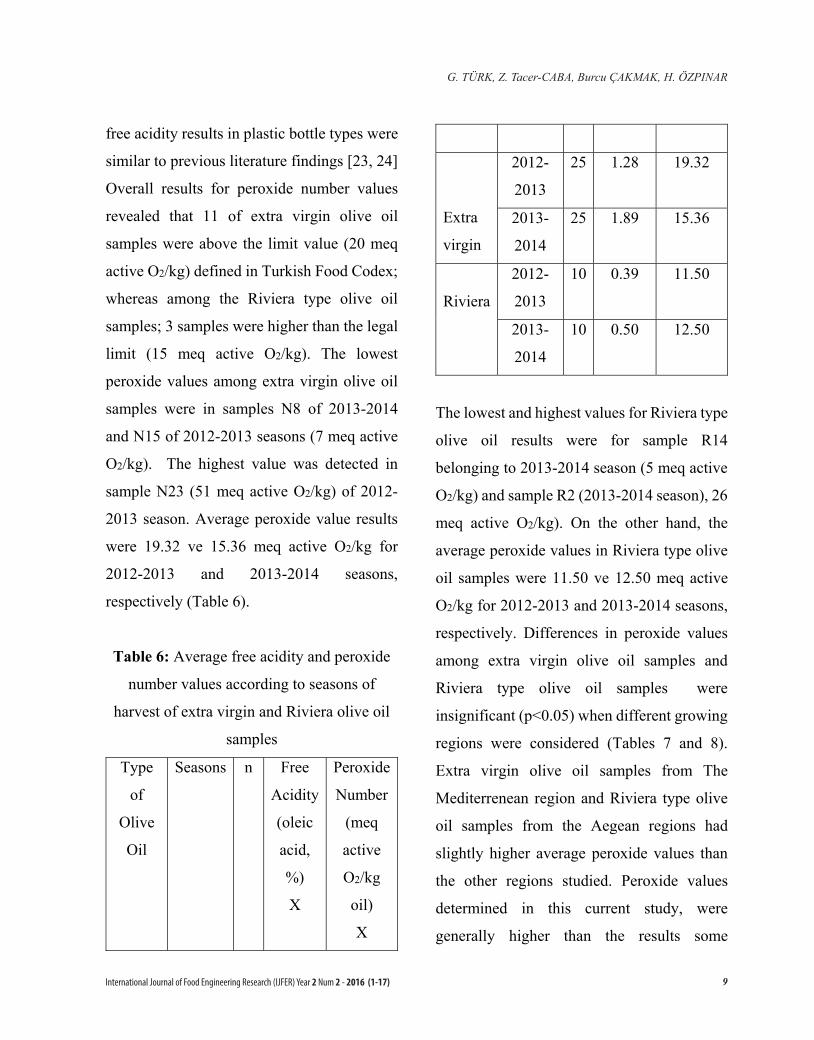
free acidity results in plastic bottle types were
similar to previous literature findings [23, 24]
Overall results for peroxide number values
revealed that 11 of extra virgin olive oil
samples were above the limit value (20 meq
active O2/kg) defined in Turkish Food Codex;
whereas among the Riviera type olive oil
samples; 3 samples were higher than the legal
limit (15 meq active O2/kg). The lowest
peroxide values among extra virgin olive oil
samples were in samples N8 of 2013-2014
and N15 of 2012-2013 seasons (7 meq active
O2/kg). The highest value was detected in
sample N23 (51 meq active O2/kg) of 2012-
2013 season. Average peroxide value results
were 19.32 ve 15.36 meq active O2/kg for
2012-2013 and 2013-2014 seasons,
respectively (Table 6).
Tab e : Average free acidity and peroxide
number values according to seasons of
harvest of extra virgin and Riviera olive oil
samples
Type
of
Olive
Oil
Seasons n Free
Acidity
(oleic
acid,
%)
X
Peroxide
Number
(meq
active
O2/kg
oil)
X
Extra
virgin
2012-
2013
25 1.28 19.32
2013-
2014
25 1.89 15.36
Riviera
2012-
2013
10 0.39 11.50
2013-
2014
10 0.50 12.50
The lowest and highest values for Riviera type
olive oil results were for sample R14
belonging to 2013-2014 season (5 meq active
O2/kg) and sample R2 (2013-2014 season), 26
meq active O2/kg). On the other hand, the
average peroxide values in Riviera type olive
oil samples were 11.50 ve 12.50 meq active
O2/kg for 2012-2013 and 2013-2014 seasons,
respectively. Differences in peroxide values
among extra virgin olive oil samples and
Riviera type olive oil samples were
insignificant (p<0.05) when different growing
regions were considered (Tables 7 and 8).
Extra virgin olive oil samples from The
Mediterrenean region and Riviera type olive
oil samples from the Aegean regions had
slightly higher average peroxide values than
the other regions studied. Peroxide values
determined in this current study, were
generally higher than the results some
G. TÜRK, Z. Tacer-CABA, Burcu ÇAKMAK, H. ÖZPINAR
International Journal of Food Engineering Research (IJFER) Year 2 Num 2 - 2016 (1-17) 9
South Aegean, Mediterranean and Southeast
Anatolia [20]. Early maturation and late
harvesting of olives was proposed to be
related with the higher acidity values [20, 21].
Higher acidity was also related with the
increased enzyme activity as a result of higher
than desired water content in olives,
pathologic organisms and mechanical
problems, and these factors were given as
reasons for the hydrolysis of triglycerides, as
well [22].
Tab e . Free Acidity (oleic acid, %) values
of extra virgin olive oil samples according to
their growing regions
Olive oil growing
regions
n Free Acidity
(Oleic acid,
%) X
The
Mediterranean
region
10 3.96a
The Aegean
region
28 1.06b
The Marmara
region
12 0.84b
*Different letters in the same coloumn (a,b)
represent statistically significant differences
in results (p<0.05)
Tab e . Free Acidity (oleic acid, %) values
of Riviera olive oil samples according to
their growing regions
Olive oil
growing
regions
n Free Acidity
(Oleic acid,
%)
X
The Aegean
region
12 0.40
The Southeast
region
4 0.46
The Marmara
region
4 0.64
Changes in free acidity and peroxide number
values of extra virgin and Riviera olive oil
samples according to their harvest times were
given in Table 6. Average free acidity values
of 2012-2013 season extra virgin and Riviera
type oil samples were found as 1.28 and 0.39,
respectively. On the other hand, same
measurements for seasons 2013-2014 were
1.89 and 0.50. Differences between different
harvesting seasons were statistically
insignificant (p>0.05).
Differences in free acidities of extra virgin and
Riviera type olive oil samples due to
packaging were statistically insignificant
(p>0.05). However generally higher results
free acidity results in plastic bottle types were
similar to previous literature findings [23, 24]
Overall results for peroxide number values
revealed that 11 of extra virgin olive oil
samples were above the limit value (20 meq
active O2/kg) defined in Turkish Food Codex;
whereas among the Riviera type olive oil
samples; 3 samples were higher than the legal
limit (15 meq active O2/kg). The lowest
peroxide values among extra virgin olive oil
samples were in samples N8 of 2013-2014
and N15 of 2012-2013 seasons (7 meq active
O2/kg). The highest value was detected in
sample N23 (51 meq active O2/kg) of 2012-
2013 season. Average peroxide value results
were 19.32 ve 15.36 meq active O2/kg for
2012-2013 and 2013-2014 seasons,
respectively (Table 6).
Tab e : Average free acidity and peroxide
number values according to seasons of
harvest of extra virgin and Riviera olive oil
samples
Type
of
Olive
Oil
Seasons n Free
Acidity
(oleic
acid,
%)
X
Peroxide
Number
(meq
active
O2/kg
oil)
X
Extra
virgin
2012-
2013
25 1.28 19.32
2013-
2014
25 1.89 15.36
Riviera
2012-
2013
10 0.39 11.50
2013-
2014
10 0.50 12.50
The lowest and highest values for Riviera type
olive oil results were for sample R14
belonging to 2013-2014 season (5 meq active
O2/kg) and sample R2 (2013-2014 season), 26
meq active O2/kg). On the other hand, the
average peroxide values in Riviera type olive
oil samples were 11.50 ve 12.50 meq active
O2/kg for 2012-2013 and 2013-2014 seasons,
respectively. Differences in peroxide values
among extra virgin olive oil samples and
Riviera type olive oil samples were
insignificant (p<0.05) when different growing
regions were considered (Tables 7 and 8).
Extra virgin olive oil samples from The
Mediterrenean region and Riviera type olive
oil samples from the Aegean regions had
slightly higher average peroxide values than
the other regions studied. Peroxide values
determined in this current study, were
generally higher than the results some

EVALUATION OF TURKISH OLIVE OIL QUALITY: SOME QUALITY CHARACTERISTICS AND TURKISH FOOD CODEX
10
previous literature concerning the similar
regions of growth and/or olive varieties [20,
25-27]; although some similar results were
also found [28]. The main reason might be the
enlonged storage periods between production
and analyses in addition to negative storage
conditions such as light [23, 29]. Average
peroxide number values were higher in glass
bottle types (19.38 meq active O2/kg) in extra
virgin olive oil samples, whereas plastic bottle
types had higher average peroxide values
(12.57 meq active O2/kg) in Riviera type olive
oil samples.
Tab e . Average peroxide number values of
extra virgin olive oil samples according to
their growing regions
Tab e . Average peroxide number values of
Riviera type olive oil samples according to
their growing regions
O i e Oi Purit Ana ses
.2.1. Fatt Acid Co osition Resu ts o
O i e Oi Sa es
The most common fatty acid found in olive oil
is the oleic acid and according to the overall
results, all samples provided the required legal
minimum limits for oleic acid. Moreover, all
samples are within the limits for linoleic,
palmitic, stearic, arachidic and myristic acids.
Average fatty acid % results according to
different growing regions were given in Table
9. The highest average oleic acid was 71.34%
in the Marmara region, while the lowest result
was detected in the Mediterreanaen region
Olive oil sample n Peroxide
Number (meq
active O2/kg
oil)
X
The Mediterranean
region
10 18.10
The Aegean region 28 17.32
The Marmara
region
12 16.75
Olive oil
sample
n Peroxide
Number
(meq active
O2/kg oil)
X
The Aegean
region
12 12.58
The Southeast
region
4 10.50
The Marmara
region
4 11.75
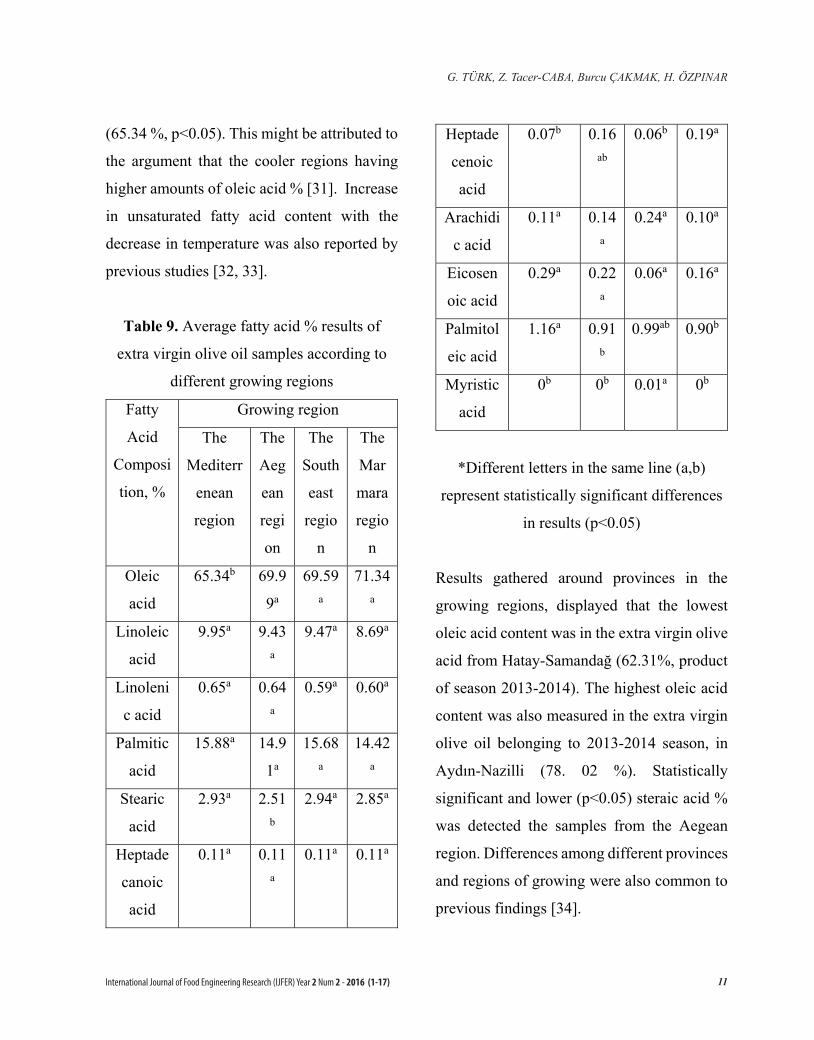
(65.34 %, p<0.05). This might be attributed to
the argument that the cooler regions having
higher amounts of oleic acid % [31]. Increase
in unsaturated fatty acid content with the
decrease in temperature was also reported by
previous studies [32, 33].
Tab e . Average fatty acid % results of
extra virgin olive oil samples according to
different growing regions
Fatty
Acid
Composi
tion, %
Growing region
The
Mediterr
enean
region
The
Aeg
ean
regi
on
The
South
east
regio
n
The
Mar
mara
regio
n
Oleic
acid
65.34b 69.9
9a
69.59a
71.34a
Linoleic
acid
9.95a 9.43a
9.47a 8.69a
Linoleni
c acid
0.65a 0.64a
0.59a 0.60a
Palmitic
acid
15.88a 14.9
1a
15.68a
14.42a
Stearic
acid
2.93a 2.51b
2.94a 2.85a
Heptade
canoic
acid
0.11a 0.11a
0.11a 0.11a
Heptade
cenoic
acid
0.07b 0.16ab
0.06b 0.19a
Arachidi
c acid
0.11a 0.14a
0.24a 0.10a
Eicosen
oic acid
0.29a 0.22a
0.06a 0.16a
Palmitol
eic acid
1.16a 0.91b
0.99ab 0.90b
Myristic
acid
0b 0b 0.01a 0b
*Different letters in the same line (a,b)
represent statistically significant differences
in results (p<0.05)
Results gathered around provinces in the
growing regions, displayed that the lowest
oleic acid content was in the extra virgin olive
acid from Hatay-Samanda÷ (62.31%, product
of season 2013-2014). The highest oleic acid
content was also measured in the extra virgin
olive oil belonging to 2013-2014 season, in
AydÕn-Nazilli (78. 02 %). Statistically
significant and lower (p<0.05) steraic acid %
was detected the samples from the Aegean
region. Differences among different provinces
and regions of growing were also common to
previous findings [34].
G. TÜRK, Z. Tacer-CABA, Burcu ÇAKMAK, H. ÖZPINAR
International Journal of Food Engineering Research (IJFER) Year 2 Num 2 - 2016 (1-17) 11
previous literature concerning the similar
regions of growth and/or olive varieties [20,
25-27]; although some similar results were
also found [28]. The main reason might be the
enlonged storage periods between production
and analyses in addition to negative storage
conditions such as light [23, 29]. Average
peroxide number values were higher in glass
bottle types (19.38 meq active O2/kg) in extra
virgin olive oil samples, whereas plastic bottle
types had higher average peroxide values
(12.57 meq active O2/kg) in Riviera type olive
oil samples.
Tab e . Average peroxide number values of
extra virgin olive oil samples according to
their growing regions
Tab e . Average peroxide number values of
Riviera type olive oil samples according to
their growing regions
O i e Oi Purit Ana ses
.2.1. Fatt Acid Co osition Resu ts o
O i e Oi Sa es
The most common fatty acid found in olive oil
is the oleic acid and according to the overall
results, all samples provided the required legal
minimum limits for oleic acid. Moreover, all
samples are within the limits for linoleic,
palmitic, stearic, arachidic and myristic acids.
Average fatty acid % results according to
different growing regions were given in Table
9. The highest average oleic acid was 71.34%
in the Marmara region, while the lowest result
was detected in the Mediterreanaen region
Olive oil sample n Peroxide
Number (meq
active O2/kg
oil)
X
The Mediterranean
region
10 18.10
The Aegean region 28 17.32
The Marmara
region
12 16.75
Olive oil
sample
n Peroxide
Number
(meq active
O2/kg oil)
X
The Aegean
region
12 12.58
The Southeast
region
4 10.50
The Marmara
region
4 11.75
(65.34 %, p<0.05). This might be attributed to
the argument that the cooler regions having
higher amounts of oleic acid % [31]. Increase
in unsaturated fatty acid content with the
decrease in temperature was also reported by
previous studies [32, 33].
Tab e . Average fatty acid % results of
extra virgin olive oil samples according to
different growing regions
Fatty
Acid
Composi
tion, %
Growing region
The
Mediterr
enean
region
The
Aeg
ean
regi
on
The
South
east
regio
n
The
Mar
mara
regio
n
Oleic
acid
65.34b 69.9
9a
69.59a
71.34a
Linoleic
acid
9.95a 9.43a
9.47a 8.69a
Linoleni
c acid
0.65a 0.64a
0.59a 0.60a
Palmitic
acid
15.88a 14.9
1a
15.68a
14.42a
Stearic
acid
2.93a 2.51b
2.94a 2.85a
Heptade
canoic
acid
0.11a 0.11a
0.11a 0.11a
Heptade
cenoic
acid
0.07b 0.16ab
0.06b 0.19a
Arachidi
c acid
0.11a 0.14a
0.24a 0.10a
Eicosen
oic acid
0.29a 0.22a
0.06a 0.16a
Palmitol
eic acid
1.16a 0.91b
0.99ab 0.90b
Myristic
acid
0b 0b 0.01a 0b
*Different letters in the same line (a,b)
represent statistically significant differences
in results (p<0.05)
Results gathered around provinces in the
growing regions, displayed that the lowest
oleic acid content was in the extra virgin olive
acid from Hatay-Samanda÷ (62.31%, product
of season 2013-2014). The highest oleic acid
content was also measured in the extra virgin
olive oil belonging to 2013-2014 season, in
AydÕn-Nazilli (78. 02 %). Statistically
significant and lower (p<0.05) steraic acid %
was detected the samples from the Aegean
region. Differences among different provinces
and regions of growing were also common to
previous findings [34].

EVALUATION OF TURKISH OLIVE OIL QUALITY: SOME QUALITY CHARACTERISTICS AND TURKISH FOOD CODEX
12
Ten samples of extra virgin olive oil and 8
samples of Riviera type olive oil werestudied
[19] and according to the results, oleic acid%
of extra virgin olive oil samples changed
between 71.09 and 74.82 %, while in Riviera
type samples it was 70.72-73.23%. In the
current study, except for the highest sample
(78.02 %); oleic acid content in extra virgin
olive oil samples anged between 62.31-74.94
% and for Riviera samples 67.44-72.41 %.
Therefore the findings were close to the
results of their study [19]. However,
generally, the literature findings related to
oleic acid were higher than the present
findings; whereas the palmitic acid contents
were generally lower [34, 35]. In samples with
lower oleic acid content, the other fatty acids
such as palmitic acid and linoleic acid were
more dominant with higher values. Average
fatty acid % results of extra virgin olive oil
samples according to olive varieties in Table
10.
Tab e 1 : Average fatty acid % results of extra virgin olive oil
samples according to olive varieties
Fatty Acid
Composition, %
AyvalÕ
k
Gemlik Memecik Mixed
Oleic acid 68.87a 71.08a 69.72a 69.56
Linoleic acid 9.76a 7.23b 10.03a 9.30a
Linolenic acid 0.57b 0.58b 0.72a 0.63a
Palmiticacid 15.63a 14.72a 14.27a 15.10a
Stearic acid 2.55bc 3.03a 2.46c 2.75ab
Heptadeccdanoic acid 0.15a 0.11a 0.06a 0.12a
Heptadecenoic acid 0.22a 0.17ab 0.11b 0.13b
Arachidic acid 0.12a 0.07a 0.15 0.15
Eicosenoic acid 0.38a 0.12a 0.22a 0.14a
Palmitoleic acid 0.88a 1.09a 0.94a 0.96a
Myristic acid 0 0 0 0
*Different letters in the same line (a,b)
represent statistically significant differences
in results (p<0.05)
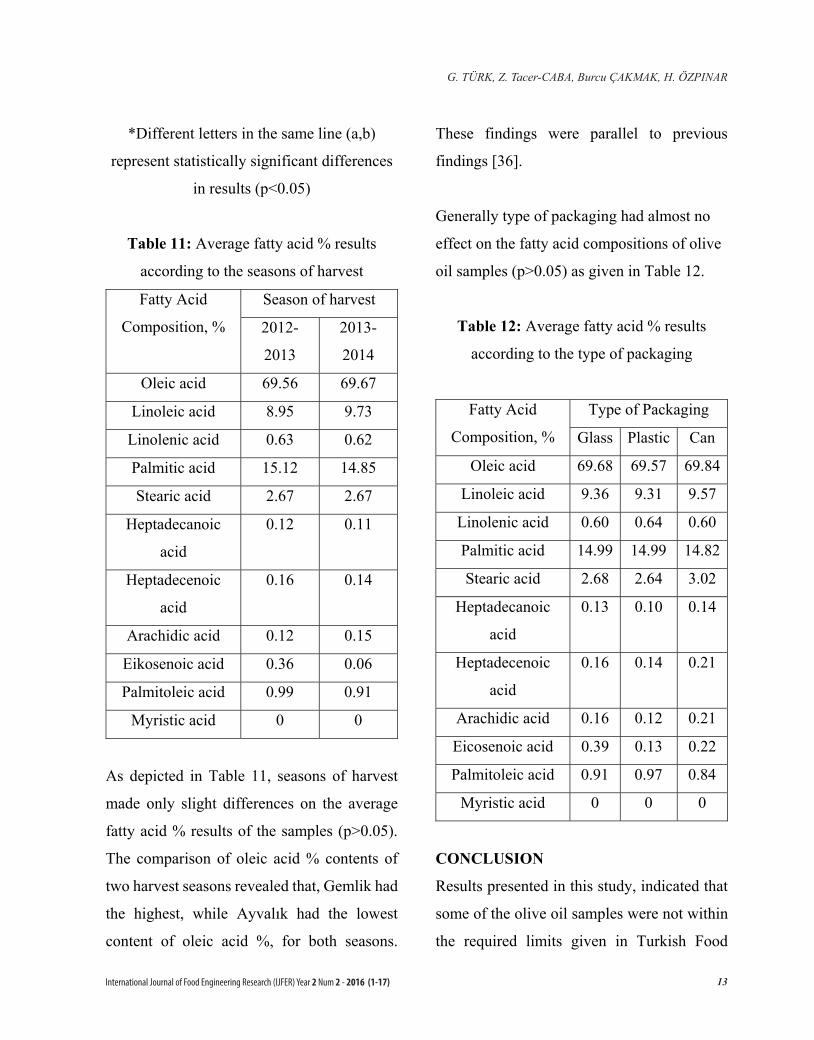
Tab e 11: Average fatty acid % results
according to the seasons of harvest
Fatty Acid
Composition, %
Season of harvest
2012-
2013
2013-
2014
Oleic acid 69.56 69.67
Linoleic acid 8.95 9.73
Linolenic acid 0.63 0.62
Palmitic acid 15.12 14.85
Stearic acid 2.67 2.67
Heptadecanoic
acid
0.12 0.11
Heptadecenoic
acid
0.16 0.14
Arachidic acid 0.12 0.15
Eikosenoic acid 0.36 0.06
Palmitoleic acid 0.99 0.91
Myristic acid 0 0
As depicted in Table 11, seasons of harvest
made only slight differences on the average
fatty acid % results of the samples (p>0.05).
The comparison of oleic acid % contents of
two harvest seasons revealed that, Gemlik had
the highest, while AyvalÕk had the lowest
content of oleic acid %, for both seasons.
These findings were parallel to previous
findings [36].
Generally type of packaging had almost no
effect on the fatty acid compositions of olive
oil samples (p>0.05) as given in Table 12.
Tab e 12: Average fatty acid % results
according to the type of packaging
Fatty Acid
Composition, %
Type of Packaging
Glass Plastic Can
Oleic acid 69.68 69.57 69.84
Linoleic acid 9.36 9.31 9.57
Linolenic acid 0.60 0.64 0.60
Palmitic acid 14.99 14.99 14.82
Stearic acid 2.68 2.64 3.02
Heptadecanoic
acid
0.13 0.10 0.14
Heptadecenoic
acid
0.16 0.14 0.21
Arachidic acid 0.16 0.12 0.21
Eicosenoic acid 0.39 0.13 0.22
Palmitoleic acid 0.91 0.97 0.84
Myristic acid 0 0 0
CONCLUSION
Results presented in this study, indicated that
some of the olive oil samples were not within
the required limits given in Turkish Food
G. TÜRK, Z. Tacer-CABA, Burcu ÇAKMAK, H. ÖZPINAR
International Journal of Food Engineering Research (IJFER) Year 2 Num 2 - 2016 (1-17) 13
Ten samples of extra virgin olive oil and 8
samples of Riviera type olive oil werestudied
[19] and according to the results, oleic acid%
of extra virgin olive oil samples changed
between 71.09 and 74.82 %, while in Riviera
type samples it was 70.72-73.23%. In the
current study, except for the highest sample
(78.02 %); oleic acid content in extra virgin
olive oil samples anged between 62.31-74.94
% and for Riviera samples 67.44-72.41 %.
Therefore the findings were close to the
results of their study [19]. However,
generally, the literature findings related to
oleic acid were higher than the present
findings; whereas the palmitic acid contents
were generally lower [34, 35]. In samples with
lower oleic acid content, the other fatty acids
such as palmitic acid and linoleic acid were
more dominant with higher values. Average
fatty acid % results of extra virgin olive oil
samples according to olive varieties in Table
10.
Tab e 1 : Average fatty acid % results of extra virgin olive oil
samples according to olive varieties
Fatty Acid
Composition, %
AyvalÕ
k
Gemlik Memecik Mixed
Oleic acid 68.87a 71.08a 69.72a 69.56
Linoleic acid 9.76a 7.23b 10.03a 9.30a
Linolenic acid 0.57b 0.58b 0.72a 0.63a
Palmiticacid 15.63a 14.72a 14.27a 15.10a
Stearic acid 2.55bc 3.03a 2.46c 2.75ab
Heptadeccdanoic acid 0.15a 0.11a 0.06a 0.12a
Heptadecenoic acid 0.22a 0.17ab 0.11b 0.13b
Arachidic acid 0.12a 0.07a 0.15 0.15
Eicosenoic acid 0.38a 0.12a 0.22a 0.14a
Palmitoleic acid 0.88a 1.09a 0.94a 0.96a
Myristic acid 0 0 0 0
*Different letters in the same line (a,b)
represent statistically significant differences
in results (p<0.05)
Tab e 11: Average fatty acid % results
according to the seasons of harvest
Fatty Acid
Composition, %
Season of harvest
2012-
2013
2013-
2014
Oleic acid 69.56 69.67
Linoleic acid 8.95 9.73
Linolenic acid 0.63 0.62
Palmitic acid 15.12 14.85
Stearic acid 2.67 2.67
Heptadecanoic
acid
0.12 0.11
Heptadecenoic
acid
0.16 0.14
Arachidic acid 0.12 0.15
Eikosenoic acid 0.36 0.06
Palmitoleic acid 0.99 0.91
Myristic acid 0 0
As depicted in Table 11, seasons of harvest
made only slight differences on the average
fatty acid % results of the samples (p>0.05).
The comparison of oleic acid % contents of
two harvest seasons revealed that, Gemlik had
the highest, while AyvalÕk had the lowest
content of oleic acid %, for both seasons.
These findings were parallel to previous
findings [36].
Generally type of packaging had almost no
effect on the fatty acid compositions of olive
oil samples (p>0.05) as given in Table 12.
Tab e 12: Average fatty acid % results
according to the type of packaging
Fatty Acid
Composition, %
Type of Packaging
Glass Plastic Can
Oleic acid 69.68 69.57 69.84
Linoleic acid 9.36 9.31 9.57
Linolenic acid 0.60 0.64 0.60
Palmitic acid 14.99 14.99 14.82
Stearic acid 2.68 2.64 3.02
Heptadecanoic
acid
0.13 0.10 0.14
Heptadecenoic
acid
0.16 0.14 0.21
Arachidic acid 0.16 0.12 0.21
Eicosenoic acid 0.39 0.13 0.22
Palmitoleic acid 0.91 0.97 0.84
Myristic acid 0 0 0
CONCLUSION
Results presented in this study, indicated that
some of the olive oil samples were not within
the required limits given in Turkish Food

EVALUATION OF TURKISH OLIVE OIL QUALITY: SOME QUALITY CHARACTERISTICS AND TURKISH FOOD CODEX
14
Codex standard. Unsatisfactory results are
thought to be related with the problems in
storage conditions, olive quality, effect of
geographical differences and process
conditions. On the other hand, fatty acid
compositions were within the limits of
Turkish standards and these results were
indicators of purity but not adulteration. This
study was significant as giving idea about the
quality problems present in the olive oil
products found in the Turkish market and
frequent occurance of unsuitabilities of these
products in the legal limit values.
REFERENCES
[1] Visioli F., Galli C., “Olive oil phenols
and their potential effects on human
health,” Journal of Agricultural and
Food Chemistry, 46, 10, pp. 4292-4296,
1998
[2] Öztürk F., YalçÕn M., DÕraman H.,
“Türkiye zeytinya÷Õ ekonomisine
genel bir bakÕú,” GÕda Teknolojileri
Elektronik Dergisi, Cilt 4, No: 2, pp.
35-51, 2009
http://teknolojikarastirmalar.
com/pdf/tr/02_2009_4_2_58_411.pdf
[3] Bendini, A., Cerretani, L., Carrasco-
Pancorbo, A., Gómez-Caravaca, A. M.,
Segura-Carretero, A., Fernández-
Gutiérrez, A., “Phenolic molecules in
virgin olive oils: a survey of their
sensory properties, health effects,
antioxidant activity and analytical
methods. An overview of the last
decade,” Molecules, 12, pp. 1679–1719,
2007
[4] Simopoluos, A. P., “The Mediterranean
diets: What is so special about the diet
of Greece? The scientific evidence,”
The Journal of Nutrition, 131, pp.
3065S–3073S, 2001.
[5] Calvo, P., Castaño, Aғ ғ . L, Lozano, M.,
González-Gómez, “Influence of the
microencapsulation on the quality
parameters and shelf-life of extra-virgin
olive oil encapsulated in the presence of
BHT and different capsule wall
components,” Food Research
International, 45, pp. 256-261, 2012.
[6] Riediger, N. D., Othhnman, R. A., Suh,
M., Moghadasian, M. H., “A systemic
review of the roles of n-3 fatty acids in
health and disease,” Journal of the
American Dietetic Association, 109(4),
668–679, 2009.
[7] Servilli, M., Esposto, S., Veneziani, G.,
Urbani, S., Taticchi, A., Di Maio, I.,
“Improvement of bioactive phenol
content in virgin olive oil with an olive-
vegetation water concentrate produced
by membrane treatment,” Food
Chemistry, 124, pp. 1308–1315, 2011.
[8] Keys, A., Mienotti, A., Karvonen, M. J.,
Aravanis, C., Blackburn, H., Buzina, R.,
Djordjevic, B. S., Dontas, A. S.,
Fidanza, F., Keys, M. H., Kromhout, D.,
Nedeljkovic, S., Punsar, S., Seccareccia,
F., Toshima, H., “The diet and 15-year
death rate in the seven countries study,”
American Journal of Epidemiology, 124
(6), pp. 903–915. 1986.
[9] Machowetz, A., Poulsen, H. E.,
Gruendel, S., Weimann, A., Fito, M.,
Marrugat, J., De La Torre, R., Salonen,
J. T., Nyyssonen, K., Mursu, J.,
Nascetti, S., Gaddi, A., Kiesewetter, H.,
Baumler, H., Selmi, H., Kaikkonen, J.,
Zunft, H. J. F., Convas, M. I., Koebnick,
C., “Effect of olive oils on biomarkers of
oxidative DNA stress in Northern and
Southern Europeans,” FASEB Journal,
21 (1), pp. 45–52, 2007.
[10] Abuznait, A. H., Qosa, H., Busnena, B.
A., El Sayed, K. A., Kaddoumi, A.,
“Olive-oil derived oleocanthal enhances
b-amyloid clearance as a potential
neuroprotective mechanism against
Alzheimer’s disease: in vitro and in vivo
studies,” ACS Chemical Neuroscience,
4(6), pp. 973–982, 2013.
[11] Monti, M. C., Margarucci, L., Tosco,
A., Riccio, R., Casapullo, A., “New
insights on the interaction mechanism
between tau protein and oleocanthal, an
extra-virgin olive-oil bioactive
component,” Food Function, 2 (7), pp.
423–428, 2011.
[12] Anonim, T.C. Gümrük ve Ticaret
BakanlÕ÷Õ Kooperatifçilik Genel
Müdürlü÷ü, “2014 YÕlÕ Zeytin ve
Zeytinya÷Õ Raporu,” ùubat 2015,
http://koop.gtb.gov.tr/data/53319ec14
87c8eb1e43d72a1/2014%20Zeytinya%
C4%9F%C4%B1%20Raporu.pdf,
2015.
[13] Altan, A., Kola, O., Ya÷ øúleme
Teknolojisi, Bizim Büro YayÕnevi,
Sakarya, 230, 2009.
[14] Lerma-García M. J., Herrero-Martínez
J. M., Ramis-Ramos G., Simó-Alfonso
E. F., “Evaluation of the quality of olive
oil using fatty acid profiles by direct
infusion electrospray ionization mass
spectrometry,” Food Chemistry, 107,
pp. 1307-1313, 2008.
[15] Güler Z., Gürsoy-BalcÕ A. C., Üstünel
M. A, Taú, E., “Hatay bölgesinde
üretilen natürel zeytinya÷larÕnÕn kalite
kriterleri,” Akademik GÕda, SayÕ 24, ss.
18–21, 2006.

G. TÜRK, Z. Tacer-CABA, Burcu ÇAKMAK, H. ÖZPINAR
International Journal of Food Engineering Research (IJFER) Year 2 Num 2 - 2016 (1-17) 15
Codex standard. Unsatisfactory results are
thought to be related with the problems in
storage conditions, olive quality, effect of
geographical differences and process
conditions. On the other hand, fatty acid
compositions were within the limits of
Turkish standards and these results were
indicators of purity but not adulteration. This
study was significant as giving idea about the
quality problems present in the olive oil
products found in the Turkish market and
frequent occurance of unsuitabilities of these
products in the legal limit values.
REFERENCES
[1] Visioli F., Galli C., “Olive oil phenols
and their potential effects on human
health,” Journal of Agricultural and
Food Chemistry, 46, 10, pp. 4292-4296,
1998
[2] Öztürk F., YalçÕn M., DÕraman H.,
“Türkiye zeytinya÷Õ ekonomisine
genel bir bakÕú,” GÕda Teknolojileri
Elektronik Dergisi, Cilt 4, No: 2, pp.
35-51, 2009
http://teknolojikarastirmalar.
com/pdf/tr/02_2009_4_2_58_411.pdf
[3] Bendini, A., Cerretani, L., Carrasco-
Pancorbo, A., Gómez-Caravaca, A. M.,
Segura-Carretero, A., Fernández-
Gutiérrez, A., “Phenolic molecules in
virgin olive oils: a survey of their
sensory properties, health effects,
antioxidant activity and analytical
methods. An overview of the last
decade,” Molecules, 12, pp. 1679–1719,
2007
[4] Simopoluos, A. P., “The Mediterranean
diets: What is so special about the diet
of Greece? The scientific evidence,”
The Journal of Nutrition, 131, pp.
3065S–3073S, 2001.
[5] Calvo, P., Castaño, Aғ ғ . L, Lozano, M.,
González-Gómez, “Influence of the
microencapsulation on the quality
parameters and shelf-life of extra-virgin
olive oil encapsulated in the presence of
BHT and different capsule wall
components,” Food Research
International, 45, pp. 256-261, 2012.
[6] Riediger, N. D., Othhnman, R. A., Suh,
M., Moghadasian, M. H., “A systemic
review of the roles of n-3 fatty acids in
health and disease,” Journal of the
American Dietetic Association, 109(4),
668–679, 2009.
[7] Servilli, M., Esposto, S., Veneziani, G.,
Urbani, S., Taticchi, A., Di Maio, I.,
“Improvement of bioactive phenol
content in virgin olive oil with an olive-
vegetation water concentrate produced
by membrane treatment,” Food
Chemistry, 124, pp. 1308–1315, 2011.
[8] Keys, A., Mienotti, A., Karvonen, M. J.,
Aravanis, C., Blackburn, H., Buzina, R.,
Djordjevic, B. S., Dontas, A. S.,
Fidanza, F., Keys, M. H., Kromhout, D.,
Nedeljkovic, S., Punsar, S., Seccareccia,
F., Toshima, H., “The diet and 15-year
death rate in the seven countries study,”
American Journal of Epidemiology, 124
(6), pp. 903–915. 1986.
[9] Machowetz, A., Poulsen, H. E.,
Gruendel, S., Weimann, A., Fito, M.,
Marrugat, J., De La Torre, R., Salonen,
J. T., Nyyssonen, K., Mursu, J.,
Nascetti, S., Gaddi, A., Kiesewetter, H.,
Baumler, H., Selmi, H., Kaikkonen, J.,
Zunft, H. J. F., Convas, M. I., Koebnick,
C., “Effect of olive oils on biomarkers of
oxidative DNA stress in Northern and
Southern Europeans,” FASEB Journal,
21 (1), pp. 45–52, 2007.
[10] Abuznait, A. H., Qosa, H., Busnena, B.
A., El Sayed, K. A., Kaddoumi, A.,
“Olive-oil derived oleocanthal enhances
b-amyloid clearance as a potential
neuroprotective mechanism against
Alzheimer’s disease: in vitro and in vivo
studies,” ACS Chemical Neuroscience,
4(6), pp. 973–982, 2013.
[11] Monti, M. C., Margarucci, L., Tosco,
A., Riccio, R., Casapullo, A., “New
insights on the interaction mechanism
between tau protein and oleocanthal, an
extra-virgin olive-oil bioactive
component,” Food Function, 2 (7), pp.
423–428, 2011.
[12] Anonim, T.C. Gümrük ve Ticaret
BakanlÕ÷Õ Kooperatifçilik Genel
Müdürlü÷ü, “2014 YÕlÕ Zeytin ve
Zeytinya÷Õ Raporu,” ùubat 2015,
http://koop.gtb.gov.tr/data/53319ec14
87c8eb1e43d72a1/2014%20Zeytinya%
C4%9F%C4%B1%20Raporu.pdf,
2015.
[13] Altan, A., Kola, O., Ya÷ øúleme
Teknolojisi, Bizim Büro YayÕnevi,
Sakarya, 230, 2009.
[14] Lerma-García M. J., Herrero-Martínez
J. M., Ramis-Ramos G., Simó-Alfonso
E. F., “Evaluation of the quality of olive
oil using fatty acid profiles by direct
infusion electrospray ionization mass
spectrometry,” Food Chemistry, 107,
pp. 1307-1313, 2008.
[15] Güler Z., Gürsoy-BalcÕ A. C., Üstünel
M. A, Taú, E., “Hatay bölgesinde
üretilen natürel zeytinya÷larÕnÕn kalite
kriterleri,” Akademik GÕda, SayÕ 24, ss.
18–21, 2006.

EVALUATION OF TURKISH OLIVE OIL QUALITY: SOME QUALITY CHARACTERISTICS AND TURKISH FOOD CODEX
16
[16] Anonim, TS EN ISO 3960:2010,
“Hayvansal ve Bitkisel KatÕ ve SÕvÕ
Ya÷lar-Peroksit de÷eri tayini-
øyodometrik (görsel) son nokta tayini,”
2010.
[17] Grossi, M., Di Lecce, G., Gallina, T.,
Riccò B., “A novel electrochemical
method for olive oil acidity
determination,” Microelectronics
Journal, 2014.
[18] Anonim, TS 4664 EN ISO 5508:1996,
“Hayvansal ve Bitkisel KatÕ ve SÕvÕ
Ya÷lar-Ya÷ Asitleri Metil Esterlerinin
Gaz Kromatografisiyle Analizi,” 1996.
[19] BÕyÕklÕ, K., “Türk Zeytinya÷larÕnÕn
SaflÕk Derecelerinin Belirlenmesi,”
Ankara Üniversitesi Yüksek Lisans
Tezi, 2009
[20] Yavuz, H., “Türk Zeytinya÷larÕnÕn BazÕ
Kalite ve SaflÕk Kriterlerinin
Belirlenmesi,” Yüksek Lisans Tezi,
Ankara Üniversitesi Fen Bilimleri
Enstitüsü, 2008.
[21] U÷urlu, A, H., “Zeytin Olgunlaúma
Derecesinin Zeytinya÷ÕnÕn Fiziksel,
Kimyasal ve Antioksidan Özellikleri
Üzerine Etkisi,” Yüksek Lisans Tezi,
Süleyman Demirel Üniversitesi, GÕda
Mühendisli÷i Anabilim DalÕ, 2011.
[22] Salvador M. D., Aranda F., Gómez-
Alonso S., Fregapane G., "Cornicobra
virgin olive oil: a study of five crop
seasons. Composition, quality and
oxidative stability,” Food Chemistry,
74, pp. 267-274, 2001.
[23] Gutiérrez, F. R., Herrera, C. G.,
Guttierez, G.-Q, “Estudio de la cine´tica
de evolutio´n de los Õ´ndices de calidad
del aceite de oliva virgen durante su
conservatio´n en envases comerciales,”
Grasas y Aceites, 39, pp. 245–253,
1988.
[24] Mastrobaistta, G., “Effect of light on
extra virgin olive oils in different types
of glass bottles,” Italian Journal of Food
Science, 3, pp. 191–195, 1990.
[25] Gökalp Y. H., Nas S., Ünsal M.,
“Yusufeli-Çoruh vadisinde yetiútirilen
farklÕ zeytin çeúitlerinin ve ya÷larÕnÕn
bazÕ fiziksel ve kimyasal özellikleri,”
Standart Dergisi, A÷ustos 1993.
[26] Taúan, M., “Tekirda÷ øli ùarköy
Yöresinin Natürel Zeytin Ya÷larÕnÕn
Fiziksel ve Kimyasal Özelliklerinin
Belirlenmesi Üzerine Bir AraútÕrma,”
Yüksek Lisans Tezi, Trakya
Üniversitesi Fen Bilimleri Enstitüsü, s.
45, 1995.
[27] Köseo÷lu O., Ünal K., Irmak ù.,
AyvalÕk, “Memecik ve Gemlik zeytin
çeúitlerinden farklÕ hasat dönemlerinde
elde edilen ya÷larÕn acÕlÕklarÕ ile bazÕ
kalite kriterleri arasÕndaki iliúkiler,”
Ulusal Zeytin ve Zeytinya÷Õ
Sempozyumu ve Sergisi, 15-17 Eylül
2006/øzmir, 347-357. 2006.
[28] Kaftan A., “FarklÕ yöre zeytinlerinden
elde edilen naturel zeytinya÷ÕnÕn
duyusal kalitesini oluúturan lezzet
maddelerinin SPME/GC/MS ve lezzet
profili analizi teknikleri kullanÕlarak
belirlenmesi,” Ege Üniversitesi Doktora
Tezi, p. 158, 2007.
[29] Bubola, K. B., Koprivnjak, O., Sladonja,
B., Belobrajic, I., “Influence of storage
temperature on quality parameters,
phenols and volatile compounds of
Croatian virgin olive oils,” Grasas y
aceites, 65(3), pp. 034, 2014.
[31] Lotti, G., Izzo, R., Riu, P., “Effects of
climate on acid and sterol composition
of olive oil,” Riviera Soc. Ital. Scien.,
11, pp. 115, 1982.
[32] Osman, M., Metzidakis, I.,
Gerasopoulos, D., Kiritsakis, A.,
“Qualitative changes in olive oil fruits
collected from trees grown at two
altitudes,” Riv. Ita. Sost. Grasse, 71, pp.
187-190, 1994.
[33] Kiritsakis, A. K., Olive Oil, 2nd Ed,
Food and Nutrition Press, Trumbull, CT,
1998.
[34] TanÕlgan, K., Özcan, M. M., Ünver, A.,
Physical and chemical characteristics
of five Turkish olive (Olea europea L.)
varieties and their oils,” Grasas Y
Aceites, 58 (2), pp. 142-147, 2007.
[35] Arslan D., “Physico-chemical
characteristics of olive fruits of Turkish
varieties from the province of Hatay,”
Grasas Y Aceites, 63(2), pp. 158-166,
2012.
[36] Gürdeniz, G., Ozen, B., Tokatli, F.,
“Classification of Turkish olive oils
with respect to cultivar, geographic
origin and harvest year, using fatty acid
profile and mid-IR spectroscopy,”
European Food Research and
Technology, 227, pp. 1275-1281, 2008.

G. TÜRK, Z. Tacer-CABA, Burcu ÇAKMAK, H. ÖZPINAR
International Journal of Food Engineering Research (IJFER) Year 2 Num 2 - 2016 (1-17) 17
[16] Anonim, TS EN ISO 3960:2010,
“Hayvansal ve Bitkisel KatÕ ve SÕvÕ
Ya÷lar-Peroksit de÷eri tayini-
øyodometrik (görsel) son nokta tayini,”
2010.
[17] Grossi, M., Di Lecce, G., Gallina, T.,
Riccò B., “A novel electrochemical
method for olive oil acidity
determination,” Microelectronics
Journal, 2014.
[18] Anonim, TS 4664 EN ISO 5508:1996,
“Hayvansal ve Bitkisel KatÕ ve SÕvÕ
Ya÷lar-Ya÷ Asitleri Metil Esterlerinin
Gaz Kromatografisiyle Analizi,” 1996.
[19] BÕyÕklÕ, K., “Türk Zeytinya÷larÕnÕn
SaflÕk Derecelerinin Belirlenmesi,”
Ankara Üniversitesi Yüksek Lisans
Tezi, 2009
[20] Yavuz, H., “Türk Zeytinya÷larÕnÕn BazÕ
Kalite ve SaflÕk Kriterlerinin
Belirlenmesi,” Yüksek Lisans Tezi,
Ankara Üniversitesi Fen Bilimleri
Enstitüsü, 2008.
[21] U÷urlu, A, H., “Zeytin Olgunlaúma
Derecesinin Zeytinya÷ÕnÕn Fiziksel,
Kimyasal ve Antioksidan Özellikleri
Üzerine Etkisi,” Yüksek Lisans Tezi,
Süleyman Demirel Üniversitesi, GÕda
Mühendisli÷i Anabilim DalÕ, 2011.
[22] Salvador M. D., Aranda F., Gómez-
Alonso S., Fregapane G., "Cornicobra
virgin olive oil: a study of five crop
seasons. Composition, quality and
oxidative stability,” Food Chemistry,
74, pp. 267-274, 2001.
[23] Gutiérrez, F. R., Herrera, C. G.,
Guttierez, G.-Q, “Estudio de la cine´tica
de evolutio´n de los Õ´ndices de calidad
del aceite de oliva virgen durante su
conservatio´n en envases comerciales,”
Grasas y Aceites, 39, pp. 245–253,
1988.
[24] Mastrobaistta, G., “Effect of light on
extra virgin olive oils in different types
of glass bottles,” Italian Journal of Food
Science, 3, pp. 191–195, 1990.
[25] Gökalp Y. H., Nas S., Ünsal M.,
“Yusufeli-Çoruh vadisinde yetiútirilen
farklÕ zeytin çeúitlerinin ve ya÷larÕnÕn
bazÕ fiziksel ve kimyasal özellikleri,”
Standart Dergisi, A÷ustos 1993.
[26] Taúan, M., “Tekirda÷ øli ùarköy
Yöresinin Natürel Zeytin Ya÷larÕnÕn
Fiziksel ve Kimyasal Özelliklerinin
Belirlenmesi Üzerine Bir AraútÕrma,”
Yüksek Lisans Tezi, Trakya
Üniversitesi Fen Bilimleri Enstitüsü, s.
45, 1995.
[27] Köseo÷lu O., Ünal K., Irmak ù.,
AyvalÕk, “Memecik ve Gemlik zeytin
çeúitlerinden farklÕ hasat dönemlerinde
elde edilen ya÷larÕn acÕlÕklarÕ ile bazÕ
kalite kriterleri arasÕndaki iliúkiler,”
Ulusal Zeytin ve Zeytinya÷Õ
Sempozyumu ve Sergisi, 15-17 Eylül
2006/øzmir, 347-357. 2006.
[28] Kaftan A., “FarklÕ yöre zeytinlerinden
elde edilen naturel zeytinya÷ÕnÕn
duyusal kalitesini oluúturan lezzet
maddelerinin SPME/GC/MS ve lezzet
profili analizi teknikleri kullanÕlarak
belirlenmesi,” Ege Üniversitesi Doktora
Tezi, p. 158, 2007.
[29] Bubola, K. B., Koprivnjak, O., Sladonja,
B., Belobrajic, I., “Influence of storage
temperature on quality parameters,
phenols and volatile compounds of
Croatian virgin olive oils,” Grasas y
aceites, 65(3), pp. 034, 2014.
[31] Lotti, G., Izzo, R., Riu, P., “Effects of
climate on acid and sterol composition
of olive oil,” Riviera Soc. Ital. Scien.,
11, pp. 115, 1982.
[32] Osman, M., Metzidakis, I.,
Gerasopoulos, D., Kiritsakis, A.,
“Qualitative changes in olive oil fruits
collected from trees grown at two
altitudes,” Riv. Ita. Sost. Grasse, 71, pp.
187-190, 1994.
[33] Kiritsakis, A. K., Olive Oil, 2nd Ed,
Food and Nutrition Press, Trumbull, CT,
1998.
[34] TanÕlgan, K., Özcan, M. M., Ünver, A.,
Physical and chemical characteristics
of five Turkish olive (Olea europea L.)
varieties and their oils,” Grasas Y
Aceites, 58 (2), pp. 142-147, 2007.
[35] Arslan D., “Physico-chemical
characteristics of olive fruits of Turkish
varieties from the province of Hatay,”
Grasas Y Aceites, 63(2), pp. 158-166,
2012.
[36] Gürdeniz, G., Ozen, B., Tokatli, F.,
“Classification of Turkish olive oils
with respect to cultivar, geographic
origin and harvest year, using fatty acid
profile and mid-IR spectroscopy,”
European Food Research and
Technology, 227, pp. 1275-1281, 2008.