evaluation of tumor prevalence in mummichogs
TRANSCRIPT


Evaluation of Tumor Prevalence in Mummichogs (Fundulus heteroclitus) from the Delaware Estuary Watershed
Final Report
CBFO-C04-04
Prepared by
Alfred E. Pinkney1
John C. Harshbarger2
Under Supervision of:
John P. Wolflin, Field Supervisor Tom McCabe, Assistant Field Supervisor
Sherry Krest, Program Leader
1Environmental Contaminants Program U.S. Fish and Wildlife Service Chesapeake Bay Field Office 177 Admiral Cochrane Drive
Annapolis, MD 21401
2George Washington University Medical Center Department of Pathology
2300 I Street, NW Washington, DC 20037
for
David Carter
Delaware Coastal Management Program Delaware Department of Natural Resources and Environmental Control
89 Kings Highway, P.O. Box 1401 Dover, DE 19903
December 2004


i
ABSTRACT
Environmental scientists and managers often use tumor surveys with freshwater, estuarine, and marine fish as indicators of habitat quality. In 2002-2004, we collected mummichogs (Fundulus heteroclitus, > 70 mm total length, n = 21-30 per location) from four areas within the Delaware Estuary watershed. Necropsies were performed and livers and raised skin lesions were examined histopathologically for tumors and preneoplastic lesions. Area 1 was a portion of the Christina River watershed, where one location in Hershey Run was sampled in 2002 and 2003. Two samples were collected in 2003 in the newly restored Newport Marsh along the Christina River. In Area 2, the effluent channel of the Motiva oil refinery on the Delaware River, one location was sampled in 2004. In Area 3, the St. Jones River, one location near the Delaware National Estuarine Research Reserve (DNERR) was sampled in 2003. In Area 4, Blackbird Creek, one location near the DNERR was sampled in 2003. No skin tumors were diagnosed in any of the mummichogs. No liver tumors were diagnosed in the St. Jones River, Motiva, Newport Marsh Upriver, or Newport Marsh Downriver collections. In the Blackbird Creek collection, one of 30 fish had a liver with foci of hepatocellular alteration (FHA, a preneoplastic lesion) and one was diagnosed with hepatocellular carcinoma (HC; 3% prevalence for each lesion). The prevalence of HC was dramatically higher in the Hershey Run mummichogs in 2002 (7 of 21, 33%) and 2003 (3 of 29, 10%) compared to the other locations. In 2002, 5 of 21 (24%) Hershey Run mummichogs had livers with FHA whereas, in 2003, only 1 of 29 (3%) had FHA. The prevalence of HC and FHA was significantly higher in the Hershey Run mummichogs (2002 and 2003 collections pooled) compared with the pooled other collections (Fisher’s Exact Test, p = 0.001 for FHA, p<0.001 for HC). Because high sediment PAH concentrations have been associated with liver tumors in mummichogs, we searched the literature for such data from the fish collection locations. No data were available for Motiva or Newport Marsh. Data were identified for the St. Jones River about one km upriver and Blackbird Creek about five km downriver of the fish collection locations. Total PAH concentrations were 10.976 ppm and 1.486 ppm, respectively. For Hershey Run, which is located adjacent to the Koppers Superfund Site where creosote was released, one sample close to the collection site had a total PAH concentration of 13,300 ppm and others were above 1000 ppm. Although data are limited, in this study Hershey Run had both the highest sediment PAHs and the highest lesion prevalence. These findings are consistent with Vogelbein et al. (1990), who reported a 33% HC prevalence in mummichogs collected from the Elizabeth River adjacent to a Superfund site that released creosote (2200 ppm total PAH in sediment at collection site). We conclude that preneoplastic lesions and tumors in mummichog livers were associated with the presence of highly contaminated sediment containing PAHs derived from creosote. Mummichogs collected from the areas not heavily contaminated with PAHs had few or no liver tumors or preneoplastic lesions. An increased prevalence of tumors or other deformities is used as an indicator of Beneficial Use Impairment in the monitoring and evaluation of Great Lakes Areas of Concern. In the Chesapeake Bay, tumor surveys have been used to highlight contaminant impacts in two Regions

ii
of Concern, the Elizabeth and Anacostia Rivers, and monitor progress. For the Delaware Estuary, we recommend developing a database so that tumors and preneoplastic lesions can be used effectively as a monitoring tool. This would involve surveys with brown bullheads and/or mummichogs, depending on salinity and availability. For each species, there is a need to develop a database containing age-specific and sex-specific tumor prevalence at reference and contaminated sites. Studies that include tumor prevalence, biomarker analyses (such as DNA adducts and PAH metabolites in bile), and sediment/tissue chemistry can be used to provide a weight-of-evidence for specific chemical classes.

iii
ACKNOWLEDGMENTS We thank Peter McGowan, Chris Guy, Ray Li, and Michelle Eversen of the U.S. Fish and Wildlife Service and Mike Mensinger of the Delaware Department of Natural Resources and Environmental Control for their help with the fish collections. Dr. Bob Scarborough and David Carter provided advice and information on site selection. Matthew T. Mellon of the U.S. Environmental Protection Agency Region III provided chemistry data on Hershey Run. Patty McCawley, Laurie Hewitt, and Leslie Gerlich helped with the preparation of the report. The project was funded by the Delaware Department of Natural Resources and Environmental Control.
3/30/2005 C:\USR\FINREPS\deltumorc0404\cbfoc0404reprtinclappc.doc

iv
TABLE OF CONTENTS ABSTRACT..................................................................................................................................... i
ACKNOWLEDGMENTS ............................................................................................................. iii
TABLE OF CONTENTS............................................................................................................... iv
LIST OF TABLES.......................................................................................................................... v
LIST OF FIGURES ........................................................................................................................ v
LIST OF APPENDICES................................................................................................................. v
INTRODUCTION .......................................................................................................................... 1
MATERIALS AND METHODS.................................................................................................... 1
Sampling Locations ..................................................................................................................... 1 Collection Procedures.................................................................................................................. 4 Laboratory Procedures................................................................................................................. 4 Data Analysis............................................................................................................................... 4
RESULTS ....................................................................................................................................... 4
Biological Data ............................................................................................................................ 4 Pathology..................................................................................................................................... 5
DISCUSSION................................................................................................................................. 6
RECOMMENDATION .................................................................................................................. 7
REFERENCES ............................................................................................................................... 7

v
LIST OF TABLES Table 1. Biological data for the seven mummichog (Fundulus heteroclitus) collections. Table 2. Summary of lesion data and statistical comparisons (Fisher’s Exact Test)
LIST OF FIGURES Figure 1. Maps of the mummichog collection areas: a) Christina River and Motiva Channel, b) St. Jones River, c) Blackbird Creek. Figure 2. Prevalence of liver lesions (FHA = foci of hepatocellular alteration, HC = hepatocellular carcinoma, TLL = a fish with either FHA or HC) in mummichogs from Blackbird Creek (BC), Hershey Run 2002 (HR02) or 2003 (HR03) Figure 3. HR03-19 (Hershey Run 2003): Sculptured leading edge of hepatocellular carcinoma (dark cells) invading and destroying normal liver tissue. Note the enlarged bull’s eye nuclei in the cancer cells. Arrow points to a mitotic figure in telophase. Figure 4. HR03-19 (Hershey Run 2003): Rapid cancer growth rate indicated by at least six mitotic figures (arrows)
LIST OF APPENDICES Appendix A. Photographs of Sampling Locations and Evidence of Parasitic Infestation. Appendix B. Spreadsheets with Biological and Pathological Data Appendix C. Glossary of Pathological Terminology

vi

1
INTRODUCTION Environmental scientists conduct tumor surveys in bottom-dwelling fish to serve as an indicator of habitat quality and a tool for monitoring the success of cleanup actions (e.g., Baumann et al. 1996, Baumann and Harshbarger 1998, Myers et al. 1994). In North American freshwater ecosystems, the brown bullhead (Ameiurus nebulosus) has been shown to develop skin and liver tumors in response to contaminant exposure, with the most persuasive linkage for areas with polynuclear aromatic hydrocarbon (PAH)-contaminated sediments (Baumann and Harshbarger 1998). Recently, Baumann (2002) stated that liver tumor prevalence above about 5% and skin tumor prevalence above 12% could be used to distinguish between highly contaminated and less contaminated areas in the Great Lakes. The U.S. Fish and Wildlife Service, Chesapeake Bay Field Office (CBFO) has developed a database on tumors in brown bullheads from the tidal freshwater areas of the Chesapeake Bay watershed (Pinkney et al. 1995, 2001, 2004a, b). Although brown bullheads have been captured in waters with salinity as high as 15 parts per thousand (Boyer 1995), they are primarily a freshwater species and can be difficult to locate in estuarine waters. In the higher salinity waters of the Elizabeth River, a Chesapeake Bay Region of Concern, the mummichog, Fundulus heteroclitus, has been used in tumor surveys (Vogelbein et al. 1990, Vogelbein and Zwerner 2000, Vogelbein and Unger 2003). Vogelbein et al. (1990) reported a 33% prevalence of liver tumors in mummichogs collected near the Atlantic Wood Treating Superfund Site on the Elizabeth River, Virginia, where sediments are contaminated with creosote. A sediment sample measured near the fish collection area contained 2200 parts per million (ppm) total PAHs (dry weight). Mummichogs are a suitable species for such surveys because they: 1) are highly localized with summer home range of 36 meters in tidal creeks and somewhat more extensive movements in fall and winter; 2) have considerable contact with sediments, feeding on bottom-dwelling invertebrates; 3) tolerate a wide range of salinity (Whitehead 1995); and 4) are easy to collect and transport. Mummichogs are currently used by the Elizabeth River Project as an indicator of the quality of estuarine habitats (Elizabeth River Project 2002). We conducted a mummichog tumor survey at selected locations within the Delaware Estuary watershed. Our objective was to evaluate the prevalence of skin and liver tumors in mummichogs from locations where polynuclear aromatic hydrocarbon (PAH) contamination is suspected and from the two Delaware National Estuaries Research Reserves (DNERRs), where long term monitoring is being conducted. This study is the first systematic fish tumor survey in Delaware and is intended to provide environmental managers with a meaningful indicator for watershed monitoring.
MATERIALS AND METHODS
Sampling Locations We sampled within four general areas: Christina River and tributaries, Motiva effluent channel to the Delaware River, St. Jones River, and Blackbird Creek. The sampling locations within each area are shown in Figure 1 a, b, c (see Table 1 for latitude and longitude). Locations were chosen based on proximity to a suspected PAH source area, a DNERR, or representative tidal marsh and

2
availability of mummichogs. A general description of each area is provided below including the rationale for the specific sampling locations and sediment PAH data retrieved from the literature. Photographs of the sampling locations are provided in Appendix A. Area 1: Christina River watershed The Christina River is a tidal freshwater system that flows into the Delaware through a highly industrialized watershed, containing eight federal and several state Superfund sites. For example, the Koppers Superfund site is a former wood treating facility that released PAHs and metals into Hershey Run, and wetlands adjacent to White Clay Creek and the Christina. Throughout the watershed, sediments are contaminated with polychlorinated biphenyls (PCBs), polynuclear aromatic hydrocarbons (PAHs), pesticides, and toxic metals (Olinger 1997). The public is urged not consume any finfish from the tidal Christina River because of PCBs and dieldrin and from tidal White Clay Creek due to PCBs (DNREC 2004). Olinger (1997) reported the occurrence of sediment toxicity and measured carcinogenic PAHs in the 20 ppm (wet weight) range using immunoassay screening procedures. Sampling conducted as part of the Koppers investigation, indicated that a Christina River sediment sample collected near the confluence of White Clay Creek contained a total PAH concentration of 23.5 ppm and one location in Hershey Run had a total PAH concentration of 13,300 ppm (Woodward-Clyde 1996). We selected Hershey Run as a sampling location because it is known to be highly contaminated with PAHs from spillage of creosote. We selected two locations within Newport Marsh, a newly restored tidal marsh, in an attempt to determine tumor prevalence in a representative marsh within the watershed. In a restoration effort started in 2002 and completed in 2003, tidal flows were restored to the 44-acre marsh by removing a dike between the river and the marsh. Further restoration efforts included the removal of rubbish and old tires from decades of use as an illegal dumping ground (Connectiv Power Delivery 2002). No sediment chemistry data were identified for Newport Marsh. Mummichogs were collected from Hershey Run, within 100 meters upstream and downstream of the Railroad Bridge, adjacent to the Koppers Superfund Site on August 9, 2002 and October 1, 2003. The collections were labeled as Hershey 02 (HR02, n=21) and Hershey 03 (HR03, n=29). During collection, an oil sheen arose from the sediments. Two collections of mummichogs were made at Newport Marsh on October 2, 2003 and designated as Newport Marsh Upriver (NMU, n=29) and Newport Marsh Downriver (NMD, n=30, Figure1a). Area 2: Motiva Effluent Channel The industrialized Delaware City area of the Delaware River is impacted by releases from several operating and former facilities. Several Superfund sites (Standard Chlorine, Tybouts Corner) are located in the nearby Red Lion Creek subwatershed. A fish consumption advisory is in place for the Delaware River north of the Chesapeake and Delaware Canal (including the effluent channel), which advises the public not to eat finfish due to PCBs, dioxin, mercury, and chlorinated pesticides (DNREC 2004). There are reports of repeated National Pollutant Discharge Elimination System (NPDES) violations from the Motiva Refinery (DNREC 2000), including an

3
unpermitted discharge of lubricant oil into surface water of the effluent channel leading to the Delaware River. We selected the Motiva effluent channel as a sampling area because of the history of releases of petroleum products. Sediment data have been collected (L. Hall, University of Maryland, Wye Research and Education Center, pers. comm.) but are not available because of a legal case. We collected mummichogs from the Motiva effluent channel (Figure 1a) on June 7 and 17, 2004. The sample was designated as Motiva (MOT, n=30). There were visible oil sheens and oily odors in the intertidal marsh areas where the fish were collected. Area 3: Lower St. Jones River Estuarine Reserve One of the two DNERR sites is the Lower St. Jones River Reserve. The St. Jones River watershed drains a portion of the coastal plain in central Kent County, DE, including the city of Dover, the surrounding suburbs, industrial areas, agricultural areas and Dover Air Force Base (NERR web site: http://inlet.geol.sc.edu/DEL/st_jones_river.html). The river is less than pristine; four National Priority List Superfund sites, including the former Dover Gas Light facility that released PAHs, are in the watershed. DNREC (2004) advises the public not to eat more than two 8-ounce meals of finfish per year from the St. Jones River due to PCBs and dioxin contamination. The abundance of mummichogs at the Reserve was documented on the web site: http://www.dnrec.state.de.us/dnrec2000/divisions/soil/dnerr/tmp1023300816.htm. We chose the St. Jones River as part of the study objective of obtaining tumor data within or near the DNERRs. A collection of 27 mummichogs (SJ) were obtained through efforts on June 17, June 23, and July 31, 2003 from an area of the St. Jones River about 200 meters downstream of the Route 10 Bridge, approximately 3 km upriver of the Reserve boundary. The National Oceanic and Atmospheric Administration (NOAA) collected and analyzed a sediment sample (NOAA 89), located about 1 km upriver (Hartwell et al. 2001, Figure 1b). Total PAHs were reported to be 10.976 ppm. Area 4: Upper Blackbird Creek Estuarine Reserve Upper Blackbird Creek is believed to be relatively unimpacted from local sources of industrial contaminants (D. Carter, DNREC, pers. comm.), although there is concern about non-point source pollution from silviculture and agricultural runoff (DNREC 1999). Blackbird Creek is not listed by DNREC (2004) as having any fish consumption advisories. A total of 30 mummichogs (designated as BC) were collected from a side channel of Blackbird Creek on June 30 and August 1, 2003, in a largely agricultural subwatershed. The sampling location is about 3 km downriver of the Reserve boundary. NOAA) collected and analyzed a sediment sample (NOAA 85), located about 5 km upriver of the fish collection location (Hartwell et al. 2001, Figure 1c). Total PAHs were reported to be 1.486 ppm.

4
Collection Procedures Our sampling goal was to collect 30 adult individuals at each location. The minimum length of 70 mm was established by balancing the recommended 75 mm minimum of Vogelbein et al. (1990) with the limited availability of larger fish. Mummichogs were collected with a 10-foot or 25-foot beach seine, often aided by using a second 25-foot seine as a block net. Fish were measured for total length, kept alive in aerated site water, and transported to the Chesapeake Bay Field Office, where necropsies were conducted within 24 hours. Water quality parameters (temperature, pH, conductivity, salinity, and dissolved oxygen) were recorded at the time of collection (Appendix B).
Laboratory Procedures Fish were measured for total length, weighed, euthanized by severing the spinal cord, and necropsied. Condition factor [K = (wt (g) x 105) / length (mm)3] was determined. Visible lesions were noted and examples photographed. The viscera were opened and livers were excised and weighed so that the hepatosomatic index (HSI=liver wt/body wt) could be calculated. The liver, cut in 0.5-cm wide slides, and skin pieces with raised lesions were stored in 10% buffered neutral formalin and transported to the George Washington University Medical Center (Washington, DC) for histopathological examination and tumor diagnosis. The tissues were embedded, sectioned at 4 um, and stained with hematoxylin and eosin (Luna 1968). Tissue blocks were prepared from each liver and from each skin lesion. A glossary of histopathological terms is provided as Appendix C.
Data Analysis Histopathological data were summarized as the prevalence of the various types of lesions among the collections of mummichogs. A glossary of terms is provided in Appendix B. The significance of differences in the prevalence of lesions between pairs of sampling locations was determined using a series of two-tailed chi-square tests (Sokal and Rohlf 1981), with Yates Correction for continuity, using a critical p value of 0.05. In cases where there was less than a minimum expected count of 5, Fisher’s Exact test was used (Jandel Corp. 1995). Pooling was used in the analysis to reduce the number of comparisons and, therefore, the likelihood of Type I errors (false positives). Biological data including the length, weight, condition factor, and HSI were compared using analysis of variance, with log-transformation if necessary to meet the assumptions for parametric statistics. If these assumptions could not be satisfied, a Kruskal-Wallis test was used to compare the median values of the collections. Tukey’s multiple comparison test (ANOVA) or Dunn’s method (Kruskal-Wallis) were used to identify statistical significance between collections with a significance level of 0.05.
RESULTS
Biological Data Among the seven collections of mummichogs, there were significant differences in length, weight, condition factor, and HSI (Table 1). For example, the median length of the MOT

5
mummichogs (82 mm) was significantly greater than the median length of the HR02 mummichogs (74 mm; Kruskal-Wallis test, p=0.017, Dunn’s method, p<0.05). There were significant differences in both weight and condition factor among the collections. The most robust (highest K) was in the MOT (mean: 1.39) and HR03 (mean: 1.37) collections. These collections had significantly higher mean K than the SJ (1.26), HR02 (1.23), and BC (1.23) collections (ANOVA, p<0.001; Tukey’s test, p<0.05). HSI differences were apparent, with the median values at HR03 (0.038), NMU (0.038), and NMD (0.036) significantly higher than the medians at MOT (0.022), SJ (0.018), and BC (0.017) (Kruskal-Wallis test, p<0.001, Dunn’s method, p<0.05).
Pathology Gross examination revealed that many of the fish had small cream-colored raised lesions on the skin, often at the base of the pectoral, dorsal, and caudal fins. Some live cream-colored worms could be excised from these lesions upon gross examination. Eleven such skin lesions, from NMU fish submitted for histopathological examinations, were all determined to be parasitic worms. The only fish with a grossly visible liver lesion suspected to be a tumor was HR0217, from Hershey Run in 2002. It had a large gray mass on one side of the organ. Based on histopathological examination, this was later diagnosed as a granuloma, a mass of tissue formed as an inflammatory reaction to a parasitic worm infestation (remnants of which were observed in the liver and adjacent heart tissue). Many fish were observed to have worms (believed to be nematodes) in the intestines and liver (Appendix A). Except for these infestations and the granuloma, there were no grossly visible liver lesions. Liver coloration was noted on the necropsy data sheets and varied from coffee-colored to deep red. There were no histopathological liver lesions in the following collections: MOT, NMD, NMU, and SJ. We diagnosed foci of hepatocellular alteration (FHA) and hepatocellular carcinomas (HC) in mummichogs from each of the other three collections (HR02, HR03, and BC; Figure 2, see Appendix B for a spreadsheet listing individual fish). Eleven HR02 specimens had hepatocellular neoplasms and/or precursor neoplasms as follows. Two mummichogs (HR0223 and HR0227) had a FHA (tinctorially altered population without dysplasia) and nine (HR0201, 0204, 0213, 0214, 0216, 0217, 0218, 0220, 2024) had a small well-differentiated HC. Three of the nine (HR0201, 0216, and 0220) also had a FHA. One specimen (HR0201) with a liver neoplasm also had six clusters of necrotic cells (single cell necrosis), similar in appearance to spongiosis hepatis reported in rodents (Bannasch et al. 1981; Bannasch and Zerban 1986), illustrated in medaka (Hinton et al. 1984), and described in sheepshead minnow (Couch and Courtney 1991) experimentally exposed to chemicals. For the HR03 mummichogs, three had HC and one fish had an incipient neoplasm in the form of a clear cell FHA. Two of the HCs were well differentiated and one was anaplastic. The anaplastic HC was a mass of unpolarized, basopholic, pleomorphic cancer cells each with a prominant bull’s eye nucleus. The advancing mass was invading and replacing normal liver along the interface (Figure 3). The mass was rapidly growing as indicated by up to six mitotic figures per high power microscopic field (Figure 4).

6
Fisher’s Exact tests compared the prevalence of FHA, HC, and total liver lesions (TLL; i.e. having either an FHA or HC) between the collections with no lesions (MOT, SJ, NMU, and NMD) and the BC collection (one FHA, one HC, two TLL). Since there were no significant differences (p>0.05), these collections were pooled (Table 2). The mummichogs collected from Hershey Run (HR02 and HR03) had much higher lesion prevalence (Fig. 2) than those from any of the other locations. After testing HR02 vs. HR03 (two-tailed, chi-square), it was determined that the two years could be pooled for FHA and HC but not for TLL. There was a significantly higher FHA prevalence in the pooled Hershey Run collections vs. the pooled other locations (12% vs. 0.7%; Fisher’s Exact Test, p=0.001). There was also a significantly higher HC prevalence in mummichogs from Hershey Run vs. the other locations (20% vs. 0.7%, Fisher’s, p<0.001). TLL prevalence in both the HR02 and HR03 collections was also significantly greater than that in mummichogs from the other locations (Table 2).
DISCUSSION Mummichogs from Hershey Run had a dramatically higher prevalence of liver tumors (10% and 33%) than those from the other Delaware Estuary locations (0-3%). The high HC prevalence near a Superfund Site that released creosote was consistent with Vogelbein et al. (1990), who reported a 33% prevalence of HC in mummichogs near the Atlantic Wood Superfund Site in the Elizabeth River. Vogelbein and Unger (2003) stated that there was a clear positive association between PAH contamination and liver pathology, specifically FHA and/or tumors (either hepatocellular carcinoma or hepatocellular adenoma). They collected 60 mummichogs from each of 12 sites in the Elizabeth River watershed. At each site, two sediment samples were analyzed for 18 PAH compounds. Tumors were reported at four locations, with a prevalence of 1.7% (site SBB2), 1.7% (SBD3), 8.3% (SBB1), and 10.0% (EBB2). Three of these (SBD3, SBB1, and EBB2) had the highest FHA prevalence (60-68%), whereas the fourth (SBB2) had an FHA prevalence of 11.7%. Total PAHs in the sediments with >60% FHA ranged from 52.4 ppm to 490.8 ppm, while that at SBB2 was 13.6 ppm. At the lower end of the range, SBD4 had no tumors, 8.3% FHA and a total PAH concentration of 0.207 ppm. Previously, Vogelbein et al. (1990) did not diagnose any tumors or preneoplastic lesions in mummichogs collected from a site (Scuffletown Creek) where sediments contained 61 ppm total PAHs. Environmental managers often develop guidance values for sediment contaminants associated with adverse biological effects. In an evaluation of West Coast tumor studies, Horness et al. (1998) used regression analysis to propose 2.8 ppm total PAH as a threshold sediment concentration, above which an increased prevalence of hepatic lesions occurred. No suggested tumor or lesion thresholds have been proposed for either freshwater or estuarine fish. The ongoing efforts in the Elizabeth River may ultimately yield a database sufficient to conduct such analyses for mummichogs. The work of Vogelbein and Unger (2003) suggests that a positive relationship exists but they did not conduct a statistical analysis. The present study cannot contribute to such a database because it lacked co-located sediment data for most sites. Only Hershey Run appears to be well-characterized with respect to sediment PAH concentrations. If possible, future tumor surveys should include collection of at least three sediment samples with analysis for the full suite of PAHs, both parent and alkylated.

7
Vogelbein and Zwerner (2000) classified study sites on a 1 to 4 scale as follows: 1-not a problem - FHA (their term is AHF) <5% and no neoplasms; 2- borderline – FHA: 5-20%, neoplasms 0%; 3 -a problem: FHA 20-30%, neoplasms <5%; and 4 – severe problem - FHA > 30%, neoplasms >5%. Based on this classification, Hershey Run 02 would rank as a severe problem based on the neoplasm prevalence of 33% with FHA of 24%. Hershey Run 03 would probably still rank as a severe problem, based on the 10% neoplasm prevalence, even though FHA was only 3%. Blackbird Creek would most likely be classified as borderline. There was a large difference in the HC prevalence in Hershey Run between 2002 (33%) and 2003 (10%). Coincidentally, these collections were very different in sex ratio, with 2002 consisting of 4 males and 17 females and 2003 with 24 males and 5 females. Tumors occurred only in females in 2002 and only in males in 2003. Cooke and Hinton (1999) stated that there is often a higher prevalence of hepatocellular neoplasia in females, although they do not cite data for mummichogs. Pinkney et al. (2004a) found that female brown bullheads had nearly double the tumor prevalence of males (95% vs. 50%) and identified sex as a significant risk factor, using logistic regression. In the present study, however, it is unlikely that the lower tumor prevalence in 2003 reflects a difference in susceptibility between males and females, since all three of the tumors occurred in males. In brown bullheads, several studies have reported higher HSI in fish from contaminated areas and a statistical association between HSI and tumors (Pinkney et al. 2001, 2004a). Because parasitic worms were observed frequently and to varying degrees in the liver and intestines, we suspect that differences in HSI among the collections of mummichogs reflected varying degrees of parasitic infestation rather than responses to carcinogens. Similarly, condition factor may also be affected by parasitic loads.
RECOMMENDATION An increased prevalence of tumors or other deformities is used as an indicator of Beneficial Use Impairment in the designation and monitoring of Great Lakes Areas of Concern. In the Chesapeake Bay, tumor surveys have been used to highlight contaminant impacts in two Regions of Concern, the Elizabeth River and the Anacostia River, and target areas for remediation. In the Delaware Estuary, we recommend developing a database so that tumors and deformities can be used in a similar manner as in the Great Lakes. This would involve surveys with brown bullheads and/or mummichogs, depending on the salinity of the habitat. For each species, there is a need to develop a database containing age-specific and sex-specific tumor prevalence at reference and contaminated sites. Studies that include tumor prevalence; biomarker analyses such as DNA adducts and bile metabolites; and sediment/tissue chemistry can be used to provide a weight-of-evidence for specific chemical classes (see Pinkney et al. 2001, 2004a).
REFERENCES Bannasch, P., Bloch, M. and H. Zerban. 1981. Spongiosis hepatis: Specific changes of the perisinusoidal liver cells induced in rats by N-nitrosomorpholine. Laboratory Investigation 44: 252-264.

8
Bannash, P. and H. Zerban. 1986. Pathogenesis of primary liver tumors induced by chemicals. Recent Results in Cancer Research 100: 1-15. Baumann, P.C. 2002. Beneficial use impairment #4: Fish tumors and other deformities. In: Workshop on the delisting criteria on the Detroit River Area of Concern. Proceedings of a workshop held at the University of Windsor, April 26-27, 2002. Environment Canada, Burlington, Ontario, Canada. Baumann, P.C. and J.C. Harshbarger. 1998. Long term trends in liver neoplasm epizootics of brown bullhead in the Black River, Ohio. Environ. Monit. Assess. 53:213-223. Baumann, P.C., I.R. Smith, and C.D. Metcalfe. 1996. Linkages between chemical contaminants and tumors in benthic Great Lakes Fish. J. Great Lakes Res. 22:131-152. Boyer, M.R. 1995. Catfish. In: L.E. Dove and R.M. Nyman, editors, Living Resources of the Delaware Estuary. The Delaware Estuary Program. pp. 157-166. Connectiv Power Delivery. 2002. Tidal flows restored to Newport Marsh. Press release. November 14, 2002. Connectiv Power Delivery, Carneys Point, NJ. Cooke, J.B. and D.E. Hinton. 1999. Promotion by 17β-estradiol and β-hexachlorocyclohexane of hepatocellular tumors in medaka, Oryzias latipes. Aquat. Toxicol. 45:127-145. Couch, J.A. and L.A. Courtney. 1991. Spongiosis hepatis: Chemical induction, pathogenesis, and possible neoplastic fate in a teliost model. Toxicologic Pathology 19: 237-250. Delaware Department of Natural Resources and Environmental Control (DNREC). 1999. Delaware National Estuarine Research Reserve Estuarine Profiles. DNREC, Dover, DE. Delaware Department of Natural Resources and Environmental Control (DNREC). 2000. Motiva served with notice of $390,000 penalty for NPDES permit violations. DNREC News 30 (58), March 21, 2000. Dover, DE. Delaware Department of Natural Resources and Environmental Control (DNREC). 2004. Fish consumption advisories. DNREC Online, http://www.dnrec.state.de.us/fw/advisory.htm. Elizabeth River Project. 2002. Elizabeth River restoration and conservation. A watershed action plan. Revised second edition. Elizabeth River Project, Portsmouth, VA. Hartwell, S.I., J. Hameedi, and M. Harmon. 2001. Magnitude and extent of contaminated sediment and toxicity in Delaware Bay. NOAA Tech. Mem. NOS ORCA 148. NOAA, Silver Spring, MD.

9
Hinton, D. E., Clark Lantz, R. and J.A. Hampton. 1984. Effect of age and exposure to a carcinogen on the structure of the medaka liver: a morphometric study. National Cancer Institute Monograph 65: 239-249. Horness, B.H., D.P. Lomax, L.L. Johnson, M.S. Myers, S.M. Pierce, and T.K. Collier. 1998. Sediment quality thresholds: estimates from hockey stick regression of liver lesion prevalence in English sole (Pleuronectes vetulus). Environ. Toxicol. Chem. 17:872-882. Jandel Corp. 1995. Sigma Stat Statistical Software. User’s manual Version 2.0. Jandel Corp., San Rafael, CA. Luna, L. (ed.). 1968. Manual of Histologic Staining Methods of the Armed Forces Institute of Pathology. McGraw Hill, New York. Myers, M.S., C.M. Stehr, O.P. Olson, L.L Johnson, B.B. McCain, S-L. Chan, and U. Varanasi. 1994. Relationships between toxicopathic hepatic lesions and exposure to chemical contaminants in English sole (Pleuoronectes vetulus), starry flounder (Platichthys stellatus), and white croaker (Genyonemus lineatus) from selected marine sites on the Pacific coast, USA. Environ. Health Perspect. 102:2-17. Olinger, K. 1997. Sediment quality assessment for the tidal Christina River basin. Volume I: Report of findings. Delaware Department of Natural Resources and Environmental Control, New Castle, DE. Pinkney, A.E., D.W. Sutherland, R.E. Foley, and J.C. Harshbarger. 1995. Investigation of sediment contamination and fish pathology at Featherstone National Wildlife Refuge, Virginia. U.S. Fish and Wildlife Service, Annapolis, Maryland. CBFO-C95-02. Pinkney, A.E., J.C. Harshbarger, E.B. May, and M.J. Melancon. 2001. Tumor prevalence and biomarkers of exposure in brown bullheads (Ameiurus nebulosus) from the Tidal Potomac River Watershed. Environ. Toxicol. Chem. 20:1196-1205. Pinkney, A.E., J.C. Harshbarger, E.B. May, and W.L. Reichert. 2004a. Tumor prevalence and biomarkers of exposure and response in brown bullheads (Ameiurus nebulosus) from the Anacostia River, Washington, D.C. and Tuckahoe River, Maryland. Environ. Toxicol. Chem. 23:638-647. Pinkney, A.E., J.C. Harshbarger, E.B. May, and M.J. Melancon. 2004b. Tumor prevalence and biomarkers of exposure in brown bullheads (Ameiurus nebulosus) from Back River, Furnace Creek, and Tuckahoe River, Maryland. Arch. Environ. Contam. Toxicol. 46:492-501 Sokal, R.R. and F.J. Rohlf. 1981. Biometry, 2nd ed. W.H. Freeman, New York.

10
Vogelbein, W.G., J.W. Fournie, P.A. Van Veld, and R.J. Huggett. 1990. Hepatic neoplasms in the mummichog Fundulus heteroclitus from a creosote-contaminated site. Cancer Res. 50:5978-5986. Vogelbein, W.G. and M. Unger. 2003. The Elizabeth River Monitoring Program 2001-2002: Assocation between mummichog liver histopathology and sediment chemical contamination. Final report submitted to Virginia Department of Environmental Quality by Virginia Institute of Marine Science, Gloucester Point, VA. Vogelbein, W.G. and D.E. Zwerner. 2000. The Elizabeth River Monitoring Program 1998-1999: Mummichog liver histopathology as an indicator of environmental quality. Final report submitted to Virginia Department of Environmental Quality by Virginia Institute of Marine Science, Gloucester Point, VA. Whitehead, A.C. 1995. Freshwater marsh killifish. In: L.E. Dove and R.M. Nyman, editors, Living Resources of the Delaware Estuary. The Delaware Estuary Program. pp. 205-210. Woodward-Clyde Consultants, Inc. 1996. Phase III RI Scope of Work Former Koppers Company, Inc., Newport Site. Woodward-Clyde, Blue Bell, PA.

FIGURES

Figure 1. Maps of the mummichog collection areas. b) St. Jones River; c) Blackbird Creek. NOAA 85 and 89 are sediment sample locations from Hartwell et al. (2001)
b)
c)

Figure 2. Prevalence of liver lesions (FHA=foci of hepatocellular alteration,HC=hepatocellular carcinoma, TLL=a fish with either FHA or HC) in mummichogs from Blackbird Creek (BC), Hershey Run 2002 (HR02) or 2003 (HR03)
23.8
10.313.8
3.3 3.43.3
33.3
42.9
6.7
0
5
10
15
20
25
30
35
40
45
50
BC HR02 HR03
%
FHA
HC
TLL

Figure 3. HR03-19 (Hershey Run 2003): Sculptured leading edge of hepatocellular carcinoma (dark cells) invading and destroying normal liver tissue. Note the enlarged bull’s eye nuclei in the cancer cells. Arrow points to a mitotic figure in telophase. Bar = 16 µm
Figure 4. HR03-19 (Hershey Run 2003): Rapid cancer growth rate indicated by at least six mitotic figures (arrows). Bar = 9 µm

Figure 1. Maps of the mummichog collection areas. a) Christina River and Motiva Channel
a)

TABLES

Table 1. Biological data for the six collections of mummichogsa: BC: Blackbird Creek, HR02: Hershey Run 2002, HR03: Hershey Run 2003, MOT: Motiva, NMD: Newport Marsh Downriver, NMU: Newport Marsh Upriver, SJ: St. Jones. BC
(n=30) HR02 (n=21)
HR03 (n=29)
MOT (n=30)
NMD (n=30)
NMU (n=29) SJ (n=27)
Statisticsb
Collection date(s) 6/30; 8/1/03 8/9/02 10/1/03 6/7; 6/17/04 10/2/03 10/2/03 6/17, 6/23,7/31/03
Latitude 39.41918 39.70517 39.70528 39.59725 39.70998 39.71006 39.12585Longitude 75.61522 75.63132 75.63086 75.61239 75.60261 75.60674 75.61522Length (mm) 78 (70,90)
A,B 74 (70,95) B 74 (71, 97)
A,B 82 (70,112) A 75 (70,93)
A,B 75 (70,90) A,B
76 (70, 91) A,B
K-W (p=0.017)
Weight (g) 5.9 (4.0-9.0) B 5.0 (3.8-10.6) B
5.4 (4.3-13.1) A,B
7.7 (4.4-21.0) A
5.6 (3.8-11.4) B
5.8 (4.0-9.2) B 5.1 (3.8-10.0) B
K-W (p<0.001)
Liver weight (g) 0.10±0.04 NDc 0.28±0.17 0.20±0.13 0.23±0.10 0.24±0.07 0.11±0.06 Not compared
Condition Factor (K) 1.23±0.08 C
1.23±0.14 B
1.37±0.14 A
1.39±0.11 A
1.32±0.11 A,B
1.33±0.11A,B 1.26±0.12 B
ANOVA (p<0.001)
Hepatosomatic Index (HSI)
0.017 (0.007, 0.032) B
NDc 0.038 (0.019, 0.089) A
0.022 (0.005, 0.041) B
0.036 (0.018, 0.061) A
0.038 (0.023, 0.067) A
0.018 (0.008, 0.043) B
K-W (p<0.001)
Sex 17M, 13F 4M, 17F 24M, 5F 16M, 14F 17M, 8F, 5? 19M, 1F, 9? 19M, 8F
a Mean + one standard deviation (SD) or median with range in parentheses. b Groups with different letters are significantly different at p<0.05 using Tukey’s test (ANOVA) or Dunn’s method (K-W). c Not determined; liver weights were not measured in the HR02 fish.

Table 2. Summary of lesion data and statistical comparisons (Fisher’s Exact Test).
LesionaBC,MOT, NMD, NMU, SJ (pooled)
Hershey Run (pooled) P value
Focus of hepatocellular alteration (FHA) 1/145 (0.7%) 6/50 (12%) 0.001
Hepatocellular carcinoma (HC) 1/145 (0.7%) 10/50 (20%) <0.001
BC,MOT, NMD,NMU, SJ (pooled)
Hershey Run (02)
Total liver lesions (TLL) 2/145 (1.4%) 9/21 (43%) <0.001
BC,MOT, NMD,NMU, SJ (pooled)
Hershey Run (03)
Total liver lesions (TLL) 2/145 (1.4%) 4/30 (13.3%) 0.008 a see Appendix C for glossary of pathological terminology

APPENDIX A
Photographs of Sampling Locations and Evidence of Parasitic Infestation

Upper Blackbird Creek sampling area
A-1

Motiva Channel sampling area
A-2

St. Jones River sampling area—both shorelines
A-3

Hershey Run mummichog sampling area
A-4
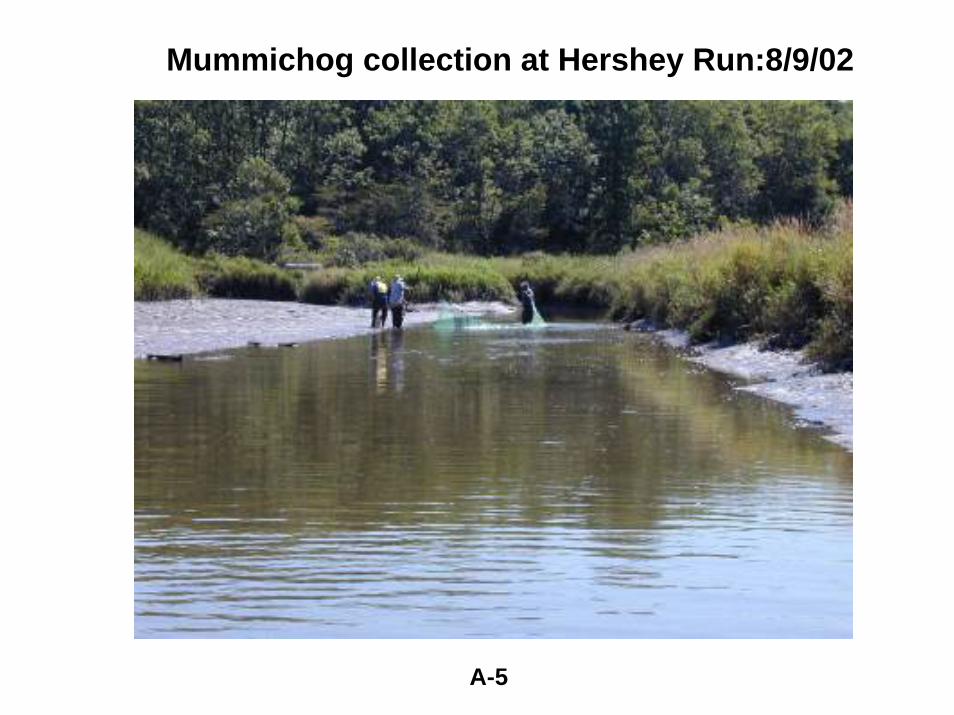
Mummichog collection at Hershey Run:8/9/02
A-5
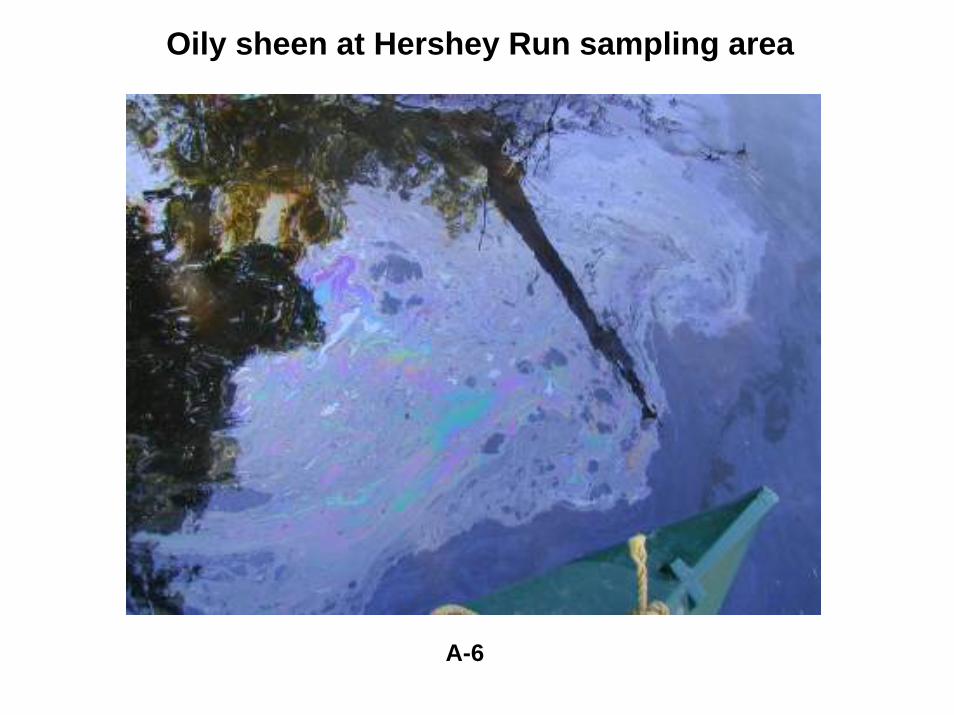
Oily sheen at Hershey Run sampling area
A-6

Male mummichog with belly enlarged due to parasitic worms
A-7

Mummichog (NMD22) with infestation of parasitic worms
A-8

APPENDIX B
Spreadsheets of Biological and Pathological Data

LATLONG and summary
Site name Waterbody Lat/long Date(s) number FHA % HC % TLL %Blackbird (BC) Blackbird Creek 39.41918 6/30/2003 30 1 3.3 1 3.3 2 6.7
75.61522
Hershey 02 (HR02) Hershey Run 39.70517 8/9/2002 21 5 23.8 7 33.3 9 42.975.63132
Hershey 03 (HR03) Hershey Run 39.70528 10/1/2003 29 1 3.4 3 10.3 4 13.875.63086
Newport Marsh Upriver (NMU) Christina River 39.71006 10/2/2003 30 0 0 0 0 0 075.60764
Newport Marsh Downriver (NMD) Christina River 39.70998 10/2/2003 29 0 0 0 0 0 075.60261
Motiva (MOT) Motiva Effluent Channel 39.59725 6/7/2004 30 0 0 0 0 0 075.61239 6/17/2004
St. Jones (SJ) St. Jones River 39.12585 6/17/2003 27 0 0 0 0 0 075.49482 8/1/2003
B-1 3/30/2005appendix b spreadsheet

2000 Bullhead Study:BLACKBIRD CREEK
Sample Method FHA HA HC C CC TLC TLT TLL MSL EP SC TST Length Weight Liver wt K H.S.I. SexBlackbird Creek (mm) (g) (g)BC1 (6/30/03) seine 0 0 0 0 0 0 0 0 0 0 0 0 84 8.30 0.15 1.40 0.0181 MBC2 0 0 1 0 0 0 1 1 HC 0 0 0 85 7.50 0.10 1.22 0.0133 MBC3 0 0 0 0 0 0 0 0 0 0 0 0 85 7.95 0.10 1.29 0.0126 MBC4 0 0 0 0 0 0 0 0 0 0 0 0 78 6.05 0.05 1.27 0.0083 MBC5 0 0 0 0 0 0 0 0 0 0 0 0 71 4.45 0.05 1.24 0.0112 MBC6 0 0 0 0 0 0 0 0 0 0 0 0 77 5.60 0.10 1.23 0.0179 MBC7 0 0 0 0 0 0 0 0 0 0 0 0 83 7.55 0.05 1.32 0.0066 MBC8 0 0 0 0 0 0 0 0 0 0 0 0 77 5.00 0.05 1.10 0.0100 MBC9 0 0 0 0 0 0 0 0 0 0 0 0 80 6.90 0.15 1.35 0.0217 FBC10 0 0 0 0 0 0 0 0 0 0 0 0 90 9.05 0.15 1.24 0.0166 FBC11 0 0 0 0 0 0 0 0 0 0 0 0 72 4.10 0.10 1.10 0.0244 FBC12 0 0 0 0 0 0 0 0 0 0 0 0 81 7.05 0.10 1.33 0.0142 MBC13 0 0 0 0 0 0 0 0 0 0 0 0 75 5.30 0.10 1.26 0.0189 MBC14 0 0 0 0 0 0 0 0 0 0 0 0 80 6.25 0.20 1.22 0.0320 FBC15 0 0 0 0 0 0 0 0 0 0 0 0 84 7.45 0.15 1.26 0.0201 FBC16 0 0 0 0 0 0 0 0 0 0 0 0 73 4.60 0.10 1.18 0.0217 FBC17 1 0 0 0 0 0 0 1 FHA 0 0 0 81 7.00 0.20 1.32 0.0286 FBC18 0 0 0 0 0 0 0 0 0 0 0 0 71 4.05 0.05 1.13 0.0123 FBC19 0 0 0 0 0 0 0 0 0 0 0 0 75 5.15 0.05 1.22 0.0097 MBC20 0 0 0 0 0 0 0 0 0 0 0 0 86 7.55 0.10 1.19 0.0132 MBC21 0 0 0 0 0 0 0 0 0 0 0 0 72 4.75 0.10 1.27 0.0211 FBC22 0 0 0 0 0 0 0 0 0 0 0 0 71 4.50 0.05 1.26 0.0111 MBC23 (8/1/03) 0 0 0 0 0 0 0 0 0 0 0 0 79 6.05 0.05 1.23 0.0083 MBC24 0 0 0 0 0 0 0 0 0 0 0 0 81 6.55 0.15 1.23 0.0229 FBC25 0 0 0 0 0 0 0 0 0 0 0 0 81 5.95 0.10 1.12 0.0168 FBC26 0 0 0 0 0 0 0 0 0 0 0 0 70 4.05 0.10 1.18 0.0247 FBC27 0 0 0 0 0 0 0 0 0 0 0 0 72 4.25 0.05 1.14 0.0118 MBC28 0 0 0 0 0 0 0 0 0 0 0 0 73 5.10 0.10 1.31 0.0196 MBC29 0 0 0 0 0 0 0 0 0 0 0 0 74 4.45 0.05 1.10 0.0112 MBC30 0 0 0 0 0 0 0 0 0 0 0 0 77 5.85 0.10 1.28 0.0171 FSUM 1 0 1 0 0 0 1 2 0 0 0 mean 77.9 5.95 0.10 1.23 0.0165Percent (%) 3.33 0 3.33 0 0 0 3.33 6.67 0 0 0 std 5.4 1.42 0.04 0.08 0.0063Min min 70 4.05 0.05 1.10 0.0066Max max 90 9.05 0.2 1.40 0.0320Mean median 77.5 5.9 0.1 1.24 0.0167 17MStdev n 30 30 30 30 30 13FMedian
USFWS CBFO B-2 appendix b spreadsheet3/30/2005

2000 Bullhead Study:ST. JONES
Sample Method FHA HA HC C CC TLC TLT TLL MSL EP SC TST Length Weight Liver wt K H.S.I. SexSt. Jones River (mm) (g) (g)SJ1 (6/17/03) seine 0 0 0 0 0 0 0 0 0 0 0 0 71 4.95 0.10 1.38 0.0202 FSJ2 0 0 0 0 0 0 0 0 0 0 0 0 72 4.55 0.10 1.22 0.0220 FSJ3 0 0 0 0 0 0 0 0 0 0 0 0 85 8.45 0.20 1.38 0.0237 FSJ4 0 0 0 0 0 0 0 0 0 0 0 0 78 7.15 0.20 1.51 0.0280 MSJ5 0 0 0 0 0 0 0 0 0 0 0 0 79 7.05 0.30 1.43 0.0426 FSJ6 0 0 0 0 0 0 0 0 0 0 0 0 90 9.50 0.15 1.30 0.0158 MSJ7 0 0 0 0 0 0 0 0 0 0 0 0 70 4.40 0.10 1.28 0.0227 MSJ8 0 0 0 0 0 0 0 0 0 0 0 0 70 4.15 0.05 1.21 0.0120 MSJ9 0 0 0 0 0 0 0 0 0 0 0 0 84 8.30 0.10 1.40 0.0120 MSJ10 0 0 0 0 0 0 0 0 0 0 0 0 73 5.65 0.10 1.45 0.0177 MSJ11 0 0 0 0 0 0 0 0 0 0 0 0 76 5.80 0.25 1.32 0.0431 FSJ12 0 0 0 0 0 0 0 0 0 0 0 0 83 7.95 0.10 1.39 0.0126 MSJ13 0 0 0 0 0 0 0 0 0 0 0 0 73 5.05 0.10 1.30 0.0198 MSJ14 0 0 0 0 0 0 0 0 0 0 0 0 70 3.75 0.10 1.09 0.0267 MSJ15 0 0 0 0 0 0 0 0 0 0 0 0 78 5.55 0.10 1.17 0.0180 MSJ16 0 0 0 0 0 0 0 0 0 0 0 0 76 4.90 0.15 1.12 0.0306 FSJ17 0 0 0 0 0 0 0 0 0 0 0 0 73 4.90 0.05 1.26 0.0102 MSJ18 0 0 0 0 0 0 0 0 0 0 0 0 71 4.55 0.05 1.27 0.0110 MSJ19 0 0 0 0 0 0 0 0 0 0 0 0 71 3.90 0.05 1.09 0.0128 MSJ20 0 0 0 0 0 0 0 0 0 0 0 0 78 5.60 0.05 1.18 0.0089 MSJ21 0 0 0 0 0 0 0 0 0 0 0 0 71 4.55 0.10 1.27 0.0220 MSJ22 0 0 0 0 0 0 0 0 0 0 0 0 77 5.85 0.05 1.28 0.0085 MSJ23 (6/23/03) seine 0 0 0 0 0 0 0 0 0 0 0 0 77 5.10 0.10 1.12 0.0196 MSJ24 0 0 0 0 0 0 0 0 0 0 0 0 91 10.00 0.15 1.33 0.0150 MSJ25 0 0 0 0 0 0 0 0 0 0 0 0 83 7.15 0.10 1.25 0.0140 MSJ26 (7/31/03) seine 0 0 0 0 0 0 0 0 0 0 0 0 76 4.60 0.10 1.05 0.0217 FSJ27 0 0 0 0 0 0 0 0 0 0 0 0 70 3.80 0.05 1.11 0.0132 FSUM 0 0 0 0 0 0 0 0 0 0 0 0 mean 76.5 5.8 0.1 1.3 0.019Percent (%) 0 0 0 0 0 0 0 0 0 0 0 0 std 6.1 1.8 0.1 0.1 0.009
min 70 3.75 0.05 1.048 0.009max 91 10 0.3 1.51 0.043
median 76 5.1 0.1 1.27 0.018 19Mn 27 27 27 27 27 8F
Median
USFWS CBFO B-3 appendix b spreadsheet3/30/2005

2000 Bullhead Study:HERSHEY RUN 02
Sample date Method FHA HA HC C CC TLC TLT TLL MSL EP SC TST Length Weight Liver wt K H.S.I. SexHershey Run (mm) (g) (g)HR0201 (8/9/02) Seine 1 0 1 0 0 1 1 1 HC 0 0 0 72 4.15 ND 1.11 ND FHR0204 0 0 1 0 0 1 1 1 HC 0 0 0 70 4.30 1.25 FHR0205 0 0 0 0 0 0 0 0 0 0 0 75 4.50 1.07 MHR0209 0 0 0 0 0 0 0 0 0 0 0 75 5.90 1.40 FHR0211 0 0 0 0 0 0 0 0 0 0 0 79 4.75 0.96 FHR0212 0 0 0 0 0 0 0 0 0 0 0 71 5.00 1.40 FHR0213 0 0 0 0 0 0 0 0 0 0 0 82 6.85 1.24 FHR0214 0 0 0 0 0 0 0 0 0 0 0 80 6.35 1.24 FHR0215 0 0 0 0 0 0 0 0 0 0 0 74 4.85 1.20 FHR0216 1 0 1 0 0 1 1 1 HC 0 0 0 80 5.80 1.13 FHR0217 0 0 1 0 0 1 1 1 HC* 0 0 0 95 10.65 1.24 FHR0218 0 0 1 0 0 1 1 1 HC 0 0 0 71 5.05 1.41 FHR0219 0 0 0 0 0 0 0 0 0 0 0 86 7.40 1.16 FHR0220 1 0 1 0 0 1 1 1 HC 0 0 0 73 6.15 1.58 FHR0221 0 0 0 0 0 0 0 0 0 0 0 70 4.65 1.36 FHR0223 1 0 0 0 0 0 0 1 FHA 0 0 0 76 5.90 1.34 MHR0224 0 0 1 0 0 1 1 1 HC 0 0 0 70 4.00 1.17 FHR0225 0 0 0 0 0 0 0 0 0 0 0 74 4.75 1.17 MHR0227 1 0 0 0 0 0 0 1 FHA 0 0 0 80 5.85 1.14 FHR0228 0 0 0 0 0 0 0 0 0 0 0 71 3.75 1.05 MHR0230 0 0 0 0 0 0 0 0 0 0 0 72 4.80 1.29 FSUM 5 0 7 0 0 7 7 9 0 0 0 mean 76 5.50 1.23Percent (%) 23.8 0.00 33.3 0.0 0.0 33.3 33.3 42.9 0 0 0 std 6 1.52 0.14
min 70 3.75 0.96ND: not determined max 95 10.65 1.58
* also granuloma median 74 5.0 1.24 4Mn 21 21 21 17F
USFWS CBFO B-4 appendix b spreadsheet3/30/2005

2000 Bullhead Study:HERSHEY RUN 03
Sample date Method FHA HA HC C CC TLC TLT TLL MSL EP SC TST Length Weight Liver wt K H.S.I. SexHR03ppers (Hershey) (mm) (g) (g)HR0301 (10/1/03) Seine 0 0 0 0 0 0 0 0 0 0 0 0 73 5.25 0.10 1.35 0.0190 MHR0302 0 0 0 0 0 0 0 0 0 0 0 0 72 4.50 0.10 1.21 0.0222 MHR0303 0 0 0 0 0 0 0 0 0 0 0 0 80 7.30 0.30 1.43 0.0411 MHR0304 0 0 0 0 0 0 0 0 0 0 0 0 71 4.50 0.15 1.26 0.0333 FHR0305 0 0 0 0 0 0 0 0 0 0 0 0 85 7.60 0.20 1.24 0.0263 FHR0306 0 0 0 0 0 0 0 0 0 0 0 0 72 4.60 0.10 1.23 0.0217 FHR0307 0 0 0 0 0 0 0 0 0 0 0 0 81 6.60 0.35 1.24 0.0530 FHR0309 0 0 0 0 0 0 0 0 0 0 0 0 75 6.05 0.35 1.43 0.0579 MHR0310 0 0 0 0 0 0 0 0 0 0 0 0 74 5.25 0.20 1.30 0.0381 MHR0311 0 0 0 0 0 0 0 0 0 0 0 0 72 5.45 0.20 1.46 0.0367 FHR0312 0 0 1 0 0 1 1 1 HC 0 0 0 90 10.75 0.45 1.47 0.0419 MHR0313 0 0 0 0 0 0 0 0 0 0 0 0 93 11.15 0.50 1.39 0.0448 MHR0314 0 0 0 0 0 0 0 0 0 0 0 0 71 5.00 0.20 1.40 0.0400 MHR0315 0 0 0 0 0 0 0 0 0 0 0 0 75 5.30 0.45 1.26 0.0849 MHR0316 0 0 0 0 0 0 0 0 0 0 0 0 71 4.35 0.20 1.22 0.0460 MHR0317 0 0 0 0 0 0 0 0 0 0 0 0 72 5.35 0.15 1.43 0.0280 MHR0318 0 0 0 0 0 0 0 0 0 0 0 0 74 4.30 0.10 1.06 0.0233 MHR0319 0 0 1 0 0 1 1 1 HC 0 0 0 82 7.85 0.70 1.42 0.0892 M * LOOK FOR PHOTOHR0320 0 0 0 0 0 0 0 0 0 0 0 0 72 5.50 0.30 1.47 0.0545 MHR0321 0 0 0 0 0 0 0 0 0 0 0 0 88 10.25 0.40 1.50 0.0390 MHR0322 0 0 0 0 0 0 0 0 0 0 0 0 77 6.80 0.15 1.49 0.0221 MHR0323 0 0 0 0 0 0 0 0 0 0 0 0 72 4.95 0.15 1.33 0.0303 MHR0324 0 0 0 0 0 0 0 0 0 0 0 0 85 10.10 0.60 1.64 0.0594 MHR0325 1 0 0 0 0 0 0 1 FHA 0 0 0 97 13.10 0.55 1.44 0.0420 MHR0326 0 0 0 0 0 0 0 0 0 0 0 0 75 5.40 0.20 1.28 0.0370 MHR0327 0 0 0 0 0 0 0 0 0 0 0 0 73 5.15 0.10 1.32 0.0194 MHR0328 0 0 0 0 0 0 0 0 0 0 0 0 72 6.50 0.20 1.74 0.0308 MHR0329 0 0 0 0 0 0 0 0 0 0 0 0 81 7.50 0.45 1.41 0.0600 MHR0330 0 0 1 0 0 1 1 1 HC 0 0 0 74 5.05 0.15 1.25 0.0297 MSUM 1 0 3 0 0 3 3 4 0 0 0 mean 77.6 6.6 0.3 1.4 0.0404Percent (%) 3.4 0 10.3 0 0 10.3 10.3 13.8 0 0 0 std 7.3 2.3 0.2 0.1 0.0177Min min 71 4.3 0.1 1.061 0.01904762Max max 97 13.1 0.7 1.74 0.089172Mean median 74 5.45 0.2 1.39 0.038095 24MStdev n 29 29 29 29 29 5FMedian
USFWS CBFO B-5 appendix b spreadsheet3/30/2005

2000 Bullhead Study:NEWPORT MARSH DOWNRIVER
Sample Collection Date FHA HA HC C CC TLC TLT TLL MSL EP SC TST Length Weight Liver wt K H.S.I. SexNewport Marsh Down 10/2/2003 (mm) (g) (g)NMD1 0 0 0 0 0 0 0 0 0 0 0 0 81 7.4 0.40 1.39 0.054 MNMD2 0 0 0 0 0 0 0 0 0 0 0 0 80 6.15 0.20 1.20 0.033 MNMD3 0 0 0 0 0 0 0 0 0 0 0 0 90 11.35 0.45 1.56 0.040 ?NMD4 0 0 0 0 0 0 0 0 0 0 0 0 86 8.75 0.40 1.38 0.046 MNMD5 0 0 0 0 0 0 0 0 0 0 0 0 79 5.75 0.20 1.17 0.035 ?NMD6 0 0 0 0 0 0 0 0 0 0 0 0 78 6.65 0.20 1.40 0.030 MNMD7 0 0 0 0 0 0 0 0 0 0 0 0 76 4.85 0.15 1.10 0.031 MNMD8 0 0 0 0 0 0 0 0 0 0 0 0 72 5.40 0.20 1.45 0.037 MNMD9 0 0 0 0 0 0 0 0 0 0 0 0 71 4.95 0.20 1.38 0.040 MNMD10 0 0 0 0 0 0 0 0 0 0 0 0 70 4.75 0.10 1.38 0.021 MNMD11 0 0 0 0 0 0 0 0 0 0 0 0 73 5.00 0.20 1.29 0.040 MNMD12 0 0 0 0 0 0 0 0 0 0 0 0 70 3.80 0.10 1.11 0.026 MNMD13 0 0 0 0 0 0 0 0 0 0 0 0 93 11.15 0.45 1.39 0.040 FNMD14 0 0 0 0 0 0 0 0 0 0 0 0 75 5.65 0.20 1.34 0.035 FNMD15 0 0 0 0 0 0 0 0 0 0 0 0 80 6.15 0.25 1.20 0.041 FNMD16 0 0 0 0 0 0 0 0 0 0 0 0 83 7.20 0.25 1.26 0.035 MNMD17 0 0 0 0 0 0 0 0 0 0 0 0 76 6.30 0.25 1.44 0.040 ?NMD18 0 0 0 0 0 0 0 0 0 0 0 0 80 6.80 0.30 1.33 0.044 FNMD19 0 0 0 0 0 0 0 0 0 0 0 0 75 6.10 0.25 1.45 0.041 MNMD20 0 0 0 0 0 0 0 0 0 0 0 0 70 4.40 0.15 1.28 0.034 FNMD21 0 0 0 0 0 0 0 0 0 0 0 0 70 4.25 0.10 1.24 0.024 MNMD22 0 0 0 0 0 0 0 0 0 0 0 0 72 5.45 0.10 1.46 0.018 ?NMD23 0 0 0 0 0 0 0 0 0 0 0 0 75 5.60 0.25 1.33 0.045 FNMD24 0 0 0 0 0 0 0 0 0 0 0 0 73 5.75 0.35 1.48 0.061 MNMD25 0 0 0 0 0 0 0 0 0 0 0 0 75 5.30 0.15 1.26 0.028 MNMD26 0 0 0 0 0 0 0 0 0 0 0 0 80 7.00 0.30 1.37 0.043 FNMD27 0 0 0 0 0 0 0 0 0 0 0 0 72 4.95 0.15 1.33 0.030 MNMD28 0 0 0 0 0 0 0 0 0 0 0 0 70 4.25 0.15 1.24 0.035 FNMD29 0 0 0 0 0 0 0 0 0 0 0 0 72 4.55 0.15 1.22 0.033 MNMD30 0 0 0 0 0 0 0 0 0 0 0 0 75 4.95 0.20 1.17 0.040 ?SUM 0 0 0 0 0 0 0 0 0 0 0 0 mean 76.4 6.0 0.2 1.3 0.037Percent (%) 0 0 0 0 0 0 0 0 0 0 0 0 std 5.9 1.8 0.1 0.1 0.009Min min 70 3.8 0.1 1.105 0.018Max max 93 11.35 0.45 1.56 0.061 17MMean median 75 5.625 0.2 1.33 0.036 8FStdev n 30 30 30 30 30 5?Median
USFWS CBFO B-6 appendix b spreadsheet3/30/2005
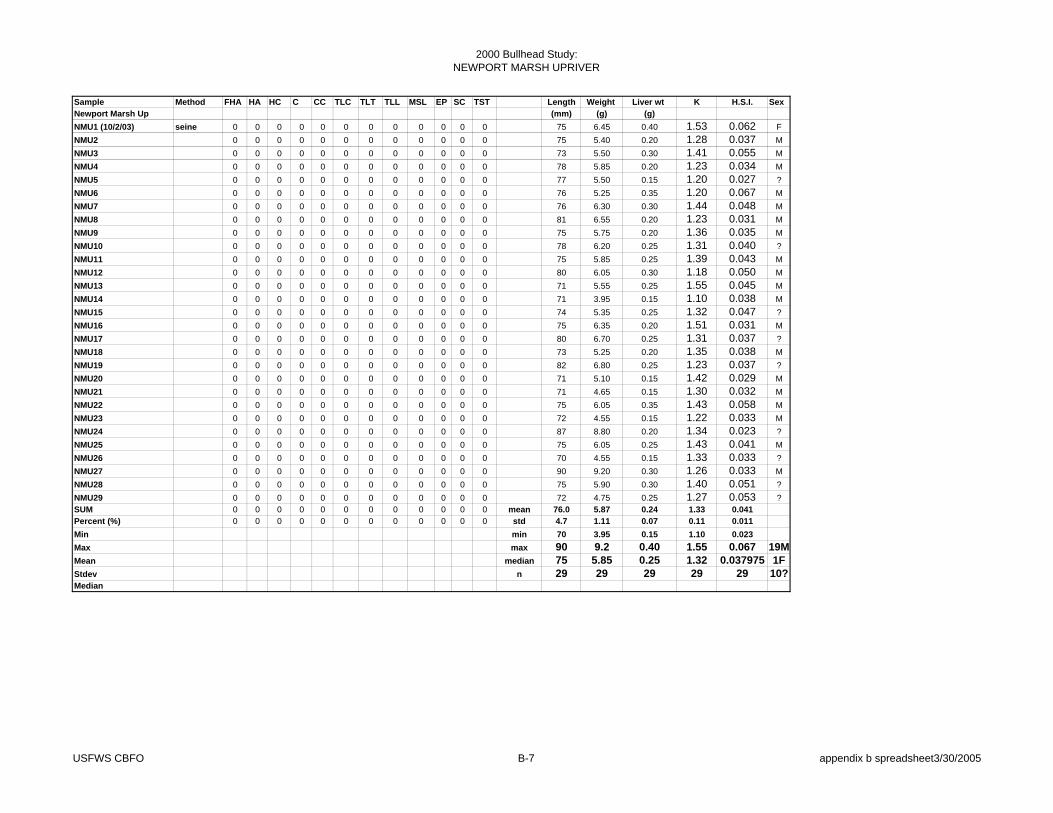
2000 Bullhead Study:NEWPORT MARSH UPRIVER
Sample Method FHA HA HC C CC TLC TLT TLL MSL EP SC TST Length Weight Liver wt K H.S.I. SexNewport Marsh Up (mm) (g) (g)NMU1 (10/2/03) seine 0 0 0 0 0 0 0 0 0 0 0 0 75 6.45 0.40 1.53 0.062 FNMU2 0 0 0 0 0 0 0 0 0 0 0 0 75 5.40 0.20 1.28 0.037 MNMU3 0 0 0 0 0 0 0 0 0 0 0 0 73 5.50 0.30 1.41 0.055 MNMU4 0 0 0 0 0 0 0 0 0 0 0 0 78 5.85 0.20 1.23 0.034 MNMU5 0 0 0 0 0 0 0 0 0 0 0 0 77 5.50 0.15 1.20 0.027 ?NMU6 0 0 0 0 0 0 0 0 0 0 0 0 76 5.25 0.35 1.20 0.067 MNMU7 0 0 0 0 0 0 0 0 0 0 0 0 76 6.30 0.30 1.44 0.048 MNMU8 0 0 0 0 0 0 0 0 0 0 0 0 81 6.55 0.20 1.23 0.031 MNMU9 0 0 0 0 0 0 0 0 0 0 0 0 75 5.75 0.20 1.36 0.035 MNMU10 0 0 0 0 0 0 0 0 0 0 0 0 78 6.20 0.25 1.31 0.040 ?NMU11 0 0 0 0 0 0 0 0 0 0 0 0 75 5.85 0.25 1.39 0.043 MNMU12 0 0 0 0 0 0 0 0 0 0 0 0 80 6.05 0.30 1.18 0.050 MNMU13 0 0 0 0 0 0 0 0 0 0 0 0 71 5.55 0.25 1.55 0.045 MNMU14 0 0 0 0 0 0 0 0 0 0 0 0 71 3.95 0.15 1.10 0.038 MNMU15 0 0 0 0 0 0 0 0 0 0 0 0 74 5.35 0.25 1.32 0.047 ?NMU16 0 0 0 0 0 0 0 0 0 0 0 0 75 6.35 0.20 1.51 0.031 MNMU17 0 0 0 0 0 0 0 0 0 0 0 0 80 6.70 0.25 1.31 0.037 ?NMU18 0 0 0 0 0 0 0 0 0 0 0 0 73 5.25 0.20 1.35 0.038 MNMU19 0 0 0 0 0 0 0 0 0 0 0 0 82 6.80 0.25 1.23 0.037 ?NMU20 0 0 0 0 0 0 0 0 0 0 0 0 71 5.10 0.15 1.42 0.029 MNMU21 0 0 0 0 0 0 0 0 0 0 0 0 71 4.65 0.15 1.30 0.032 MNMU22 0 0 0 0 0 0 0 0 0 0 0 0 75 6.05 0.35 1.43 0.058 MNMU23 0 0 0 0 0 0 0 0 0 0 0 0 72 4.55 0.15 1.22 0.033 MNMU24 0 0 0 0 0 0 0 0 0 0 0 0 87 8.80 0.20 1.34 0.023 ?NMU25 0 0 0 0 0 0 0 0 0 0 0 0 75 6.05 0.25 1.43 0.041 MNMU26 0 0 0 0 0 0 0 0 0 0 0 0 70 4.55 0.15 1.33 0.033 ?NMU27 0 0 0 0 0 0 0 0 0 0 0 0 90 9.20 0.30 1.26 0.033 MNMU28 0 0 0 0 0 0 0 0 0 0 0 0 75 5.90 0.30 1.40 0.051 ?NMU29 0 0 0 0 0 0 0 0 0 0 0 0 72 4.75 0.25 1.27 0.053 ?SUM 0 0 0 0 0 0 0 0 0 0 0 0 mean 76.0 5.87 0.24 1.33 0.041Percent (%) 0 0 0 0 0 0 0 0 0 0 0 0 std 4.7 1.11 0.07 0.11 0.011Min min 70 3.95 0.15 1.10 0.023Max max 90 9.2 0.40 1.55 0.067 19MMean median 75 5.85 0.25 1.32 0.037975 1FStdev n 29 29 29 29 29 10?Median
USFWS CBFO B-7 appendix b spreadsheet3/30/2005

2000 Bullhead Study:MOTIVA
Sample Method FHA HA HC C CC TLC TLT TLL MSL EP SC TST Length Weight Liver wt K H.S.I. SexMotiva (mm) (g) (g)MO1 (6/7/04) seine 0 0 0 0 0 0 0 0 0 0 0 0 74 5.85 0.10 1.44 0.017 MMO2 0 0 0 0 0 0 0 0 0 0 0 0 79 7.45 0.20 1.51 0.027 FMO3 0 0 0 0 0 0 0 0 0 0 0 0 87 9.3 0.20 1.41 0.022 FMO4 0 0 0 0 0 0 0 0 0 0 0 0 80 8.55 0.10 1.67 0.012 MMO5 0 0 0 0 0 0 0 0 0 0 0 0 71 5.1 0.10 1.42 0.020 MMO6 0 0 0 0 0 0 0 0 0 0 0 0 73 5.55 0.15 1.43 0.027 FMO7 0 0 0 0 0 0 0 0 0 0 0 0 76 5.7 0.05 1.30 0.009 MMO8 0 0 0 0 0 0 0 0 0 0 0 0 90 10.85 0.05 1.49 0.005 MMO9 0 0 0 0 0 0 0 0 0 0 0 0 70 5 0.10 1.38 0.021 FMO10 (6/17/04) 0 0 0 0 0 0 0 0 0 0 0 0 75 6 0.20 1.43 0.033 FMO11 0 0 0 0 0 0 0 0 0 0 0 0 86 10 0.40 1.55 0.041 FMO12 0 0 0 0 0 0 0 0 0 0 0 0 83 8 0.25 1.36 0.032 MMO13 0 0 0 0 0 0 0 0 0 0 0 0 70 4 0.10 1.27 0.023 MMO14 0 0 0 0 0 0 0 0 0 0 0 0 92 11 0.30 1.37 0.028 FMO15 0 0 0 0 0 0 0 0 0 0 0 0 96 12 0.30 1.37 0.025 FMO16 0 0 0 0 0 0 0 0 0 0 0 0 72 5 0.10 1.34 0.020 MMO17 0 0 0 0 0 0 0 0 0 0 0 0 112 21 0.60 1.49 0.029 FMO18 0 0 0 0 0 0 0 0 0 0 0 0 76 6 0.10 1.29 0.018 MMO19 0 0 0 0 0 0 0 0 0 0 0 0 104 14 0.35 1.21 0.026 FMO20 0 0 0 0 0 0 0 0 0 0 0 0 84 7 0.10 1.18 0.014 MMO21 0 0 0 0 0 0 0 0 0 0 0 0 80 7 1.32 FMO22 0 0 0 0 0 0 0 0 0 0 0 0 86 9 0.20 1.40 0.022 MMO23 0 0 0 0 0 0 0 0 0 0 0 0 78 7 0.15 1.37 0.023 FMO24 0 0 0 0 0 0 0 0 0 0 0 0 102 12 0.40 1.15 0.033 FMO25 0 0 0 0 0 0 0 0 0 0 0 0 89 11 0.20 1.51 0.019 MMO26 0 0 0 0 0 0 0 0 0 0 0 0 75 6 0.10 1.33 0.018 MMO27 0 0 0 0 0 0 0 0 0 0 0 0 80 7 0.20 1.29 0.030 MMO28 0 0 0 0 0 0 0 0 0 0 0 0 90 11 0.15 1.56 0.013 MMO29 0 0 0 0 0 0 0 0 0 0 0 0 110 19 0.40 1.42 0.021 FSUM 0 0 0 0 0 0 0 0 0 0 0 0 85 8.6 0.20 1.40 0.023 MPercent (%) 0 0 0 0 0 0 0 0 0 0 0 0 mean 84.2 8.7 0.20 1.39 0.022Min std 11.5 4.0 0.13 0.12 0.008Max min 70 4.35 0.05 1.1496332 0.005Mean max 112 20.95 0.60 1.66992 0.041Stdev median 81.5 7.6 0.20 1.39 0.022 16MMedian n 30 30 29 30 29 14F
USFWS CBFO B-8 appendix b spreadsheet3/30/2005

APPENDIX C
Glossary of Pathological Terminology
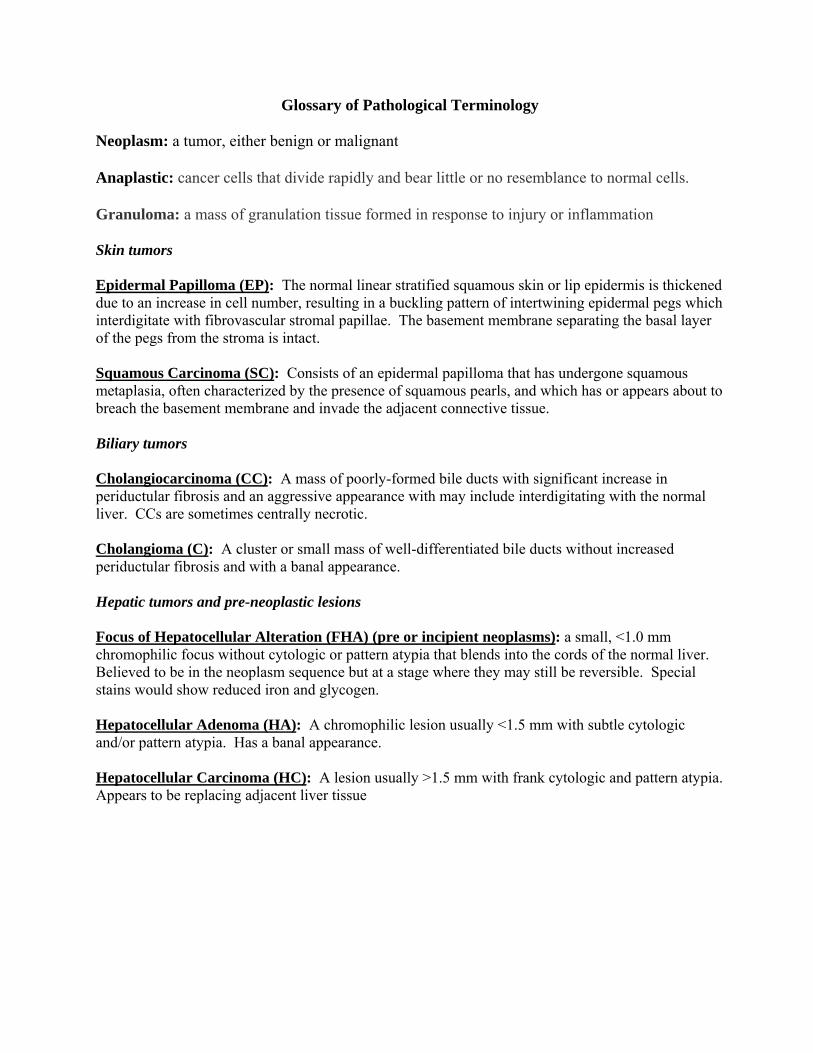
Glossary of Pathological Terminology
Neoplasm: a tumor, either benign or malignant Anaplastic: cancer cells that divide rapidly and bear little or no resemblance to normal cells. Granuloma: a mass of granulation tissue formed in response to injury or inflammation Skin tumors Epidermal Papilloma (EP): The normal linear stratified squamous skin or lip epidermis is thickened due to an increase in cell number, resulting in a buckling pattern of intertwining epidermal pegs which interdigitate with fibrovascular stromal papillae. The basement membrane separating the basal layer of the pegs from the stroma is intact. Squamous Carcinoma (SC): Consists of an epidermal papilloma that has undergone squamous metaplasia, often characterized by the presence of squamous pearls, and which has or appears about to breach the basement membrane and invade the adjacent connective tissue. Biliary tumors Cholangiocarcinoma (CC): A mass of poorly-formed bile ducts with significant increase in periductular fibrosis and an aggressive appearance with may include interdigitating with the normal liver. CCs are sometimes centrally necrotic. Cholangioma (C): A cluster or small mass of well-differentiated bile ducts without increased periductular fibrosis and with a banal appearance. Hepatic tumors and pre-neoplastic lesions Focus of Hepatocellular Alteration (FHA) (pre or incipient neoplasms): a small, <1.0 mm chromophilic focus without cytologic or pattern atypia that blends into the cords of the normal liver. Believed to be in the neoplasm sequence but at a stage where they may still be reversible. Special stains would show reduced iron and glycogen. Hepatocellular Adenoma (HA): A chromophilic lesion usually <1.5 mm with subtle cytologic and/or pattern atypia. Has a banal appearance. Hepatocellular Carcinoma (HC): A lesion usually >1.5 mm with frank cytologic and pattern atypia. Appears to be replacing adjacent liver tissue