evaluation of time-dependent toxicity and combined effects ... · studies from this lab have...
TRANSCRIPT

Es
Da
b
a
ARRAA
CIBCDEEELMT1
KMADI
1
iido[tbbaa
h2
Toxicology Reports 3 (2016) 572–583
Contents lists available at ScienceDirect
Toxicology Reports
j our na l ho me page: www.elsev ier .com/ locate / toxrep
valuation of time-dependent toxicity and combined effects for aeries of mono-halogenated acetonitrile-containing binary mixtures
ouglas A. Dawsona,∗, Daphne Guinna, Gerald Pöchb
Department of Biology/Toxicology, Ashland University, Ashland, OH, USADepartment of Pharmacology and Toxicology, University of Graz, Graz, Austria
r t i c l e i n f o
rticle history:eceived 14 June 2016eceived in revised form 22 July 2016ccepted 22 July 2016vailable online 25 July 2016
hemical compounds studied in this article:odoacetonitrile (PubChem CID: 69356)romoacetonitrile (PubChem CID: 11534)hloroacetonitrile (PubChem CID: 7856)ibromoacetonitrile (PubChem CID: 18617)thyl acrylate (PubChem CID: 8821)thyl bromoacetate (PubChem CID: 7748)thyl propiolate (PubChem CID: 12182)inalool (PubChem CID: 6549)ethyl vinyl ketone (PubChem CID: 6570)
richloroacetonitrile (PubChem CID:
a b s t r a c t
Mixture and time-dependent toxicity (TDT) was assessed for a series of mono-halogenated acetonitrile-containing combinations. Inhibition of bioluminescence in Aliivibrio fischeri was measured after 15, 30and 45-min of exposure. Concentration-response (x/y) curves were determined for each chemical alone ateach timepoint, and used to develop predicted x/y curves for the dose-addition and independence modelsof combined effect. The x/y data for each binary mixture was then evaluated against the predicted mixturecurves. Two metrics of mixture toxicity were calculated per combined effect model: (1) an EC50-baseddose-addition (AQ) or independence (IQ) quotient and (2) the mixture/dose-addition (MX/DA) and mix-ture/independence (MX/I) metrics. For each single chemical and mixture tested, TDT was also calculated.After 45-min of exposure, 25 of 67 mixtures produced curves that were consistent with dose-additionusing the MX/DA metric, with the other 42 being less toxic than predicted by MX/DA. Some mixtures hadtoxicity that was consistent with both dose-addition and independence. In general, those that were lesstoxic than predicted for dose-addition were also less toxic than predicted for independence. Of the 25combinations that were consistent with dose-addition, 22 (88%) mixtures contained chemicals for whichthe individual TDT values were both >80%. In contrast, of the 42 non-dose-additive combinations, only 2(4.8%) of the mixtures had both chemicals with individual TDT values >80%. The results support previous
1011)
eywords:icrotox®
cute toxicityose-addition
findings that TDT determinations can be useful for predicting chemical mixture toxicity.© 2016 The Author(s). Published by Elsevier Ireland Ltd. This is an open access article under the CC BY
license (http://creativecommons.org/licenses/by/4.0/).
ndependence
. Introduction
Determining and predicting the effects of toxic substancesn combination has been a focal point of recent mixture tox-city research. Via exposure profiling of reactive mixtures [1],ocking-based receptor library [2] or toxicogenomics [3] studies,r examining aquatic toxicity [4], mammalian reproductive effects5] or endocrine disruptors [6] such research efforts can improvehe ability to predict mixture toxicity. Assessments of toxicity ininary [7], ternary [8] or complex chemical mixtures [9] have
een common, with such toxicity having been evaluated for met-ls [10], pesticides [11], polycyclic aromatic hydrocarbons [12,13],nd micropollutants [14]. Conceptual studies and efforts to develop∗ Corresponding author.E-mail address: [email protected] (D.A. Dawson).
ttp://dx.doi.org/10.1016/j.toxrep.2016.07.003214-7500/© 2016 The Author(s). Published by Elsevier Ireland Ltd. This is an open acces
and evaluate mixture toxicity models [15–20] have also providedapproaches for improving toxicity assessment of mixtures.
Microtox® is one assay often used to examine chemical mix-ture toxicity. This system makes use of bacteria that, through theprocess of quorum-sensing, produce light that can be reliably quan-tified by a light meter. When the bacteria are exposed to singlechemicals or chemical mixtures at concentrations that exert toxic-ity, metabolism is adversely affected, thereby reducing the amountof light emitted. Light readings can be made prior to chemical expo-sure and for up to three selected timepoints after introduction ofthe toxicant. For the acute toxicity assay exposure can last for up to100 min; after that point bacterial metabolism begins to wane as nonutrients are included in the reagent. Since readings can be madeafter chemical exposure at three selected timepoints, it is possible
to assess the time-dependent toxicity of a given chemical, mixture,or environmental sample. Agents that act as non-polar narcoticstend to show inhibition of bioluminescence early on during expo-s article under the CC BY license (http://creativecommons.org/licenses/by/4.0/).
logy Reports 3 (2016) 572–583 573
sscttt
ttfe[h[tsfi(dMm
auwhtviar
smmihcso(tovrma2h
2
2
AMw
2
dAp
Table 1Chemicals selected for testing.
Abbr. Chemical name CAS #a
3M2B 3-methyl-2-butanone 563-80-44NBB 4-nitrobenzyl bromide 100-11-8BGE butyl glycidyl ether 2426-08-6BRAN bromoacetonitrile 590-17-0CLAN chloroacetonitrile 107-14-2DBRAN dibromoacetonitrile 3252-43-5DCLAN dichloroacetonitrile 3018-12-0DEM diethyl maleate 141-05-9EA ethyl acrylate 140-88-5EAC ethyl acetate 141-78-6EBAC ethyl bromoacetate 105-36-2ECAC ethyl chloroacetate 105-39-5EFAC ethyl fluoroacetate 459-72-3EIAC ethyl iodoacetate 623-48-3EP ethyl propiolate 623-47-2IAN iodoacetonitrile 624-75-9LIN linalool 78-70-6M2BP methyl-2-bromopropionate 5445-17-0MC methyl crotonate 623-43-8MVK methyl vinyl ketone 78-94-4NER nerol 106−25-2PN propionitrile 107−12-0
D.A. Dawson et al. / Toxico
ure but then recover, at least partially, so that bioluminescencetabilizes or increases slightly after the initial diminution. For otherhemicals toxicity continues to progress over exposure time suchhat bioluminescence decreases throughout exposure. These fea-ures allow the assay to be used effectively for assessing changes inoxicity over exposure time (i.e., time-dependent toxicity).
Recent studies from this lab have evaluated time-dependentoxicity (TDT) for potential value in mixture toxicity predic-ion using Microtox®. Initial studies examined mixture toxicityor binary combinations of soft electrophiles [21]; subsequentlyxamining such toxicity in the context of chemical reactivity22,23]. Through binary mixture assessments of SN2-reactive �-alogenated acetonitriles [24], ethyl �-halogenated ethyl acetates25], and combinations of these two groups [26] it was determinedhat including TDT assessments added value to mixture toxicitytudies. An asymmetry parameter was incorporated into curve-tting of single-chemical and mixture concentration-responsex/y) data to more precisely evaluate mixture toxicity against theose-addition and independence models of combined effect [27].ost recently TDT assessments were examined for use in predictingixture toxicity [28].In the latter study, it was demonstrated that taking the aver-
ge TDT values of the individual chemicals in a mixture could besed to predict the TDT of the mixture [28]. This was true evenhen chemicals with high TDT (i.e., ≥90%) were tested with onesaving low (i.e., <30%) or negative TDT despite the observed mix-ure TDT value being more likely to deviate from the predicted TDTalue. Having previously incorporated the asymmetry parameternto curve-fitting of x/y data it became of interest to specificallyssess aspects of the curve-fitting parameters for insights into theelationship between TDT and combined effect.
As noted above, �-halogenated acetonitriles are SN2-reactiveoft electrophiles. In previous studies from this lab threeono-halogenated acetonitriles (i.e., iodoacetonitrile – IAN, bro-oacetonitrile – BRAN and chloroacetonitrile – CLAN) were tested
n sham combinations and with each other [24], with ethyl �-alogenated ethyl acetates [26], and with a few other organichemicals [28]. The latter study only reported TDT values for theingle chemicals and mixtures, not the specific combined effectsbserved. In this study, the three mono-halogenated acetonitrilesXANs) were tested in binary combination with a number of addi-ional organic chemicals. The latter were selected to span the rangef TDT values (<0%–>100%) and were compiled along with the pre-ious XANs mixture data to fully evaluate combined effects as theyelate to TDT. In order to provide a consistent basis for this assess-ent, the maximum effect constraint in curve-fitting was fixed
t 100%. A collective summary of these results, including data for8 combinations previously unpublished in any form, is providederein.
. Materials and methods
.1. Chemicals and reagents
Chemicals used in testing (Table 1) were obtained from Sigma-ldrich (Milwaukee, WI) at ≥95% purity and used as received.icrotox® bacterial reagent, reconstitution solution and diluentere obtained from Modern Water, Inc. (New Castle, DE).
.2. Toxicity testing
A routinely calibrated Microtox® 500 analyzer was used toetermine inhibition of bioluminescence in the marine bacteriumliivibrio fischeri (formerly Vibrio fischeri) [29] following establishedrocedures [26]. An experiment in this testing protocol is defined
TCLAN trichloroacetonitrile 545−06-2
a Chemical Abstract Service registry number.
as consisting of three toxicity tests: chemical A-alone (A), chemicalB-alone (B) and a “true” mixture (A + B). Some experiments wereof the “sham” variety, in which two preparations of a chemicalwere tested alone (i.e., A1 and A2) and combined as a “mixture”(i.e., A1 + A2).
Concentration selection for each chemical was made based onresults of preliminary tests and, as much as possible, designed toobtain an approximately equitoxic potency ratio (i.e., 1:1) after30-min of exposure. At least seven concentrations were testedin duplicate (i.e., two vials per concentration) for each chemicalor mixture along with a duplicated control. Nominal concentra-tions, corrected for density, were prepared via serial dilution. Forany given experiment a single dilution factor (1.6, 1.75, 1.867, or2.0) was used, having been selected to most effectively calculateEC25, EC50 and EC75 values, based on preliminary testing. The EC50refers to the half-maximal effective concentration, while the EC25and EC75 represent the one-quarter and three-quarters-maximaleffective concentrations, respectively.
For each experiment, chemical A, chemical B and the mixture ofA and B were tested on the same day, typically within a 4.5 h timeperiod. Separate stock solutions of chemical A and chemical B wereprepared immediately prior to testing. The mixture stock solutionwas prepared from the single chemical stock solutions. In testing,initial light readings were taken before chemical exposure. Duringexposure light readings were taken 15, 30 and 45-min after toxi-cant introduction. Microtox® Omni software calculated the percenteffect value for each vial at each exposure duration.
2.3. Curve fitting
Nine concentration-response (x/y) curves (i.e., three curves forchemical A: one each at 15, 30 and 45-min, along with three curveseach for chemical B and the mixture at those same timepoints)were obtained from each experiment. After input to SigmaPlot® (v.11.0; Systat Software, Chicago, IL) x/y data were fitted to sigmoidcurves using the 5-parameter logistic minus 1-parameter (5PL-1P)function [27]. This approach utilized four parameters: EC , slope,
50maximum effect and asymmetry, as the minimum effect param-eter had been removed from the original 5PL function within thesoftware.
574 D.A. Dawson et al. / Toxicology Reports 3 (2016) 572–583
Table 2Comparison of coefficient of determination (r2 ± S.D.) values by maximum effect constraint.
MaximumEffectConstraint
Chem. A15-min
Chem. B15-min
Mixture15-min
Chem. A30-min
Chem. B30-min
Mixture30-min
Chem. A45-min
Chem. B45-min
Mixture45-min
MAX = 100a 0.9980 ± 1.5e−3 0.9975 ± 2.3e−3 0.9980 ± 1.4e−3 0.9989 ± 8.1e−4 0.9976 ± 2.5e−3 0.9984 ± 1.3e−3 0.9991 ± 8.2e−4 0.9977 ± 2.5e−3 0.9987 ± 1.0e−3
MAX < 100b 0.9981 ± 1.4e−3 0.9975 ± 2.3e−3 0.9981 ± 1.4e−3 0.9989 ± 8.0e−4 0.9975 ± 2.6e−3 0.9984 ± 1.3e−3 0.9991 ± 8.2e−4 0.9978 ± 2.5e−3 0.9987 ± 1.0e−3
y
is
x
e0msabEt
xmecwc
C
vfwccieiu
2
tdtab
uaw
(
wts
a MAX = 100–maximum effect in curve-fitting was set to =100%.b MAX < 100–maximum effect in curve-fitting was set to be <100%.
Curve fitting was performed using:
= max ÷[
1 + (xb ÷ x)slope]s
n which y = % effect, max = maximum effect, x = concentration, = asymmetry. The variable xb was determined using:
b = EC50 × 10[(1÷slope)×log(2(1÷s)−1)]
Initial parameters for the regressions were automaticallystimated while employing three constraints: (a) EC50 > 0; (b).1 < s < 10; and (c) max = 100. As noted above (see Introduction)aximum effect values were constrained to 100%, to provide con-
istency in calculating TDT values across the individual chemicalsnd to provide a common basis for evaluating the relationshipetween TDT and combined effect. For all single-chemical x/y data,C25, EC50, EC75, slope, and asymmetry values were calculated athe three exposure durations.
The quality of data fitting was measured in two ways. Individual/y curve fitting using the 5PL-1 P function was assessed by deter-ining coefficient of determination (r2) values for each curve. To
valuate test-to-test consistency of the EC50 values for each chemi-al tested alone, the mean and standard deviation (S.D.) of the EC50ere determined and the coefficient of variation (CV) values were
alculated using:
V = 100 × S.D.
mean
For mixture x/y data, concentrations of chemical B were con-erted to concentration equivalents of chemical A. The conversionactor for calculating the concentration equivalents of chemical Bas determined by dividing the concentration of chemical A by the
oncentration of chemical B [24]. This permitted the total chemicaloncentration of the mixture to be made relative to those of chem-cal A alone, while allowing the plot of the mixture curve at anyxposure duration to be graphed as mg/L concentrations for chem-cal A and chemical B individually. The same curve-fitting methodssed for the individual chemicals were used for the mixture tests.
.4. Calculation of TDT values
TDT values were calculated to quantify changes in toxicity ofhe individual chemicals and the mixtures over exposure time. Asetailed previously [28] TDT values at various timepoints and athe 25%, 50% and 75% effect levels could be generated based on thepproach of Haber [30], using the specific methodology describedelow.
Toxicity was measured at three exposure durations so TDT val-es were calculated for each time series: 15–30-min, 30–45-minnd 15–45-min using the appropriate time factor [22]. Time factorsere calculated using the following equation:
t2 − t1) /t2
ith t2 being the later timepoint and t1 the earlier timepoint. So,he time factors for the 15–30 min, 30–45 min, and 15–45 min timeeries were 0.5, 0.333, and 0.667, respectively.
The following set of equations was then used to calculate TDT:
d = ECxt1− ECxt2
e = d ÷(
ECxt1× ft1:t2
)
TDT = e × 100
in which ECx is the effect level (i.e. 25%, 50%, 75%), t2 is the latertime within the exposure time series, t1 is the earlier time of thattime series, and ft1:t2 is the appropriate time factor (see above) forthe time series. Exemplifying the calculation protocol using the 50%effect level for the 15–45 min time series, the steps were: (a) sub-traction of the 45-min EC50 from the 15-min EC50; (b) dividing thatdifference by the product of the 15-min EC50 value and 0.667; and(c) multiplying that quotient by 100 to put it on a percentage basis.So, for a hypothetical chemical with a 15-min EC50 of 15 mg/L anda 45-min EC50 of 5 mg/L, the TDT at 50% effect for the 15–45 timeseries was 100%, as shown below [28]:
a) 15mg/L − 5mg/L = 10mg/L
b) 10mg/L ÷(
15mg/L × 0.667)
= 1
c) 1 × 100 = 100%
Values for TDT25 and TDT75 were calculated similarly using theappropriate time factors and EC25 or EC75 data, respectively.
The only TDT values reported herein are the mean TDT values forthe 15–45 min time series (i.e., mean TDT15-45). They were calcu-lated separately for each single chemical and mixture by summingthe TDT15-45 values at the 25%, 50% and 75% effect levels and takingthe average [28]. For each experiment, mean TDT15-45 values for Aand B were then totaled and the average was determined in orderto obtain a predicted mixture mean TDT15-45 value. For simplicity,from this point on TDT is used as the designation for mean TDT15-45.
2.5. Calculation of predicted dose-addition and independencecurves
The predicted x/y curve for dose-addition was calculated fol-lowing the procedure described previously [24]. In essence, whenagents A and B are dose-additive the EC50 for A + B is graphicallyleft-shifted by a dose-ratio (DR) factor of 2 when the agents areequieffective. This is calculated using the equation:
Add50 = a50DR50
in which Add50 is the EC50 for dose-addition, a50 is the EC50 ofthe more potent chemical and b50 (noted below) is the EC50 of theless potent agent. The DR50 was determined by:
( )
DR50 = 1 + a50b50
Calculation of EC25 and EC75 values for the predicted dose-addition curve was conducted likewise. Taken together, these

D.A. Dawson et al. / Toxicology Reports 3 (2016) 572–583 575
Table 3EC50 values (mg/L) for each chemical tested alone within each combination.
CombinationA:B A: 15-minEC50 A: 30-minEC50 A: 45-minEC50 B: 15-minEC50 B: 30-minEC50 B: 45-minEC50
IAN:IAN 3.01 1.48 0.96 2.93 1.47 0.95BRAN:BRAN 2.92 1.39 0.87 2.91 1.38 0.85CLAN:CLAN 157.75 73.84 44.33 156.31 69.96 42.32CLAN:CLAN 160.78 75.29 45.69 151.78 70.10 42.18
IAN:BRAN 2.93 1.43 0.93 2.80 1.33 0.83IAN:CLAN 3.12 1.53 0.98 168.11 77.98 47.60BRAN:CLAN 2.76 1.31 0.81 158.09 74.25 45.28
IAN:3M2B 2.90 1.47 0.95 37.27 40.36 41.51BRAN:3M2B 2.89 1.37 0.87 40.23 41.33 43.00CLAN:3M2B 155.97 72.36 45.02 47.59 46.12 43.18
IAN:4NBB 3.17 1.52 0.99 0.62 0.36 0.23BRAN:4NBB 2.76 1.33 0.86 0.73 0.40 0.27CLAN:4NBB 146.32 69.77 43.56 0.26 0.13 0.09
IAN:BGE 3.37 1.67 1.15 541.30 594.34 634.83BRAN:BGE 2.98 1.48 0.97 542.38 576.95 597.36CLAN:BGE 151.96 72.95 46.26 583.80 588.03 625.25
IAN:DBRAN 2.55 1.22 0.78 1.92 2.14 2.12BRAN:DBRAN 2.69 1.24 0.77 2.35 2.37 2.30CLAN:DBRAN 154.33 70.93 43.92 2.47 2.49 2.41
IAN:DCLAN 2.81 1.37 0.89 29.58 19.69 15.39BRAN:DCLAN 2.73 1.26 0.79 25.23 18.97 15.96CLAN:DCLAN 176.02 76.48 44.28 24.65 18.29 14.64
IAN:DEM 2.40 1.16 0.75 46.63 37.86 33.38BRAN:DEM 1.82 0.85 0.52 43.99 38.35 32.92CLAN:DEM 128.56 64.78 39.11 43.52 36.80 31.49
IAN:EA 3.76 1.81 1.13 122.61 94.82 82.14BRAN:EA 3.61 1.68 1.02 139.75 108.86 88.24CLAN:EA 160.25 71.95 46.93 165.26 125.76 109.15
IAN:EAC 3.07 1.51 1.03 1026.47 1113.33 1175.18BRAN:EAC 2.57 1.24 0.79 1968.51 2070.82 2128.32CLAN:EAC 156.55 71.24 43.67 1400.62 1486.42 1684.55
IAN:EBAC 3.25 1.63 1.08 1.05 0.41 0.23BRAN:EBAC 2.90 1.33 0.83 1.01 0.39 0.21CLAN:EBAC 151.33 69.24 43.74 1.26 0.52 0.29
IAN:ECAC 2.78 1.41 0.91 87.44 55.79 39.40BRAN:ECAC 2.86 1.34 0.81 96.36 57.58 38.36CLAN:ECAC 170.79 76.87 46.80 95.48 64.62 41.70
IAN:EFAC 3.53 1.64 1.01 1422.28 1283.86 1313.91BRAN:EFAC 2.85 1.32 0.82 1305.89 1289.64 1290.91CLAN:EFAC 168.52 73.61 44.65 1346.58 1283.17 1375.03
IAN:EIAC 2.89 1.41 0.94 0.30 0.12 0.07BRAN:EIAC 2.74 1.31 0.82 0.28 0.11 0.07CLAN:EIAC 159.12 73.66 45.70 0.31 0.13 0.08
IAN:EP 3.03 1.43 0.94 2.14 1.05 0.66BRAN:EP 2.67 1.27 0.79 2.96 1.37 0.84CLAN:EP 155.56 74.60 46.73 2.06 1.02 0.63
IAN:LIN 2.28 1.17 0.79 16.46 17.32 19.15BRAN:LIN 2.97 1.49 0.95 16.62 19.14 21.88CLAN:LIN 146.05 71.05 47.52 13.89 14.01 15.75
IAN:M2BP 2.97 1.57 1.09 38.86 26.49 20.45BRAN:M2BP 2.77 1.31 0.81 28.00 19.50 15.21CLAN:M2BP 142.73 67.16 43.44 41.51 27.97 22.79
IAN:MC 3.10 1.58 1.09 204.56 197.93 208.86BRAN:MC 2.68 1.34 0.86 207.38 170.52 156.11CLAN:MC 150.90 73.03 44.83 217.51 184.69 188.32
IAN:MVK 3.20 1.70 1.17 0.59 0.33 0.24BRAN:MVK 2.72 1.30 0.81 0.66 0.34 0.23CLAN:MVK 155.28 74.25 49.24 0.72 0.39 0.28
IAN:NER 3.06 1.57 1.07 8.89 10.07 11.30BRAN:NER 3.10 1.50 1.00 6.80 7.60 8.28CLAN:NER 167.31 80.96 52.75 8.72 9.41 10.48
IAN:PN 3.03 1.47 0.96 3926.46 3628.92 3269.04BRAN:PN 2.81 1.32 0.84 3742.01 3354.16 2972.09CLAN:PN 154.59 74.19 45.40 4026.94 3794.69 3400.06
3
2
47
p(a
IAN:TCLAN 2.95 1.41 0.9BRAN:TCLAN 2.73 1.32 0.8CLAN:TCLAN 155.21 70.98 44.
redicted values (EC25, EC50, and EC75) and the maximum effectalways 100% herein) permitted calculation of the predicted dose-ddition curve via the curve-fitting procedures described above.
1.22 0.94 0.901.62 1.20 1.001.11 0.90 0.82
Predicted curves for the independence model [31] were cal-culated using a user-generated transform within SigmaPlot® as:
yA +[
yB × (100 − yA)100
]
576 D.A. Dawson et al. / Toxicology R
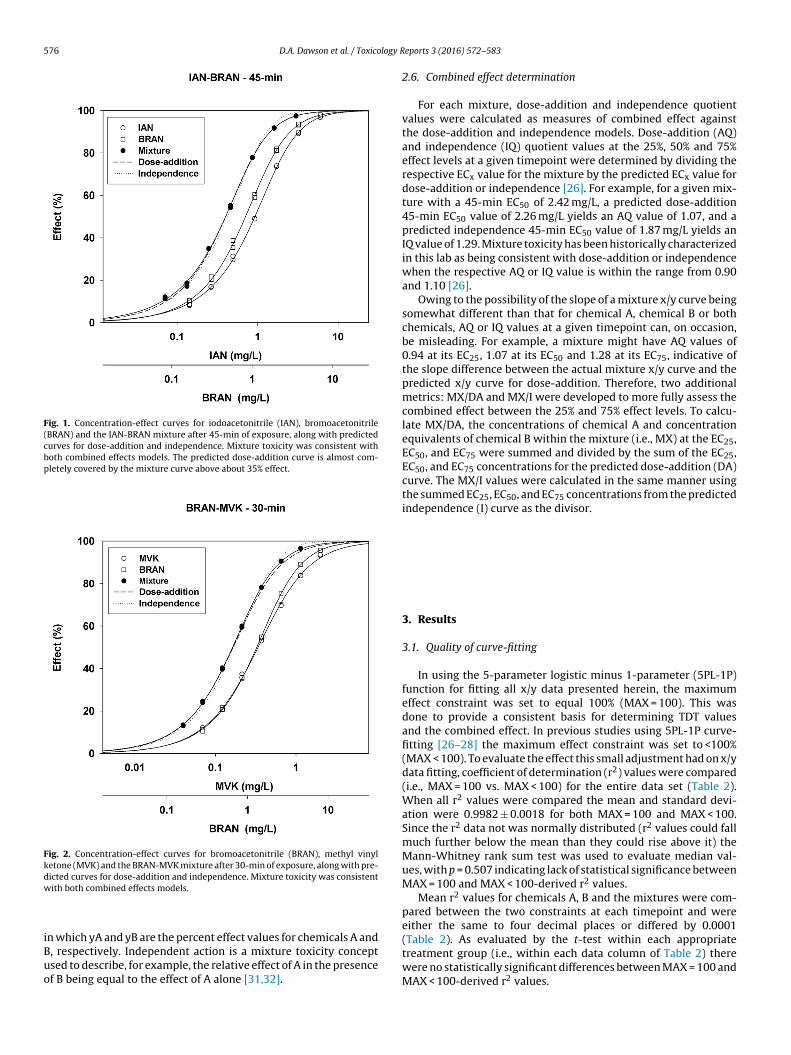
Fig. 1. Concentration-effect curves for iodoacetonitrile (IAN), bromoacetonitrile(BRAN) and the IAN-BRAN mixture after 45-min of exposure, along with predictedcurves for dose-addition and independence. Mixture toxicity was consistent withboth combined effects models. The predicted dose-addition curve is almost com-pletely covered by the mixture curve above about 35% effect.
Fig. 2. Concentration-effect curves for bromoacetonitrile (BRAN), methyl vinylketone (MVK) and the BRAN-MVK mixture after 30-min of exposure, along with pre-dicted curves for dose-addition and independence. Mixture toxicity was consistentw
iBuo
(Table 2). As evaluated by the t-test within each appropriatetreatment group (i.e., within each data column of Table 2) there
ith both combined effects models.
n which yA and yB are the percent effect values for chemicals A and, respectively. Independent action is a mixture toxicity concept
sed to describe, for example, the relative effect of A in the presencef B being equal to the effect of A alone [31,32].eports 3 (2016) 572–583
2.6. Combined effect determination
For each mixture, dose-addition and independence quotientvalues were calculated as measures of combined effect againstthe dose-addition and independence models. Dose-addition (AQ)and independence (IQ) quotient values at the 25%, 50% and 75%effect levels at a given timepoint were determined by dividing therespective ECx value for the mixture by the predicted ECx value fordose-addition or independence [26]. For example, for a given mix-ture with a 45-min EC50 of 2.42 mg/L, a predicted dose-addition45-min EC50 value of 2.26 mg/L yields an AQ value of 1.07, and apredicted independence 45-min EC50 value of 1.87 mg/L yields anIQ value of 1.29. Mixture toxicity has been historically characterizedin this lab as being consistent with dose-addition or independencewhen the respective AQ or IQ value is within the range from 0.90and 1.10 [26].
Owing to the possibility of the slope of a mixture x/y curve beingsomewhat different than that for chemical A, chemical B or bothchemicals, AQ or IQ values at a given timepoint can, on occasion,be misleading. For example, a mixture might have AQ values of0.94 at its EC25, 1.07 at its EC50 and 1.28 at its EC75, indicative ofthe slope difference between the actual mixture x/y curve and thepredicted x/y curve for dose-addition. Therefore, two additionalmetrics: MX/DA and MX/I were developed to more fully assess thecombined effect between the 25% and 75% effect levels. To calcu-late MX/DA, the concentrations of chemical A and concentrationequivalents of chemical B within the mixture (i.e., MX) at the EC25,EC50, and EC75 were summed and divided by the sum of the EC25,EC50, and EC75 concentrations for the predicted dose-addition (DA)curve. The MX/I values were calculated in the same manner usingthe summed EC25, EC50, and EC75 concentrations from the predictedindependence (I) curve as the divisor.
3. Results
3.1. Quality of curve-fitting
In using the 5-parameter logistic minus 1-parameter (5PL-1P)function for fitting all x/y data presented herein, the maximumeffect constraint was set to equal 100% (MAX = 100). This wasdone to provide a consistent basis for determining TDT valuesand the combined effect. In previous studies using 5PL-1P curve-fitting [26–28] the maximum effect constraint was set to <100%(MAX < 100). To evaluate the effect this small adjustment had on x/ydata fitting, coefficient of determination (r2) values were compared(i.e., MAX = 100 vs. MAX < 100) for the entire data set (Table 2).When all r2 values were compared the mean and standard devi-ation were 0.9982 ± 0.0018 for both MAX = 100 and MAX < 100.Since the r2 data not was normally distributed (r2 values could fallmuch further below the mean than they could rise above it) theMann-Whitney rank sum test was used to evaluate median val-ues, with p = 0.507 indicating lack of statistical significance betweenMAX = 100 and MAX < 100-derived r2 values.
Mean r2 values for chemicals A, B and the mixtures were com-pared between the two constraints at each timepoint and wereeither the same to four decimal places or differed by 0.0001
were no statistically significant differences between MAX = 100 andMAX < 100-derived r2 values.

D.A. Dawson et al. / Toxicology R
Table 4CVa values for EC50 data.
Chemical (n) 15-min 30-min 45-min
IAN (24) 10.7 10.6 11.4BRAN (24) 10.4 10.7 11.4CLAN (26) 6.2 4.7 5.63M2B (3) 12.7 7.2 2.24NBB (3) 45.8 49.1 48.0BGE (3) 4.4 1.5 3.1DBRAN (3) 12.9 7.6 6.4DCLAN (3) 10.2 3.7 4.3DEM (3) 3.7 2.1 3.0EA (3) 15.1 14.1 15.2EAC (3) 32.4 31.0 28.7EBAC (3) 12.1 15.9 17.1ECAC (3) 5.3 7.9 4.3EFAC (3) 2.5 0.3 3.3EIAC (3) 5.2 8.3 7.9EP (3) 20.9 16.9 16.0LIN (3) 9.8 15.5 16.2M2BP (3) 19.8 18.4 19.9MC (3) 3.2 7.4 14.4MVK (3) 9.9 9.1 10.6NER (3) 14.3 14.2 15.6PN (3) 3.7 6.2 6.8
3c
psoc
3
m(bbIotcc
tc(mowtowcf(weotp
t
TCLAN (3) 20.4 14.8 9.9
a Coefficient of variation.
.2. Consistency of EC50 values across multiple tests of eachhemical alone
Calculated EC50 values for each chemical tested alone arerovided in mg/L for each combination (Table 3). Test-to-test con-istency of these values was assessed by determining the coefficientf variation (CV) for each chemical (Table 4). These were typi-ally <20 and always <50.
.3. Combined effects
Combined effects of mono-halogenated acetonitrile-containingixtures versus the dose-addition (Table 5) and independence
Table 6) models varied depending on the chemical combinationeing examined and were generally, but not always, consistentetween the EC50-AQ and MX/DA metrics and between the EC50-
Q and MX/I metrics. Sham (e.g., IAN-IAN) and true combinationsf mono-halogenated acetonitriles (e.g., IAN-BRAN) were consis-ent with both dose-addition and independence as the predictedurves for the two combined effect models tend to overlap for thesehemicals (e.g., Fig. 1).
Several other chemicals tested with the mono-halogenated ace-onitriles also produced combined effects that were predominantlyonsistent with dose-addition (Table 5), such as ethyl bromoacetateEBAC), ethyl fluoroacetate (EFAC), ethyl iodoacetate (EIAC), and
ethyl vinyl ketone (MVK; e.g., with BRAN, Fig. 2). For ethyl propi-late (EP) the combined effect with IAN and CLAN was consistentith dose addition across all three timepoints but when EP was
ested with BRAN, slightly greater-than dose-additive toxicity wasbserved at 15 and 30-min of exposure before becoming consistentith dose-addition at 45-min. For ethyl chloroacetate (ECAC) the
ombined effect with the XANs (i.e., X = I, Br or Cl) varied somewhatrom dose-addition, especially at 15 and 30-min. Two of the agentsEBAC, EIAC) produced combined effects that were also consistentith independence across the three timepoints when given with
ach XAN. A third chemical (MVK) also produced some instancesf consistency with independence when given with each XAN, but
here were also instances of the mixture toxicity being less-thanredicted by the independence model at 15 and 30-min (Table 6).For most of the remaining combinations, with specific excep-ions at individual timepoints, mixture toxicity was less-than that
eports 3 (2016) 572–583 577
predicted by both the dose-addition and independence models.These results tended to be consistent between the EC50-AQ andMX/DA metrics for dose-addition (Table 5) and between the EC50-IQ and MX/I metrics for independence (Table 6). Again a metricvalue > 1.10 was used to indicate a combined effect less-than thatpredicted by the model. One prominent exception to this consis-tency was noted when each of the XANs was tested with linalool(LIN). At the 45-min timepoint, the EC50-AQ values suggested adose-additive combined effect for IAN-LIN, BRAN-LIN and CLAN-LIN, in contrast to the MX/DA metric values which indicated aless-than dose-additive combined effect.
A few instances of combined effects greater-than predicted bythe models were also observed. Although at the early and middletimepoints two combinations showed greater-than dose-additivetoxicity (Table 5: IAN-EFAC – at 15-min for only the EC50-AQ metric;BRAN-EP at 15 and 30-min for both metrics) and two combinationsshowed greater-than independent effects (Table 6: IAN-CLAN at 15and 30-min for only the EC50-IQ metric; BRAN-EP at 15 and 30-min for both metrics), enhanced mixture toxicity was not observedat the 45-min timepoint for any of the combinations based on thepredicted effects for either metric of each model.
3.4. TDT and combined effect
Time-dependent toxicity (TDT) values were always 95% orgreater for the mono-halogenated acetonitriles tested singly, whilethose values for the other chemicals spanned the range from beingnegative to greater-than 100% (i.e., −46% to 121% – Tables 7–8).Using the MX/DA metric for combined effect, Table 7 shows thecombinations for which mixture toxicity was consistent with dose-addition after 45-min of exposure. Table 8 shows the combinationsfor which mixture toxicity via the MX/DA metric was not consis-tent with dose-addition after 45-min. Please note in these tablesthat for each combination the TDT values reported are presentedas the chemical with the higher individual TDT (column 2) and theone with the lower individual TDT (column 3); they are not nec-essarily the first- and second-listed chemicals of the combination(column 1). For example, in Table 7 for the BRAN-CLAN combina-tion, CLAN had the higher TDT (107.9) and BRAN the lower TDT(106.1). Also given are the predicted mixture TDT value (TDTp) (i.e.,the average of the TDT values of the chemicals in the combination– column 4), the observed TDT value (TDTo) obtained in testing(column 5), and the difference between the observed TDT and pre-dicted TDT (TDTo-p – column 6). For ease of reference the 45-minMX/DA values are also provided (column 7).
In the study, 25 combinations were consistent with dose-addition by the MX/DA metric after 45-min and the mean ± S.E.for the TDTo-p values of those combinations was 3.5 ± 1.1. Of the 25dose-additive combinations, 23 (92%) had TDTo-p values that were<10. The combinations with TDTo-p that were >10 contained EFAC,which when tested alone had individual TDT values that were <30%.So, the difference in TDT between the chemical with the higherTDT and the TDT of EFAC was always >60%. All dose-additive com-binations that did not contain EFAC had a difference between thechemical with the higher TDT and the chemical with the lower TDTthat was >25% (Table 7). Also, of the 25 combinations that were con-sistent with dose-addition, 22 (88%) had individual TDT values thatwere >80% for both chemicals.
There were 42 combinations that produced a combined effectthat was not consistent with dose-addition after 45-min of expo-sure when using the MX/DA metric and the mean ± S.E. for theTDTo-p values was 7.6 ± 1.5 (Table 8). Of those 42 combinations,
33 (78.6%) had TDTo-p values that were <10. In the nine caseswhere TDTo-p values were >10, the TDT value for the chemical withlower TDT was always <45%. Once again, the difference in TDT ofthe chemical with the higher TDT and that with the lower TDT
578 D.A. Dawson et al. / Toxicology Reports 3 (2016) 572–583
Table 5Mixture toxicity versus dose-addition using the AQa and MX/DAb metrics.
Combination 15-minEC50 AQ MX/DA 30-minEC50 AQ MX/DA 45-minEC50 AQ MX/DA
IAN-IAN 0.99c 1.00 1.01 1.01 1.03 1.03BRAN-BRAN 1.00 1.01 1.01 1.01 1.06 1.05CLAN-CLAN 0.99 1.00 0.99 1.00 1.01 1.01CLAN-CLAN 0.96 0.96 0.95 0.95 0.98 0.97
IAN-BRAN 1.00 1.00 1.01 1.01 1.00 1.00IAN-CLAN 0.96 0.96 0.96 0.96 0.99 0.99BRAN-CLAN 1.04 1.02 1.04 1.03 1.05 1.04
IAN-3M2B 1.10 1.10 1.11d 1.16 1.22 1.27BRAN-3M2B 1.10 1.08 1.17 1.21 1.22 1.32CLAN-3M2B 1.07 1.20 1.20 1.34 1.36 1.51
IAN-4NBB 1.22 1.26 1.04 1.07 0.97 0.97BRAN-4NBB 1.28 1.43 1.28 1.32 1.27 1.31CLAN-4NBB 1.20 1.22 1.24 1.22 1.20 1.17
IAN-BGE 1.18 1.17 1.28 1.28 1.35 1.37BRAN-BGE 1.14 1.19 1.32 1.38 1.46 1.51CLAN-BGE 1.13 1.21 1.32 1.38 1.41 1.46
IAN-DBRAN 1.42 1.48 1.28 1.34 1.21 1.28BRAN-DBRAN 1.22 1.22 1.26 1.28 1.23 1.26CLAN-DBRAN 1.15 1.14 1.22 1.22 1.19 1.19
IAN-DCLAN 1.17 1.27 1.19 1.29 1.18 1.28BRAN-DCLAN 1.13 1.20 1.16 1.30 1.21 1.38CLAN-DCLAN 1.25 1.39 1.15 1.33 1.14 1.31
IAN-DEM 1.09 1.13 1.15 1.23 1.08 1.16BRAN-DEM 1.10 1.18 1.11 1.22 1.15 1.27CLAN-DEM 1.24 1.35 1.21 1.31 1.24 1.34
IAN-EA 1.19 1.24 1.16 1.22 1.23 1.28BRAN-EA 1.20 1.24 1.20 1.27 1.21 1.27CLAN-EA 1.19 1.26 1.19 1.25 1.20 1.26
IAN-EAC 1.17 1.12 1.28 1.21 1.26 1.23BRAN-EAC 1.02 1.04 1.21 1.21 1.37 1.36CLAN-EAC 1.10 1.07 1.21 1.20 1.39 1.36
IAN-EBAC 0.97 0.98 0.94 0.95 0.91 0.92BRAN-EBAC 1.01 1.00 0.97 0.97 0.96 0.96CLAN-EBAC 0.97 0.96 0.94 0.95 0.93 0.94
IAN-ECAC 1.12 1.24 1.03 1.11 0.95 1.02BRAN-ECAC 1.13 1.25 1.12 1.19 1.06 1.11CLAN-ECAC 1.10 1.23 1.05 1.11 1.03 1.09
IAN-EFAC 0.84e 0.92 0.93 1.02 0.93 1.02BRAN-EFAC 0.98 0.99 0.91 0.95 0.93 0.97CLAN-EFAC 0.95 0.94 0.90 0.91 0.91 0.93
IAN-EIAC 0.95 0.96 0.96 0.96 0.96 0.95BRAN-EIAC 0.98 0.98 0.96 0.97 0.93 0.94CLAN-EIAC 0.95 0.92 0.97 0.96 0.96 0.96
IAN-EP 1.08 1.09 1.10 1.10 1.08 1.09BRAN-EP 0.87 0.86 0.88 0.89 0.91 0.92CLAN-EP 0.92 0.93 0.93 0.95 0.93 0.94
IAN-LIN 1.11 1.18 1.07 1.18 1.09 1.21BRAN-LIN 0.97 1.06 0.98 1.10 0.99 1.14CLAN-LIN 0.93 1.11 1.02 1.17 1.01 1.18
IAN-M2BP 1.25 1.31 1.30 1.34 1.28 1.31BRAN-M2BP 1.22 1.26 1.26 1.31 1.26 1.30CLAN-M2BP 1.40 1.51 1.46 1.52 1.37 1.43
IAN-MC 1.09 1.16 1.18 1.24 1.27 1.31BRAN-MC 1.13 1.15 1.15 1.17 1.20 1.23CLAN-MC 1.15 1.21 1.27 1.28 1.39 1.39
IAN-MVK 1.05 1.06 1.05 1.05 1.03 1.03BRAN-MVK 0.96 0.93 0.99 0.97 1.04 1.02CLAN-MVK 1.02 0.97 1.00 0.99 0.98 0.98
IAN-NER 1.06 1.13 1.14 1.21 1.20 1.27BRAN-NER 1.13 1.16 1.20 1.25 1.29 1.36CLAN-NER 1.14 1.20 1.24 1.29 1.29 1.36
IAN-PN 1.19 1.17 1.24 1.24 1.25 1.26BRAN-PN 1.29 1.26 1.33 1.33 1.30 1.33CLAN-PN 1.33 1.32 1.35 1.36 1.40 1.40
IAN-TCLAN 1.57 1.48 1.48 1.37 1.39 1.31BRAN-TCLAN 1.19 1.15 1.16 1.12 1.20 1.15CLAN-TCLAN 1.30 1.23 1.19 1.15 1.17 1.14
a AQ – EC50 additivity quotient for dose-addition – see text for calculation procedures.b MX/DA – Mixture/dose-addition – see text for calculation procedures.c Bolded text – combined effect consistent with dose-addition.d Normal text – combined effect less-than that predicted by dose-addition.e Italicized text – combined effect greater-than that predicted by dose-addition.

D.A. Dawson et al. / Toxicology Reports 3 (2016) 572–583 579
Table 6Mixture toxicity versus independence using the IQa and MX/Ib metrics.
Combination 15-minEC50 IQ MX/I 30-minEC50 IQ MX/I 45-minEC50 IQ MX/I
IAN-IAN 0.90c 0.96 0.92 0.95 0.95 0.97BRAN-BRAN 0.94 0.98 0.95 0.97 0.99 1.01CLAN-CLAN 0.92 0.96 0.94 0.98 0.97 1.00CLAN-CLAN 0.90 0.93 0.90 0.92 0.93 0.94
IAN-BRAN 0.91 0.95 0.93 0.96 0.94 0.96IAN-CLAN 0.87d 0.92 0.88 0.91 0.92 0.94BRAN-CLAN 0.96 0.99 0.96 0.99 0.97 1.00
IAN-3M2B 1.07 1.21e 1.13 1.30 1.28 1.46BRAN-3M2B 1.09 1.23 1.21 1.40 1.28 1.50CLAN-3M2B 1.10 1.37 1.27 1.54 1.47 1.74
IAN-4NBB 1.21 1.45 1.06 1.23 1.01 1.13BRAN-4NBB 1.43 1.75 1.41 1.62 1.37 1.56CLAN-4NBB 1.21 1.37 1.30 1.41 1.26 1.35
IAN-BGE 1.26 1.40 1.30 1.44 1.35 1.48BRAN-BGE 1.24 1.39 1.45 1.60 1.56 1.69CLAN-BGE 1.28 1.48 1.50 1.67 1.51 1.67
IAN-DBRAN 1.17 1.24 1.06 1.11 1.04 1.09BRAN-DBRAN 1.07 1.06 1.16 1.15 1.18 1.19CLAN-DBRAN 0.98 1.07 1.08 1.06 1.06 1.05
IAN-DCLAN 1.22 1.45 1.26 1.50 1.27 1.47BRAN-DCLAN 1.11 1.31 1.19 1.47 1.27 1.55CLAN-DCLAN 1.35 1.63 1.34 1.66 1.34 1.66
IAN-DEM 1.07 1.21 1.16 1.33 1.12 1.26BRAN-DEM 1.07 1.25 1.08 1.28 1.11 1.31CLAN-DEM 1.26 1.48 1.21 1.41 1.26 1.45
IAN-EA 1.22 1.33 1.18 1.28 1.22 1.31BRAN-EA 1.20 1.33 1.21 1.34 1.20 1.32CLAN-EA 1.31 1.42 1.34 1.44 1.34 1.42
IAN-EAC 1.20 1.29 1.38 1.41 1.38 1.42BRAN-EAC 1.12 1.23 1.33 1.42 1.47 1.55CLAN-EAC 1.19 1.31 1.31 1.43 1.49 1.57
IAN-EBAC 0.96 1.02 0.97 1.00 0.98 0.98BRAN-EBAC 1.02 1.05 1.07 1.08 1.08 1.08CLAN-EBAC 0.98 1.02 1.02 1.03 1.07 1.05
IAN-ECAC 1.18 1.46 1.10 1.27 1.04 1.17BRAN-ECAC 1.20 1.47 1.20 1.39 1.17 1.31CLAN-ECAC 1.20 1.47 1.13 1.29 1.14 1.28
IAN-EFAC 0.93 1.18 1.10 1.32 1.16 1.30BRAN-EFAC 1.15 1.31 1.08 1.21 1.18 1.24CLAN-EFAC 1.06 1.21 1.10 1.19 1.15 1.19
IAN-EIAC 0.94 1.00 0.98 1.01 1.02 1.03BRAN-EIAC 0.98 1.03 1.01 1.04 0.98 1.01CLAN-EIAC 0.93 0.95 0.97 0.99 0.99 1.02
IAN-EP 1.16 1.21 1.15 1.20 1.14 1.18BRAN-EP 0.83 0.87 0.85 0.89 0.90 0.94CLAN-EP 0.92 0.97 0.94 0.99 0.98 1.01
IAN-LIN 1.21 1.44 1.19 1.45 1.19 1.44BRAN-LIN 1.11 1.31 1.14 1.38 1.18 1.43CLAN-LIN 1.00 1.39 1.18 1.50 1.15 1.47
IAN-M2BP 1.24 1.37 1.29 1.40 1.29 1.38BRAN-M2BP 1.15 1.24 1.18 1.25 1.19 1.26CLAN-M2BP 1.36 1.56 1.46 1.60 1.35 1.48
IAN-MC 1.10 1.25 1.19 1.29 1.21 1.28BRAN-MC 1.10 1.18 1.11 1.18 1.16 1.22CLAN-MC 1.25 1.37 1.38 1.44 1.44 1.49
IAN-MVK 1.09 1.19 1.10 1.15 1.06 1.10BRAN-MVK 0.93 0.97 0.94 0.98 0.99 1.02CLAN-MVK 1.08 1.11 1.08 1.12 1.04 1.08
IAN-NER 1.23 1.36 1.23 1.38 1.25 1.38BRAN-NER 1.18 1.30 1.25 1.40 1.33 1.49CLAN-NER 1.24 1.39 1.34 1.49 1.35 1.52
IAN-PN 1.12 1.13 1.17 1.18 1.19 1.20BRAN-PN 1.22 1.21 1.28 1.28 1.25 1.28CLAN-PN 1.28 1.29 1.27 1.30 1.33 1.34
IAN-TCLAN 1.68 1.76 1.60 1.64 1.50 1.55BRAN-TCLAN 1.14 1.22 1.12 1.18 1.19 1.22CLAN-TCLAN 1.28 1.33 1.17 1.24 1.15 1.20
a IQ – EC50 independence quotient – see text for calculation procedures.b MX/I – Mixture/independence – see text for calculation procedures.c Bolded text – combined effect consistent with independence.d Italicized text – combined effect greater-than that predicted by independence.e Normal text – combined effect less-than that predicted by independence.
580 D.A. Dawson et al. / Toxicology Reports 3 (2016) 572–583
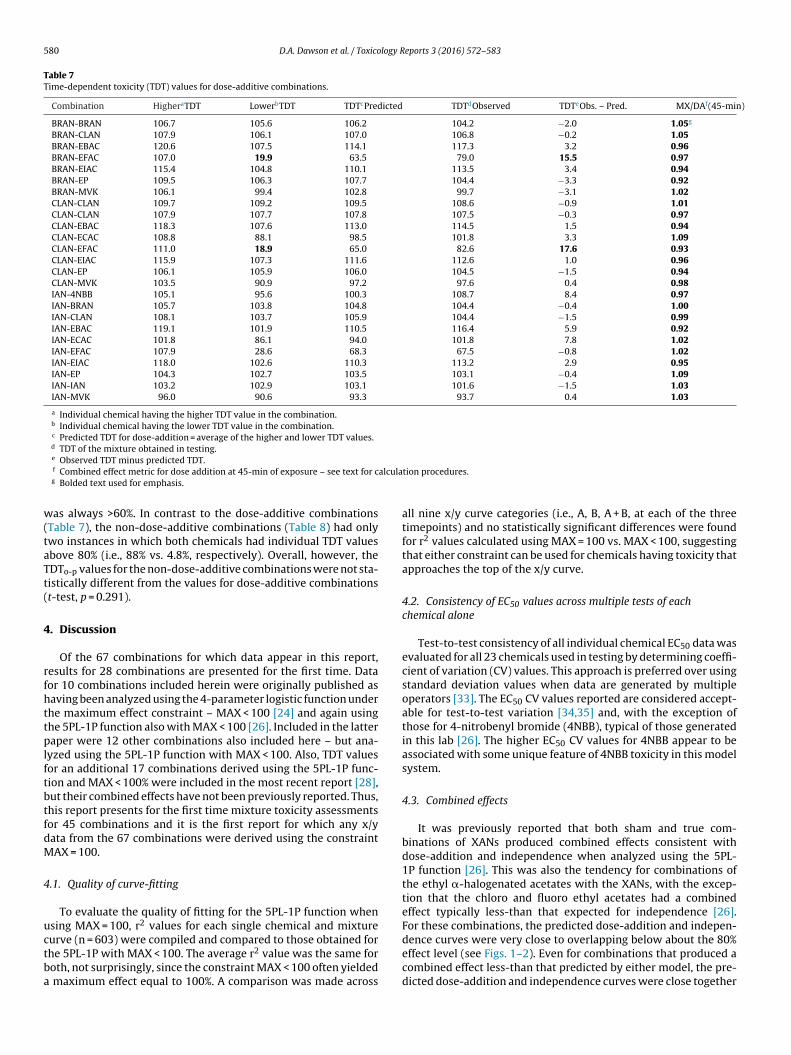
Table 7Time-dependent toxicity (TDT) values for dose-additive combinations.
Combination HigheraTDT LowerbTDT TDTcPredicted TDTdObserved TDTeObs. – Pred. MX/DAf(45-min)
BRAN-BRAN 106.7 105.6 106.2 104.2 −2.0 1.05g
BRAN-CLAN 107.9 106.1 107.0 106.8 −0.2 1.05BRAN-EBAC 120.6 107.5 114.1 117.3 3.2 0.96BRAN-EFAC 107.0 19.9 63.5 79.0 15.5 0.97BRAN-EIAC 115.4 104.8 110.1 113.5 3.4 0.94BRAN-EP 109.5 106.3 107.7 104.4 −3.3 0.92BRAN-MVK 106.1 99.4 102.8 99.7 −3.1 1.02CLAN-CLAN 109.7 109.2 109.5 108.6 −0.9 1.01CLAN-CLAN 107.9 107.7 107.8 107.5 −0.3 0.97CLAN-EBAC 118.3 107.6 113.0 114.5 1.5 0.94CLAN-ECAC 108.8 88.1 98.5 101.8 3.3 1.09CLAN-EFAC 111.0 18.9 65.0 82.6 17.6 0.93CLAN-EIAC 115.9 107.3 111.6 112.6 1.0 0.96CLAN-EP 106.1 105.9 106.0 104.5 −1.5 0.94CLAN-MVK 103.5 90.9 97.2 97.6 0.4 0.98IAN-4NBB 105.1 95.6 100.3 108.7 8.4 0.97IAN-BRAN 105.7 103.8 104.8 104.4 −0.4 1.00IAN-CLAN 108.1 103.7 105.9 104.4 −1.5 0.99IAN-EBAC 119.1 101.9 110.5 116.4 5.9 0.92IAN-ECAC 101.8 86.1 94.0 101.8 7.8 1.02IAN-EFAC 107.9 28.6 68.3 67.5 −0.8 1.02IAN-EIAC 118.0 102.6 110.3 113.2 2.9 0.95IAN-EP 104.3 102.7 103.5 103.1 −0.4 1.09IAN-IAN 103.2 102.9 103.1 101.6 −1.5 1.03IAN-MVK 96.0 90.6 93.3 93.7 0.4 1.03
a Individual chemical having the higher TDT value in the combination.b Individual chemical having the lower TDT value in the combination.c Predicted TDT for dose-addition = average of the higher and lower TDT values.d TDT of the mixture obtained in testing.
alcula
w(taTt(
4
rfhttplftbtfdM
4
uctba
e Observed TDT minus predicted TDT.f Combined effect metric for dose addition at 45-min of exposure – see text for cg Bolded text used for emphasis.
as always >60%. In contrast to the dose-additive combinationsTable 7), the non-dose-additive combinations (Table 8) had onlywo instances in which both chemicals had individual TDT valuesbove 80% (i.e., 88% vs. 4.8%, respectively). Overall, however, theDTo-p values for the non-dose-additive combinations were not sta-istically different from the values for dose-additive combinationst-test, p = 0.291).
. Discussion
Of the 67 combinations for which data appear in this report,esults for 28 combinations are presented for the first time. Dataor 10 combinations included herein were originally published asaving been analyzed using the 4-parameter logistic function underhe maximum effect constraint – MAX < 100 [24] and again usinghe 5PL-1P function also with MAX < 100 [26]. Included in the latteraper were 12 other combinations also included here – but ana-
yzed using the 5PL-1P function with MAX < 100. Also, TDT valuesor an additional 17 combinations derived using the 5PL-1P func-ion and MAX < 100% were included in the most recent report [28],ut their combined effects have not been previously reported. Thus,his report presents for the first time mixture toxicity assessmentsor 45 combinations and it is the first report for which any x/yata from the 67 combinations were derived using the constraintAX = 100.
.1. Quality of curve-fitting
To evaluate the quality of fitting for the 5PL-1P function whensing MAX = 100, r2 values for each single chemical and mixture
urve (n = 603) were compiled and compared to those obtained forhe 5PL-1P with MAX < 100. The average r2 value was the same foroth, not surprisingly, since the constraint MAX < 100 often yieldedmaximum effect equal to 100%. A comparison was made across
tion procedures.
all nine x/y curve categories (i.e., A, B, A + B, at each of the threetimepoints) and no statistically significant differences were foundfor r2 values calculated using MAX = 100 vs. MAX < 100, suggestingthat either constraint can be used for chemicals having toxicity thatapproaches the top of the x/y curve.
4.2. Consistency of EC50 values across multiple tests of eachchemical alone
Test-to-test consistency of all individual chemical EC50 data wasevaluated for all 23 chemicals used in testing by determining coeffi-cient of variation (CV) values. This approach is preferred over usingstandard deviation values when data are generated by multipleoperators [33]. The EC50 CV values reported are considered accept-able for test-to-test variation [34,35] and, with the exception ofthose for 4-nitrobenyl bromide (4NBB), typical of those generatedin this lab [26]. The higher EC50 CV values for 4NBB appear to beassociated with some unique feature of 4NBB toxicity in this modelsystem.
4.3. Combined effects
It was previously reported that both sham and true com-binations of XANs produced combined effects consistent withdose-addition and independence when analyzed using the 5PL-1P function [26]. This was also the tendency for combinations ofthe ethyl �-halogenated acetates with the XANs, with the excep-tion that the chloro and fluoro ethyl acetates had a combinedeffect typically less-than that expected for independence [26].For these combinations, the predicted dose-addition and indepen-
dence curves were very close to overlapping below about the 80%effect level (see Figs. 1–2). Even for combinations that produced acombined effect less-than that predicted by either model, the pre-dicted dose-addition and independence curves were close together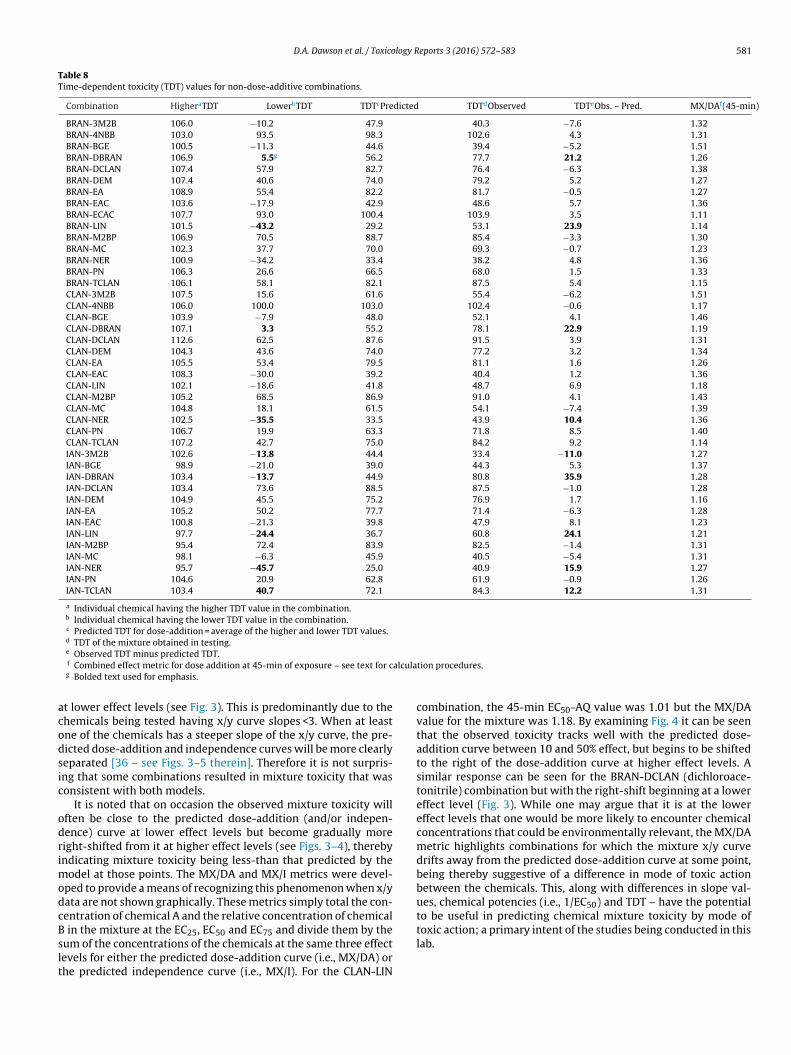
D.A. Dawson et al. / Toxicology Reports 3 (2016) 572–583 581
Table 8Time-dependent toxicity (TDT) values for non-dose-additive combinations.
Combination HigheraTDT LowerbTDT TDTcPredicted TDTdObserved TDTeObs. – Pred. MX/DAf(45-min)
BRAN-3M2B 106.0 −10.2 47.9 40.3 −7.6 1.32BRAN-4NBB 103.0 93.5 98.3 102.6 4.3 1.31BRAN-BGE 100.5 −11.3 44.6 39.4 −5.2 1.51BRAN-DBRAN 106.9 5.5g 56.2 77.7 21.2 1.26BRAN-DCLAN 107.4 57.9 82.7 76.4 −6.3 1.38BRAN-DEM 107.4 40.6 74.0 79.2 5.2 1.27BRAN-EA 108.9 55.4 82.2 81.7 −0.5 1.27BRAN-EAC 103.6 −17.9 42.9 48.6 5.7 1.36BRAN-ECAC 107.7 93.0 100.4 103.9 3.5 1.11BRAN-LIN 101.5 −43.2 29.2 53.1 23.9 1.14BRAN-M2BP 106.9 70.5 88.7 85.4 −3.3 1.30BRAN-MC 102.3 37.7 70.0 69.3 −0.7 1.23BRAN-NER 100.9 −34.2 33.4 38.2 4.8 1.36BRAN-PN 106.3 26.6 66.5 68.0 1.5 1.33BRAN-TCLAN 106.1 58.1 82.1 87.5 5.4 1.15CLAN-3M2B 107.5 15.6 61.6 55.4 −6.2 1.51CLAN-4NBB 106.0 100.0 103.0 102.4 −0.6 1.17CLAN-BGE 103.9 −7.9 48.0 52.1 4.1 1.46CLAN-DBRAN 107.1 3.3 55.2 78.1 22.9 1.19CLAN-DCLAN 112.6 62.5 87.6 91.5 3.9 1.31CLAN-DEM 104.3 43.6 74.0 77.2 3.2 1.34CLAN-EA 105.5 53.4 79.5 81.1 1.6 1.26CLAN-EAC 108.3 −30.0 39.2 40.4 1.2 1.36CLAN-LIN 102.1 −18.6 41.8 48.7 6.9 1.18CLAN-M2BP 105.2 68.5 86.9 91.0 4.1 1.43CLAN-MC 104.8 18.1 61.5 54.1 −7.4 1.39CLAN-NER 102.5 −35.5 33.5 43.9 10.4 1.36CLAN-PN 106.7 19.9 63.3 71.8 8.5 1.40CLAN-TCLAN 107.2 42.7 75.0 84.2 9.2 1.14IAN-3M2B 102.6 −13.8 44.4 33.4 −11.0 1.27IAN-BGE 98.9 −21.0 39.0 44.3 5.3 1.37IAN-DBRAN 103.4 −13.7 44.9 80.8 35.9 1.28IAN-DCLAN 103.4 73.6 88.5 87.5 −1.0 1.28IAN-DEM 104.9 45.5 75.2 76.9 1.7 1.16IAN-EA 105.2 50.2 77.7 71.4 −6.3 1.28IAN-EAC 100.8 −21.3 39.8 47.9 8.1 1.23IAN-LIN 97.7 −24.4 36.7 60.8 24.1 1.21IAN-M2BP 95.4 72.4 83.9 82.5 −1.4 1.31IAN-MC 98.1 −6.3 45.9 40.5 −5.4 1.31IAN-NER 95.7 −45.7 25.0 40.9 15.9 1.27IAN-PN 104.6 20.9 62.8 61.9 −0.9 1.26IAN-TCLAN 103.4 40.7 72.1 84.3 12.2 1.31
a Individual chemical having the higher TDT value in the combination.b Individual chemical having the lower TDT value in the combination.c Predicted TDT for dose-addition = average of the higher and lower TDT values.d TDT of the mixture obtained in testing.
alcula
acodsic
odrimodcBslt
e Observed TDT minus predicted TDT.f Combined effect metric for dose addition at 45-min of exposure – see text for cg Bolded text used for emphasis.
t lower effect levels (see Fig. 3). This is predominantly due to thehemicals being tested having x/y curve slopes <3. When at leastne of the chemicals has a steeper slope of the x/y curve, the pre-icted dose-addition and independence curves will be more clearlyeparated [36 – see Figs. 3–5 therein]. Therefore it is not surpris-ng that some combinations resulted in mixture toxicity that wasonsistent with both models.
It is noted that on occasion the observed mixture toxicity willften be close to the predicted dose-addition (and/or indepen-ence) curve at lower effect levels but become gradually moreight-shifted from it at higher effect levels (see Figs. 3–4), therebyndicating mixture toxicity being less-than that predicted by the
odel at those points. The MX/DA and MX/I metrics were devel-ped to provide a means of recognizing this phenomenon when x/yata are not shown graphically. These metrics simply total the con-entration of chemical A and the relative concentration of chemical
in the mixture at the EC , EC and EC and divide them by the
25 50 75um of the concentrations of the chemicals at the same three effectevels for either the predicted dose-addition curve (i.e., MX/DA) orhe predicted independence curve (i.e., MX/I). For the CLAN-LINtion procedures.
combination, the 45-min EC50-AQ value was 1.01 but the MX/DAvalue for the mixture was 1.18. By examining Fig. 4 it can be seenthat the observed toxicity tracks well with the predicted dose-addition curve between 10 and 50% effect, but begins to be shiftedto the right of the dose-addition curve at higher effect levels. Asimilar response can be seen for the BRAN-DCLAN (dichloroace-tonitrile) combination but with the right-shift beginning at a lowereffect level (Fig. 3). While one may argue that it is at the lowereffect levels that one would be more likely to encounter chemicalconcentrations that could be environmentally relevant, the MX/DAmetric highlights combinations for which the mixture x/y curvedrifts away from the predicted dose-addition curve at some point,being thereby suggestive of a difference in mode of toxic actionbetween the chemicals. This, along with differences in slope val-ues, chemical potencies (i.e., 1/EC50) and TDT – have the potentialto be useful in predicting chemical mixture toxicity by mode oftoxic action; a primary intent of the studies being conducted in this
lab.
582 D.A. Dawson et al. / Toxicology R
Fig. 3. Concentration-effect curves for bromoacetonitrile (BRAN), dichloroacetoni-trile (DCLAN) and the BRAN-DCLAN mixture after 45-min of exposure, along withpredicted curves for dose-addition and independence. Mixture toxicity was less-than predicted for both combined effects models.
Fig. 4. Concentration-effect curves for chloroacetonitrile (CLAN), linalool (LIN) andthe CLAN-LIN mixture after 45-min of exposure, along with predicted curves fordba
4
(tv
ose-addition and independence. Mixture toxicity was consistent with the com-ined effects models at lower effect levels but was right-shifted from those modelsbove about 60% effect.
.4. TDT and combined effect
As noted above (Section 3.4), observed TDT minus predicted TDTi.e., TDTo-p) values were usually <10, thereby being consistent withhe previous finding that the average of the TDT values for the indi-idual chemicals in a binary mixture could be used to predict the
eports 3 (2016) 572–583
TDT of the mixture [28]. This conclusion is supported by TDTo-p
values for non-dose-additive combinations not being significantlydifferent from those for dose-additive combinations. It was noted,however, that for 22 of 25 combinations that had toxicity consis-tent with dose-addition via the MX/DA metric both chemicals inthe combination had individual TDT values >80%. In contrast, forcombinations that were not consistent with dose-addition only 2of the 42 had both chemicals with individual TDT values >80%. AsTDT is explained by irreversible action, chemicals with toxicity thatis fully time-dependent (i.e., TDT ≥100%) exert toxic effects that arefully irreversible, while those lacking TDT (i.e., TDT ≤0%) show onlyreversible toxic effects and those with TDT between 0 and 100%have toxicity that is partly irreversible and partly reversible. Fora chemical in the latter group, it is suggested that two (or more)modes of toxicity are being exerted within the range of chemicalconcentrations used in testing. Since in this study at least one of thechemicals in the mixture always had high TDT (i.e., >95%) furtherstudy is needed on combinations for which the chemicals includedin testing are limited to those having low (i.e., <20%) and/or middle(i.e., 20%–80%) range TDT values. The results of this study supportthe conclusion [28] that simply knowing the TDT of the individualchemicals in a mixture could be useful for predicting the combinedeffect.
5. Conclusions
Evaluation of TDT and combined effects for a series of mono-halogenated acetonitrile-containing mixtures suggests that therelative TDT level of the individual components is a factor inwhether the toxicity of the mixture is consistent with dose-additionor not. After 45-min of exposure the results showed that whenboth chemicals of the combination had individual TDT values >80%,toxicity of the mixture was more likely to be consistent with thatpredicted for dose-addition (i.e., >85% frequency). In contrast whenone chemical of the combination had a TDT value >80% and the sec-ond chemical had a TDT value <80%, the combined effect was morelikely to be less toxic than predicted by the dose-addition model(i.e., >90% frequency). In this study, at least one chemical of thecombination always had a TDT value greater than 80%. There is aneed for additional mixture testing in which both chemicals thathave low TDT (i.e., <20%) to mid-range TDT values (i.e., 20–80%).Mixture toxicity analyses that incorporate differences in x/y curveslopes and chemical potencies, in addition to TDT data, offer theopportunity to improve prediction of chemical mixture toxicity.
Conflict of interest
Nothing to declare.
Transparency document
The Transparency document associated with this article can befound in the online version.
Acknowledgements
The data obtained in this study arose from grants R15ES08019-03 and R15 ES08019-04 from the National Institute ofEnvironmental Health Sciences (NIEHS), National Institutes ofHealth (NIH). The contents are solely the responsibility of the inves-tigators and do not represent the official views of NIEHS, NIH.
References
[1] S. Goel, J.A. Evans-Johnson, N.J. Georgieva, G. Boysen, Exposure profiling ofreactive compounds in complex mixtures, Toxicology 313 (2013) 145–150.

logy R
[
[
[
[
[
[
[
[
[
[
[
[
[
[
[
[
[
[
[
[
[
[
[
[
[
[
D.A. Dawson et al. / Toxico
[2] X. Zou, X. Zhou, Z. Lin, Z. Deng, D. Yin, A docking-based receptor library ofantibiotics and its novel application in predicting chronic mixture toxicity forenvironmental risk assessment, Environ. Monit. Assess. 185 (2013)4513–4527.
[3] R. Altenburger, S. Scholz, M. Schmitt-Jansen, W. Busch, B.I. Escher, Mixturetoxicity revisited from a toxicogenomic perspective, Environ. Sci. Technol. 46(2012) 2508–2522.
[4] D. Alsop, C.M. Wood, Metal and pharmaceutical mixtures: is ion loss themechanism underlying acute toxicity and widespread additive toxicity inzebrafish? Aquat. Toxicol. 0140–0141 (2013) 257–267.
[5] P.R. Jacobsen, M. Axelstad, J. Boberg, L.K. Isling, S. Christiansen, K.R. Mandrup,L.O. Berthelsen, A.M. Vinggaard, U. Hass, Persistent developmental toxicity inrat offspring after low dose exposure to a mixture of endocrine disruptingpesticides, Reprod. Toxicol. 34 (2012) 237–250.
[6] T.F. Webster, Mixtures of endocrine disruptors: how similar mustmechanisms be for concentration addition to apply, Toxicology 313 (2013)94–102.
[7] N.R. Lynch, T.C. Hoang, T.E. O’Brien, Acute toxicity of binary-metal mixtures ofcopper zinc, and nickel to Pimephales promelas: evidence ofmore-than-additive effect, Environ. Toxicol. Chem. 35 (2016) 446–457.
[8] N. Cedergreen, H. Sorensen, C. Svendsen, Can the joint effect of ternarymixtures be predicted from binary mixture toxicity results? Sci. TotalEnviron. 427/428 (2012) 229–237.
[9] C. Garcia-Canton, A. Anadon, C. Meredith, Genotoxicity evaluation ofindividual cigarette smoke toxicants using the in vitro �H2AX assay by highcontent screening, Toxicol. Lett. 223 (2013) 81–87.
10] L.S. Balistrieri, C.A. Mebane, Predicting the toxicity of metal mixtures, Sci.Total Environ. 466/467 (2014) 788–799.
11] N. Abdo, B.A. Wetmore, G.A. Chappell, D. Shea, F.A. Wright, I. Rusyn, In vitroscreening for population variability in toxicity of pesticide-containingmixtures, Environ. Int. 85 (2015) 147–155.
12] P.F. Landrum, P.M. Chapman, J. Neff, D.S. Page, Evaluating the aquatic toxicityof complex organic chemical mixtures: lessons learned from polycyclicaromatic hydrocarbon and petroleum hydrocarbon case studies, Integr.Environ. Assess. Manage. 8 (2012) 217–230.
13] L.H. Nowell, J.E. Norman, P.W. Moran, J.D. Martin, W.W. Stone, Pesticidetoxicity index—a tool for assessing potential toxicity of pesticide mixtures tofreshwater aquatic organisms, Sci. Total Environ. 476–477 (2014) 144–157.
14] J.Y.M. Tang, S. McCarty, E. Glenn, P.A. Neale, M. St. J. Warne, B.I. Escher,Mixture effects of organic micropollutants present in water: towards thedevelopment of effect-based water quality trigger values for baseline toxicity,Water Res. 47 (2013) 3300–3314.
15] S.E. Allan, B.W. Smith, R.L. Tanguay, K.A. Anderson, Bridging environmentalmixtures and toxic effects, Environ. Toxicol. Chem. 31 (2012) 2877–2887.
16] R. Altenburger, T. Backhaus, W. Boedeker, M. Faust, M. Scholze, Simplifyingcomplexity: Mixture toxicity assessment in the last 20 years, Environ. Toxicol.Chem. 32 (2013) 1685–1687.
17] R.C. Hertzberg, Y. Pan, R. Li, L.T. Haber, R.H. Lyles, D.W. Herr, V.C. Moser, J.E.Simmons, A four-step approach to evaluate mixtures for consistency withdose addition, Toxicology 313 (2013) 133–144.
18] Y. Liu, M.G. Vijver, H. Qiu, J. Baas, W.J.G.M. Peijnenburg, Statistically
significant deviations from additivity: what do they mean in assessing toxicityof mixtures? Ecotox. Environ. Saf. 122 (2015) 37–44.19] K.E.C. Smith, S.N. Schmidt, N. Dom, R. Blust, M. Holmstrup, P. Mayer, Baselinetoxic mixtures of non-toxic chemicals: solubility addition increases exposurefor solid hydrophobic chemicals, Environ. Sci. Technol. 47 (2013) 2026–2033.
[
eports 3 (2016) 572–583 583
20] A.P. Toropova, A.A. Toropov, E. Benfenati, G. Gini, D. Leszczynska, J.Leszczynski, CORAL. Models of toxicity of binary mixtures, Chemomet. Intell.Lab. Syst. 119 (2012) 39–43.
21] D.A. Dawson, G. Pöch, T.W. Schultz, Chemical mixture toxicity testing withVibrio fischeri: combined effects of binary mixtures for ten soft electrophiles,Ecotox. Environ. Saf. 65 (2006) 171–180.
22] E.M. Gagan, M.W. Hull, T.W. Schultz, G. Pöch, D.A. Dawson, Time dependencein mixture toxicity with soft electrophiles: 1 Combined effects of selectedSN2- and SNAr-reactive agents with a nonpolar narcotic, Arch. Environ.Contam. Toxicol. 52 (2007) 283–293.
23] D.A. Dawson, J.L. Allen, T.W. Schultz, G. Pöch, Time-dependence in mixturetoxicity with soft electrophiles: 2. Effects of relative reactivity level ontime-dependent toxicity and combined effects for selected Michael acceptors,J. Environ. Sci. Health Part A 43 (2008) 43–52.
24] D.A. Dawson, J. Jeyaratnam, T. Mooneyham, G. Pöch, T.W. Schultz, Mixturetoxicity of SN2-reactive soft electrophiles: 1. Evaluation of mixturescontaining �-halogenated acetonitriles, Arch. Environ. Contam. Toxicol. 59(2010) 532–541.
25] D.A. Dawson, T. Mooneyham, J. Jeyaratnam, T.W. Schultz, G. Pöch, Mixturetoxicity of SN2-reactive soft electrophiles: 2. Evaluation of mixturescontaining ethyl �-halogenated acetates, Arch. Environ. Contam. Toxicol. 61(2011) 547–557.
26] D.A. Dawson, G. Pöch, T.W. Schultz, Mixture toxicity of SN2-reactive softelectrophiles: 3. Evaluation of ethyl �-halogenated acetates with�-halogenated acetonitriles, Arch. Environ. Contam. Toxicol. 66 (2014)248–258.
27] D.A. Dawson, N. Genco, H.M. Bensinger, D. Guinn, Z.J. Il’Giovine, T.W. Schultz,G. Pöch, Evaluation of an asymmetry parameter for curve-fitting insingle-chemical and mixture toxicity assessment, Toxicology 292 (2012)156–161.
28] D.A. Dawson, E.M.G. Allen, J.L. Allen, H.J. Baumann, H.M. Bensinger, N. Genco,D. Guinn, M.W. Hull, Z.J. Il’Giovine, C.M. Kaminski, J.R. Peyton, T.W. Schultz, G.Pöch, Time-dependence in mixture toxicity prediction, Toxicology 326 (2014)153–163.
29] H. Urbanczyk, J.C. Ast, M.J. Higgins, J. Carson, P.V. Dunlap, Reclassification ofVibrio fischeri, Vibrio logei, Vibrio salmonicida and Vibrio wodanis as Aliivibriofischeri gen. nov., comb. nov., Aliivibrio logei comb. nov., Aliivibrio salmonicidacomb. nov. and Aliivibrio wodanis comb. nov, Int. J. Syst. Evol. Microbiol. 57(2007) 2823–2829.
30] F. Haber, Zur geschichte des gaskrieges, in: Fünf Vorträge aus den Jahren1920–1923, Springer, 1924, pp. 76–92.
31] C.I. Bliss, The toxicity of poisons applied jointly, Ann. Appl. Biol. 26 (1939)585–615.
32] G. Pöch, Combined Effects of Drugs and Toxic Agents: Modern Evaluation inTheory and Practice, Springer, New York, 1993.
33] R.G.D. Steel, J.H. Torrie, Principles and Procedures of Statistics: A BiometricalApproach, 2nd ed., McGraw-Hill, New York, 1980.
34] B.R. Parkhurst, W. Warren-Hicks, L.E. Noel, Performance characteristics ofeffluent toxicity tests: summarization and evaluation of data, Environ.Toxicol. Chem. 11 (1992) 771–791.
35] J.A. Bantle, D.T. Burton, D.A. Dawson, J.N. Dumont, R.A. Finch, D.J. Fort, G.Linder, J.R. Rayburn, D. Buchwalter, M.A. Maurice, S.D. Turley, Initialinterlaboratory validation study of FETAX: phase I testing, J. Appl. Toxicol. 14
(1994) 213–223.36] D.A. Dawson, B.D. Scott, M.J. Ellenberger, G. Pöch, A.C. Rinaldi, Evaluation ofdose-response curve analysis in delineating shared or different molecularsites of action for osteolathyrogens, Environ. Toxicol. Pharmacol. 16 (2004)13–23.